1. Introduction
There is a growing worrying tendency, particularly in emerging economies, for people to favor private instead of public means of transport, as reported by Batty et al. [
1] and Stead and Pojani [
2]. Many governments are actively looking at ways to improve security, safety, and quality of service to encourage public transport patronage, for example, in multimodal forms combined with private transport, in Carrol et al. [
3]. An important part of those efforts is to provide transport infrastructure that is both comfortable to users and that provides fast transit times. Railway-based systems (such as metros, trains, trams) have the advantage (over buses and other road-based transport means) of having dedicated tracks where they can travel at the highest possible speeds that signaling and network traffic would allow. Nevertheless, what limits their effective throughput are the points at which passengers need to transfer from/to the vehicles. There are physical parameters that determine the limits of people flow at these transfer points, hence the “dwell times”, i.e., the amount of time that a vehicle needs to be stationary to allow people to board/alight. Examples of such factors are door widths, space (horizontal and vertical “gaps”) between train and platform, payment procedures (e.g., cash or cashless), position of handrails inside the train, floor materials, etc. Some of these factors can be altered during transport operations while some need to be defined when vehicles are manufactured and stations designed. What effect these factors have on passenger flows also depend on cultural factors. Similar considerations exist for Bus Rapid Transit systems and conventional buses that compete for road space with private traffic leading to lower speeds, as studied by Saleh and Ziółkowski [
4]. Dedicated bus lanes is a popular way to improve bus services, but they involve the need to enforce against misuse by private vehicles, as discussed by Shalaby [
5] and Agrawal et al. [
6], for which computer vision-based systems and other technologies have been deployed in many countries, but there are still challenges especially in developing countries as exemplified in studies by Nguyen et al. [
7] and Malomo [
8]. Therefore, to make public transport networks more attractive, transport engineers would like to adjust physical factors (both at design and operational times) to optimize quality of service and revenues. To do this, they need to understand, and ultimately model, passenger behavior in relation to those factors. Although such studies are possible by direct observation in operational conditions, not all possible alternatives can be investigated (e.g., in an existing metro or bus system, doors or gaps cannot be easily modified). It is also difficult to construct realistic computer-based simulation models if the underlying relationships between behavior and physical environment are poorly known. This is where full-size models, using real people, can help for studying their responses to changes in physical configurations. Although some may argue that it is not possible to replicate operational conditions even with full-size models, because human participants might be aware that they are in an experiment under observation, Fernandez et al. [
9] have shown that after an initial period of getting used to an experimental set-up, participants behave in similar ways as they would do under normal conditions.
A typical scenario is the design of metro carriages. There is always a trade-off between passenger comfort and service efficiency, particularly during stop times at stations. In an extreme case, it might be more “efficient” not to have any seats inside a train, but this would be unacceptable to most people. In more practical cases, for many modern trains, such as those serving airports, comfort and safety is important for those carrying heavy luggage and also for those with reduced mobility like the disabled or the elderly. Therefore, how easily, quickly and safely may people board/alight from a train/bus is an interesting matter to study, for example, to determine an appropriate door width and other physical characteristics, to minimize dwell times. Such research increasingly uses video-based observation either in operational conditions or, more likely, e.g., due to privacy concerns, using controlled experiments in simulated environments. One limitation with this approach is that researchers have to spend many hours of valuable time reviewing and annotating the video material, e.g., to count the numbers of people boarding/alighting under the different conditions in their experiments, such as door widths, step height, platform width, passenger mobility, gender, and so on.
Most public transport systems in the world have invested significantly on CCTV (Closed Circuit Television) systems to improve security and safety. The same infrastructure can be used to make measurements to improve quality of service, but the large amounts of video data can lead to human overload and reduced effectiveness.
CCTV systems have largely been designed for human observation. In the last two decades, there have been significant improvements on the camera sensors, in terms of image quality and resolution, and on the digital infrastructure to transmit and store video data. Nevertheless, with the possible exception of Automatic Number Plate Recognition (ANPR) for speed control (e.g., see Ziółkowski [
10]) and to analyze passenger and freight movements, as discussed by Hadavi et al. [
11], the analysis of the video data of CCTV systems in public transport networks has remained largely based on manual analysis, mostly because of the challenges posed by localizing people, their motions, and, ultimately, their behavior in realistic scenarios. More recently, however, there have been major scientific and technological improvements in computer vision, led by intelligent sensors that use deep-learning methods and that can offer a way forward. Therefore, this paper explores whether such methods can achieve reasonable results in the analysis of people boarding and alighting from a public transport vehicle, thus allowing transport researchers to conduct a larger number of experiments in shorter times.
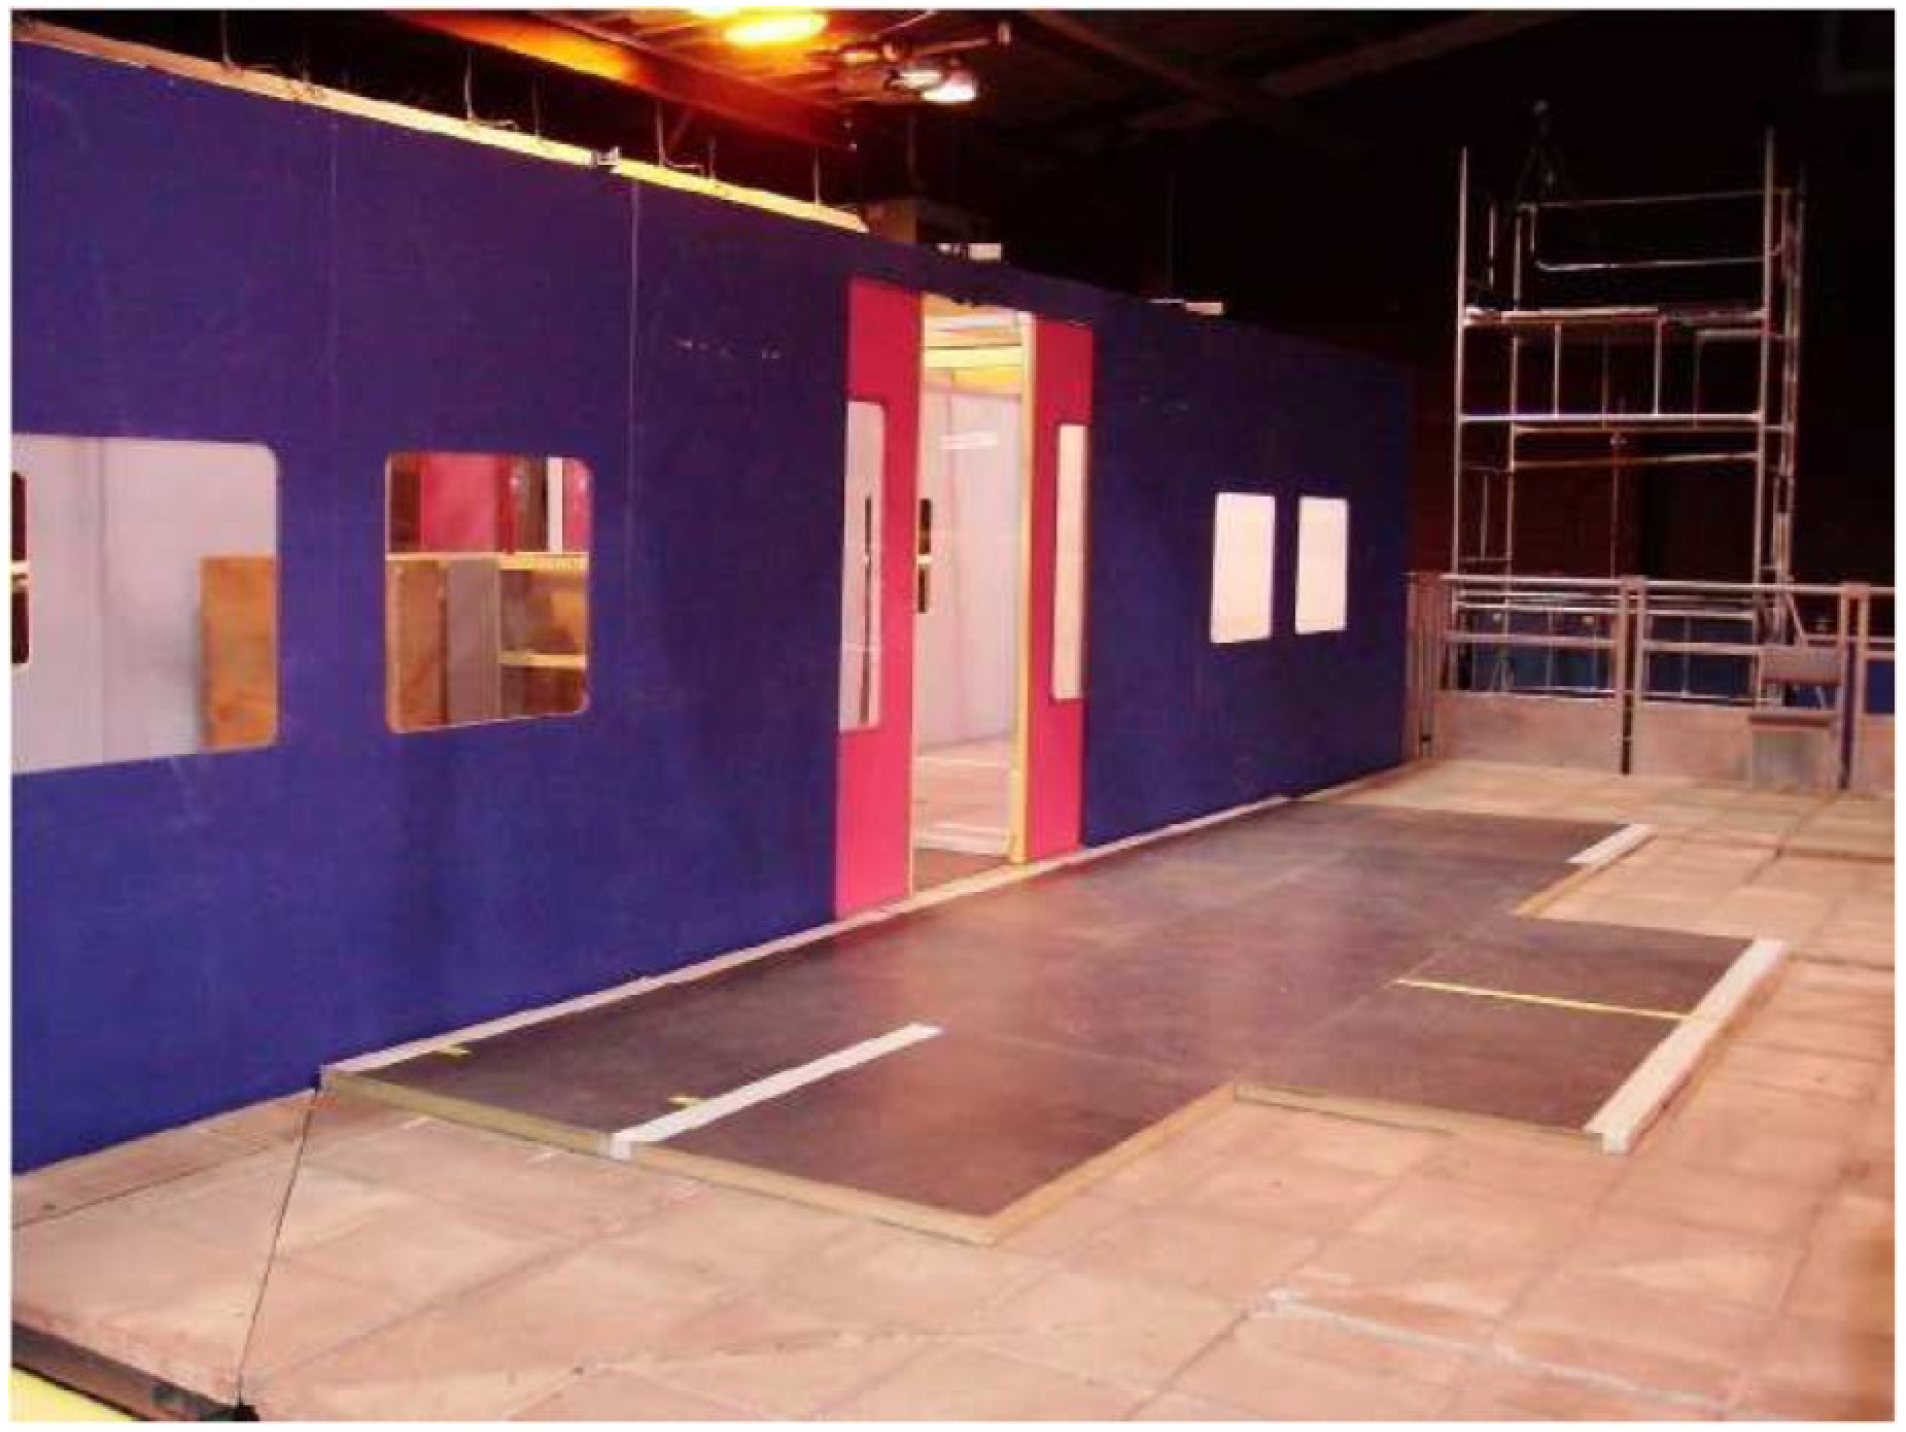
In this work, real-scale laboratory experiments have been undertaken in the Pedestrian Accessibility Movement Environment Laboratory (PAMELA) of University College London, to test layouts of platforms and vehicles at full-size public transport vehicle. The original aspect of this work is the real-scale laboratory experimentation as a research method, which aims to evaluate the responses of passengers to different configurations which can then be implemented in vehicles and stations to improve operations. Experimental variables are based on observations at public transport systems, such as Transantiago (the Transport System of Santiago de Chile), London Underground, and the public literature in the field.
The experiments involved ordinary people getting on and off a real-scale mock-up of a vehicle that were studied to obtain people counts and the times taken to board/alight. Four variables were studied, following earlier work by Fernandez et al. [
9]: the fare collection method, the vertical gap, vertical distance between the platform and the vehicle, and the width of the doors and the passenger density inside the vehicle.
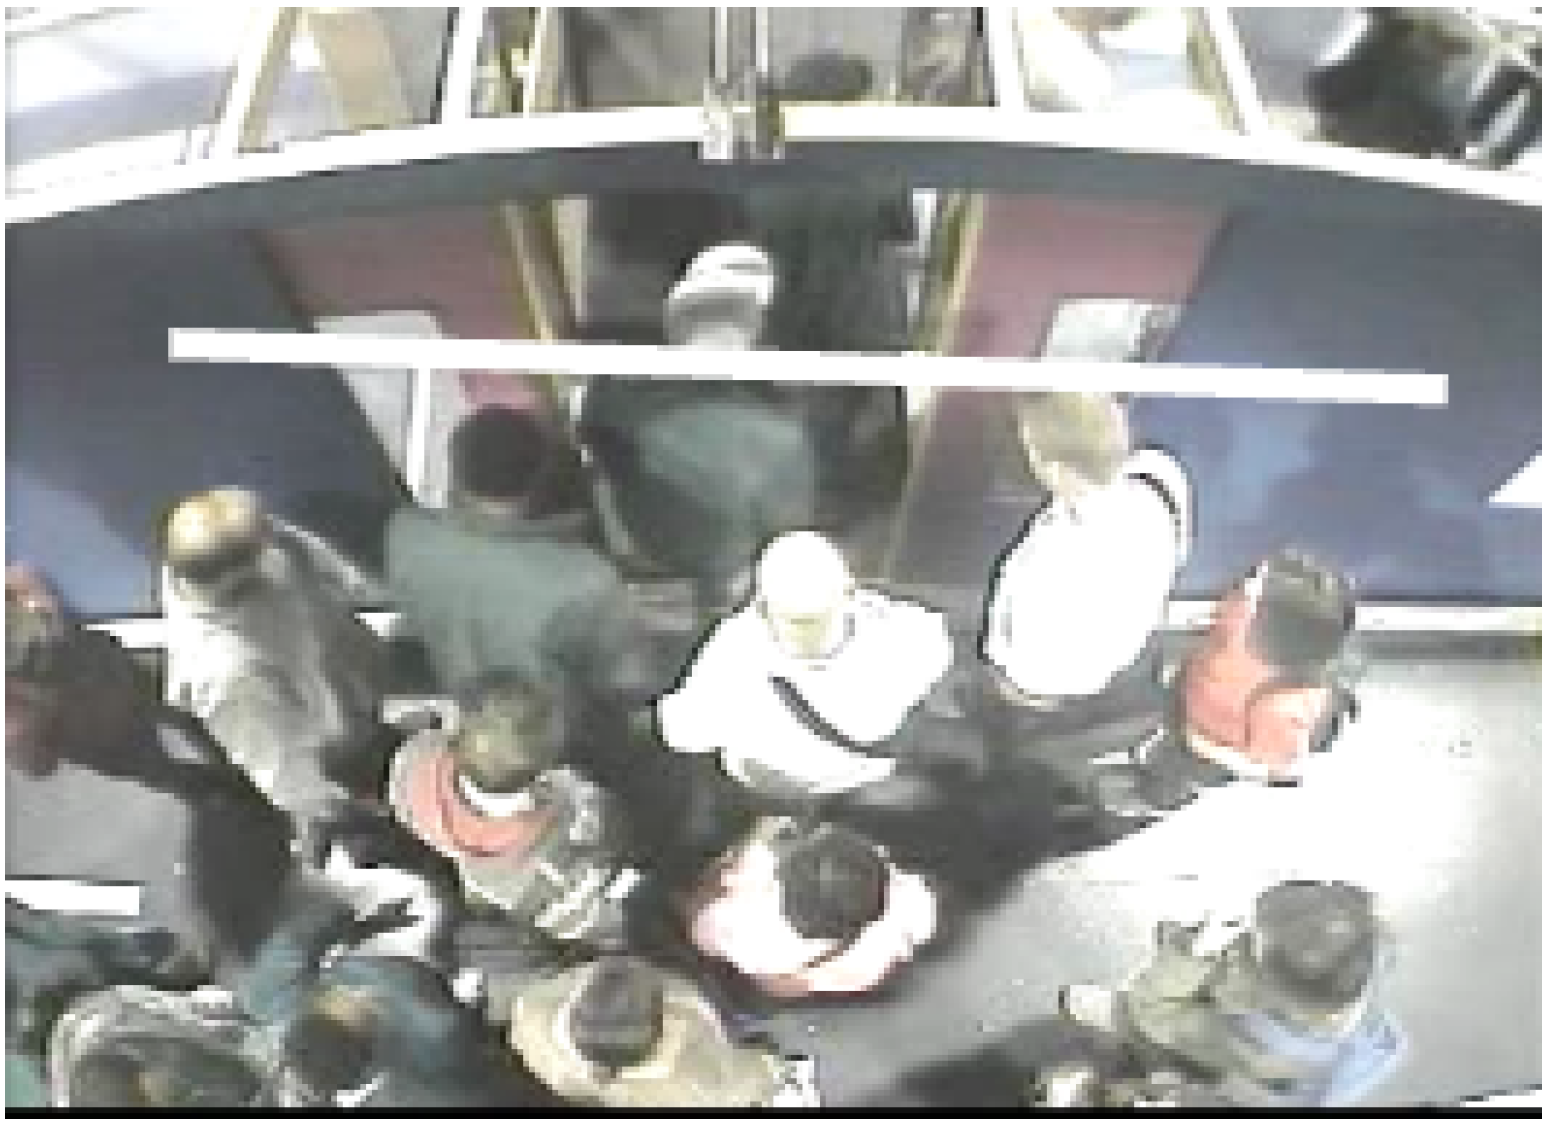
Figure 1 shows the experimental set-up in which door width and vertical gap was studied.
The main contributions in this paper are:
A new video dataset of 348 sequences captured by a standard CCTV-type camera is made publicly available. The dataset involves ordinary people boarding/alighting into/from a full-size model of a metropolitan railway carriage under different settings of door widths, step heights and payment method. Counts of people going in/out through the doors are provided for all videos. A small subset of videos has been manually annotated locating and tracking each person’s head, to allow training and testing people detectors.
With the publication of a dataset, a baseline is established here, as up to now it has not been possible to compare different approaches that use proprietary data. It is hoped that other researchers will now be able to replicate and improve upon these results.
Three deep learning object detectors (EspiNet, Faster-RCNN, and Yolov3) are evaluated, reaching an F1 close to 90% for the best one. Please see Equation (
1) (
Section 2) below for a definition of F1.
Three benchmark trackers Markov Decision Processes (MDP), SORT, and D-SORT) are evaluated, demonstrating a competitive MOTA (Multi Object Tracking Accuracy) of around 80%. Please see Equation (
2) (
Section 2) below for a definition of MOTA.
Counts of people are computed for 322 video sequences, obtaining an F1 above 95%
The paper is organized as follows.
Section 2 defines the main metrics used in this work.
Section 3 highlights some relevant work on image analysis.
Section 4 describes the new PAMELA-UANDES dataset (The dataset can be found on
http://videodatasets.org/PAMELA-UANDES/). We think that this is a useful and realistic set of data for people working in this area and for which, to the best of our knowledge, there is no clear alternative and that it is hoped will help researchers to identify the state-of-the-art in this field.
Section 5 presents baseline results on people detection, tracking and counting obtained using computer vision for this dataset so that future researchers can report improved results. Finally,
Section 6 and
Section 7 conclude the paper.
2. Metrics
Detection performance evaluation is carried out using a standard and well-known set of metrics, such as those proposed by Yin et al. [
13] and the VOCchallenge [
14]. To determine what are true positive, false positive, and false negative detections (
TP,
FP,
FN), a Jaccard similarity coefficient (also known as Intersection over Union-
IoU) of 50% is used. So, a true positive occurs when a detection object (
D) has an
IoU > 0.5 with a ground truth (
GT) object, a false positive occurs when a detection does not have an
IoU > 0.5 with any
GT object and a false negative occurs when a
GT object does not have a corresponding detection object. Then,
where
TP is the total number of true positives,
FP the total number of false positives, and
FN the total number of false negatives.
F1 is sometimes known as F-score or F-Measure; please see Rennie [
15]. Mean average precision (mAP) is the mean of precision over the recall range, and it is also a common metric used for detection and classification problems. All the measures defined in Equation (
1) are in the range (0…1).
An almost bewildering large number of tracking metrics have been proposed in the past. Here, the MOT (Multiple Object Tracking) Challenge [
16] benchmark definitions are used to obtain different metrics. For simplicity, precision, recall,
F1 and
MOTA (Multi Object Tracking Accuracy) defined in Bernardin, and Stiefelhagen [
17] have been used. In the context of the MOT challenge, precision, recall and F1 refer to object detection metrics, computed as in Equation (
1), after tracking and so they test the effect of tracking on object detection. MOTA is a measure that tries to combined various errors that arise in tracking and is defined as,
where
and
are the number of misses, false positives, and mismatches, divided by the total number of ground truth annotations for time
t, respectively. The higher the score the better the results.
4. PAMELA-UANDES Dataset
The Pedestrian Accessibility Movement Environment Laboratory (PAMELA) [
69] is a multi-sensor facility at University College London (UCL) in the UK, designed for the assessment of pedestrian movement in many application domains (transport, health, architecture, etc.). An interesting characteristic of PAMELA is that it is possible to shape its environment (walls, walking surfaces, lighting, sound) to suit the experiments. The walking area consists of individual 1.2 m
2 modules making up a total of 80 m
2. Some examples are shown in
Figure 4.
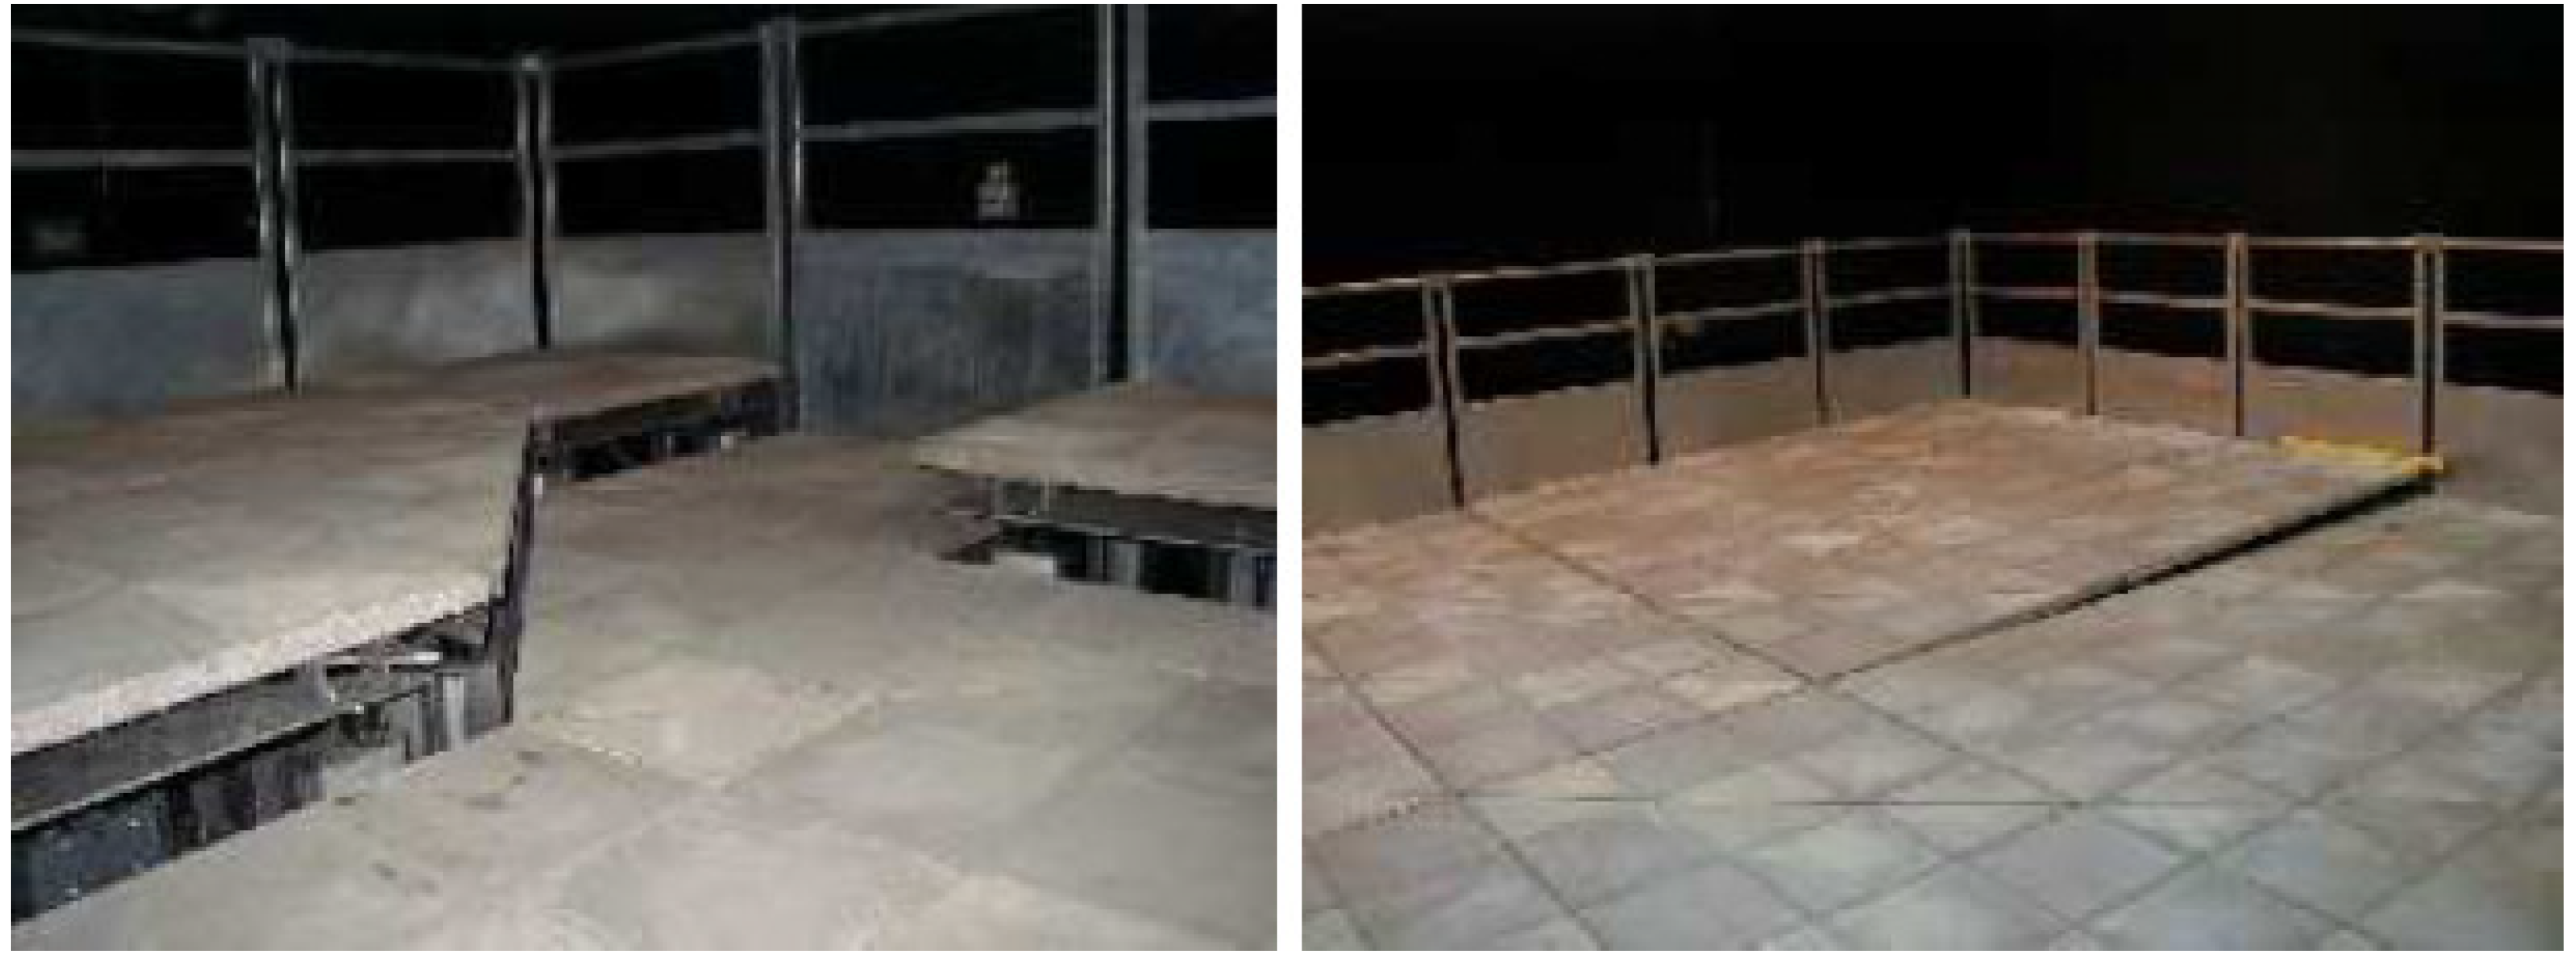
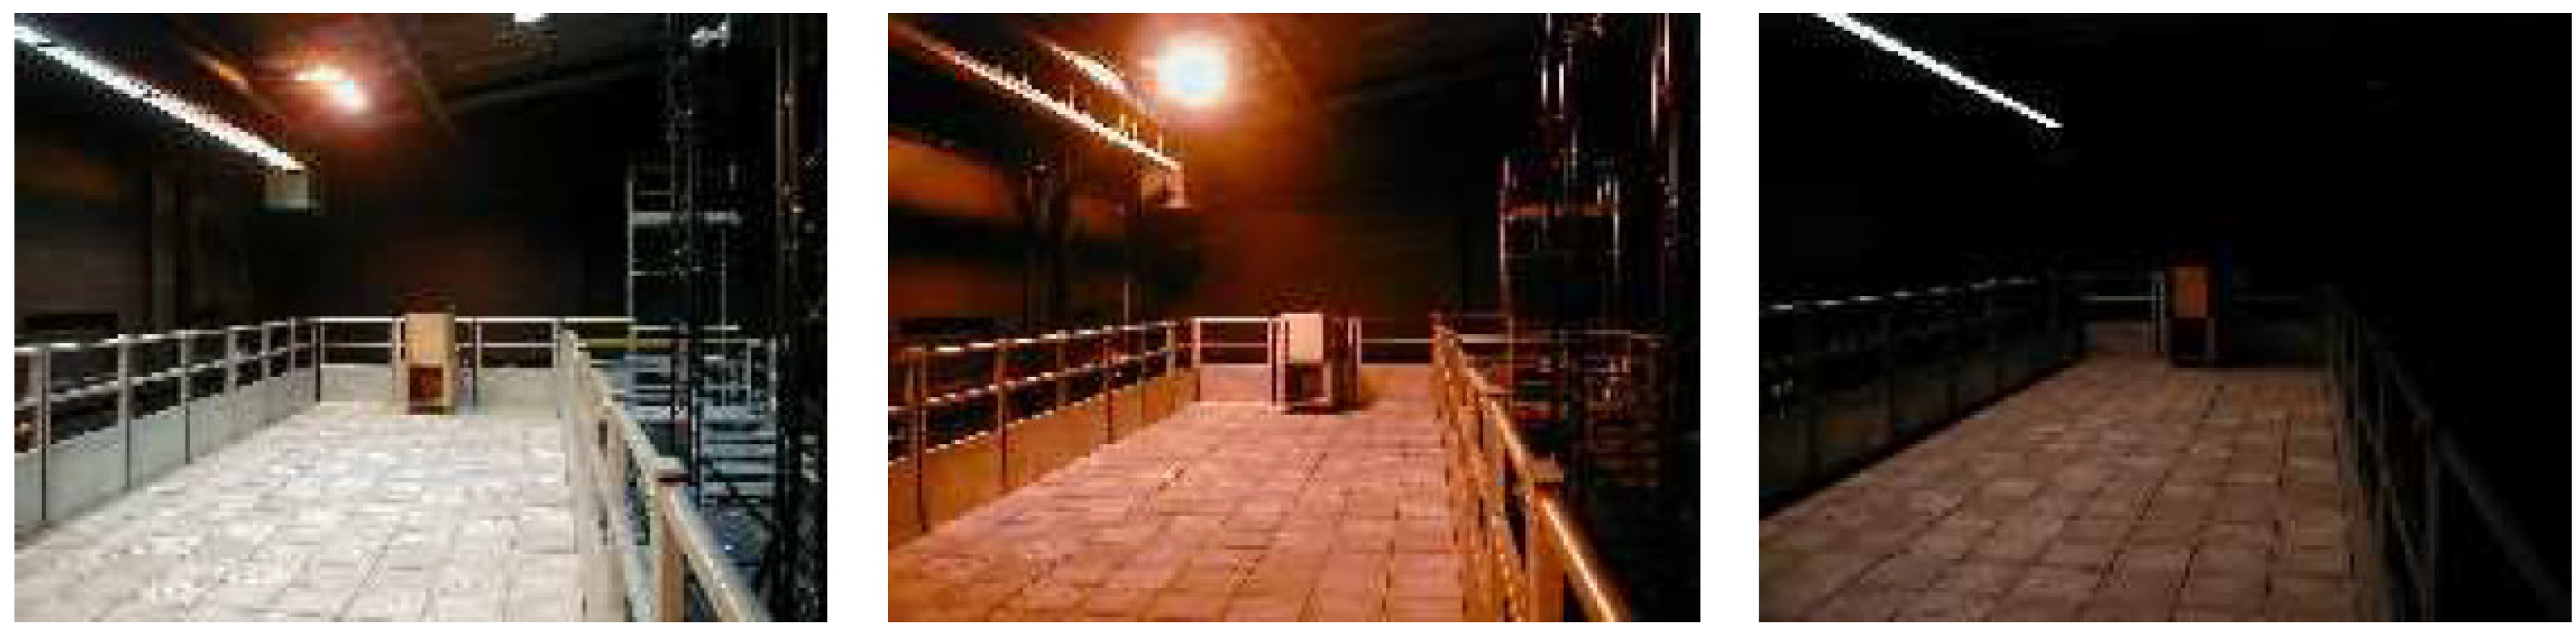
In terms of lighting, the facility provides control over a wide range of situations from simulation of daylight to moonlight (
Figure 5). Video recordings can be made simultaneously from various angles (typically with 8 or more cameras). Note, however, that these cameras are not synchronized nor calibrated.
The video recordings for the dataset used in this work were obtained from a simulated scenario of a London Underground train as first reported by Fernandez et al. [
12], covering two door widths (800 and 1600 mm), three step heights (0, 150, and 300 mm), and, in the case of boarding, whether people used a card-based payment system (as per buses) or none (as per trains).
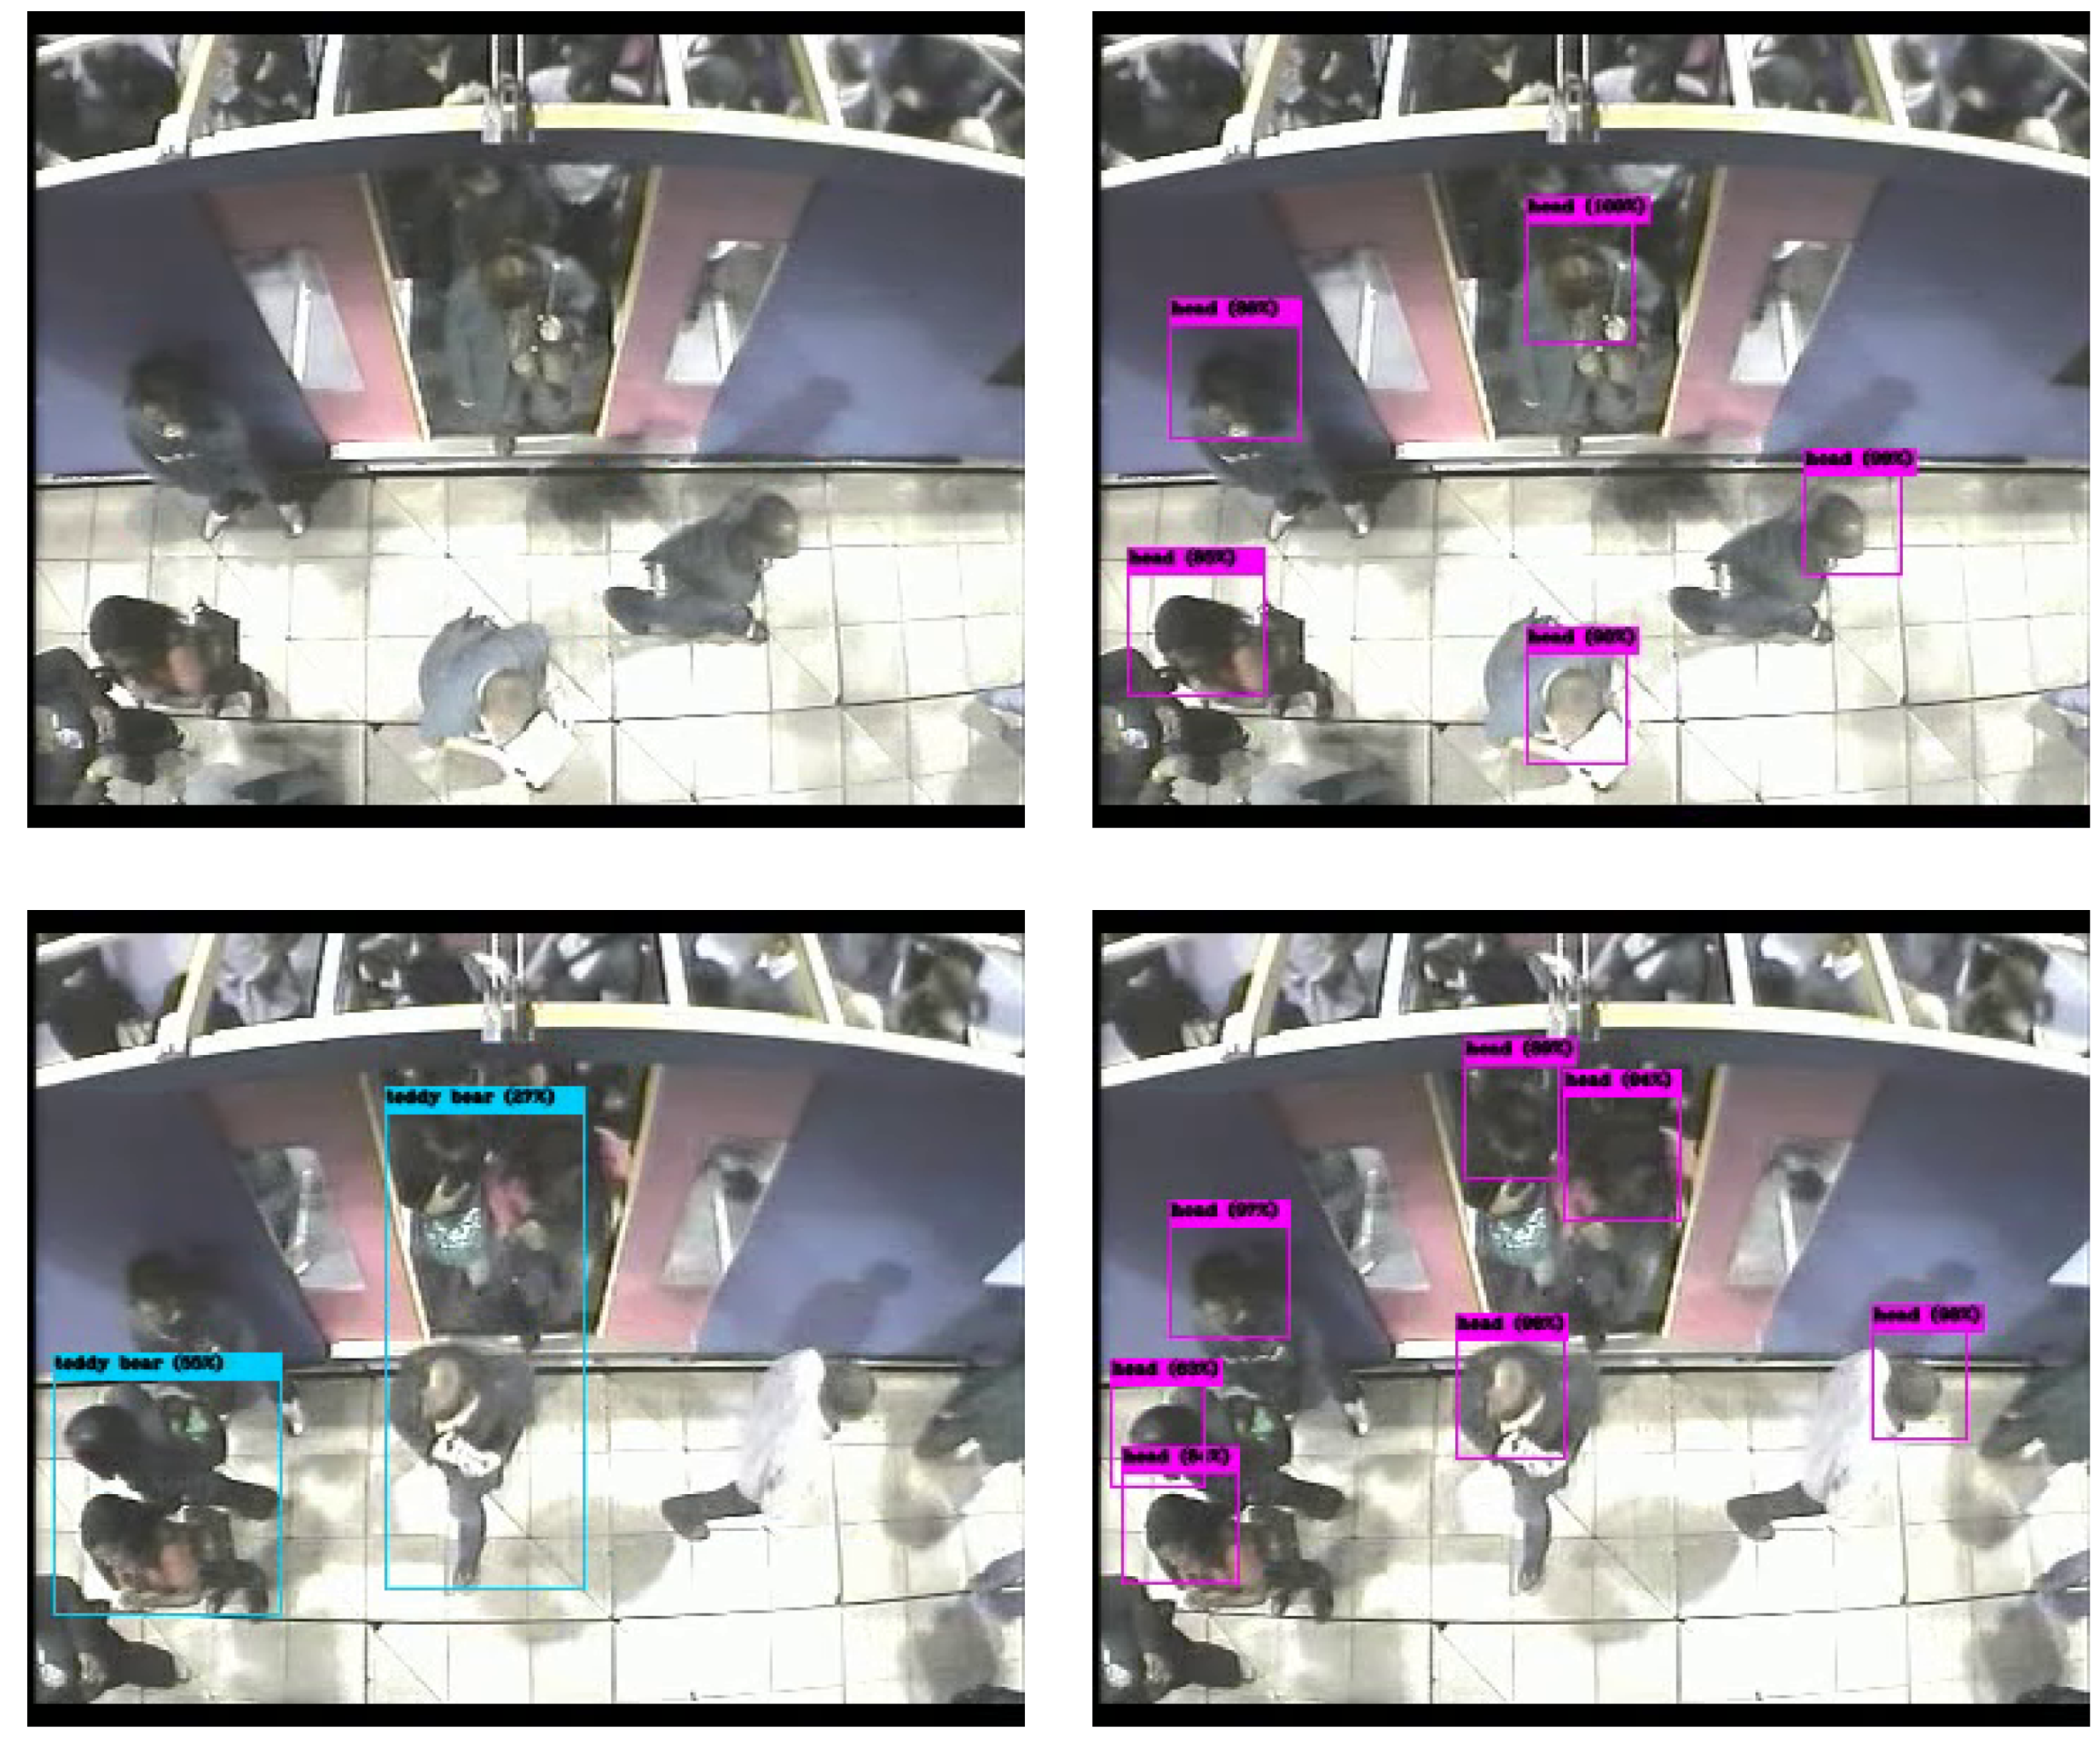
Given the angle of the camera (please see
Figure 3), the working hypothesis is that head shapes are discriminating enough, and once people are located they could be tracked from frame to frame to lead to measurements of counts and flows.
Part of the PAMELA-UANDES dataset has been manually annotated, using the ViPERtool [
70], so as to investigate computer vision algorithms to automate the process of analyzing such images. Manual annotation is a major task as it took about 2 full person-months to annotate a relatively small subset that consists of 15 video sequences: 8 of people alighting (referred to as “A” videos) and 7 of people boarding (referred to as “B” videos). They last between 1 and 2 min and have a spatial resolution of 352 × 288 at 25 frames per second. The spatial resolution is set by the capturing process that consisted of standard interlaced PAL frames, so 325 × 288 was chosen to avoid interlaced effects and to maintain the width/height ratio.
Videos A_d800mm_R1..4.mpg and B_No_d800mm_R1..4.mpg are used for training while A_d800mm_R5..8.mpg and B_No_d800mm_R5..7.mpg are used for testing. Ground truth files are in ViPER and CSV formats containing, for each pedestrian, a unique identifier, the bounding box around their heads, and the frame numbers in which they appear.
5. Experiments
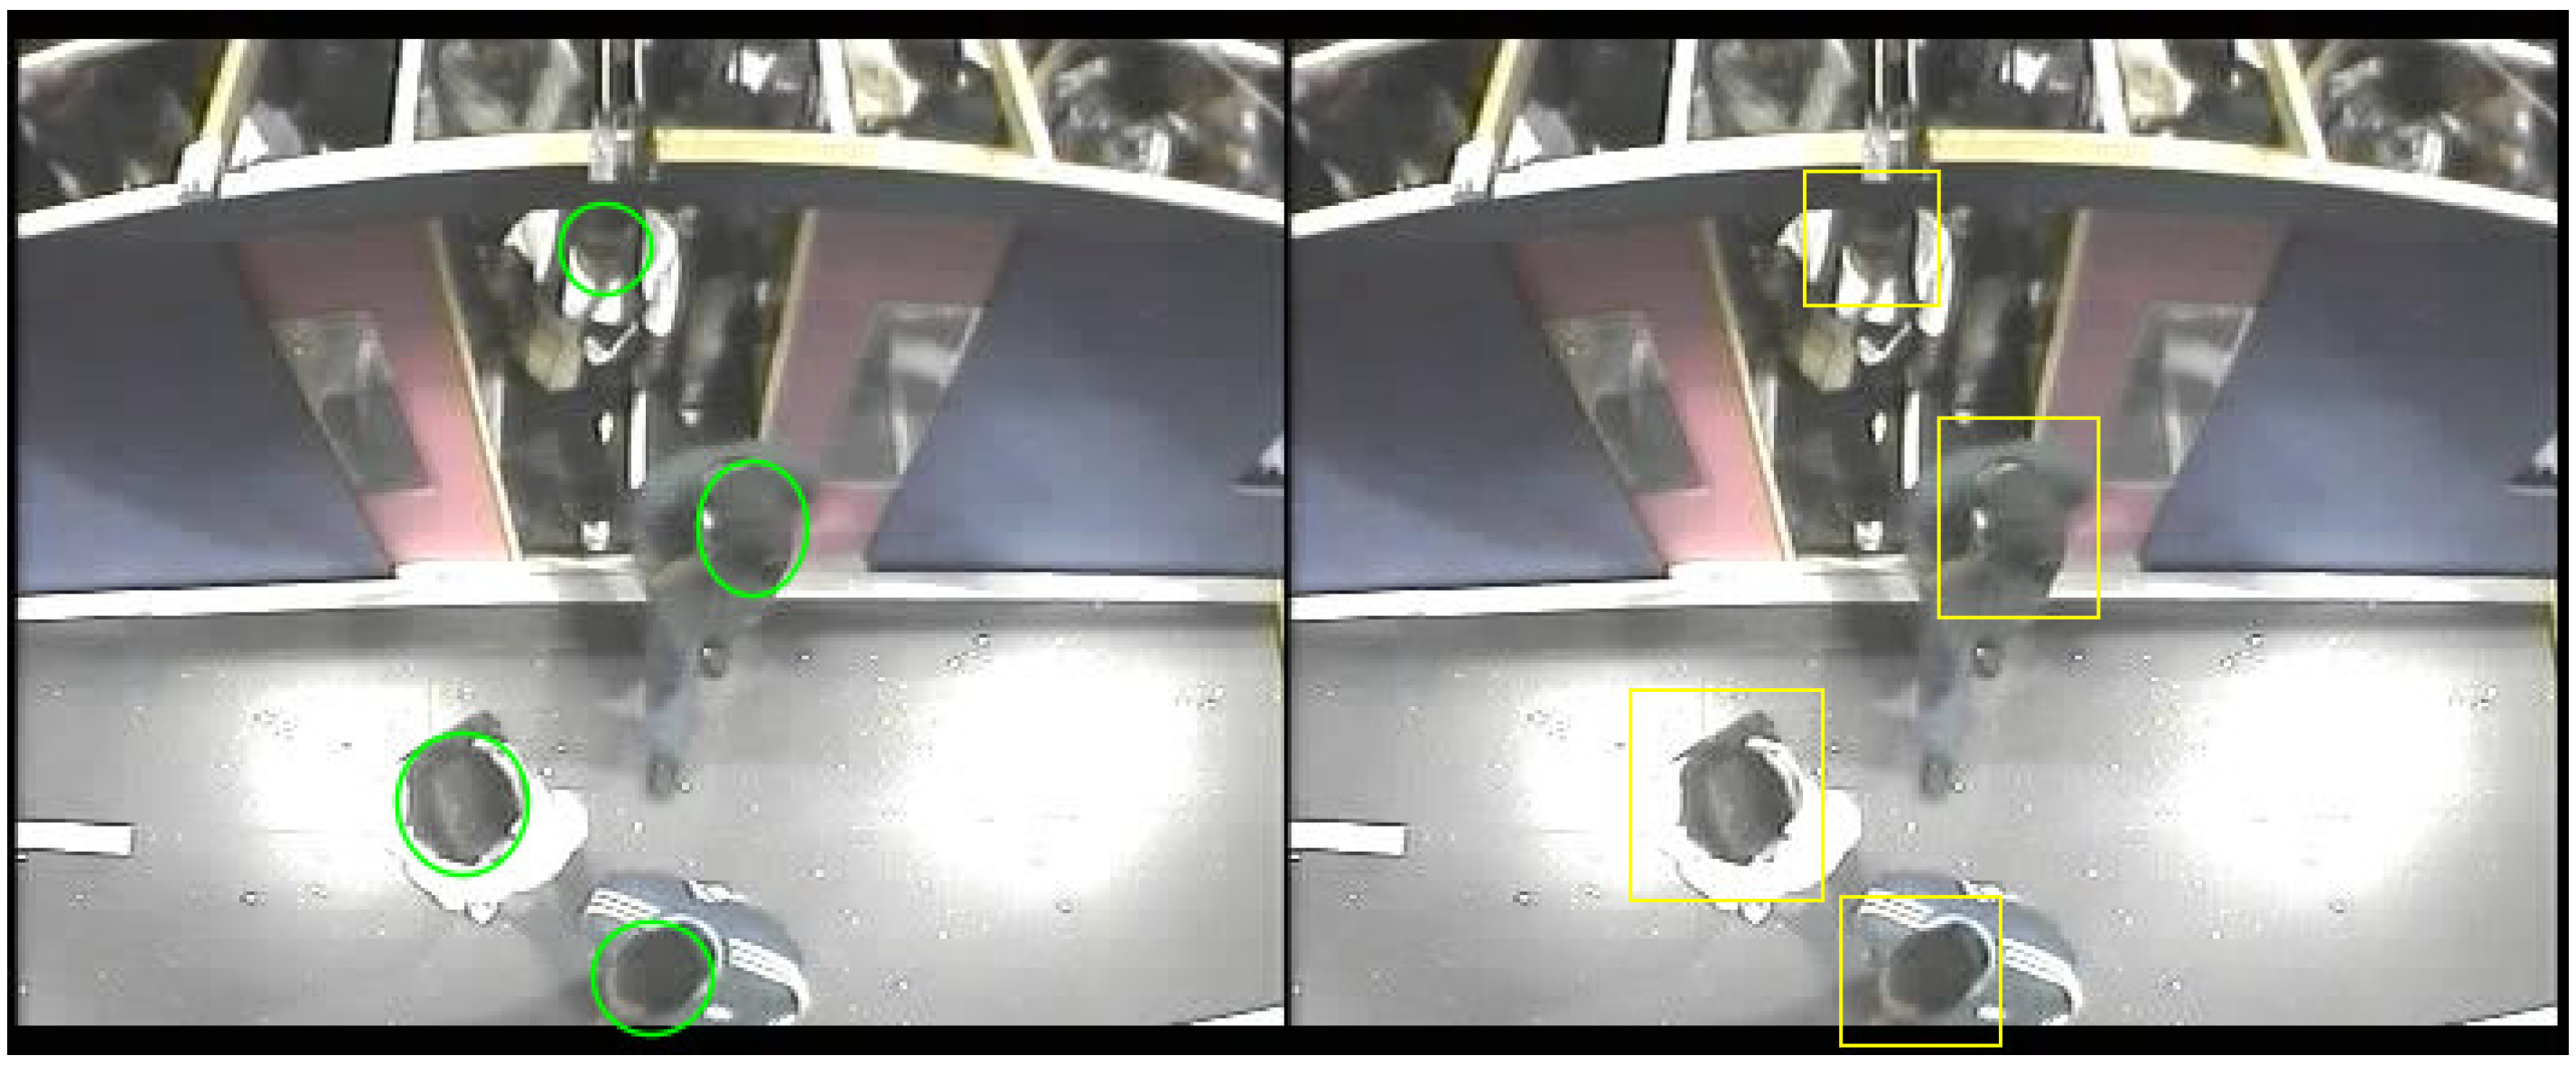
The PAMELA-UANDES dataset contains a total of 14,834 training images and 13,237 testing images. In both cases, boarding and alighting cases are more or less similar in number. As seen on the left of
Figure 6, the original annotation consists of image coordinates of an ellipse defined by an enclosing rectangle (
,
,
w,
h), where
,
are its top left
x and
y co-ordinates, and
w,
h are width and height. Following the literature, e.g., Wolf et al. [
71] and Dalal et al. [
24], it is also hypothesized here that expanding the ground truth bounding box to include part of the background context may help detection. The new bounding box is computed as:
where (
,
) is the (unchanged) object’s centroid,
f is the expansion factor (in the range 0..1), (
,
) the new (expanded) width and height, and
is the expanded object’s bounding box. The effect is illustrated on the right of
Figure 6.
The models were trained from scratch, without using any pre-trained model (such as ImageNet) for a fairer comparison. For the same reason, please note that anchors have not been optimized nor data augmentation used. EspiNetV2 took 12 h to train (Windows), Faster R-CNN 18 h (Windows), and Yolov3 14 h (Ubuntu). An Nvidia Titan XP GPU is used for training and testing. Detection performance evaluation is carried out using the metrics defined by Equation (
1) (
Section 2).
5.1. Detection Results
The detection performances of the three models are evaluated and compared on the 13,238 unseen examples more or less balanced between boarding and alighting examples. The results have been computed using the MOT (Multi Object Tracking) Challenge Development Kit [
72]. Results are shown in
Table 1 for expansion rates of 0%, 25%, and 50%. Bold figures indicate the best results in each row. The mean and standard deviations are computed over the seven testing sequences. F1 and, to a lesser extent, mean average precision mAP, are good indicators of detection capability. Note that in a real application, F1 is a better indication of performance as it indicates the possible balance between precision (and hence of false positives) and recall (indicative of false negatives), for a given detection confidence threshold. In the cases considered here, Yolov3 is likely to have a precision and recall performance of around 89.5% (when setting an operational point that balances precision and recall). It can be observed that Faster R-CNN and Yolov3 outperform EspinNetV2 in all tests by a margin of around 13–20% in F1. Yolov3 is fairly stable across the different expansion rates and outperforms Faster R-CNN in F1. Faster-RCNN and EspinetV2 show some improvement for a 50% expansion rate (the similar behavior is expected as EspinetV2 is derived from Faster-RCNN). Finally, it should also be noted that Yolov3 has inference (detection) times around five times faster than Faster-RCNN.
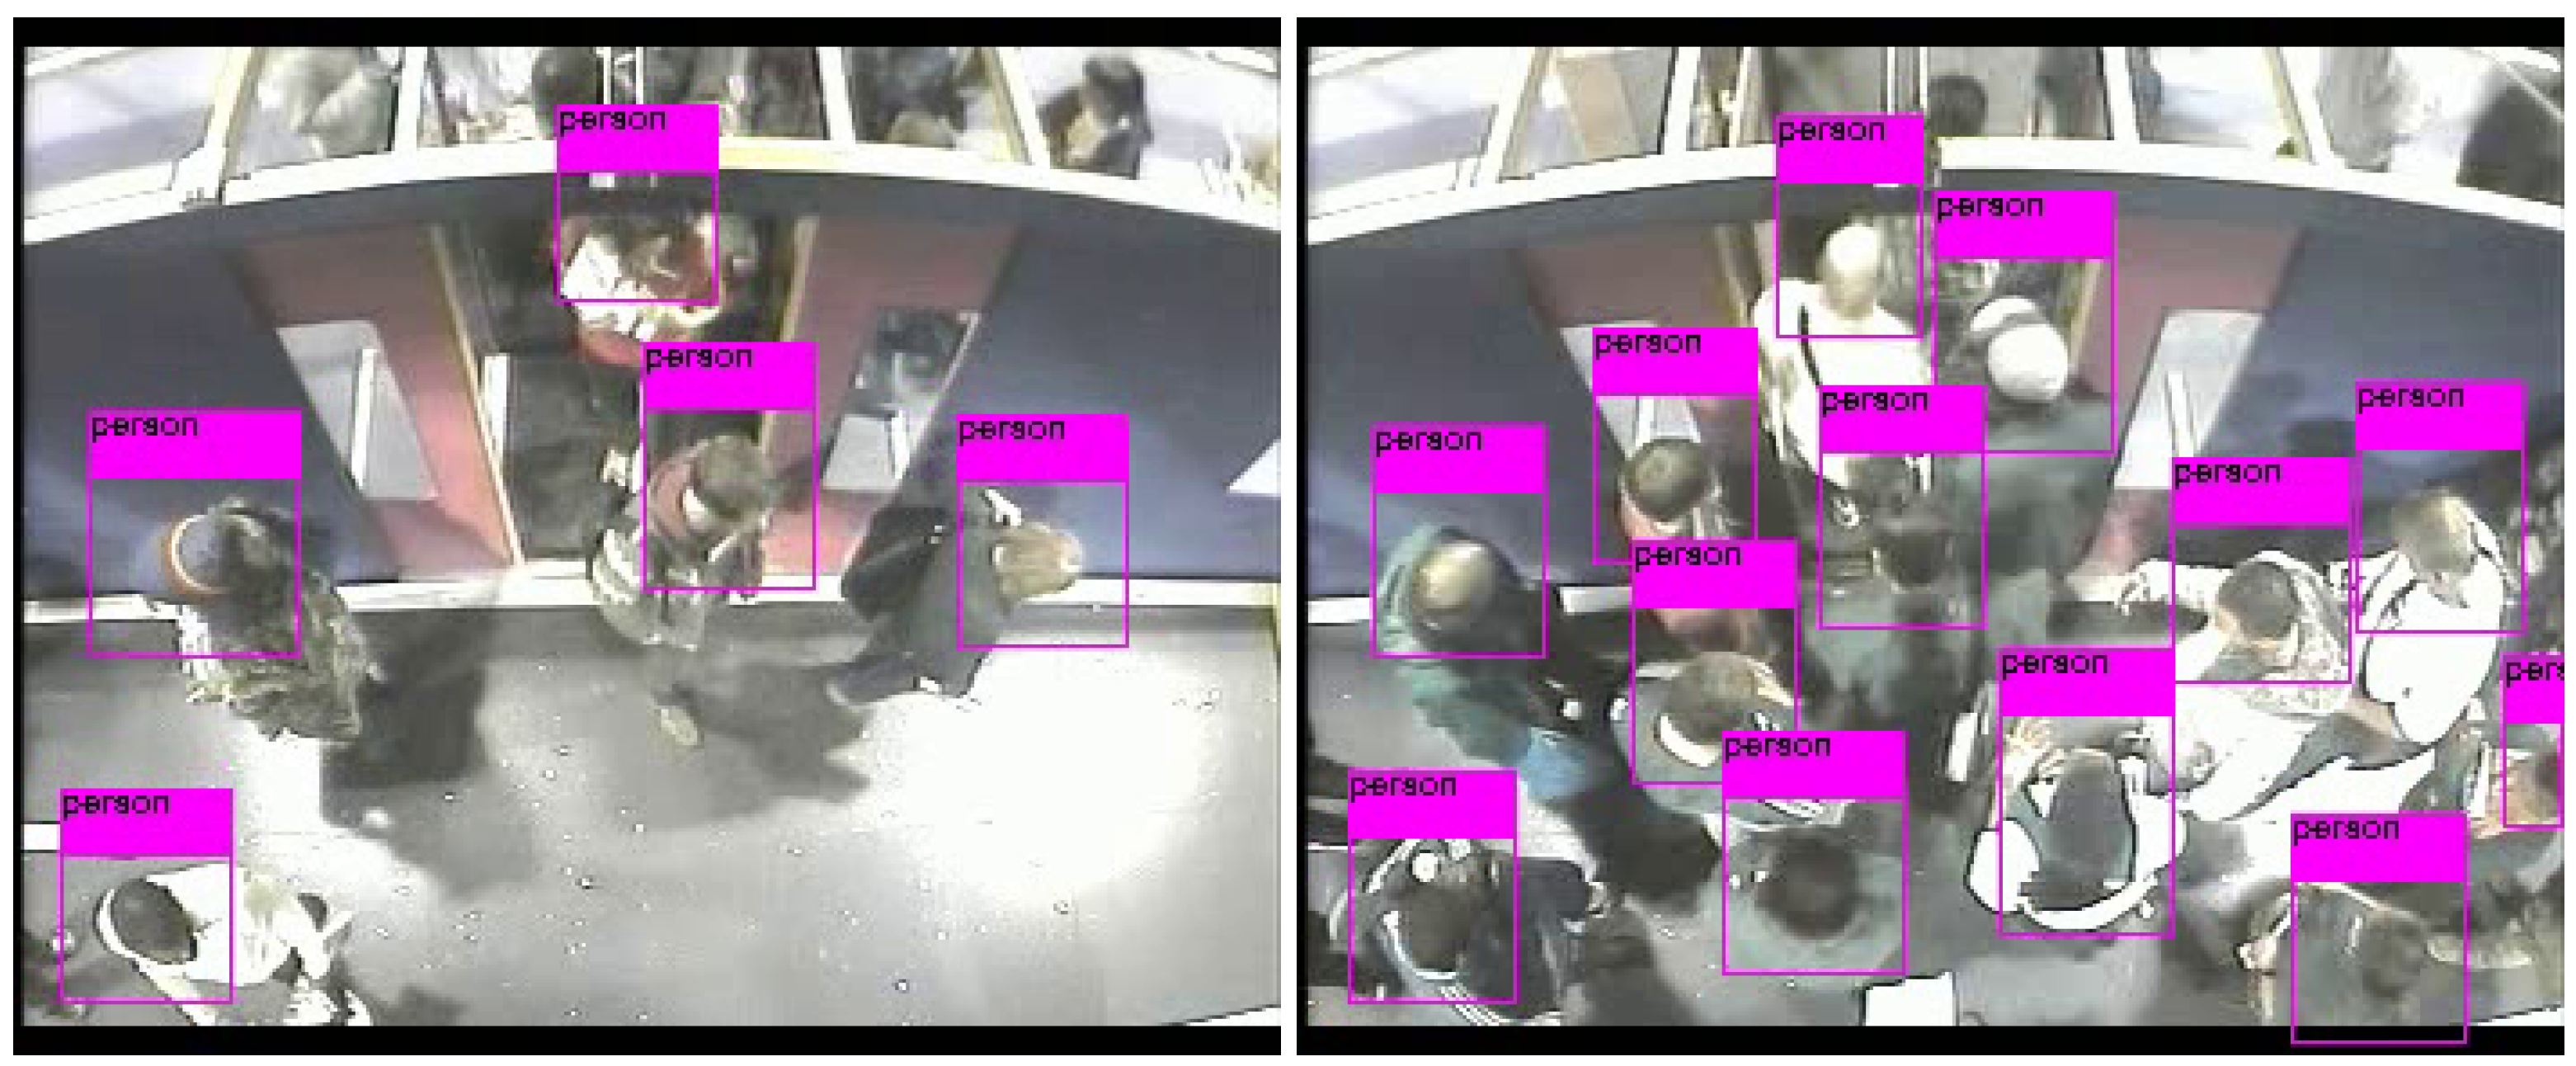
Figure 7 shows a couple of examples of people detection.
5.2. Tracking Results
Tracking results from MDP, SORT, and D-SORT trackers have been compared, using the three different detectors and expansion rates.
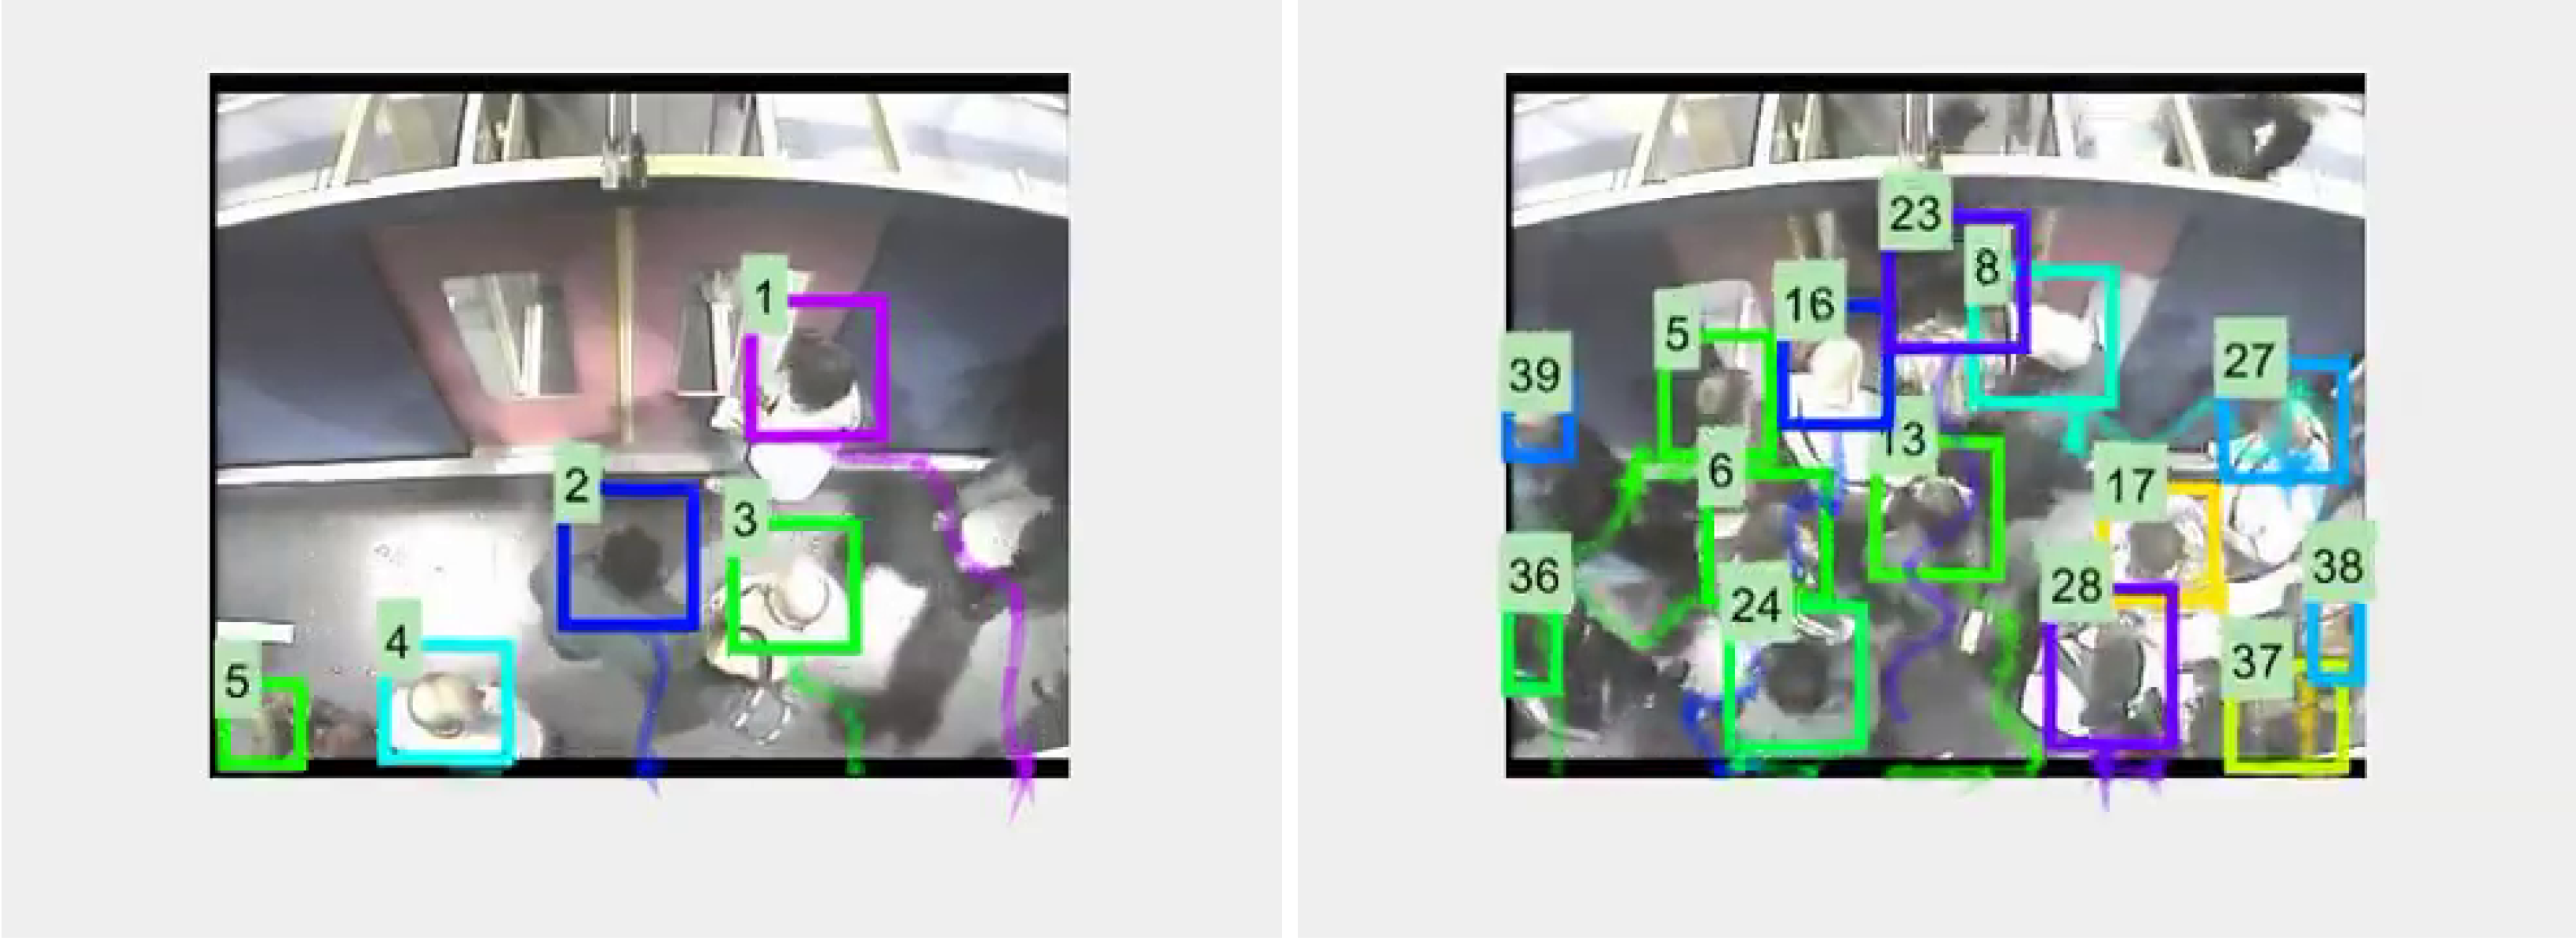
Figure 8 shows a couple of typical tracking examples, while
Table 2,
Table 3 and
Table 4 show tracking metrics obtained with MDP, SORT, and D-SORT, respectively. In each table bold figures indicate the best results for each row. As per the detection experiments, better results are obtained by Faster-RCNN and Yolov3.
In terms of the MOTA metric, best results (81.38) are obtained with SORT/Faster-RCNN/50% followed closely (80.54) by D-SORT/Yolov3/25%. It is reasoned that the angle of capture and the focus on heads, has reduced the amount of occlusions that MDP (via reinforcement learning) and D-SORT (using deep features and cosine distance similarity) have been designed to cope with, and so their particular strengths are not fully stretched. Therefore, the simpler SORT tracker is still able to produce good results with the top two detectors. It is noted that with the poorer detector, none of the trackers do too well (MOTA < 55). It is also noted that the Yolov3/D-SORT combination seems to be less affected by expansion rate; therefore, this combination is used to investigate counting performance, as described in the next sub-section.
5.3. People Counting
As indicated earlier on, one of the main requirements for transport engineers in this area is to count the number of people entering and exiting the transport vehicle. Once people are detected and then tracked, counting is relatively simpler. In this case, an imaginary line, with a conventional equation
, across the image is considered as shown in
Figure 9. Then, at any given time
t, for each person, its running average position
is computed, for all its positions up to time
t, starting from its first appearance. For example, for a person alighting, this running average would tend to have decreasing values in
as
t increases. When that averages moves from one side of the line to the other (by a given threshold), the person
triggers a count (down, or alighting, if it originated above the line and up, or boarding, otherwise).
Considering the tracking results (please see
Table 4) and taking into account the significant computational advantages of Yolov3, that combination (at an expansion rate of 25%) has been chosen to provide a counting baseline for future researchers. For a given direction of flow (boarding, alighting), true positives/negatives, false positives/negatives are defined as given by
Table 5. For example, for boarding, a down-going count would be a false positive, while an undetected person would be a false negative. Note that true negatives are not computed.
Given the definitions in
Table 5, in addition to the conventional metrics given in Equation (
1) (
Section 2), accuracy is defined as follows (note that true negatives are not included):
The evaluation of counting has been done on the videos known as “2008” in the dataset. These consist of 145 alighting sequences (most with 50 people alighting from the carriages) and 177 boarding sequences (most with 27–29 people boarding), under different conditions of crowdiness, depending on physical factors, such as door width. For alighting counts, the imaginary line is
and for boarding
. The overall results are summarized in
Table 6.
6. Discussion
One of the major difficulties in assessing what is the current state-of-the-art in this field has been the lack of representative datasets with number of examples sufficiently large to train modern machine learning methods. Recent works in this area include the use of Tiny YOLO to detect passengers in buses by Zhang et al. [
32], a proposal called MetroNet also to monitor passengers in buses described by Guo et al. [
33], passenger flow counting by Hsu et al. [
34], and metro passenger flows using Yolov3 in Liu et al. [
35], which uses proprietary data captured by the authors, so it is not possible to objectively compare results. The absence of data can be explained by the need to observe real people in a natural environment and privacy concerns prevent or limit the publication of such data. What had been proposed is the use of full scale models using people who are habitual public transport users who have given their informed consent to volunteer in these experiments and for the video recordings to be made public. Previous studies show that after a relative short period of getting used to the experimental model, people behave naturally. This has avoided the use of actors, something typical in computer vision-based human behavior studies that have significant biases in terms of age, gender, and levels of fitness. Therefore it is likely that with this dataset and with the baseline results presented in this paper, it will be possible for researchers in this field to establish and improve upon the state-of-the-art.
In terms of the scope of this work on transport engineering, first the method presented showed that annotation time can be reduced between 4 to 5 times, in particular by the ability to track passengers, i.e., where they are located and from where passengers are coming or going once on the platform. The results have an accuracy comparable to human annotators, specially in crowded conditions where manual annotation can lose 1 or 2 people in each boarding/alighting process. Secondly, there is potential for the method to be used in managing the flow of passengers on platforms and inside vehicles, which allows evaluating measures for the control and channeling of passengers. The experiments in the laboratory have shown that the management of passenger flows, such as marking the platform, allows reducing the times of getting on and off by more than 30%. Considering that the dwell time represents approximately 30% of the time in a public transport vehicle, the travel time between stations could be reduced by 10%.
In addition to on-going work on full-size models for passenger monitoring on more complex environments, such as bus stops, further laboratory studies with this technique that are being planned aim to answer the following questions: (a) What is the best combination of vertical and horizontal gaps between the platform and the vehicle to reduce the dwell time? (preliminary studies have shown that the answer is not always zero). To what extent does this combination differ for specific groups of passengers, e.g., elderly people and people with reduced mobility? (b) What is the effect of the density inside vehicles and on platforms on passenger boarding and alighting times and, in turn, on dwell time? (c) What is the influence of the location of the vertical and horizontal handrails, as well as the seating layout, on boarding and alighting times? Can this policy reduce the dwell time? (d) To what extent can the management of passenger on the platforms encourage appropriate behavior to reduce the dwell time? (e) Are there other lines of action, not yet identified, to improve the boarding and alighting processes, safety, and dwell time?
7. Conclusions
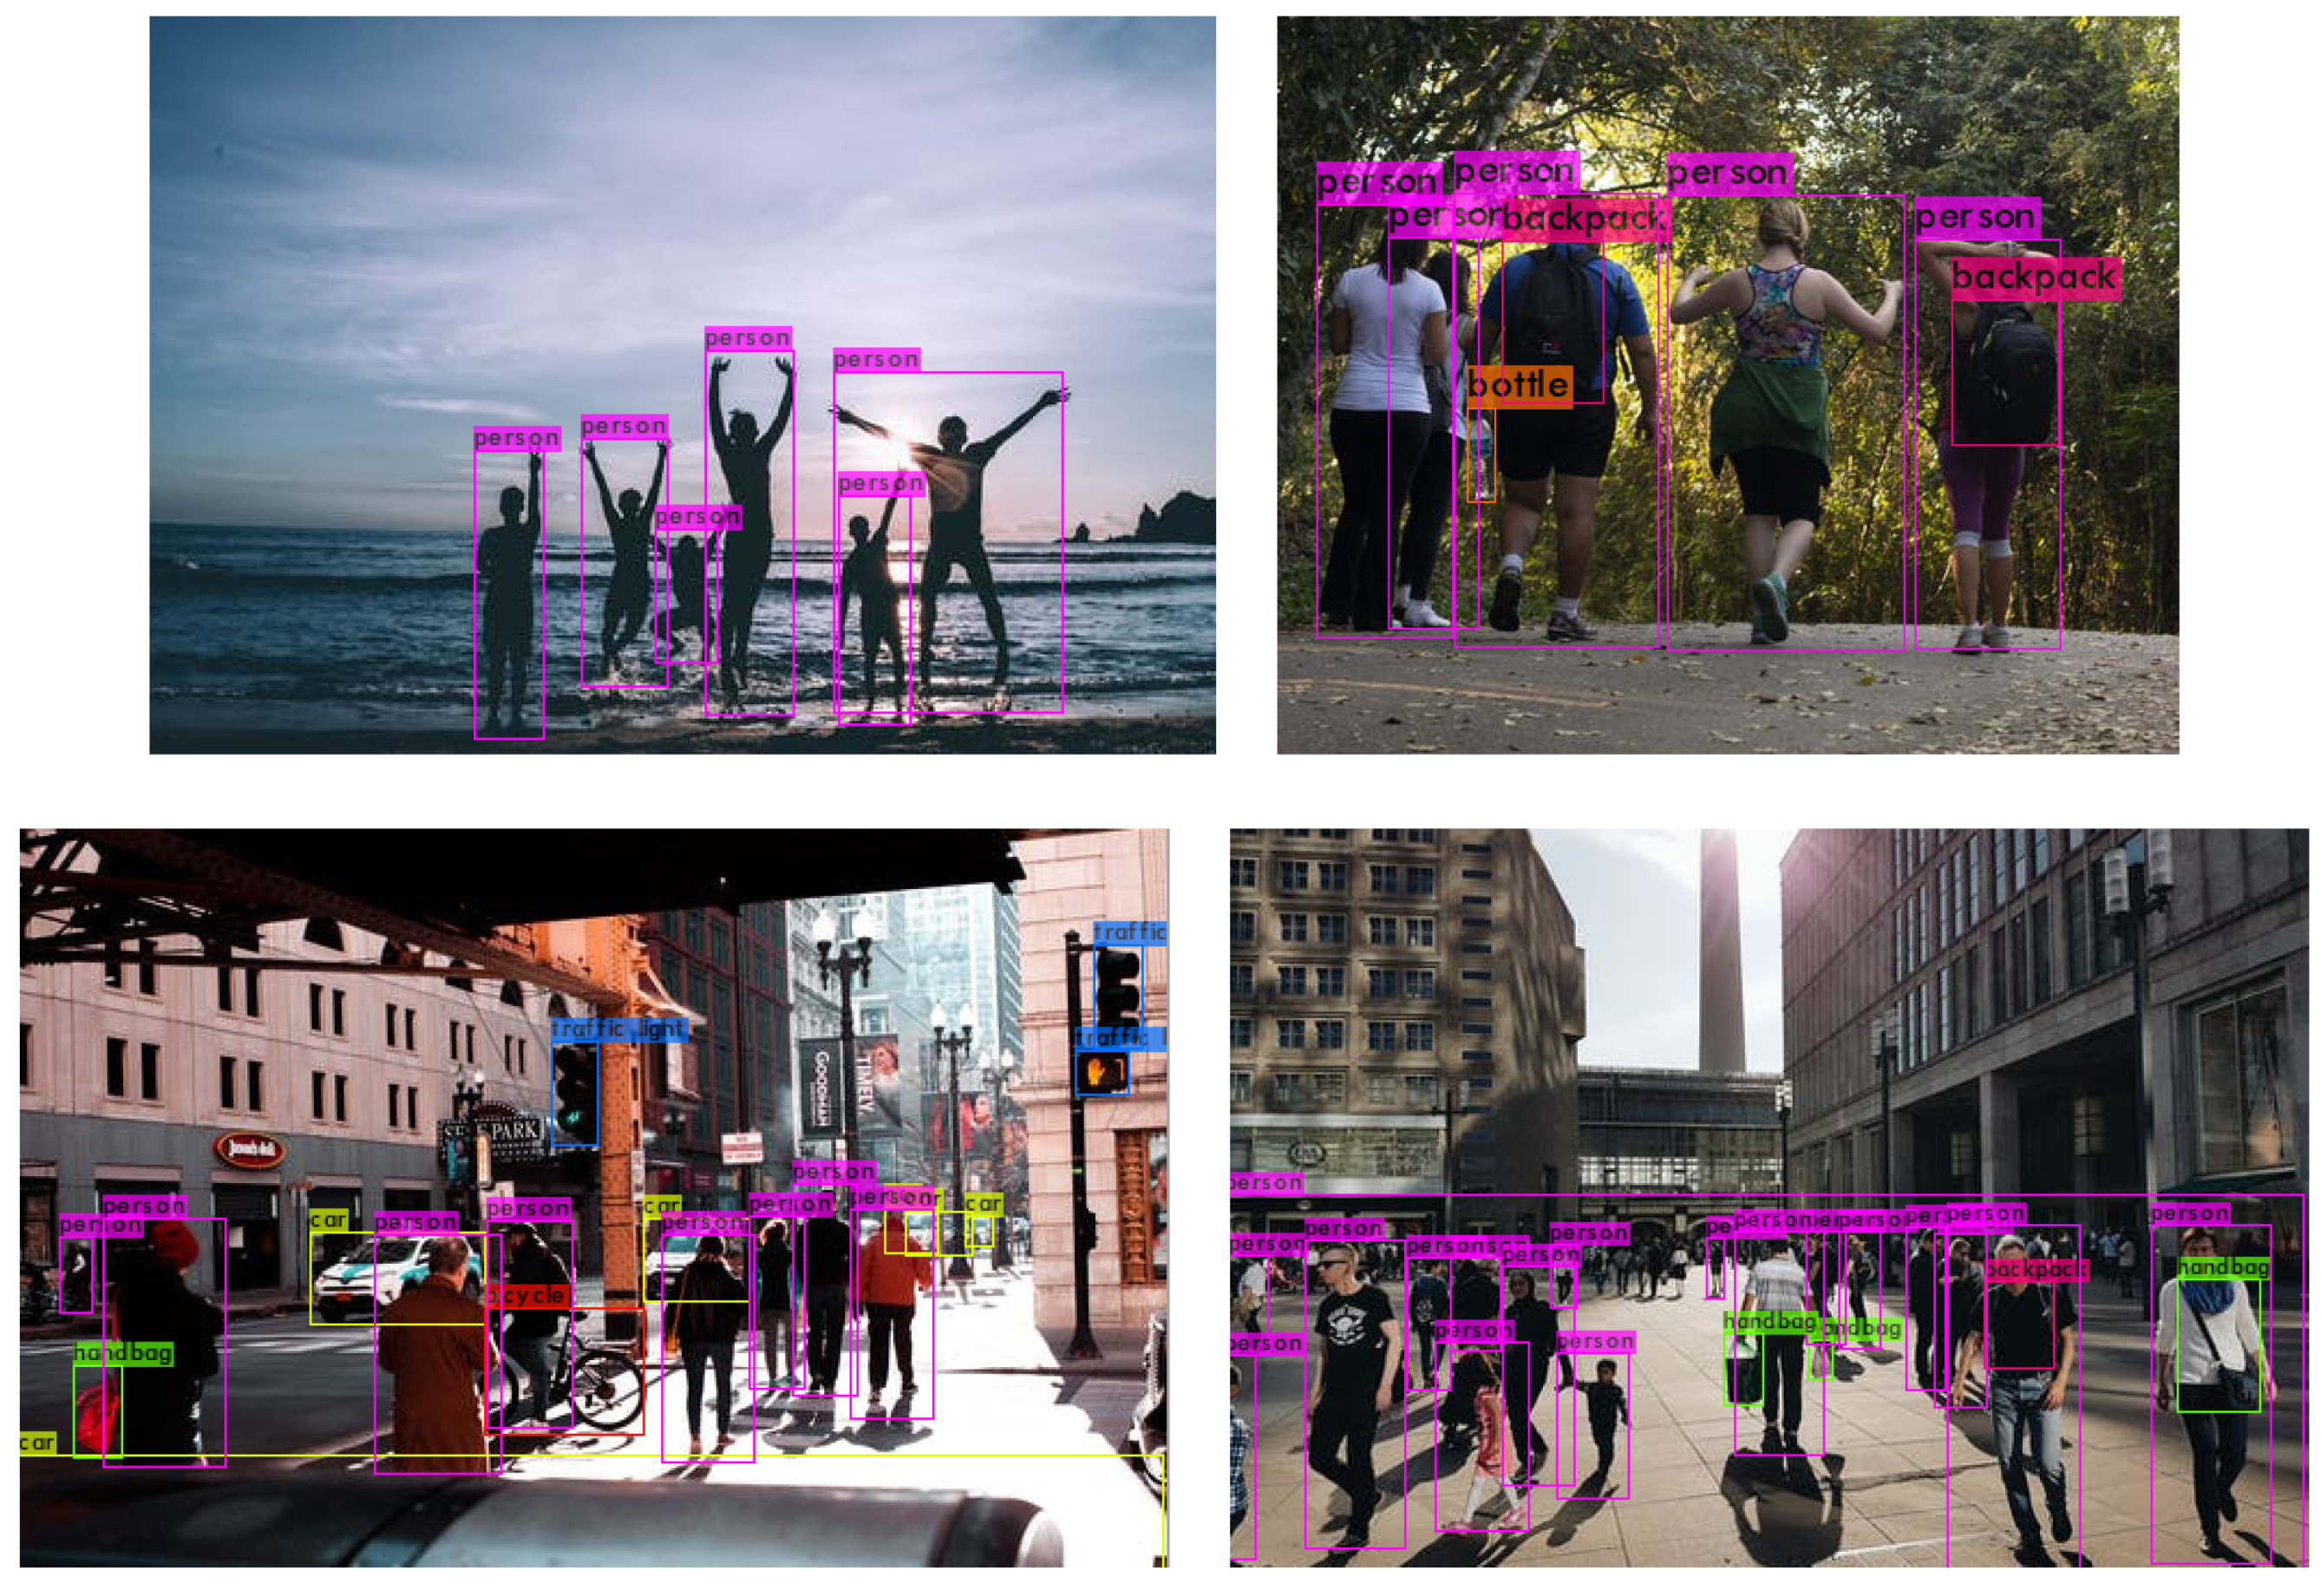
This work has presented an approach based on machine (deep) learning to locate, track, and count people in a public transport environment, exploiting the full-size PAMELA experimental facility. A new public dataset has been introduced. The main challenge in this dataset is the angled camera view that defeats people detectors trained with popular datasets, but that it corresponds with typical sensor position in this kind of environment. This illustrates the fact that although data-driven learning approaches can produce impressive results, their generalization capabilities are still below that of human observers, leading to the need to capture application-specific data that then has to be manually annotated at significant costs. This is a general observation applicable to many other computer vision application domains.
In terms of sensor processing, the performance of three different state-of-the-art detectors and trackers were evaluated to create a baseline for this dataset. Computational efficiency led to the selection of D-SORT and Yolov3 to assess people counting, one of the main requirements of transport engineers in this domain. Counting accuracies were very satisfactory and provide a good challenge for future researchers to improve upon.
Future work will look at refining the use of spatio-temporal cues provided by video sequences in a detection-by-tracking manner so as to feedback tracking into the detector, rather than the current uni-directional sequential process where a tracker might not recover from detection errors. Additional computational experiments are planned to improve results through optimizing anchor definitions and augmenting data.


