A Random Forest Machine Learning Framework to Reduce Running Injuries in Young Triathletes

 ,
,  ,
,
Abstract
:1. Introduction
2. Materials and Methods
2.1. Participants
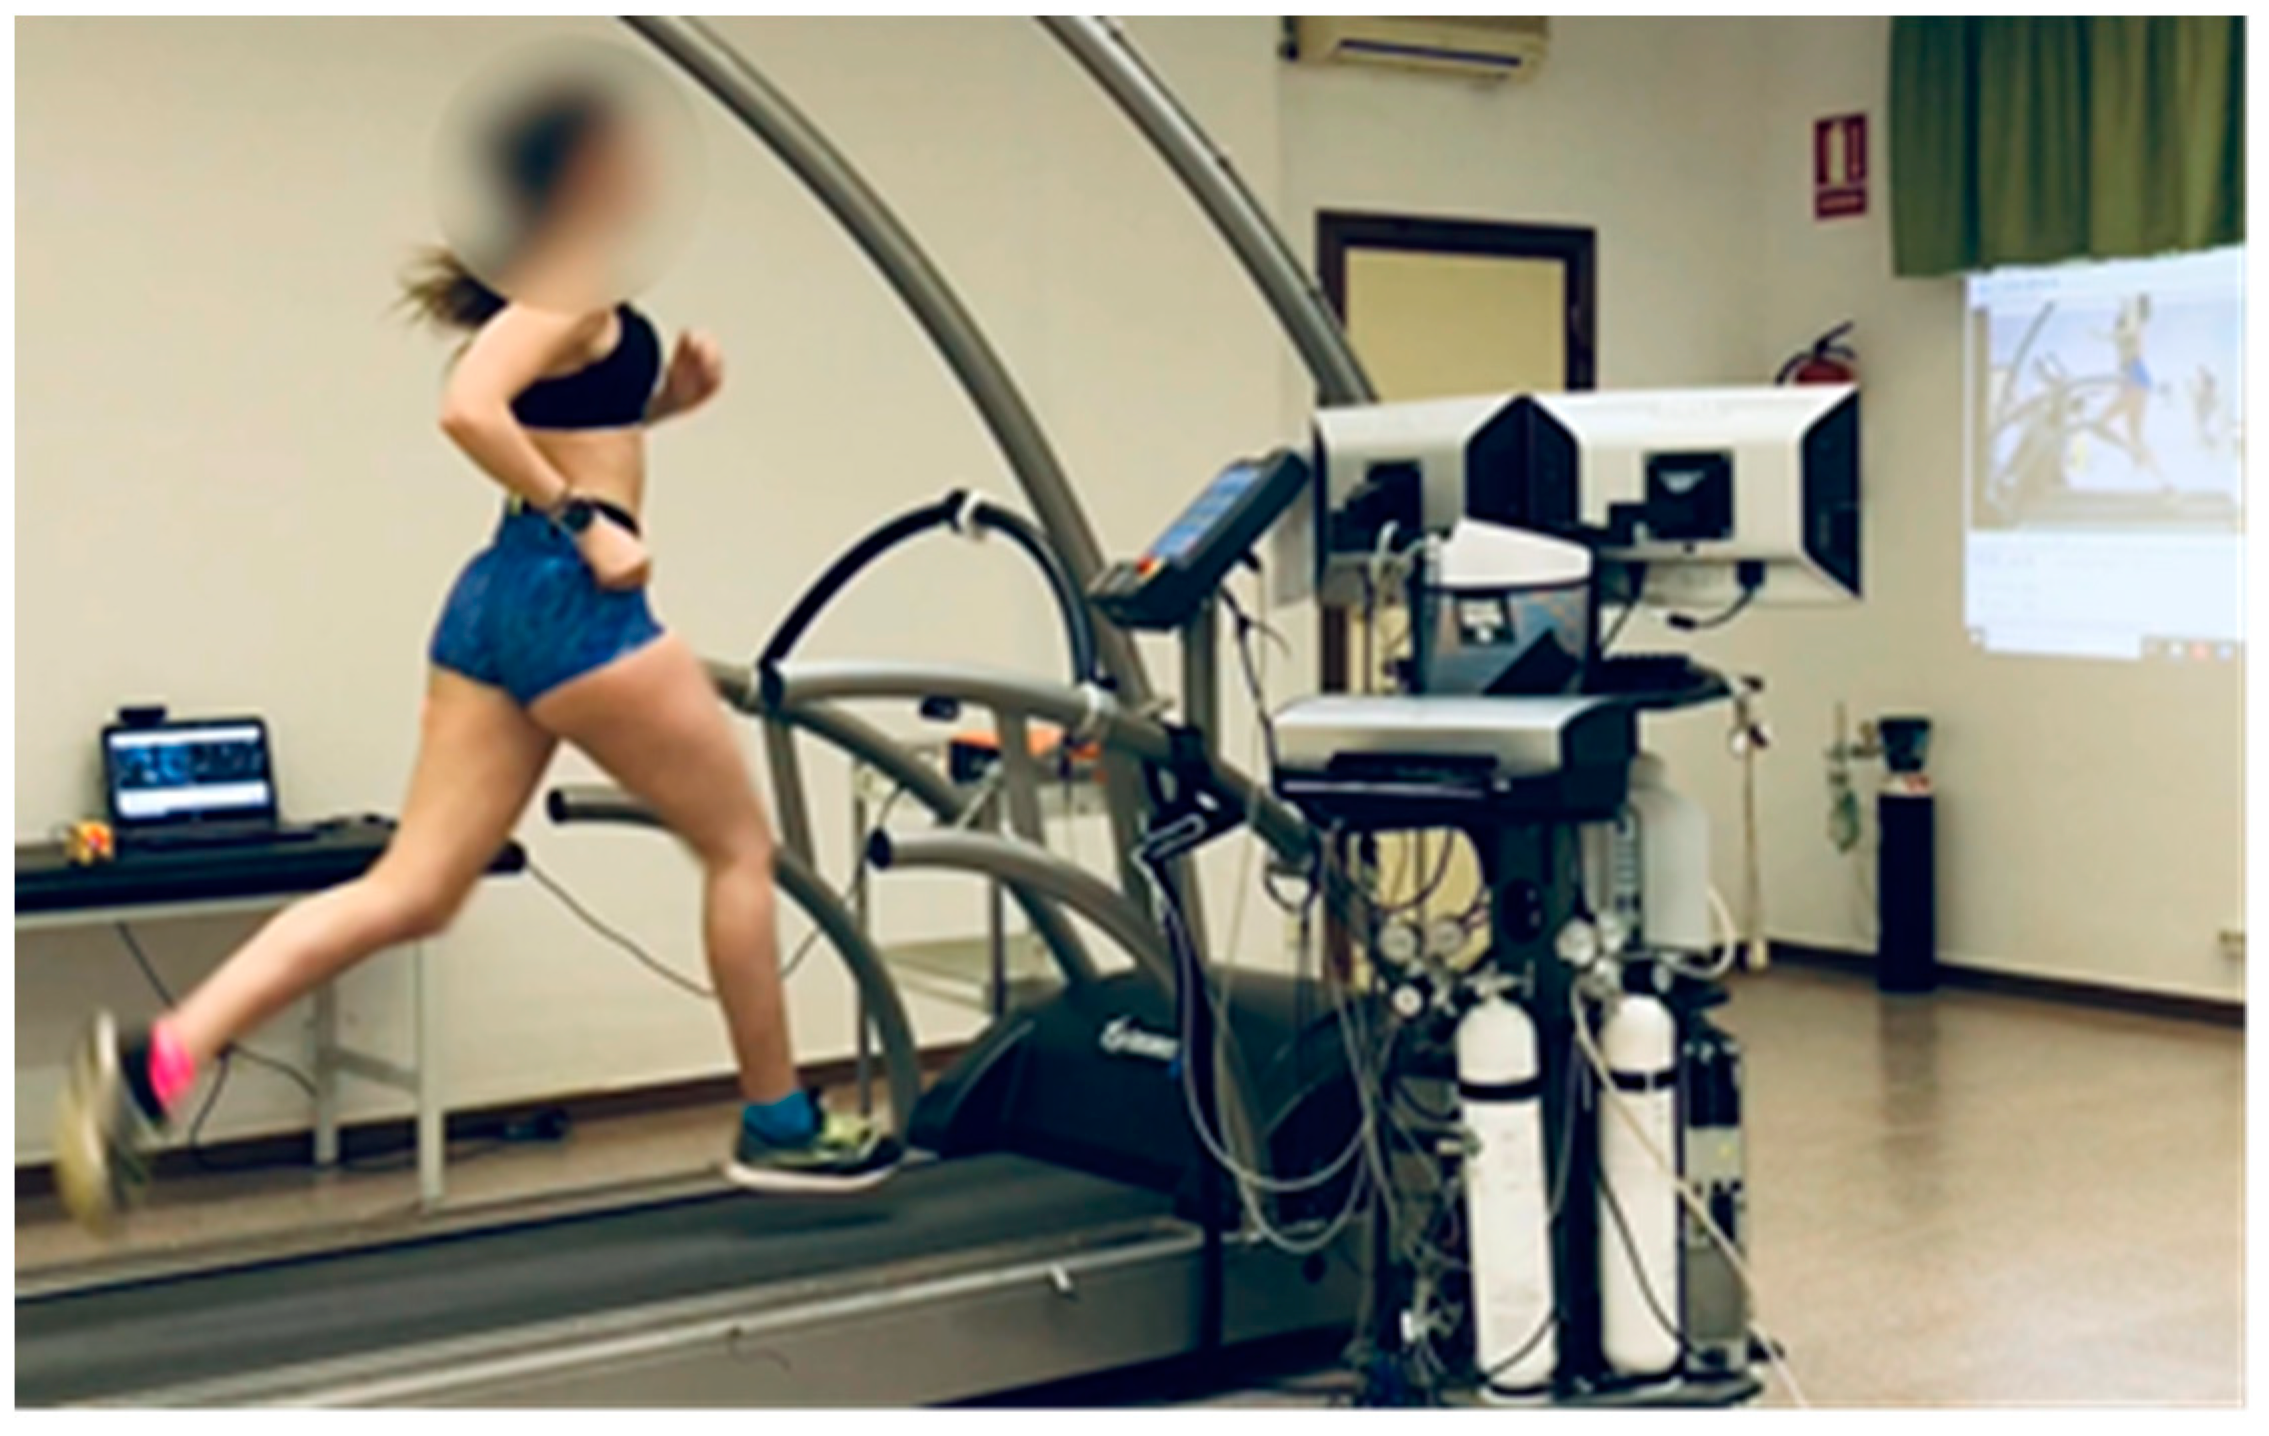
2.2. Data Collection
2.3. Retraining Protocol
2.4. Statistical Analysis
3. Results
3.1. Random Forest Analysis
3.2. Variable Importance
4. Discussion
Limitations of the Study and Future Activities
5. Conclusions
Author Contributions
Funding
Acknowledgments
Conflicts of Interest
References
- McHardy, A.; Pollard, H.; Fernandez, M. Triathlon Injuries: A Review of the Literature and Discussion of Potential Injury Mechanisms. Clin. Chiropr. 2006, 3, 129–138. [Google Scholar]
- Patel, D.R.; Yamasaki, A.; Brown, K. Epidemiology of Sports-Related Musculoskeletal Injuries in Young Athletes in the United States. Transl. Pediatr. 2017, 6, 160–166. [Google Scholar] [CrossRef] [PubMed] [Green Version]
- Brenner, J.S.; American Academy of Pediatrics Council on Sports Medicine and Fitness. Overuse Injuries, Overtraining, and Burnout in Child and Adolescent Athletes. Pediatrics 2007, 119, 1242–1245. [Google Scholar] [CrossRef] [PubMed] [Green Version]
- Patel, D.R.; Baker, R.J. Musculoskeletal Injuries in Sports. Prim. Care: Clin. Off. Pr. 2006, 33, 545–579. [Google Scholar] [CrossRef] [PubMed]
- Vleck, V.E.; Garbutt, G. Injury and Training Characteristics of Male Elite, Development Squad, and Club Triathletes. Int. J. Sports Med. 1998, 19, 38–42. [Google Scholar] [CrossRef] [PubMed]
- Clements, K.; Yates, B.; Curran, M. The Prevalence of Chronic Knee Injury in Triathletes. Br. J. Sports Med. 1999, 33, 214–216. [Google Scholar] [CrossRef] [PubMed] [Green Version]
- Cipriani, D.J.; Swartz, J.D.; Hodgson, C.M. Triathlon and the Multisport Athlete. J. Orthop. Sports Phys. Ther. 1998, 27, 42–50. [Google Scholar] [CrossRef] [Green Version]
- Burns, J.; Keenan, A.M.; Redmond, A.C. Factors Associated with Triathlon-Related Overuse Injuries. J. Orthop. Sports Phys. Ther. 2003, 33, 177–184. [Google Scholar] [CrossRef] [PubMed]
- Bramah, C.; Preece, S.J.; Gill, N.; Herrington, L. Is there a Pathological Gait Associated with Common Soft Tissue Running Injuries? Am. J. Sports Med. 2018, 46, 3023–3031. [Google Scholar] [CrossRef]
- Van Hooren, B.; Goudsmit, J.; Restrepo, J.; Vos, S. Real-Time Feedback by Wearables in Running: Current Approaches, Challenges and Suggestions for Improvements. J. Sports Sci. 2019, 38, 214–230. [Google Scholar] [CrossRef]
- Agresta, C.; Brown, A. Gait Retraining for Injured and Healthy Runners using Augmented Feedback: A Systematic Literature Review. J. Orthop. Sports Phys. Ther. 2015, 45, 576–584. [Google Scholar] [CrossRef]
- Bramah, C.; Preece, S.J.; Gill, N.; Herrington, L. A 10% Increase in Step Rate Improves Running Kinematics and Clinical Outcomes in Runners with Patellofemoral Pain at 4 Weeks and 3 Months. Am. J. Sports Med. 2019, 47, 3406–3413. [Google Scholar] [CrossRef] [Green Version]
- Noehren, B.; Scholz, J.; Davis, I. The Effect of Real-Time Gait Retraining on Hip Kinematics, Pain and Function in Subjects with Patellofemoral Pain Syndrome. Br. J. Sports Med. 2011, 45, 691–696. [Google Scholar] [CrossRef] [Green Version]
- Willy, R.W.; Scholz, J.P.; Davis, I.S. Mirror Gait Retraining for the Treatment of Patellofemoral Pain in Female Runners. Clin. Biomech. 2012, 27, 1045–1051. [Google Scholar] [CrossRef] [PubMed] [Green Version]
- Davis, I.S.; Tenforde, A.S.; Neal, B.S.; Roper, J.L.; Willy, R.W. Gait Retraining as an Intervention for Patellofemoral Pain. Curr. Rev. Musculoskelet. Med. 2020, 13, 103–114. [Google Scholar] [CrossRef]
- Chan, Z.Y.S.; Zhang, J.H.; Au, I.P.H.; An, W.W.; Shum, G.L.K.; Ng, G.Y.F.; Cheung, R.T.H. Gait Retraining for the Reduction of Injury Occurrence in Novice Distance Runners: 1-Year Follow-Up of a Randomized Controlled Trial. Am. J. Sports Med. 2018, 46, 388–395. [Google Scholar] [CrossRef]
- Chumanov, E.S.; Wille, C.M.; Michalski, M.P.; Heiderscheit, B.C. Changes in Muscle Activation Patterns when Running Step Rate is Increased. Gait Posture 2012, 36, 231–235. [Google Scholar] [CrossRef] [PubMed] [Green Version]
- Manninen, J.S.; Kallinen, M. Low Back Pain and Other Overuse Injuries in a Group of Japanese Triathletes. Br. J. Sports Med. 1996, 30, 134–139. [Google Scholar] [CrossRef] [Green Version]
- Beltz, N.M.; Gibson, A.L.; Janot, J.M.; Kravitz, L.; Mermier, C.M.; Dalleck, L.C. Graded Exercise Testing Protocols for the Determination of VO2max: Historical Perspectives, Progress, and Future Considerations. J. Sports Med. 2016, 2016. [Google Scholar] [CrossRef] [Green Version]
- Al-Amri, M.; Nicholas, K.; Button, K.; Sparkes, V.; Sheeran, L.; Davies, J.L. Inertial Measurement Units for Clinical Movement Analysis: Reliability and Concurrent Validity. Sensors 2018, 18, 719. [Google Scholar] [CrossRef] [Green Version]
- Teufl, W.; Miezal, M.; Taetz, B.; Fröhlich, M.; Bleser, G. Validity of Inertial Sensor Based 3D Joint Kinematics of Static and Dynamic Sport and Physiotherapy Specific Movements. PLoS ONE 2019, 14. [Google Scholar] [CrossRef] [Green Version]
- Pipkin, A.; Kotecki, K.; Hetzel, S.; Heiderscheit, B. Reliability of a Qualitative Video Analysis for Running. J. Orthop. Sports Phys. Ther. 2016, 46, 556–561. [Google Scholar] [CrossRef] [PubMed]
- SENIAM. European Recommendations for Surface Electromyography, Results of the SENIAM Project. Mt. Res. Dev. 1999, 8, 13–54. [Google Scholar]
- Hermens, H.J.; Freriks, B.; Disselhorst-Klug, C.; Rau, G. Development of Recommendations for SEMG Sensors and Sensor Placement Procedures. J. Electromyogr. Kinesiol. 2000, 10, 361–374. [Google Scholar] [CrossRef]
- Hafer, J.F.; Brown, A.M.; deMille, P.; Hillstrom, H.J.; Garber, C.E. The Effect of a Cadence Retraining Protocol on Running Biomechanics and Efficiency: A Pilot Study. J. Sports Sci. 2015, 33, 724–731. [Google Scholar] [CrossRef]
- Adams, D.; Pozzi, F.; Willy, R.W.; Carrol, A.; Zeni, J. Altering Cadence Or Vertical Oscillation during Running: Effects on Running Related Injury Factors. Int. J. Sports Phys. Ther. 2018, 13, 633–642. [Google Scholar] [CrossRef] [PubMed] [Green Version]
- Breiman, L. Random Forests. Mach. Learn. 2001, 45, 5–32. [Google Scholar] [CrossRef] [Green Version]
- Hastie, T.; Friedman, J.; Tibshirani, R. The Elements of Statistical Learning; Springer Series in Statistics: New York, NY, USA, 2001; p. 189. [Google Scholar]
- Couronne, R.; Probst, P.; Boulesteix, A.L. Random Forest Versus Logistic Regression: A Large-Scale Benchmark Experiment. BMC Bioinformatics 2018, 19, 270. [Google Scholar] [CrossRef]
- Kuhn, M.; Johnson, K. Applied Predictive Modeling; Springer: New York, NY, USA, 2013; Volume 26, p. 386. [Google Scholar]
- Climent, M.T.; Pardo, J.; Munoz-Almaraz, F.J.; Guerrero, M.D.; Moreno, L. Decision Tree for Early Detection of Cognitive Impairment by Community Pharmacists. Front. Pharmacol. 2018, 9, 1232. [Google Scholar] [CrossRef] [Green Version]
- Greenwell, B.M.; Boehmke, B.C.; McCarthy, A.J. A Simple and Effective Model-Based Variable Importance Measure. arXiv 2018, arXiv:arXiv:1805.04755. [Google Scholar]
- Willson, J.D.; Kernozek, T.W.; Arndt, R.L.; Reznichek, D.A.; Scott Straker, J. Gluteal Muscle Activation during Running in Females with and without Patellofemoral Pain Syndrome. Clin. Biomech. 2011, 26, 735–740. [Google Scholar] [CrossRef] [PubMed]
- Bonacci, J.; Saunders, P.U.; Alexander, M.; Blanch, P.; Vicenzino, B. Neuromuscular Control and Running Economy is Preserved in Elite International Triathletes After Cycling. Sports Biomech. 2011, 10, 59–71. [Google Scholar] [CrossRef] [Green Version]
- Chapman, A.R.; Vicenzino, B.; Blanch, P.; Hodges, P.W. Is Running Less Skilled in Triathletes than Runners Matched for Running Training History? Med. Sci. Sports Exerc. 2008, 40, 557–565. [Google Scholar] [CrossRef] [PubMed]
- Korkia, P.K.; Tunstall-Pedoe, D.S.; Maffulli, N. An epidemiological investigation of training and injury patterns in British triathletes. Br. J. Sports Med. 1994, 28, 191–196. [Google Scholar] [CrossRef] [PubMed] [Green Version]
- Saarela, M.; Ryynanen, O.P.; Ayramo, S. Predicting Hospital Associated Disability from Imbalanced Data using Supervised Learning. Artif. Intell. Med. 2019, 95, 88–95. [Google Scholar] [CrossRef]


| Healthy (n = 10) | Injured (n = 9) | |
|---|---|---|
| Age | 14.8 ± 1.9 | 14.4 ± 1.7 |
| Weight, kg | 52.7 ± 7.9 | 56.1 ± 10.9 |
| Height, cm | 167.1 ± 8.1 | 169.1 ± 9.6 |
| Body mass index, kg/m2 | 18.8 ± 1.6 | 19.4 ± 1.8 |
| Years in competition | 7.2 ± 1.7 | 6.8 ± 1.8 |
| Training hours per week | 19.2 ± 5.7 | 17.9 ± 5.1 |
| VSP | A.M | WCd | Time Session | |
|---|---|---|---|---|
| Session 1 (min) | 10′ | 5′ | − | 15′ |
| Session 2 (min) | 15′ | 5′ | − | 20′ |
| Session 3 (min) | 10′ | − | 15′ | 25′ |
| Session 4 (min) | − | − | 30′ | 30′ |
| PRE | POST | p Value | |
|---|---|---|---|
| Stride rate, steps/min | 174.4 ± 8.3 | 181.4 ± 7.7 | 0.00 b |
| Speed, km/h | 15.9 ± 1.7 | 16.5 ± 2.3 | 0.2 |
| Run cycle, sec | 0.69 ± 0.0 | 0.66 ± 0.0 | 0.00 b |
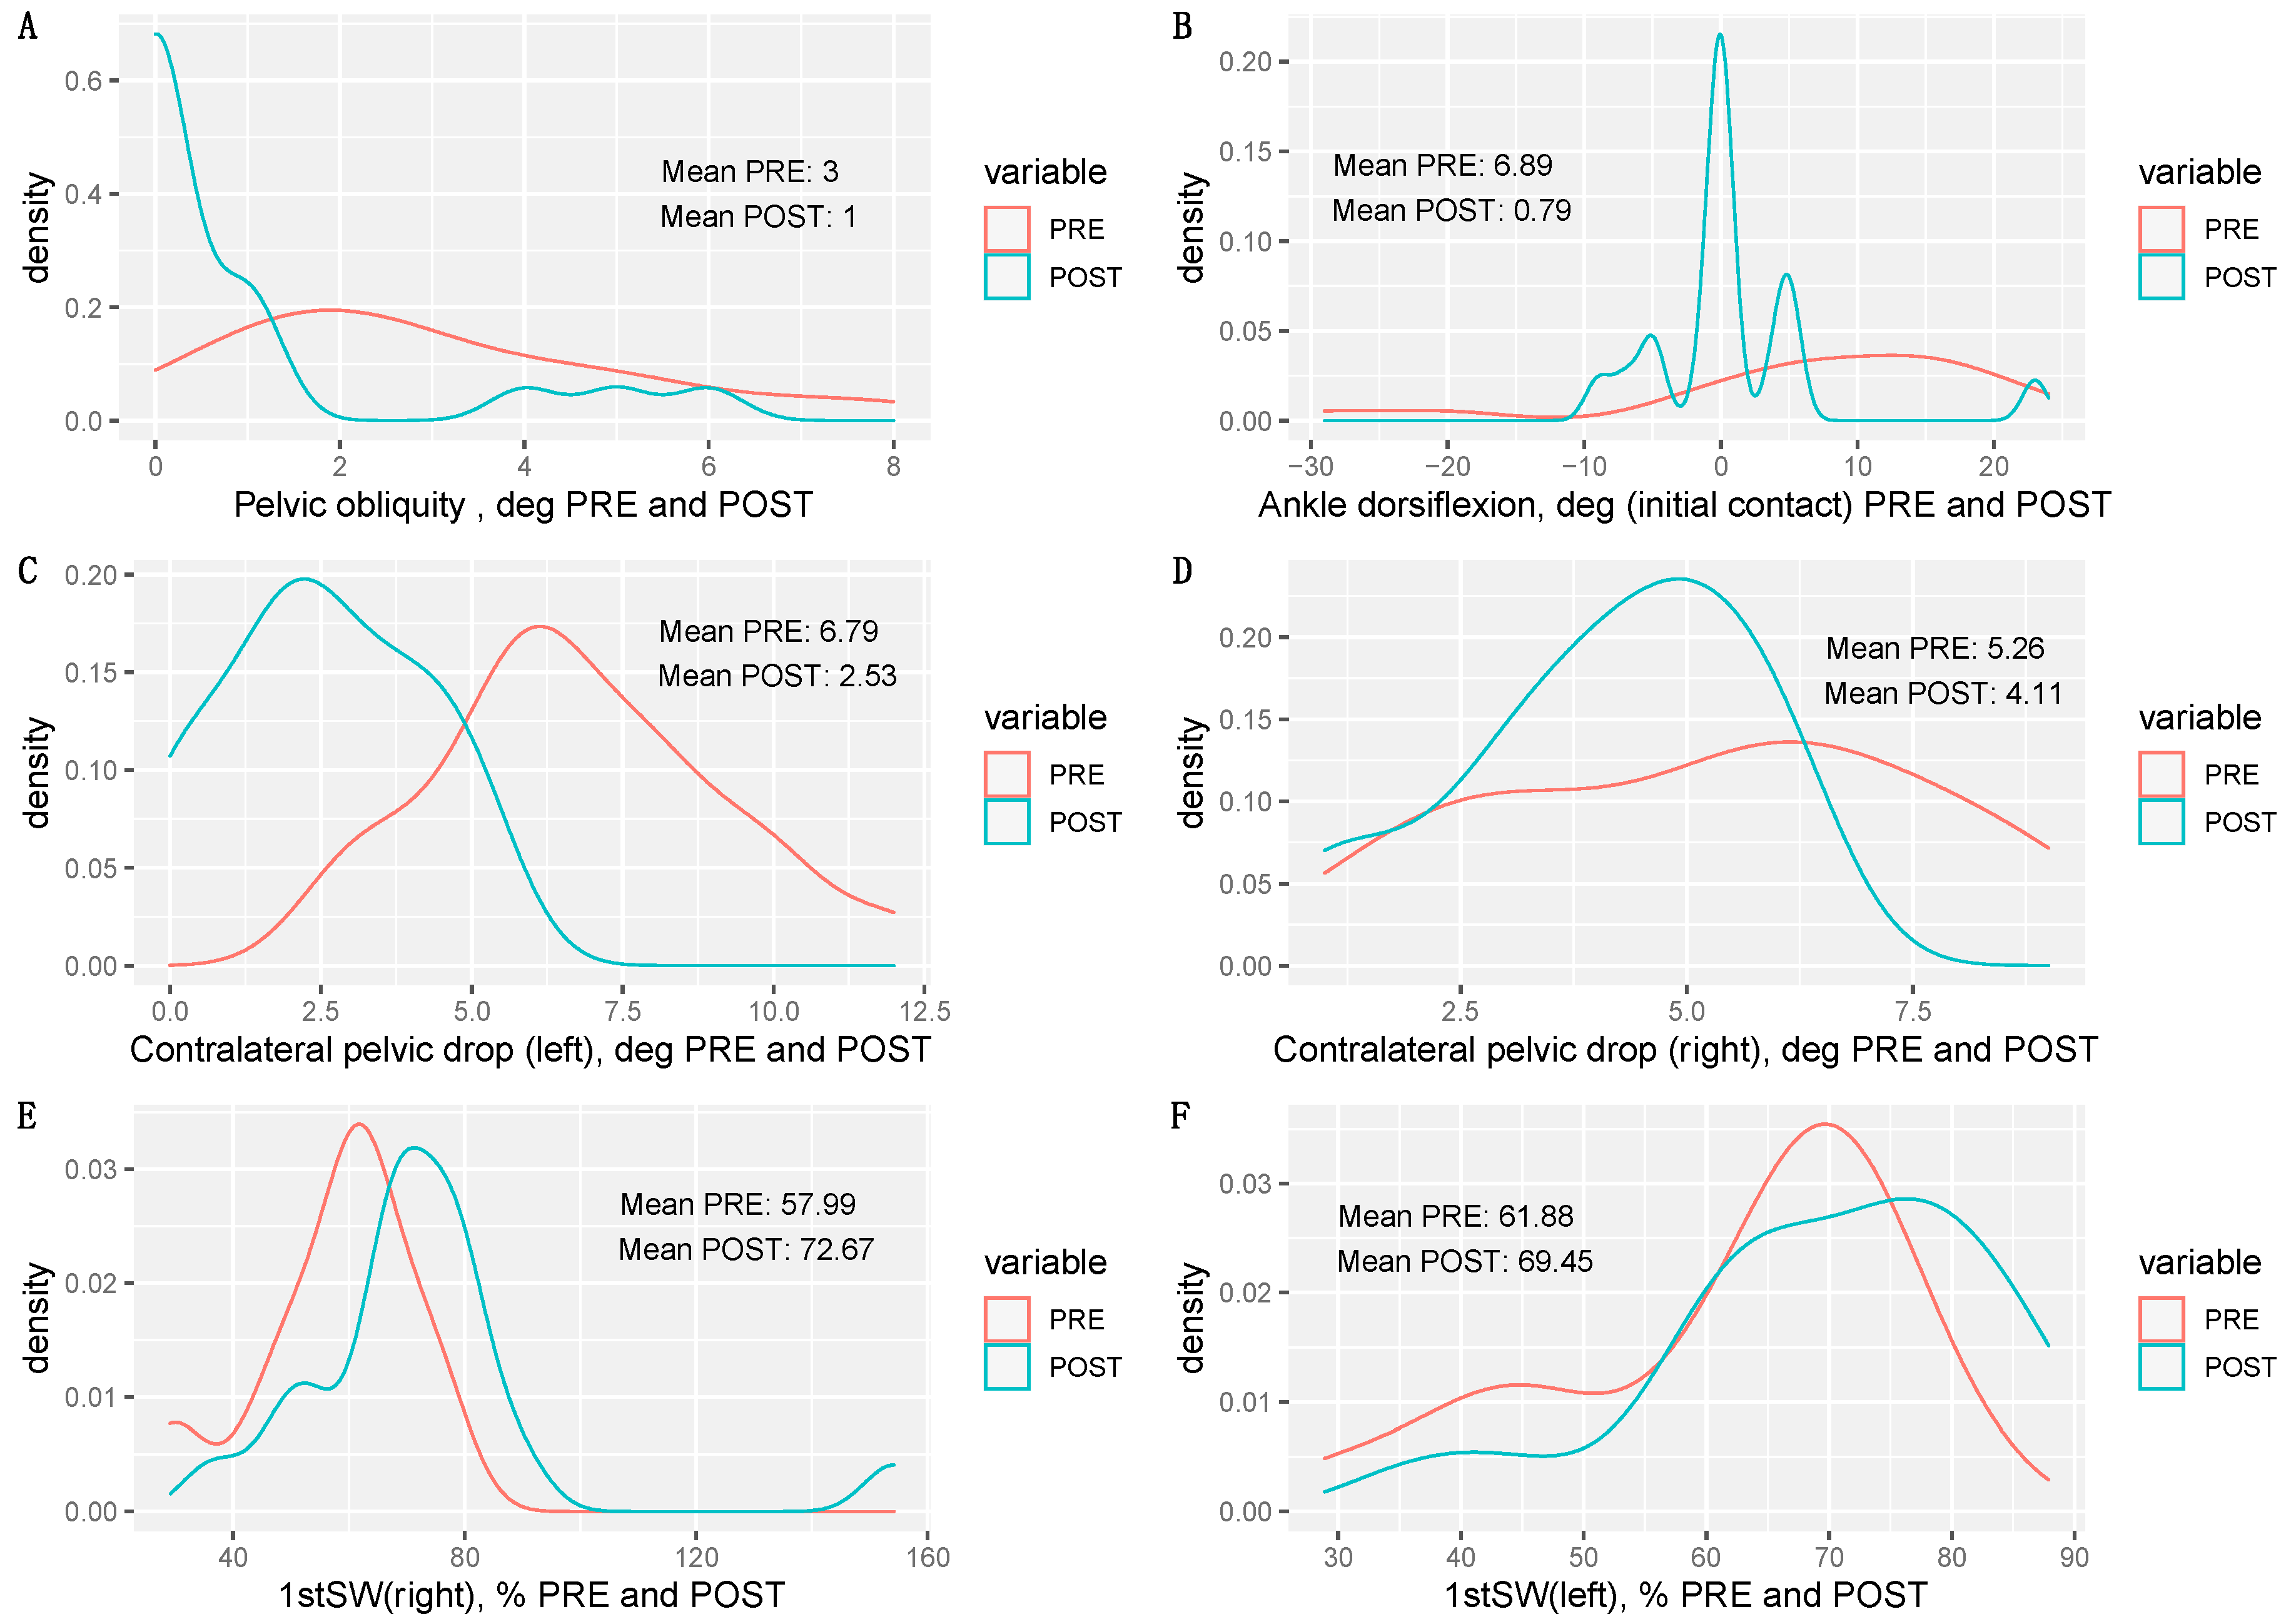
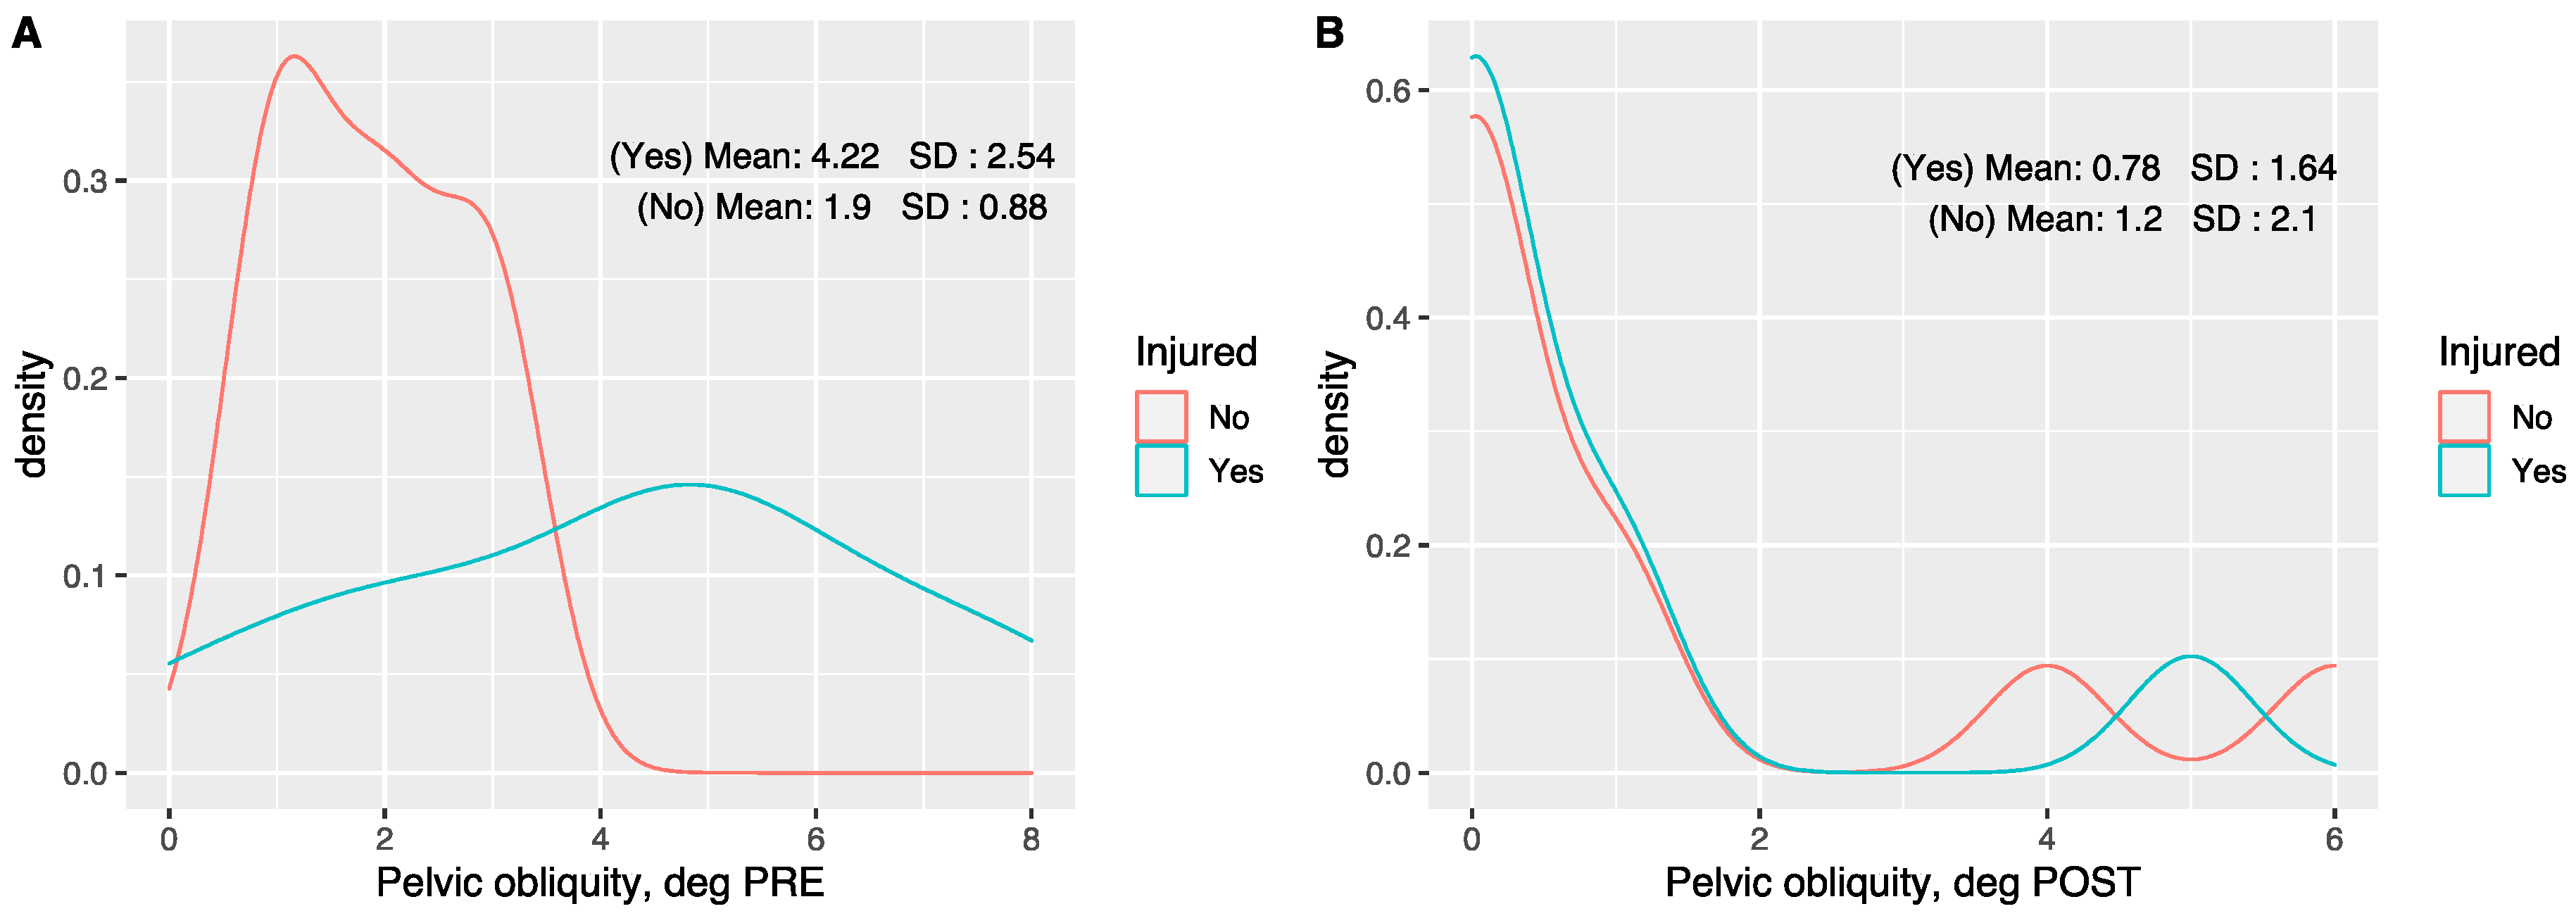
| Pelvic obliquity, deg | 3 ± 2.1 | 1 ± 1.8 | 0.01 b |
| Pelvic tilt, deg | 9.4 ± 1.2 | 9.9 ± 2.3 | 0.41 |
| Pelvic rotation, deg | 21 ± 5.7 | 19.7 ± 5.2 | 0,13 |
| Trunk forward lean, deg (initial contact) | 7.2 ± 5.3 | 3.6 ± 2.2 | 0.00 b |
| Knee flexion, deg (initial contact) | 18.8 ± 6.5 | 22.1 ± 3.1 | 0.03 b |
| Ankle dorsiflexion, deg (initial contact) | 6.8 ± 13.3 | 0.7 ± 6.6 | 0.03 b |
| Shank angle, deg (initial contact) | 10.6 ± 3.9 | 5.4 ± 3 | 0.00 b |
| Knee flexion, deg (mid-stance) | 44.4 ± 5.3 | 36.8 ± 9.6 | 0.00 b |
| Ankle dorsiflexion, deg (mid-stance) | 19.1 ± 7.9 | 16.6 ± 4 | 0.28 |
| Trunk forward lean, deg (mid-stance) | 11.1 ± 3.8 | 9.7 ± 2.9 | 0.24 |
| Contralateral pelvic drop (left), deg | 6.7 ± 2.3 | 2.5 ± 1.6 | 0.00 b |
| Contralateral pelvic drop (right), deg | 5.2 ± 2.4 | 4.1 ± 1.5 | 0.04 b |
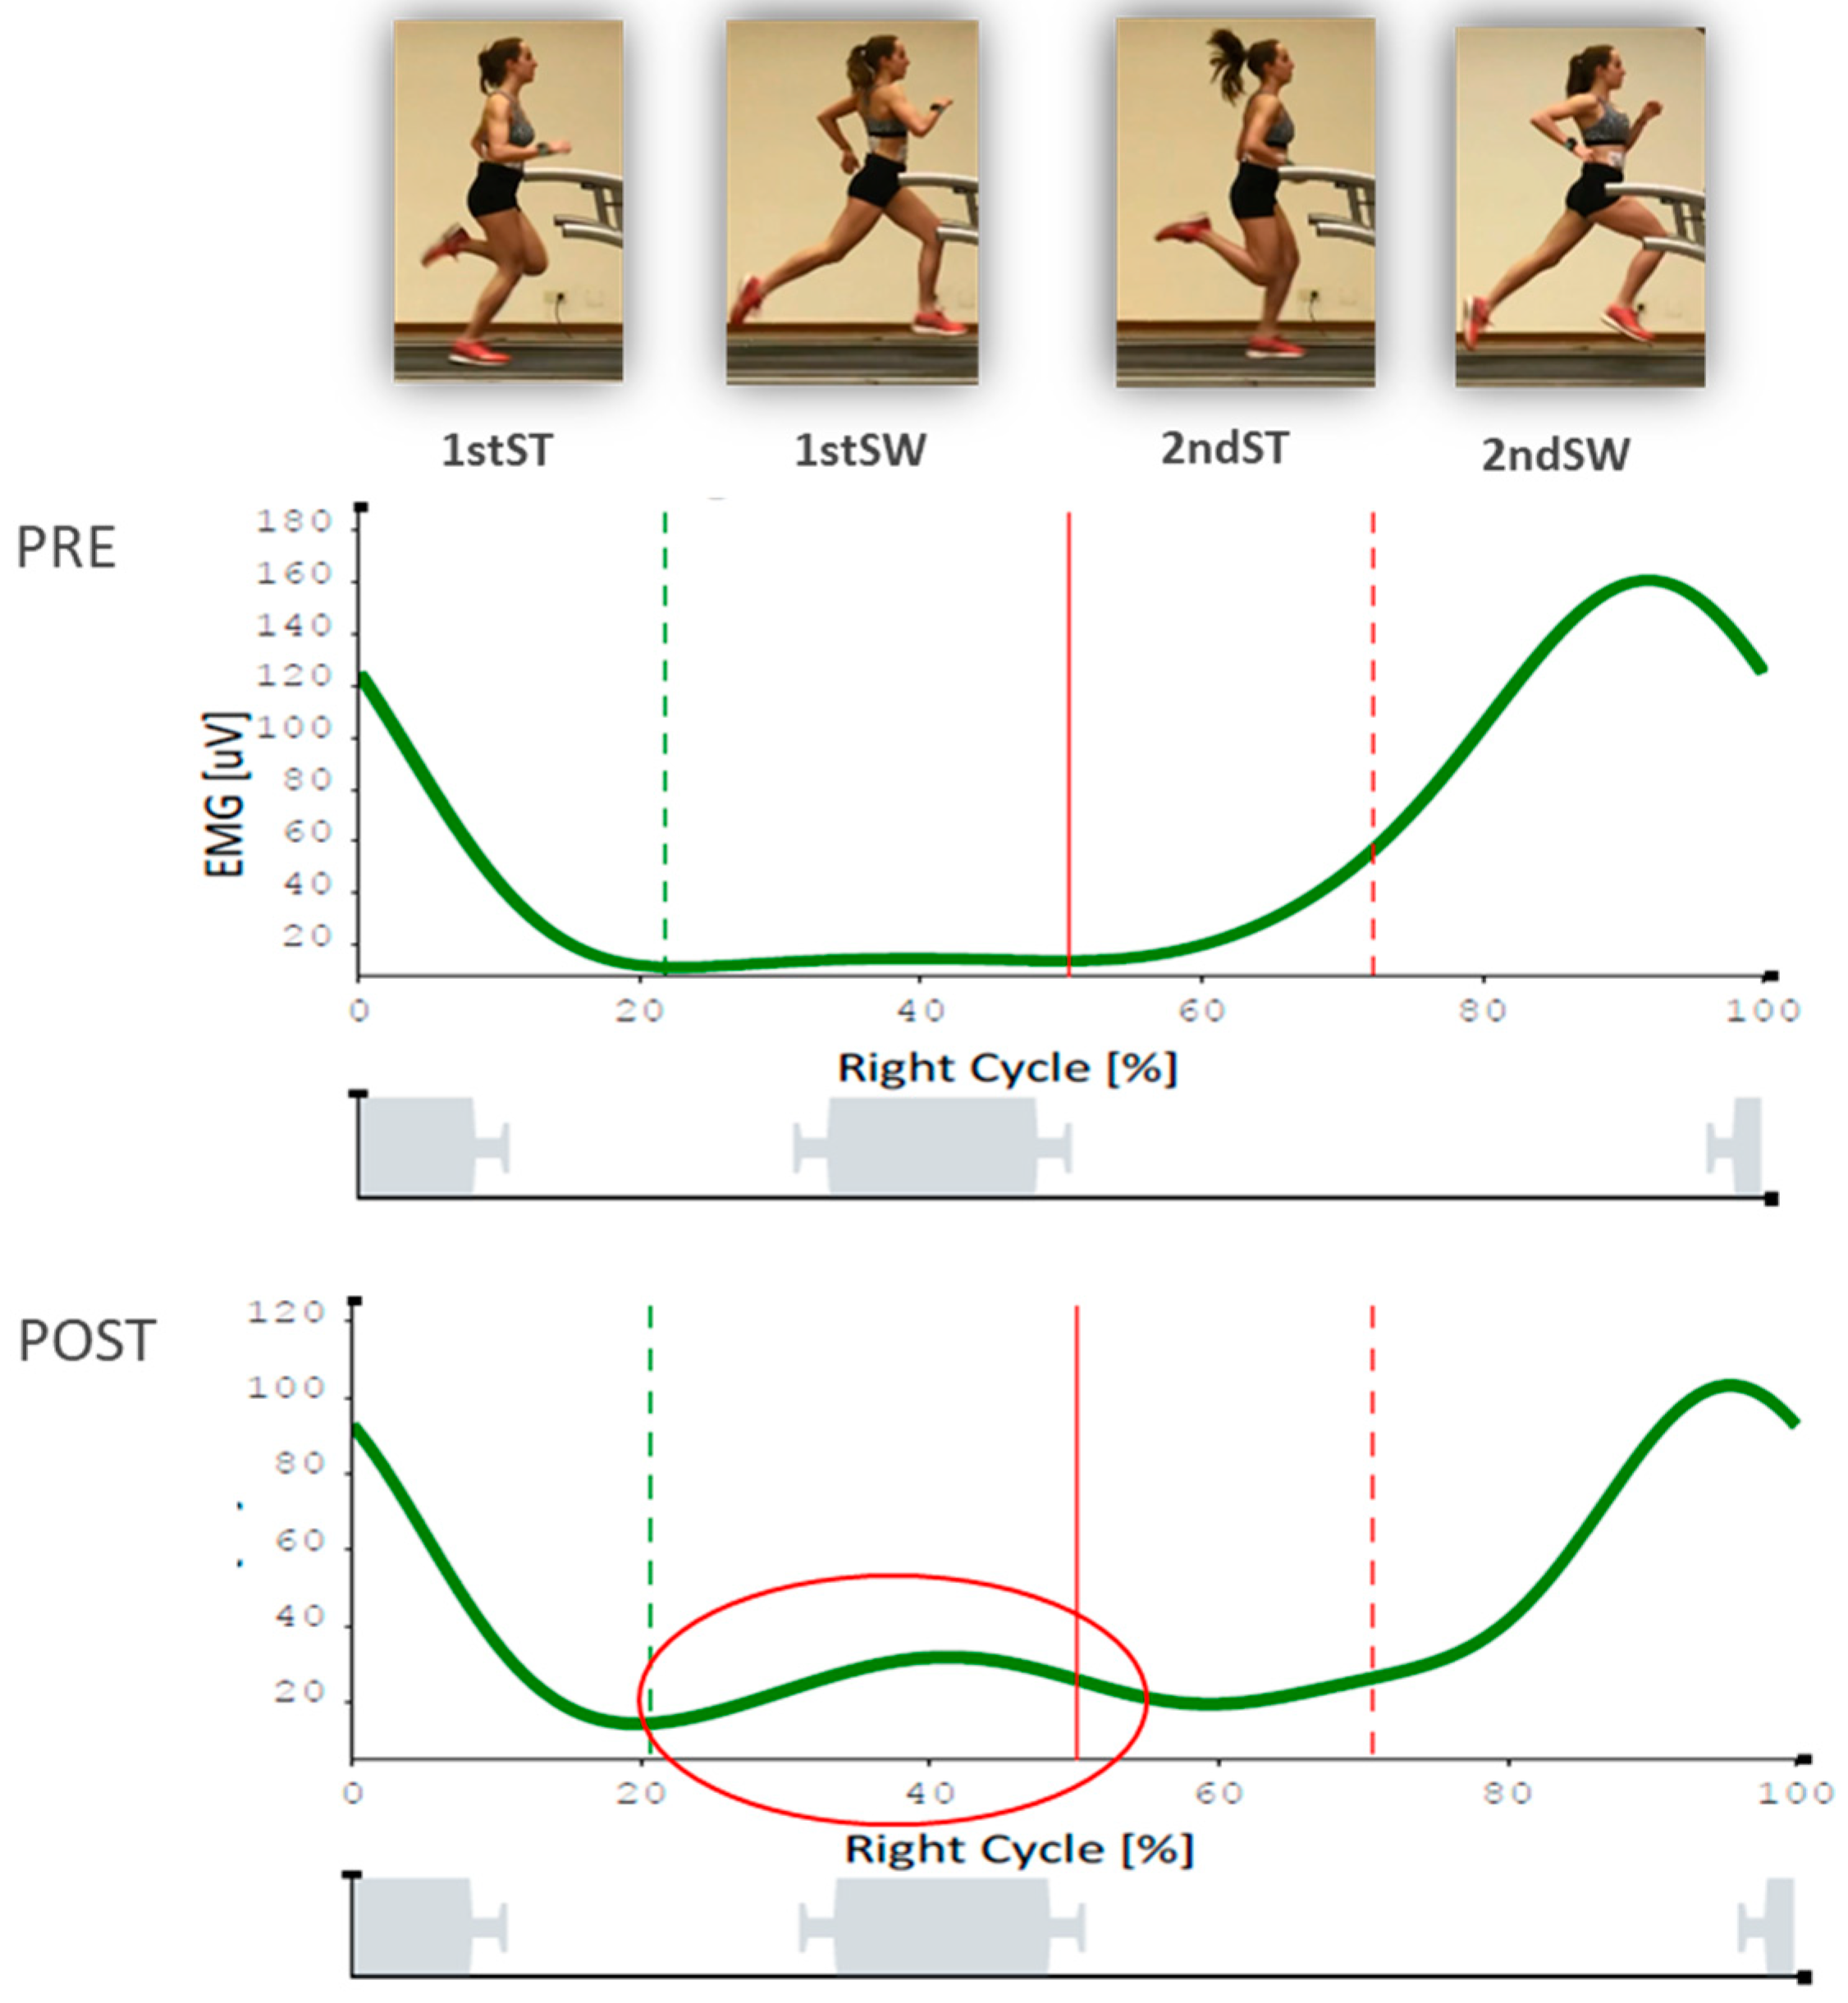
| 1stST (right), % | 52.2 ± 15.7 | 56.1 ± 26.6 | 0.6 |
| 1stSW (right), % | 57.9 ± 13.4 | 72.6 ± 23.6 | 0.01 b |
| 2ndST (right), % | 69.7 ± 14.3 | 96.6 ± 102.7 | 0.65 |
| 2ndSW (right), % | 63.4 ± 26.8 | 61.5 ± 18 | 0.68 |
| 1stST (left), % | 66.2 ± 57.4 | 46.9 ± 24.6 | 0.06 |
| 1stSW (left), % | 61.8 ± 14.2 | 69.4 ± 13.4 | 0.01 b |
| 2ndST (left), % | 80.7 ± 42 | 67 ± 23.8 | 0.46 |
| 2ndSW (left), % | 58.7 ± 11.9 | 78.6 ± 40.8 | 0.08 |
Publisher’s Note: MDPI stays neutral with regard to jurisdictional claims in published maps and institutional affiliations. |
© 2020 by the authors. Licensee MDPI, Basel, Switzerland. This article is an open access article distributed under the terms and conditions of the Creative Commons Attribution (CC BY) license (http://creativecommons.org/licenses/by/4.0/).
Share and Cite
Martínez-Gramage, J.; Albiach, J.P.; Moltó, I.N.; Amer-Cuenca, J.J.; Huesa Moreno, V.; Segura-Ortí, E. A Random Forest Machine Learning Framework to Reduce Running Injuries in Young Triathletes. Sensors 2020, 20, 6388. https://doi.org/10.3390/s20216388
Martínez-Gramage J, Albiach JP, Moltó IN, Amer-Cuenca JJ, Huesa Moreno V, Segura-Ortí E. A Random Forest Machine Learning Framework to Reduce Running Injuries in Young Triathletes. Sensors. 2020; 20(21):6388. https://doi.org/10.3390/s20216388
Chicago/Turabian StyleMartínez-Gramage, Javier, Juan Pardo Albiach, Iván Nacher Moltó, Juan José Amer-Cuenca, Vanessa Huesa Moreno, and Eva Segura-Ortí. 2020. "A Random Forest Machine Learning Framework to Reduce Running Injuries in Young Triathletes" Sensors 20, no. 21: 6388. https://doi.org/10.3390/s20216388