Letter

Analysis of Accuracy and Reliability of Different Types of GPS Receivers

Faculty of Transport, Warsaw University of Technology, Koszykowa 75, 00-662 Warsaw, Poland
*
Author to whom correspondence should be addressed.
Sensors 2020, 20(22), 6498; https://doi.org/10.3390/s20226498
Submission received: 28 October 2020 / Revised: 8 November 2020 / Accepted: 11 November 2020 / Published: 13 November 2020
(This article belongs to the Section Communications)

Abstract

:
There are several known cases of positioning error, leading to serious consequences, sometimes also deadly. Therefore, obtaining accurate position data by means of GPS receivers is paramount. With this perspective, the aim of this study was to test the within-field accuracy of different types of GPS receivers, and to determine their reliability. A proprietary software was used to determine the positioning accuracy of nine different types of satellite receivers. In addition, their reliability was investigated, by including tests aimed at measuring their positioning accuracy in field conditions. Thus, it was possible to determine the probability that these GPS receivers can be in some states (reliability). The developed software solution could be used for further research on a wider group of the same types of satellite receivers. The results of this study could lead to draft a procedure for evaluating and selecting GPS receivers, based on their quality, prior to use. This could have a paramount importance for uses in special purpose vehicles or transport telematics systems.

1. Introduction

A GNSS (Global Navigation Satellite System) must be economically viable in order to be used, and, depending on the crop operation, must achieve high values of positioning accuracy. The positioning accuracy of a GNSS is the distance between the position of a point on the Earth’s surface determined by this system and the real one [1]. The positioning accuracy of a GNSS, e.g., GPS, has also become critical for assuring the efficiency and safety of both people and cargo transportation [2,3,4,5]. There are several known cases of positioning error, leading to serious consequences, sometimes deadly ones [6]. Therefore, obtaining precise positioning information by means of GPS receivers is paramount. In this paper, a proprietary software was used to determine the positioning accuracy of different types of GPS receivers. In addition, their reliability was investigated, by including tests aimed at measuring their positioning accuracy in field conditions. The reliability of a GNSS is the probability of performing positioning without failures, in determined conditions and during a specified time interval.
The low reliability of GPS receivers and actions based on high positioning error often lead to hazardous situations [7]. Analyses of various types of damage to devices, as well as operator errors, are paramount for the safety of agricultural work [8]. Key competences in this area include the ability to determine which state of the transportation system, consisting of an operator, a GPS receiver, and a vehicle tracking device, can be perceived as either acceptable or unacceptable from the viewpoint of safety, based on the positioning accuracy. A safer transport system can be built up by increasing its reliability. This can be achieved by improving the reliability of its components or by using redundant structures [9,10]. In the former case, the ultimate goal is to prevent faults, which generates a substantial cost, both in terms of manufacturing and maintenance. In the latter case, redundant infrastructure means better tolerance of failures [11,12], through the extension of the transport system. This consequently generates significant maintenance costs [13,14]. Therefore, GPS quality, which depends on DOP (dilution of precision), the number of visible satellites (having a minimum elevation mask of 10–15°), and positioning accuracy [1,15,16] fed into a transport system including GPS receivers [17,18,19,20], is paramount. In this perspective, an original software solution for analyzing GPS data and determining their positioning accuracy has got a great value.
Positioning accuracy is, among others, the subject of paper [21], whose authors presented results of research about accuracy as a function of HDOP (horizontal DOP, related to longitude and latitude). In that study, NMEA 0183 data were used in order to measure the positioning accuracy of the analyzed GPS receivers. Two identical receivers were used to ensure the reliability of the obtained results. These results showed an almost linear relationship between the positioning accuracy and HDOP. In paper [22] the number of visible GPS and GLONASS (ru. Глобальная навигационная спутниковая система) satellites, as well as DOP, were registered under conditions of uniform distribution of GNSS satellites above the observation point, so that the number of available GNSS signals was limited during the tests. The same test was repeated but under conditions of not uniform distribution of GNSS satellites above the observation point. This research revealed how redundancy, i.e., additional satellites (more than two for determining a 2D position and more than three for sensing a 3D position), positively influence DOP (decreasing) and therefore the positioning accuracy (increasing). As a consequence of using GLONASS, the distribution of satellites above the observation point is more uniform, so that it allows the user to carry out continuous positioning under difficult conditions—something previously impossible when using only GPS. In paper [23] the authors analyzed positions from commercially available GPS receivers and concluded that the standard positioning algorithm used by GPS is inaccurate. The GNSS positioning accuracy could be improved by developing and implementing software, since achieving a better performance by means of satellite receivers using additional satellites is prohibitively expensive. Paper [24] discusses software for acquiring, analyzing, and processing multiple streams of GPS data. This software is capable of distinguishing various data and makes monitoring possible over the internet by using an IP protocol. However this software was missing an analysis of reliability, which would require a tool for determining the probability that a transportation system can assume some states (reliability), something vital from the viewpoint of assuring an efficient and safe transportation of people and cargo. The author of the paper [25] proposed a software for analyzing NMEA 0183 data streams in mobile devices such as smartphones, sending and receiving data via Bluetooth. The end results were the characteristics of the obtained datasets. While the focal point for the author of the above paper was how mobile devices support the NMEA 0183 standard via Bluetooth, at the same time this work failed in explaining GPS positioning errors. In the paper [4], authors focused on a solution for minimizing GPS positioning error, by implementing a generic software. That technique would use the received data for determining reasonably accurate positions. Although this approach could improve the positioning accuracy, it requires at least two GPS receivers whose exact location is known. The authors did not carry out any analysis of reliability of GPS receivers. Whilst the suggested solution does improve the reliability of GPS receivers as a consequence of higher redundancy, it requires the expansion of the current infrastructure at high cost (for both initial investment and subsequent maintenance). In another paper [6], the authors discussed the importance of accurate GPS data for formulating transport policy, based on the example of Belgium and the Brussels capital region. They also proposed some indicators concerning with urban transportation, which can be extracted from a wide collection of GPS trajectories of lorries. Sample data were obtained from GPS receivers mounted on lorries, as these devices had become mandatory in Belgium as part of an automated toll system introduced in 2016.
Another study [26] focused on the techniques aimed at improving the accuracy and reliability of position data, and proposed integrating GPS and BeiDou receivers. The achieved result was a higher number of visible satellites, moving along different orbits, as well as an improved positioning accuracy. That approach also increases the probability of detecting a failure of GNSS [27].
Paper [28] described a solution using four GNSS, i.e.: GPS, GLONASS, BeiDou, and EGNOS. Subsequent research revealed that such a four-constellation positioning system decreases the convergence time (convergence time is the time needed to obtain the maximum possible measurement accuracy for a given technique, counted from the moment the receiver is turned on) by 70% and improves the positioning accuracy by about 25% (compared to only GPS). Hence, that approach is correct and further research and simulations should be carried out.
Yet another technique was proposed in paper [29], i.e., an original system for simultaneously receiving L1 (1575.42 MHz) and L5 (1176.45 MHz) signal frequencies from GPS satellites. That solution is supposed to improve the positioning accuracy and reliability of GPS receivers.
When designing and implementing new solutions for integrating various GNSS, such solutions need to undergo functional and reliability tests, as described in paper [30]. That paper’s authors proposed an approach based on various hypotheses, thus allowing the integration of GPS and GLONASS, in order to increase the positioning accuracy and reliability.
Despite substantial scientific research concerning GNSS, only two approaches were considered. They were the integration of different positioning systems (GPS, GLONASS, BeiDou, and EGNOS) and the development of algorithms that would improve the accuracy and reliability of position data [31,32,33,34]. Therefore, the aim of this paper is to propose an innovative approach, involving the development of an original software, able to obtain position data and analyze the accuracy and reliability [35,36] of nine GPS receivers.
Furthermore, this paper discusses fundamental issues concerning positioning errors, by deeply analyzing GPS data. As the transportation of both people and cargo is highly based on GNSS, this key dependency could lead to the disruption of these transport systems.

2. Materials and Methods

In order to determine the positioning accuracy of the analyzed GPS receivers, first the position data needs to be obtained in a format that allows comparison and analysis. An ideal format, yielding the most accurate results, involves the simultaneous acquisition of position data from all the analyzed GPS receivers. This integration is possible, as every GPS receiver communicates with its parent device via RS 232C, USB, or Bluetooth. The position data are transmitted through NMEA 0183 standard, developed by the National Marine Electronics Association (NMEA) as a serial communications protocol between marine navigation devices such as LORAN, OMEGA, TRANSIT, and GPS receivers [37]. It defines an electrical interface, a data transmission protocol and a format of message exchange [37,38]. Every device using NMEA protocol for communication can connect and send data to multiple nodes. The standard serial transmission rate is 4800 b/s, which is more than enough for a correct communication. There are also devices operating at higher data transmission speeds. Messages are sent every second as a row of printable characters ending with a check sum. In the case of GPS receivers used as part of a transportation system, constituted by an operator and a vehicle tracking device monitoring trip parameters, the manufacturer of the GPS chip provides data in binary format.
The following commercially available and popular GPS receivers were tested—Table 1.
Because of the characteristics of Windows 10, its stability and the need for removing any Bluetooth interference, satellite receivers using a USB interface were selected. However, the software has any limitation concerning communication interfaces, and supports devices connected via USB, RS 232C, and Bluetooth. Several test sets were carried out in four positioning modes:
  • static (standalone) in an open area;
  • dynamic (real time kinematic—RTK) at minimum speed of 100 km h−1 on a dual carriage way;
  • RTK at maximum speed of 50 km h−1 in a built up area;
  • static in a built up area.

3. Results and Discussion

The GPS data, received through NMEA protocol, are suitable for processing. Most commercially available navigation software uses a map-based user interface, which provides poor information on the positioning accuracy and GPS quality but shows the number of visible satellites and the strength of signal: (weak, good, or very good). Furthermore, the above software can sometimes be more rudimentary. A utility software offers much better capabilities to determine the positioning accuracy and GPS quality of the data sensed by GPS receivers. In fact, instead of displaying the detected positions on a map, it represents all data received from GPS in NMEA protocol. An example of such a software is Visual GPS (http://www.visualgps.net/#visualgpsview-content), which allows the user to receive data in GPS format, so that they can be saved in the hard drive, decoded, and graphically represented. Unfortunately, utility software also has its limitations, such as the ability to connect only to one GPS receiver. This considerably hampers data acquisition from devices used, and decreases the reliability of the performed analysis, in terms of asynchronous recording of received data. Therefore, an original utility software called GPS Recorder (a literal translation from Polish language) (Figure 1) was developed. It is compatible with Windows 10 and is capable of collecting position data from up to nine GPS receivers.
The software allows users to connect up to nine GPS receivers, acquire data in NMEA format, save them in the hard drive, decode and plot them, based on GGA, GSA, GSV, and RMC output message sequences and basic statistical calculations, mainly concerning GPS quality and positioning accuracy (Figure 2).

3.1. Accuracy Analysis of GPS Receivers

The following commercially available and popular GPS receivers were tested: Skytraq V6, Syngio BU353 S4, Hama SiRF STAR III, Holux M-215+, and Holux GR-213. They are hereafter referred to as A, B, C, D, E, F, G, H and I in no particular order. Because of characteristics of Windows 10, its stability and the need to eliminate any Bluetooth interference, receivers using a USB interface were selected. Please note that the software itself does not have any limitations concerning communication interfaces and supports devices connecting via USB, RS232C, and Bluetooth.
Several test sets were conducted for four cases:
  • Stationary in an open area,
  • At minimum speed of 100 km/h on a dual carriageway,
  • At maximum speed of 50 km/h in a built-up area,
  • Stationary in a built-up area.
The number of satellites visible to the GPS receivers was first determined in each of the four positioning modes above. The recorded data (Figure 3) showed that the A and B receivers were superior: most satellites were visible to both of them, up to twice as many in the static positioning mode in an open area, while in the other modes they were able to see about 50% more than the other receivers. In fact, the A and B receivers are latest generation devices, using dual frequency (L1 and L2, i.e., 122,760 MHz). The higher average number of received GPS signals in the positioning modes 2, 3, and 4, compared to scenario 1, can be explained by the partial obstruction of the satellite signals by the vehicle. Substantial differences exceeding 10% (the number of satellites) in the results were observed between not only different receivers, but also devices of the same type.
During the next stage, average DOP values were analyzed and plotted on a chart (Figure 4). All receivers recorded values lower than 2 threshold, which guarantees a correct positioning. As previously, the best (lowest) values were achieved by the A and B receivers, used in static positioning mode in a built up area. Differences in the results were observed again, not only between different receivers, but also between devices of the same type. For the G and H receivers these differences were higher and exceeded 20% of DOP. Similar results were observed on the charts representing average values of HDOP (Figure 5) and VDOP (Vertical Dilution of Precision), related only to altitude (Figure 6) for the same four positioning modes. Once again, differences in the results occurred not only between different receivers, but also devices of the same type.

3.2. Reliability Analysis of GPS Receiver

After testing the above nine GPS receivers by means of GPS Recorder utility software, it could be deduced that the reliability structure is of mixed type, i.e., both serial and parallel, as outlined in Figure 7. Such an assumption was made for the needs of the analysis of the considered system consisting of the GPS Recorder software and GPS receivers. It is possible to adopt a different reliability structure if there is a redundancy of, for example, computers with GPS Recorder utility software installed.
The failure of any element of the serial branch (e.g., failure of the computer running the GPS Receiver program) switches the system from the state of full operational capability RO(t) to that of failing security QB(t). The failure of any element of the parallel branch (e.g., failure of the GPS receiver power supply, or no processing of the GPS signal by the receiver) switches the system from the state of full operational capability RO(t) to that of security threat QZB(t). Figure 8 describes the within-system relationships from the viewpoint of safety.
Designations on Figure 8:
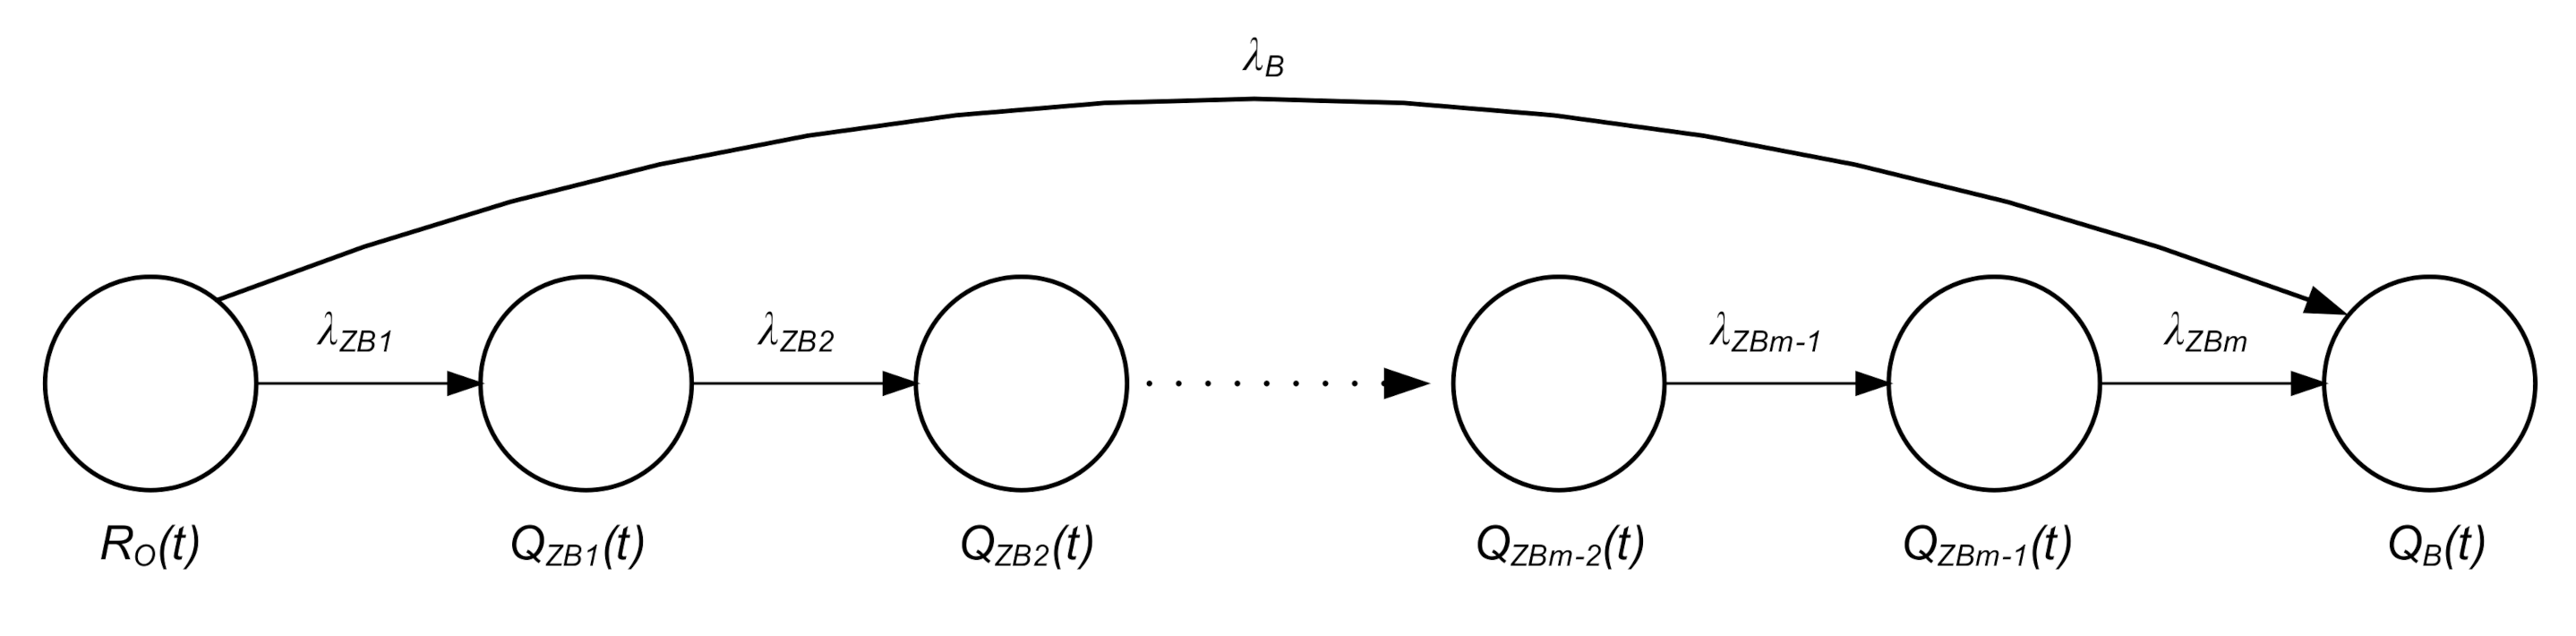
  • RO(t)—the probability function of the system in the state of full operational capability,
  • QZB(t)—the probability function of the system in the state of safety threat,
  • QB(t)—the probability function of the system in the state of safety breach,
  • λB—equivalent change rate of serial branch elements,
  • λZB—change rate of parallel branch elements.
The following formula was derived after analyzing the aggregate system shown in Figure 8.
λ B = i = 1 n λ B i
Chapman Kolmogorov equations describing the system shown in Figure 8.
R 0 ( t ) = λ B R 0 ( t ) λ Z B 1 R 0 ( t ) Q Z B 1 ( t ) = λ Z B 1 R 0 ( t ) λ Z B 2 Q Z B 1 ( t ) Q Z B 2 ( t ) = λ Z B 2 Q Z B 1 ( t ) λ Z B 3 Q Z B 2 ( t ) Q Z B m 1 ( t ) = λ Z B m 1 Q Z B m 2 ( t ) λ Z B m Q Z B m 1 ( t ) Q B ( t ) = λ B R 0 ( t ) + λ Z B m Q Z B m 1 ( t )
Given initial conditions:
R 0 ( 0 ) = 1 Q Z B 1 ( 0 ) = Q Z B 2 ( 0 ) = = Q Z B m 1 ( 0 ) = Q B ( 0 ) = 0
After applying Laplace transformation the following system of equations was obtained:
s R 0 * ( s ) 1 = λ B R 0 * ( s ) λ Z B 1 R 0 * ( s ) s Q Z B 1 * ( s ) = λ Z B 1 R 0 * ( s ) λ Z B 2 Q Z B 1 * ( s ) s Q Z B 2 * ( s ) = λ Z B 2 Q Z B 1 * ( s ) λ Z B 3 Q Z B 2 * ( s ) s Q Z B m 1 * ( s ) = λ Z B m 1 Q Z B m 2 * ( s ) λ Z B m Q Z B m 1 * ( s ) s Q B * ( s ) = λ B R 0 * ( s ) + λ Z B m Q Z B m 1 * ( s )
By using inverse transformation the following equation was obtained:
R 0 ( t ) = e ( λ B + λ Z B 1 ) t
Q Z B 1 ( t ) = λ Z B 1 [ e ( λ B + λ Z B 1 ) t e λ Z B 2 t λ Z B 2 λ B λ Z B 1 ]
Q Z B 2 ( t ) = λ Z B 1 λ Z B 2 [ e ( λ B + λ Z B 1 ) t ( λ B + λ Z B 1 λ Z B 3 ) ( λ B + λ Z B 1 λ Z B 2 ) e λ Z B 2 t ( λ B + λ Z B 1 λ Z B 2 ) ( λ Z B 2 λ Z B 3 ) + + e λ Z B 3 t ( λ Z B 2 λ Z B 3 ) ( λ B + λ Z B 1 λ Z B 3 ) ]
Q Z B m 1 ( t ) = λ Z B 1 λ Z B 2 λ Z B m 1 ( 1 ) m + 1 [ e ( λ B + λ Z B 1 ) t ( λ B + λ Z B 1 λ Z B 2 ) ( λ B + λ Z B 1 λ Z B 3 ) ( λ B 1 + λ Z B 2 λ Z B m ) + + e λ Z B 2 t ( λ Z B 2 λ B λ Z B 1 ) ( λ Z B 2 λ Z B 3 ) ( λ Z B 2 λ Z B m ) + + + e λ Z B m t ( λ Z B m λ B λ Z B 1 ) ( λ Z B m λ Z B 2 ) ( λ Z B m λ Z B m 1 ) ]
Q B ( t ) = λ B λ B + λ Z B 1 [ 1 e ( λ B + λ Z B 1 ) t ] + λ Z B 1 λ Z B 2 λ Z B m 1 λ Z B m [ ( 1 ) m ( e ( λ B + λ Z B 1 ) t ( λ B + λ Z B 1 ) ( λ B + λ Z B 1 λ Z B 2 ) ( λ B + λ Z B 1 λ Z B 3 ) ( λ B + λ Z B 1 λ Z B m 1 ) ( λ B + λ Z B 1 λ Z B m ) + + e λ Z B 2 t ( λ Z B 2 λ B λ Z B 1 ) λ Z B 2 ( λ Z B 2 λ Z B 3 ) ( λ Z B 2 λ Z B m 1 ) ( λ Z B 2 λ Z B m ) + + + e λ Z B m 1 t ( λ Z B m 1 λ B λ Z B 1 ) ( λ Z B m 1 λ Z B 2 ) ( λ Z B m 1 λ Z B 3 ) λ Z B m 1 ( λ Z B m 1 λ Z B m ) + + e λ Z B m t ( λ Z B m λ B λ Z B 1 ) ( λ Z B m λ Z B 2 ) ( λ Z B m λ Z B 3 ) ( λ Z B m λ Z B m 1 ) λ Z B m ) + + 1 ( λ B + λ Z B 1 ) λ Z B 2 λ Z B 3 λ Z B m 1 λ Z B m ]
The obtained relationships can be applied in order to determine the probability that any system consisting of m GPS receivers has to be in the state of full operational capability RO, security threat QZB, and security breach QB.
Through computer-aided simulation and calculations it is possible to determine relatively quickly how the reliability factors of the tested GPS receivers influence the whole system.
It is possible to compute the probability of each state, i.e., full operational capability RO, safety threat QZB, and safety breach QB for a system consisting of i = 9 GPS receivers. This procedure was presented in the following example.
  • Example 1
The following values describing the analyzed system were considered:
-
research time—1 year (given in hours [h]):
t = 8760 [ h ]
-
failure rate of the device using GPS Recorder utility software λB:
λ B = 1.076605930037 10 5 [ 1 h ]
-
type I GPS receiver failure rate λZB1:
λ Z B 1 = 1.076605930037 10 5 [ 1 h ]
-
type II GPS receiver failure rate λZB2:
λ Z B 2 = 9.51844850902409 10 6 [ 1 h ]
-
type III GPS receiver failure rate λZB3:
λ Z B 3 = 8.2843256660771 10 6 [ 1 h ]
-
type IV GPS receiver failure rate λZB4:
λ Z B 4 = 7.06340225092323 10 6 [ 1 h ]
-
type V GPS receiver failure rate λZB5:
λ Z B 5 = 5.85539890268842 10 6 [ 1 h ]
-
type VI GPS receiver failure rate λZB6:
λ Z B 6 = 4.66004503655881 10 6 [ 1 h ]
-
type VII GPS receiver failure rate λZB7:
λ Z B 7 = 3.47707847998956 10 6 [ 1 h ]
-
type VIII GPS receiver failure rate λZB8:
λ Z B 8 = 2.30624512757072 10 6 [ 1 h ]
-
type IX GPS receiver failure rate λZB9:
λ Z B 9 = 1.14729861341341 10 6 [ 1 h ]
According to dependencies (5 ÷ 9) for research time t = 8760 [h] the probability of the system in the particular state is given by:
-
in the state of full operational capability RO(t):
R 0 ( t ) = 0.9009
-
in the state of safety threat QZB1(t):
Q Z B 1 ( t ) = 0.0858620089045631
-
in the state of safety threat QZB2(t):
Q Z B 2 ( t ) = 0.00360517529559324
-
in the state of safety threat QZB3(t):
Q Z B 3 ( t ) = 8.77547595242873 10 5
-
in the state of safety threat QZB4(t):
Q Z B 4 ( t ) = 1.36543510888452 10 6
-
in the state of safety threat QZB5(t):
Q Z B 5 ( t ) = 1.40868180519132 10 8
-
in the state of safety threat QZB6(t):
Q Z B 6 ( t ) = 9.64790335381539 10 11
-
in the state of safety threat QZB7(t):
Q Z B 7 ( t ) = 4.19120993840803 10 13
-
in the state of safety threat QZB8(t):
Q Z B 8 ( t ) = 5.68497094181757 10 14
-
in the state of safety threat QZ(t):
Q B ( t ) = 0.00954368142145555
-
The reliability of the whole system is given by:
R S ( t ) = R 0 ( t ) + 1 8 Q Z B i ( t ) = 0.990456319
The obtained RS value is significantly higher than R0 and is valid for purposes of whole system analysis. The derived relationships were verified through completed calculations and validated in order to analyze and compare different types of integrated GNSS.

4. Conclusions

Popular and commercially available GPS receivers were used for this research. Although they are widely considered as accurate and reliable devices, there is little to substantiate this opinion, besides the common wisdom and brand reputation. There is no mechanism and, above all, no available software that allows users to objectively compare GPS receivers by the quality, stability, and reliability of information position data they provide. Now, such comparison is possible, by using GPS Recorder utility software that was developed for the purposes of this research. The acquired data proved correct the assumption that the best quality parameters were offered by the A and B receivers using dual frequency (L1/L2) satellite signals. They acquired the most satellites and offered the lowest DOP, HDOP, and VDOP values. However, under real operating conditions, the most similar to those of GPS receivers (i.e., driving in an open area and in a built-up area), the observed differences were much lower. In the case of driving at 100 km h−1 and more, they were practically negligible. In the case of single frequency (L1) receivers, the obtained results were comparable but also different enough to identify the E and F receivers as superior. At the same time, it can be concluded that differences were found both between different types of GPS receivers and devices of the same type.
Based on the reliability tests of nine GPS receivers, carried out by means of the above original utility software, it is advisable to use lower class devices in parallel configuration and analyze the NMEA data in the software itself.
These conclusions not only substantiate the validity of the undertaken research, but also drive their next directions. The developed software solution could well be used for further research on a wider group of same types of GPS receivers. The results of this study could lead to the draft of a procedure for evaluating and selecting GPS receivers, based on their quality, prior to use. This could have a paramount importance for uses in special purpose vehicles or transport telematics systems.

Author Contributions

Conceptualization, M.R., Z.K. and A.R.; methodology, M.R., A.R.; software, M.R.; validation, M.R.; formal analysis, A.R., Z.K.; investigation, M.R., Z.K. and A.R.; resources, M.R.; data curation, M.R., Z.K. and A.R.; writing—original draft preparation, Z.K.; writing—review and editing, Z.K. All authors have read and agreed to the published version of the manuscript.

Funding

This research received no external funding.

Conflicts of Interest

The authors declare no conflict of interest.

References

  1. Catania, P.; Comparetti, A.; Febo, P.; Morello, G.; Orlando, S.; Roma, E.; Vallone, M. Positioning accuracy comparison of GNSS receivers used for mapping and guidance of agricultural machines. Agronomy 2020, 10, 924. [Google Scholar] [CrossRef]
  2. Siergiejczyk, M.; Krzykowska, K.; Rosiński, A.; Grieco, L.A. Reliability and Viewpoints of Selected ITS System. In Proceedings of the 25th International Conference on Systems Engineering ICSEng 2017, Las Vegas, NV, USA, 22–24 August 2017; IEEE, Conference Publishing Services (CPS): Washington, DC, USA, 2017; pp. 141–146. [Google Scholar]
  3. Losurdo, F.; Dileo, I.; Siergiejczyk, M.; Krzykowska, K.; Krzykowski, M. Innovation in the ICT Infrastructure as a Key Factor in Enhancing Road Safety: A Multi-Sectoral Approach. In Proceedings of the 25th International Conference on Systems Engineering ICSEng 2017, Las Vegas, NV, USA, 22–24 August 2017; IEEE Computer Society Conference Publishing Services (CPS): Washington, DC, USA, 2017; pp. 157–162. [Google Scholar]
  4. Fan, J.; Fu, C.; Stewart, K.; Zhang, L. Using big GPS trajectory data analytics for vehicle miles traveled estimation. Transp. Res. Part C Emerg. Technol. 2019, 103, 298–307. [Google Scholar]
  5. Jacyna, M.; Żak, J.; Gołębiowski, P. The EMITRANSYS model and the possibilities of its application for the analysis of the development of sustainable transport systems. Combust. Engines 2019, 179, 243–248. [Google Scholar]
  6. Hadavi, S.; Verlinde, S.; Verbeke, W.; Macharis, C.; Guns, T. Monitoring Urban-Freight Transport Based on GPS Trajectories of Heavy-Goods Vehicles. IEEE Trans. Intell. Transp. Syst. 2018, 20, 3747–3758. [Google Scholar] [CrossRef]
  7. Laskowski, D.; Łubkowski, P.; Pawlak, E.; Stańczyk, P. Anthropotechnical Systems Reliability. In Safety and Reliability: Methodology and Applications, Proceedings of the European Safety and Reliability Conference ESREL, Zurich, Switzerland, 7–10 September 2015; Taylor & Francis Group: London, UK, 2015; pp. 399–407. [Google Scholar]
  8. Nowakowski, T. Problems of reliability modelling of multiple-phased systems. Eksploat. I Niezawodn. Maint. Reliab. 2011, 4, 79–84. [Google Scholar]
  9. Duer, S.; Duer, R.; Mazuru, S. Determination of the expert knowledge base on the basis of a functional and diagnostic analysis of a technical object. Rom. Assoc. Nonconv. Technol. 2016, 2, 23–29. [Google Scholar]
  10. Duer, S.; Zajkowski, K.; Duer, R.; Paś, J. Designing of an effective structure of system for the maintenance of a technical object with the using information from an artificial neural network. Neural Comput. Appl. 2012, 23, 913–925. [Google Scholar] [CrossRef]
  11. Rychlicki, M.; Kasprzyk, Z. Increasing Performance of SMS Based Information Systems. In Proceedings of the Ninth International Conference on Dependability and Complex Systems DepCoS-RELCOMEX, Brunów, Poland, 30 June–4 July 2014; Springer: Cham, Switzerland, 2014; pp. 373–382. [Google Scholar]
  12. Cybulski, R.; Wilczewski, G.; Perlicki, K. Theoretical and experimental verification of polarization pulling for G.652 fiber. Opt. Quantum Electron. 2020, 52, 1–20. [Google Scholar] [CrossRef]
  13. Siergiejczyk, M.; Krzykowska, K.; Rosiński, A. Reliability Assessment of Integrated Airport Surface Surveillance System. In Proceedings of the Tenth International Conference on Dependability and Complex Systems DepCoS-RELCOMEX, Brunów, Poland, 29 June–3 July 2015; Springer: Cham, Switzerland, 2015; pp. 435–443. [Google Scholar]
  14. Siergiejczyk, M.; Rosiński, A.; Krzykowska, K. Reliability Assessment of Supporting Satellite System EGNOS. In New Results in Dependability and Computer Systems; Springer: Cham, Switzerland, 2013; pp. 353–364. [Google Scholar]
  15. Kozuba, J.; Jafernik, H.; Krasuski, K. Utilization of the PPP Method for the Aircraft Position Determination Using Code Observations in GPS System. In Proceedings of the 16th International Multidisciplinary Scientific GeoConference SGEM, Albena, Bulgaria, 30 June–6 July 2016; SGEM: Sofia, Bulgaria, 2016; pp. 945–956. [Google Scholar]
  16. Kozuba, J.; Krasuski, K.; Ćwiklak, J.; Jafernik, H. Aircraft position determination in SBAS System in air transport. In Proceedings of the 17th International Conference Engineering for Rural Development, Jelgava, Latvia, 23–25 May 2018. [Google Scholar]
  17. Kasprzyk, Z.; Rychlicki, M. Analysis of Physical Layer Model of WLAN 802.11g Data Transmission Protocol in Wireless Networks used by Telematic Systems. In Proceedings of the Ninth International Conference Dependability and Complex Systems DepCoS-RELCOMEX, Brunów, Poland, 30 June–4 July 2014; Springer: Cham, Switzerland, 2014; pp. 265–274. [Google Scholar]
  18. Rychlicki, M.; Kasprzyk, Z.; Jaśkiewicz, K. Optimisation of the Municipal Waste Collection Process in a Small Size and Scarcely Populated Municipality. J. Konbin 2018, 45, 227–246. [Google Scholar] [CrossRef] [Green Version]
  19. Zalewski, P. Integrity Concept for Maritime Autonomous Surface Ships’ Position Sensors. Sensors 2020, 20, 2075. [Google Scholar] [CrossRef] [PubMed] [Green Version]
  20. Kim, J.; Park, M.; Bae, Y.; Kim, O.-J.; Kim, D.; Kim, B.; Kee, C. A Low-Cost, High-Precision Vehicle Navigation System for Deep Urban Multipath Environment Using TDCP Measurements. Sensors 2020, 20, 3254. [Google Scholar] [CrossRef] [PubMed]
  21. Banachowicz, A.; Bober, R.; Szewczuk, T.; Wolski, A. Badanie wpływu geometrii systemu na dokładność określania pozycji za pomocą odbiornika GPS. Zesz. Nauk. Akad. Mar. Wojennej 2008, 4, 15–24. [Google Scholar]
  22. Maciuk, K. Współczynniki DOP w obserwacjach GNSS. Bud. I Archit. 2015, 14, 65–72. [Google Scholar] [CrossRef]
  23. Yuichiro, K.; Toshiyuki, T. Improvements in Accurate GPS Positioning Using Time Series Analysis. In Proceedings of the SICE Annual Conference, Taipei, Taiwan, 18–21 August 2010; Society of Instrument and Control Engineers: Tokyo, Japan, 2010; pp. 282–285. [Google Scholar]
  24. Chamorro, H.R.; Cruz, A.M.; Niño, F.; Ferro, R.; Gomez, E.; Cantor, E.L. GPS Data Analysis and Acquisition Software over IP Platform. In Proceedings of the WAMICON 2011 Conference Proceedings, Clearwater Beach, FL, USA, 18–19 April 2011; IEEE: New York, NY, USA; pp. 1–4. [Google Scholar]
  25. Coleman, R. A Self-Healing Plug-in Parser for NMEA Streams. In Proceedings of the Fifth International Conference on Information Technology: New Generations, Las Vegas, NV, USA, 7–9 April 2008; IEEE: New York, NY, USA, 2008; pp. 1023–1027. [Google Scholar]
  26. Wu, Y.; Wang, J.; Yang, Z.; Yang, L.; Sun, G. Reliability and Separability Analysis of Integrated GPS/BDS System. In Proceedings of the China Satellite Navigation Conference (CSNC) 2016 Proceedings, Changsha, China, 18–20 May 2016; Springer: Singapore, 2016; pp. 165–175. [Google Scholar]
  27. Bridgelall, R.; Tolliver, D. Accuracy Enhancement of Anomaly Localization with Participatory Sensing Vehicles. Sensors 2020, 20, 409. [Google Scholar] [CrossRef] [PubMed] [Green Version]
  28. Li, X.; Ge, M.; Dai, X.; Ren, X.; Fritsche, M.; Wickert, J.; Schuh, H. Accuracy and reliability of multi-GNSS real-time precise positioning: GPS, GLONASS, BeiDou, and Galileo. J. Geod. 2015, 89, 607–635. [Google Scholar] [CrossRef]
  29. La Valle, R.L.; García, J.G.; Roncagliolo, P.A. A Dual-Band RF Front-End Architecture for Accurate and Reliable GPS Receivers. In Proceedings of the IEEE/MTT-S International Microwave Symposium—2018, Philadelphia, PA, USA, 10–15 June 2018; IEEE: New York, NY, USA; pp. 995–998. [Google Scholar]
  30. Bang, E.; Milner, C.; Macabiau, C.; Estival, P. Preliminary Integrity Assessment for GPS/GLONASS RAIM with Multiple Faults. In Proceedings of the IEEE/ION Position, Location and Navigation Symposium PLANS 2018, Monterey, CA, USA, 23–26 April 2018; IEEE: New York, NY, USA; pp. 327–335. [Google Scholar]
  31. Li, N.; Zhao, L.; Li, L.; Jia, C. Integrity monitoring of high-accuracy GNSS-based attitude determination. GPS Solut. 2018, 22, 120. [Google Scholar] [CrossRef]
  32. Hsu, L.T.; Gu, Y.; Kamijo, S. 3D Building Model-Based Pedestrian Positioning Method Using GPS/GLONASS/QZSS and its Reliability Calculation. GPS Solut. 2016, 20, 413–428. [Google Scholar] [CrossRef]
  33. Woodard, D.; Nogin, G.; Koch, P.; Racz, D.; Goldszmidt, M.; Horvitz, E. Predicting Travel Time Reliability Using Mobile Phone GPS Data. Transp. Res. Part C Emerg. Technol. 2017, 75, 30–44. [Google Scholar] [CrossRef]
  34. Krzykowska, K.; Krzykowski, M. Forecasting Parameters of Satellite Navigation Signal through Artificial Neural Networks for the Purpose of Civil Aviation. Int. J. Aerosp. Eng. 2019, 2019, 7632958. [Google Scholar] [CrossRef]
  35. Siergiejczyk, M.; Paś, J.; Rosiński, A. Issue of reliability–exploitation evaluation of electronic transport systems used in the railway environment with consideration of electromagnetic interference. IET Intell. Transp. Syst. 2016, 10, 587–593. [Google Scholar] [CrossRef]
  36. Caban, D.; Walkowiak, T. Dependability Analysis of Hierarchically Composed System-of-Systems. In Proceedings of the Thirteenth International Conference on Dependability and Complex Systems DepCoS-RELCOMEX, Brunów, Poland, 2–6 June 2018; Springer: Cham, Switzerland, 2019; pp. 113–120. [Google Scholar]
  37. VisualGPS™ Software and Services. Available online: http://www.visualgps.net/#visualgpsview-content (accessed on 20 February 2020).
  38. Lin, J.; Chang, C.; Peng, J.; Tung, M.; Liu, C. Evolving GPS position correction function using genetic programming. In Proceedings of the 6th International Conference on Soft Computing and Intelligent Systems, and the 13th International Symposium on Advanced Intelligence Systems, Cairo, Egypt, 1–3 September 2012; Springer: Cham, Switzerland, 2012; pp. 136–140. [Google Scholar]
  39. Rosinski, A. Design of the Electronic Protection Systems with Utilization of the Method of Analysis of Reliebility Structures. In Proceedings of the 2008 19th International Conference on Systems Engineering, Las Vegas, NV, USA, 19–21 August 2008; IEEE: Las Vegas, NV, USA; pp. 421–426. [Google Scholar]
Figure 1. Home screen of GPS Recorder utility software.
Sensors 20 06498 g001
Figure 2. Statistical data screen of GPS Recorder utility software.
Sensors 20 06498 g002
Figure 3. Average number of visible satellites in four positioning modes.
Sensors 20 06498 g003
Figure 4. Average value of dilution of precision (DOP) in four positioning modes.
Sensors 20 06498 g004
Figure 5. Average value of horizontal DOP (HDOP) in four positioning modes.
Sensors 20 06498 g005
Figure 6. Average value of VDOP in four positioning modes.
Sensors 20 06498 g006
Figure 7. General reliability scheme of GPS receivers (Adapted from [39]).
Sensors 20 06498 g007
Figure 8. Within-system relationships from the viewpoint of safety (Adapted from [39]).
Sensors 20 06498 g008
Table 1. GPS Receivers Specification.
ParametersSkytraq V6Syngio BU353-S4HamaHolux M-215+Holux GR-213
ChipsetVenus V6SiRF StarIVSiRF StarIIIMTK MT3333 GPS/GLONASS chipsetSiRF StarIII
Receiver TypeL1, C/A code
51-channel acquisition
14-channel tracking
L1, 1575.42 MHZ
48 all-in-view tracking
L1,
up to 20 satellites
L1, 1575.42 MHz
66 parallel searching, 22 tracking channels
L1,
up to 20 satellites
C/A CodeN/A1.023 MHzN/A1.023 MHzN/A
Maximum Update Rate10 Hz1 Hz1 Hz1 Hz1 Hz
AccuracyPosition 2.5 m CEP
Velocity 0.1 m/s
Time 250 ns
< 2.5 m 2D RMS SBAS Enabledup to 2 m (WAAS)Non DGPS (Differential GPS): Position: 3.0 m CEP excluding SA Velocity: 0.1m/s.
Interval: 0.1 µs to Sync GPS
DGPS (EGNOS/WAAS/
MSAS): 2.5 M
Non DGPS (Differential GPS)
Position 5–25 m CEP without SA
Velocity 0.1 m/s, without SA
Time 1 μs sync GPSTime
EGNOS/WAAS:
Position
< 2.2 m, horizontal 95% of time
< 5 m, vertical 95% of time
Time To First FixHot-Start < 1 s
Warm-Start 25 s average
Cold-Start 29 s average
Hot-Start 1 s average
Warm-Start 35 s average
Cold-Start 35 s average
Hot-Start < 1 s
Warm-Start 35 s
Cold-Start 42 s
Hot-Start 1 s
Warm-Start 30 s
Cold-Start 31 s
Hot-Start 1 s
Warm-Start 38 s
Cold-Start 42 s
Sensitivity−161 dBm−163 dBm−159 dBm−165 dBm−159 dBm
ProtocolNMEA-0183 v3.01
Secondary: SkyTraq Binary
NMEA0183 Secondary: SiRFbinaryNMEA-0183 v.3.00NMEA-0183 v3.01NMEA-0183 v2.2
InterfaceUSB 2.0USB 2.0USB 2.0USB 2.0USB 2.0
Supply Voltage1.2 V, 3.3 V5.5 V (USB)5.5 V (USB)5.5 V (USB)5.5 V (USB)
Current ConsumptionAcquisition ~50 mA
Tracking ~23 mA
55 mA MaximumN/AN/AN/A
Operating Temperature−40 °C~85 °C−40 °C~85 °C−40 °C~85 °C−10 °C~65 °C−10 °C~65 °C
Dimension38.0 × 40.5 × 12.3 mm53.0 × 19.2 mm45.0 × 37.0 × 20.0 mm64.5 × 42 × 17.8 mm64.5 × 42 × 17.8 mm
WeightN/A62.37 g70.0 g84.0 g84.0 g
Publisher’s Note: MDPI stays neutral with regard to jurisdictional claims in published maps and institutional affiliations.

