Letter

Application of Near-Infrared Spectroscopy to Investigate Some Endogenic Properties of Pleurotus ostreatus Cultivars

by
Marietta Fodor
1,*,
Erika Etelka Mikola
1,
András Geösel
2,
Éva Stefanovits-Bányai
1 and
Zsuzsanna Mednyánszky
3
1
Institute of Food Quality, Safety and Nutrition, Department of Applied Chemistry, Faculty of Food Science, Szent István University, Villányi str 29-43, H-1118 Budapest, Hungary
2
Institute of Sustainable Horticulture, Department of Vegetable and Mushroom Growing, Faculty of Horticulture Science, Szent István University, Villányi str 29-43, H-1118 Budapest, Hungary
3
Institute of Food Quality, Safety and Nutrition, Department of Food Chemistry and Nutrition, Faculty of Food Science, Szent István University, Somlói út 14-16, H-1118 Budapest, Hungary
*
Author to whom correspondence should be addressed.
Sensors 2020, 20(22), 6632; https://doi.org/10.3390/s20226632
Submission received: 12 October 2020 / Revised: 15 November 2020 / Accepted: 17 November 2020 / Published: 19 November 2020

Abstract

:
Fourteen different Pleurotus ostreatus cultivars (Po_1–Po_14) were tested for free amino acid content (fAA), total polyphenol content (TPC), and antioxidant capacity (Ferric Reducing Ability of Plasma—FRAP) to select the cultivars with the most favorable traits. Automatic amino acid analyzer (fAA) and spectrophotometric assay (TPC, FRAP) results as well as Fourier-transform near infrared (FT-NIR) spectra were evaluated with different chemometric methods (Kruskal–Wallis test, Principal Component Analysis—PCA, Linear Discriminant Analysis—LDA). Based on total free amino acid concentrations and FRAP values, the Po_2 cultivar was found to be the most favorable. Types Po_3, Po_8, Po_10 and Po_12 were separated using PCA. Based on the spectral profile, they may contain polyphenols and reducing compounds of different qualities. LDA classification that was based on the concentrations of all free amino acids, cysteine, and proline of the cultivars was performed with an accuracy of over 90%. LDA classification that was based on the TPC and FRAP values was performed with an accuracy of over 83%.

1. Introduction

New challenges in food science aim to provide a scientific basis for modern food production, in particular with regard to current nutritional needs, consumer health protection and environmentally friendly techniques.
The scientific investigations are based on state-of-the-art analytical research, bearing in mind the beneficial physiological effects of endogenous components with reducing properties that exceed the body’s energy and nutrient requirements [1].
Due to the increasing consumer demand for bioactive mushrooms, it is necessary to grow resistant varieties in which the macronutrients and antioxidant components essential for vital functions are present in sufficient amounts [2,3,4].
The most widely consumed mushroom in the world is Agaricus bisporus, followed by Pleurotus spp. and Lentinula edodes. They are easy to grow and have a high nutritional value [1]. Pleurotus mushrooms are healthy foods, low in calories and in fat, rich in protein, carbohydrates, chitin, minerals (calcium, phosphorus, iron) and vitamins (thiamin, riboflavin and niacin) They also contain high amounts of γ-aminobutyric acid (GABA) and ornithine [5].
The bioactive compounds of mushrooms are responsible for antioxidant, radical scavenging, antiviral and antibacterial properties. Examples of such bioactive compounds are polysaccharides, dietary fiber, and antioxidants (vitamins C, B12 and D; folate; tocopherols, ergothioneine, carotenoids and polyphenols). Synergistic effect of these molecules may stimulate the free radical scavenging activity of these mushrooms [6]. Reducing components (phenolics and polyphenolics) [7,8] of mushrooms are formed during secondary metabolic processes that inhibit or delay the effects of oxidative damage and are involved in protection against free radicals [9,10,11].
Near-infrared (NIR) analysis is a dynamically evolving, effective method for biological material characterization, owing to its rapidity, non-destructive nature, and low requirements with respect to sample preparation.
NIR spectroscopy is applied not only for quality control (QC) but also in process analytical technology (PAT) in various fields, such as in agriculture, in the food industry, in investigation of bioactive materials, in the pharmaceutical industry, and in the medical industry.
Molecule groups containing hydrogen (such as C–H, O–H, C=O, and N–H bonds) are infra-active; they will have a measurable NIR spectrum, resulting in a large range of organic materials suitable for NIR analysis in the NIR wavenumber regions (12,500–3800 cm−1) [12].
In the case of horticultural samples, it is particularly advantageous that NIR spectroscopy is also suitable for the direct analysis of solid samples. In the case of horticultural samples, it is particularly advantageous that NIR spectroscopy is also suitable for the direct analysis of solid samples. In most cases, only drying is used as sample preparation. This is necessary because the moisture content of horticultural samples is high and a very significant signal of water is given in the wavenumber range of 5200–5150 cm−1 (combination of O–H stretch and O–H deformation, O–H bend second overtone) and 6900–6800 cm−1 (O–H stretch first overtone) [13].
The methods of characterization of the species Pleurotus ostreatus are summarized in Table 1.
Due to growing consumer demand, there is an increasing emphasis on the cultivation of mushroom cultivars in which essential macro-components, polyphenols, and antioxidant components are present in appropriately high amounts [2,3,4].
The aim of our research was to offer mushroom growers a fast, inexpensive, non-destructive analytical method to select the cultivar with the most favorable properties for all free amino acids, TPC and FRAP values.

2. Materials and Methods

2.1. Materials

The processed and analyzed samples were from a mushroom breeding program. Different interspecific hybrids of Pleurotus ostreatus species were used for cultivation. The lack of available gene sources of the taxa leads to novel hybrids which are usually closely related. The mushroom mycelia were mixed into pasteurized wheat-straw based compost and cultivated indoors. After 16 days of spawn-running (25–26 °C compost temperature; 87–92% relative humidity (RH); 6000–8000 ppm CO2) the mushroom bags were cooled down to 17–18 °C with <1000 ppm of CO2 in air at 85–88% RH [31]. Depending on the mushroom strains used, 22–28 days later at spawning mushroom fruit bodies were harvested at ’medium’ stage [32] and processed immediately. All the mushroom samples were cultivated under same environmental parameters and harvested at same stage, so any of the differences in their chemical composition might be a result of their genetically distance.
The 14 varieties were cultivated at the same time and under the same conditions. The cultivation experiment was repeated at three consecutive time points. The harvested mushrooms were picked at the same phenological stage. A total of 250–300 g of fresh mushroom from the first flush was prepared for chemical measurements. Each sample was divided into three parts, so we had three parallel samples from each cultivation experiment. After repeating the cultivation experiments, we finally had nine samples from the same cultivars. Altogether, 126 samples were processed during the experiments. The averages of the parallel samples of each cultivars were taken into account in the statistical evaluation.
All reagents (high purity analytical reagents) were ordered from Reanal (Budapest, Hungary). Ultra-pure water (18.2 MΩ cm) was purchased from a Milli-Q system from Merck Millipore (Milford, MA, USA)

2.2. Methods

2.2.1. Sample Preparation

The samples were dried under gentle conditions (60 °C; 19 h) in an air-conditioned oven (Memmert, Schwabach, Germany) and then ground to a particle size < 315 μm (Bosch TSM6A017C, Bosch GMbH, Stuttgart, Germany).
All our measurements were performed with the dried samples.

2.2.2. Free Amino Acid Content (fAA)

The samples in three parallels (100 mg dried mushroom) were extracted with 5 mL cold 10% trichloroacetic acid (TCA) for 1 h on a shaker (Laboshake LS 500i, C. Gerhardt GmbH & Co. KG, Germany). Afterwards, the samples were filtered through a 0.2 μm pore membrane filter (Sartorius AG, Germany) and stored at −20 °C. The determination of different amino acids was accomplished with an automatic amino acid analyzer (Amino Acid Analyzer AAA400, Ingos Ltd., Praha, Czech Republic) furnished with an Ostion LCP5020 cation-exchange column (200 × 3.7 mm). They were separated by stepwise gradient elution using an Li–citric buffer system. At the end, the colorimetric detection was computed after post-column derivatization with ninhydrin reagent at 570 and 440 nm.

2.2.3. Total Polyphenol Content (TPC)

The dried, ground samples were water-extracted, filtered, and stored at −26 °C. Total polyphenol content (TPC) was determined by the method of Singleton and Rossi with Folin–Ciocâlteu reagent [33].
The measurements were performed at pH = 10.0. The color change during the Mo(VI) yellow → Mo(V) blue redox reaction was detected spectrophotometrically (λ = 760 nm). At the applied wavelength, the light-absorbance of interfering components are negligible. The results were expressed as gallic acid equivalent (μmol GAE/g dry matter). The method is suitable to determine the total polyphenol content, but unsuitable to individual components determination.

2.2.4. Antioxidant Capacity (Ferric Reducing Ability of Plasma—FRAP)

The dried, ground samples were water-extracted, filtered, and stored at −26 °C.
The total antioxidant capacity of the different extracts was measured by the FRAP method of Benzie and Strain [34]. According to the measurement principles, the ferric-2,4,6-tris(2-pyridyl)-S-triazine (TPTZ) complexes were reduced by reductive compounds in a pH = 3.6 environment. The reaction causes a blue color shift, detectable spectrophotometrically at λ = 593 nm. The results were expressed as ascorbic acid equivalent (µmol AAE/g dry matter).

2.2.5. Fourier-Transform Near Infrared Spectroscopy (FT-NIR)

The dried, ground samples were subsequently measured with a rotatable quartz sample-container (d = 85 mm, 2 cm thick layer) on a Bruker MPA Multipurpose FT-NIR analyzer (Bruker Optik GmbH, Ettlingen, Germany). Spectra were collected in the 12,500–3800 cm−1 range using OPUS 7.2 (Bruker Optik GmbH, Ettlingen, Germany) software. Absorption spectra were recorded in diffuse reflectance mode. The resolution was 8 cm−1. The scanner speed was 10 kHz and each spectrum was the average spectrum of 32 subsequent scans. The internal background was measured using the integrated gold-coated surface of the integrating sphere. Five spectra were recorded for each sample. During the recordings, the dried, ground sample was mixed in the sample holder.

2.3. Chemometrics

2.3.1. Kruskal–Wallis Test

The Kruskal–Wallis H test is a rank-based nonparametric test that can be used to determine whether there are statistically significant differences between three or more groups of an independent variable on a continuous or ordinal dependent variable.
The test does not identify where the differences occur or how many differences actually occur. Therefore, a test procedure for making pair-wise comparisons is needed. A common procedure used with the Kruskal–Wallis method is the Conover–Inman post-hoc procedure [35].

2.3.2. Principal Component Analysis—PCA

This data reduction method is used primarily for the determination of spectral outliers in NIR studies. PCA is a linear unsupervised pattern recognition technique [36,37].
Second derivative data pre-processing was applied before principal component analysis (PCA).

2.3.3. Linear Discriminant Analysis—LDA

LDA is a supervised classification algorithm. It can be used in order to identify which are the most significant features of a spectrum. LDA can also be used for classifying unknown samples [38].
For linear discriminant analysis, the original spectra were used, and there was no data pre-processing.

3. Results

3.1. Chemical Measurements

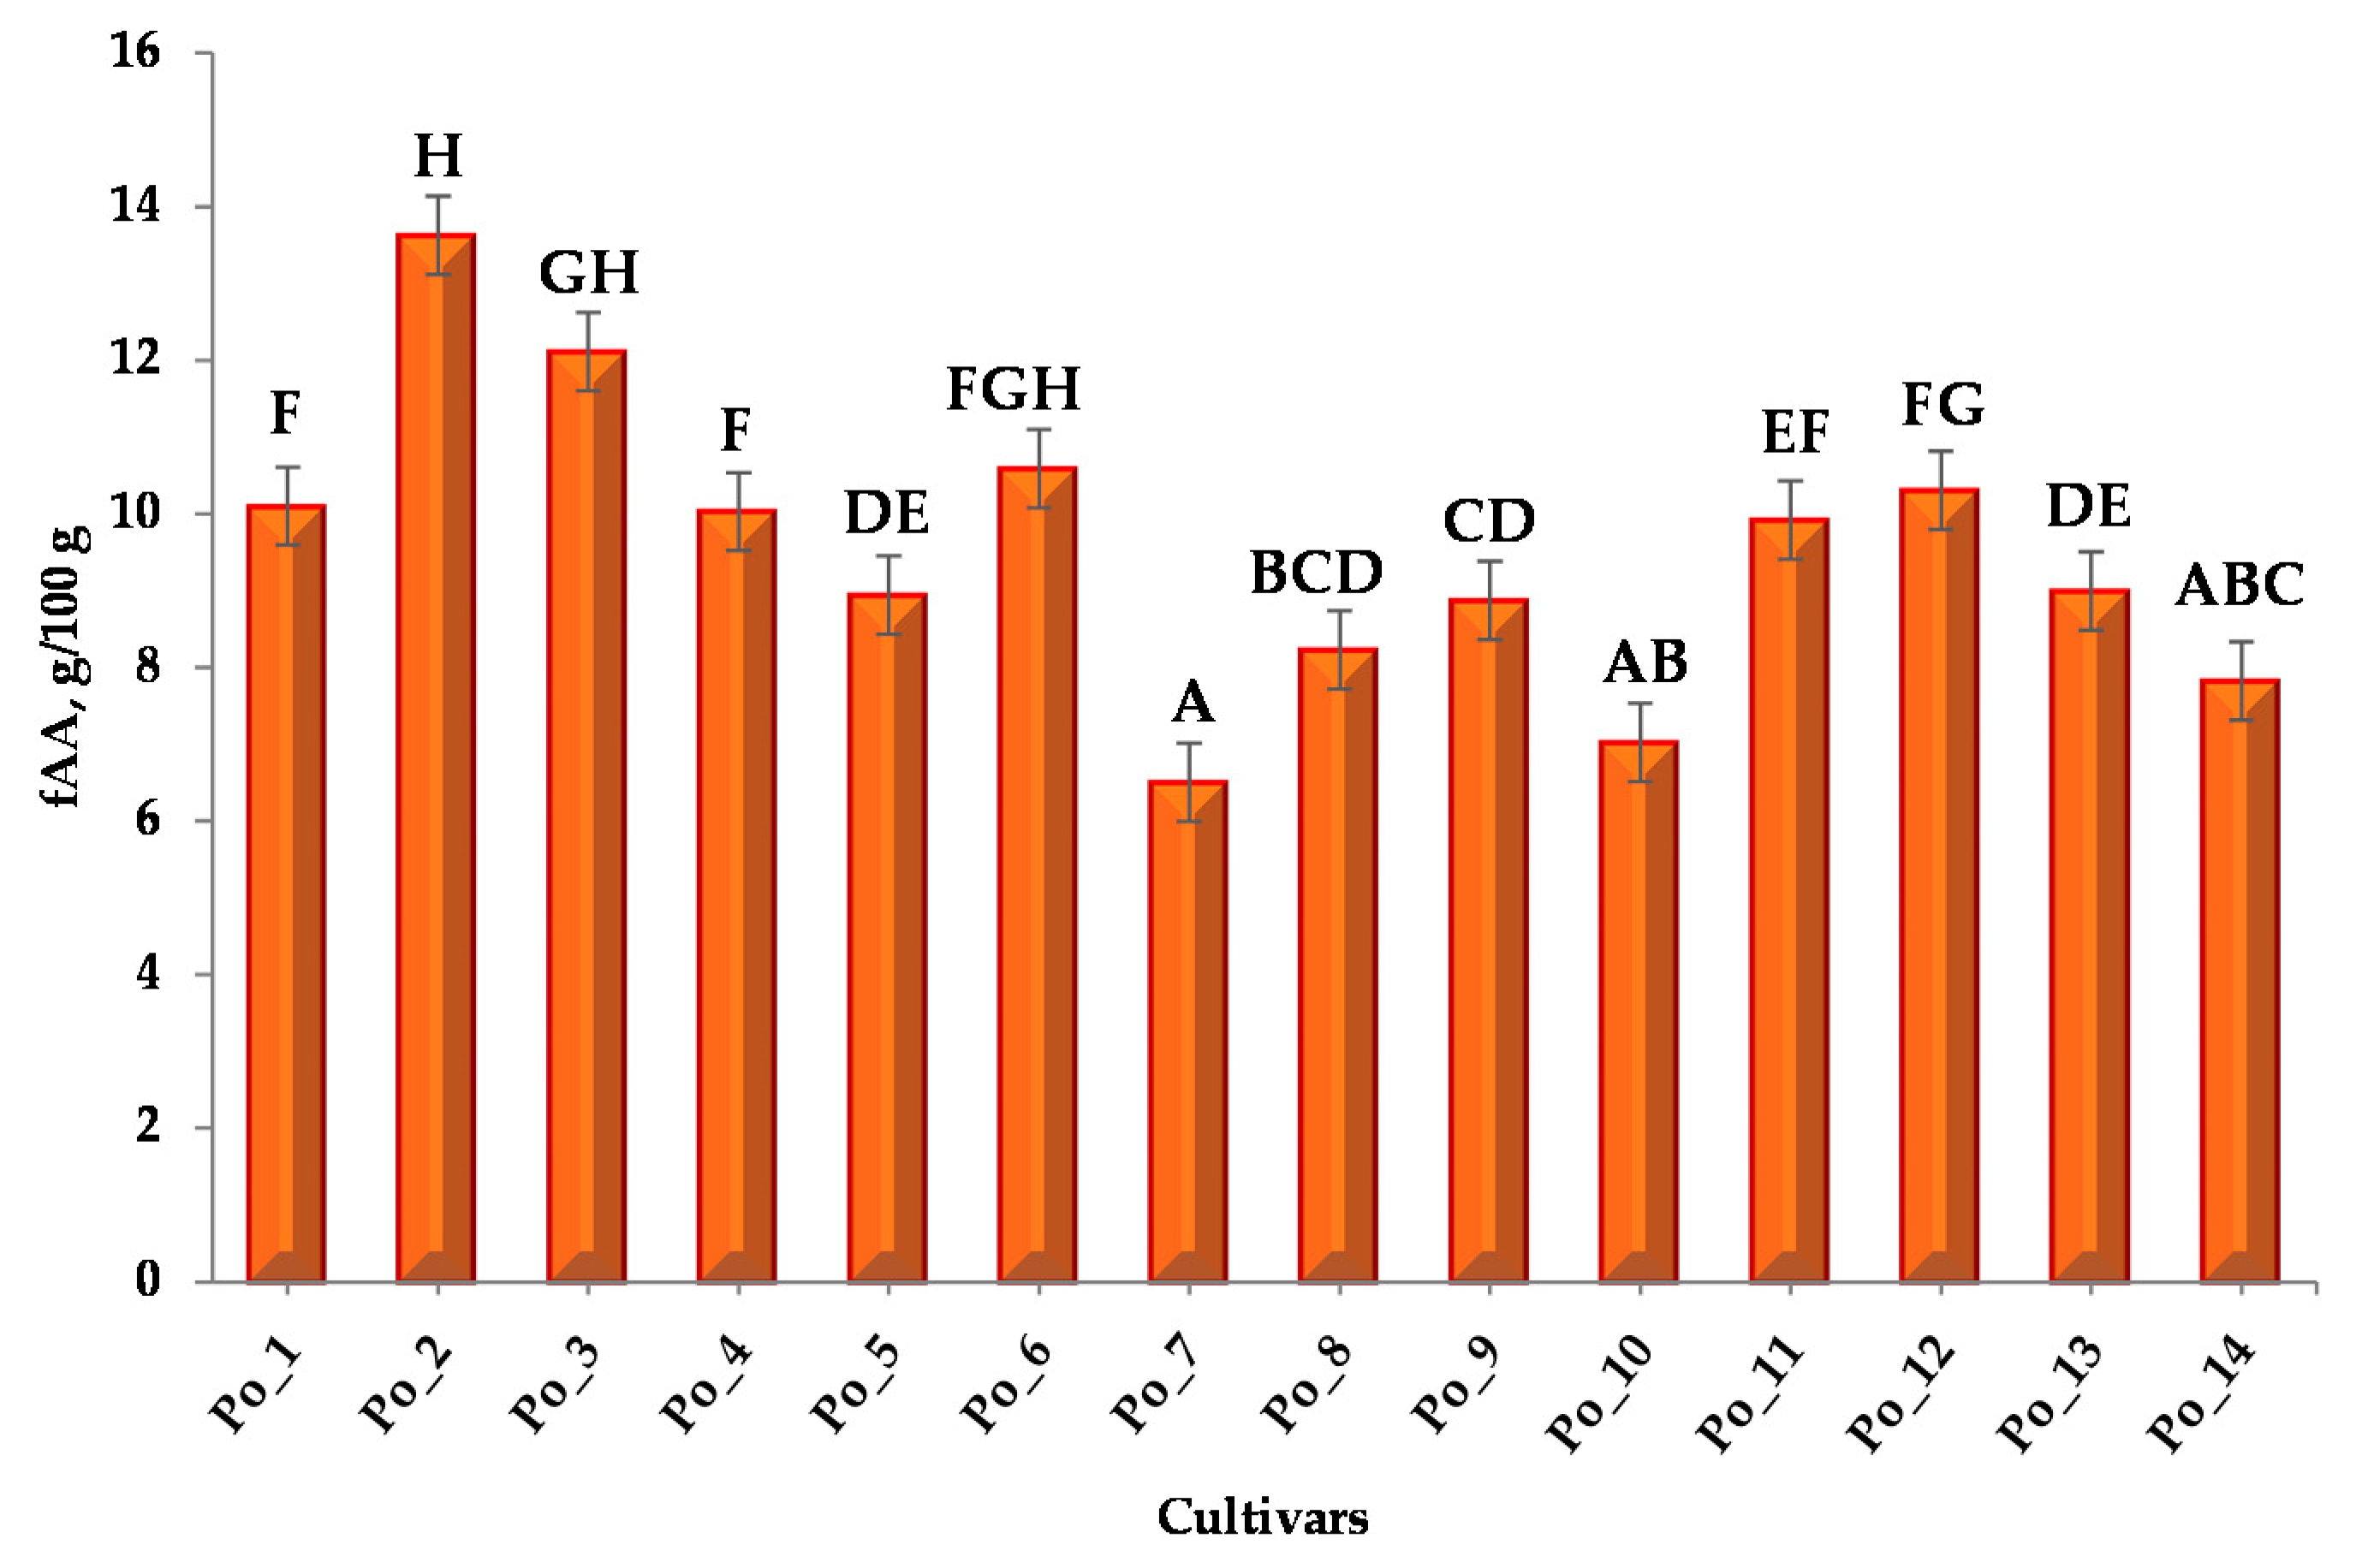
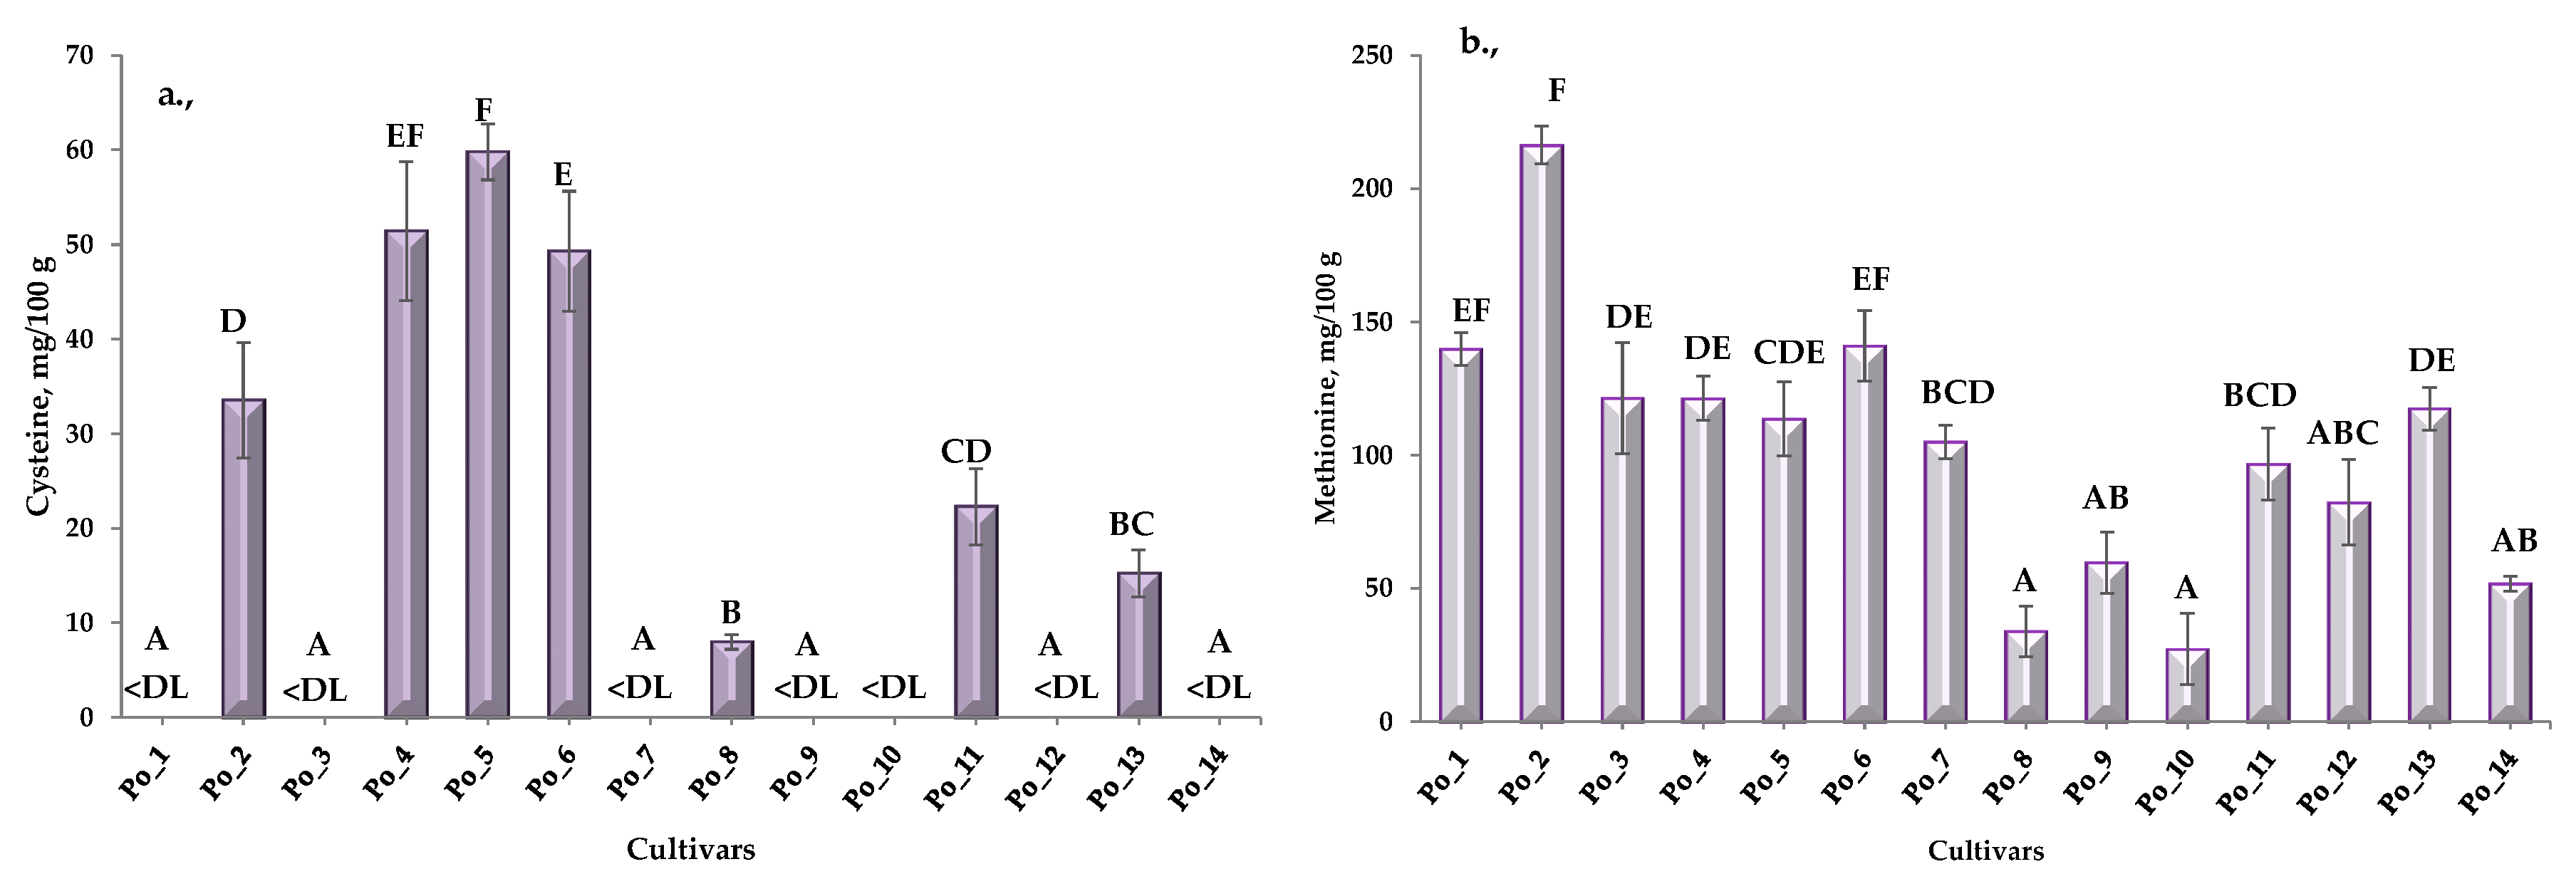
3.1.1. Free Amino Acid Content (fAA)

Concentrations of the following amino acids were measured during the research: Alanine (Ala), Arginine (Arg), Asparagine (Asn), Aspartic acid (Asp), Cysteine (Cys), Glutamine (Gln), Glutamic acid (Glu), Glycine (Gly), Histidine (His), Isoleucine (Ile), Leucine (Leu), Lysine (Lys), Methionine (Met), Ornithine Orn), Phenylalanine (Phe), Proline (Pro), Serine (Ser), Threonine (Thr), Tyrosine (Tyr), Valine (Val).
In addition to the listed components, the concentrations of γ-aminobutyric acid (GABA), Cystathionine (Cyn) and 1-methylhistidine (HME) were also monitored.
The total free amino acid (fAA) concentration of cultivars is summarized in Figure 1 and Table S1. The values of the individual amino acid components of the samples and the concentrations of GABA, Cyn and HME are summarized in Table S2.
Based on the Shapiro–Wilk test, the measurement data were not normally distributed, therefore the significance test was performed with the Kruskal–Wallis test. Conover–Iman post-hoc test was applied to all possible pairwise comparisons between groups. Multiple pairwise comparisons using the Conover–Iman procedure (two-tailed test) were interpreted as well in Figure 1 (Table S3). “A-H” notations refer to groups that can be formed based on Kruskal-Wallis statistical analysis. These classifications are the result of several pairwise comparisons established by the statistical program based on the sum of ranks and mean of ranks values.
Based on the results of the Kruskal–Wallis test of free amino acid content, it can be concluded that the cultivars Po_1–Po_2–Po_7 and Po_2–Po_4–Po_7 can be identified as different. Cultivar Po_2 has significantly the highest free amino acid concentration.
Using the Kruskal–Wallis test for each of the amino acid components tested, similar results were obtained in many cases for example, in the case of serine, threonine, histidine, 1-methyl histidine and arginine. Comparing the concentrations of leucine and tyrosine, the difference was significant for all candidates except Po_6.
Multiple pairwise comparisons using the Conover–Iman procedure (two-tailed test) of the limiting amino acids (cysteine (a), methionine (b)) are summarized in Figure 2 (Tables S4 and S5).
In some samples (Po_1, Po_3, Po_7, Po_9, Po_10, Po_12 and Po_14), the cysteine concentration was below the detection limit (1 μg/100 g). It can also be stated that the cultivars Po_2–Po_5–Po_6 and Po_8 can be identified as different. Regarding the concentration of methionine Po_2–Po_8 and Po_2–Po_10 cultivars can be identified as different.

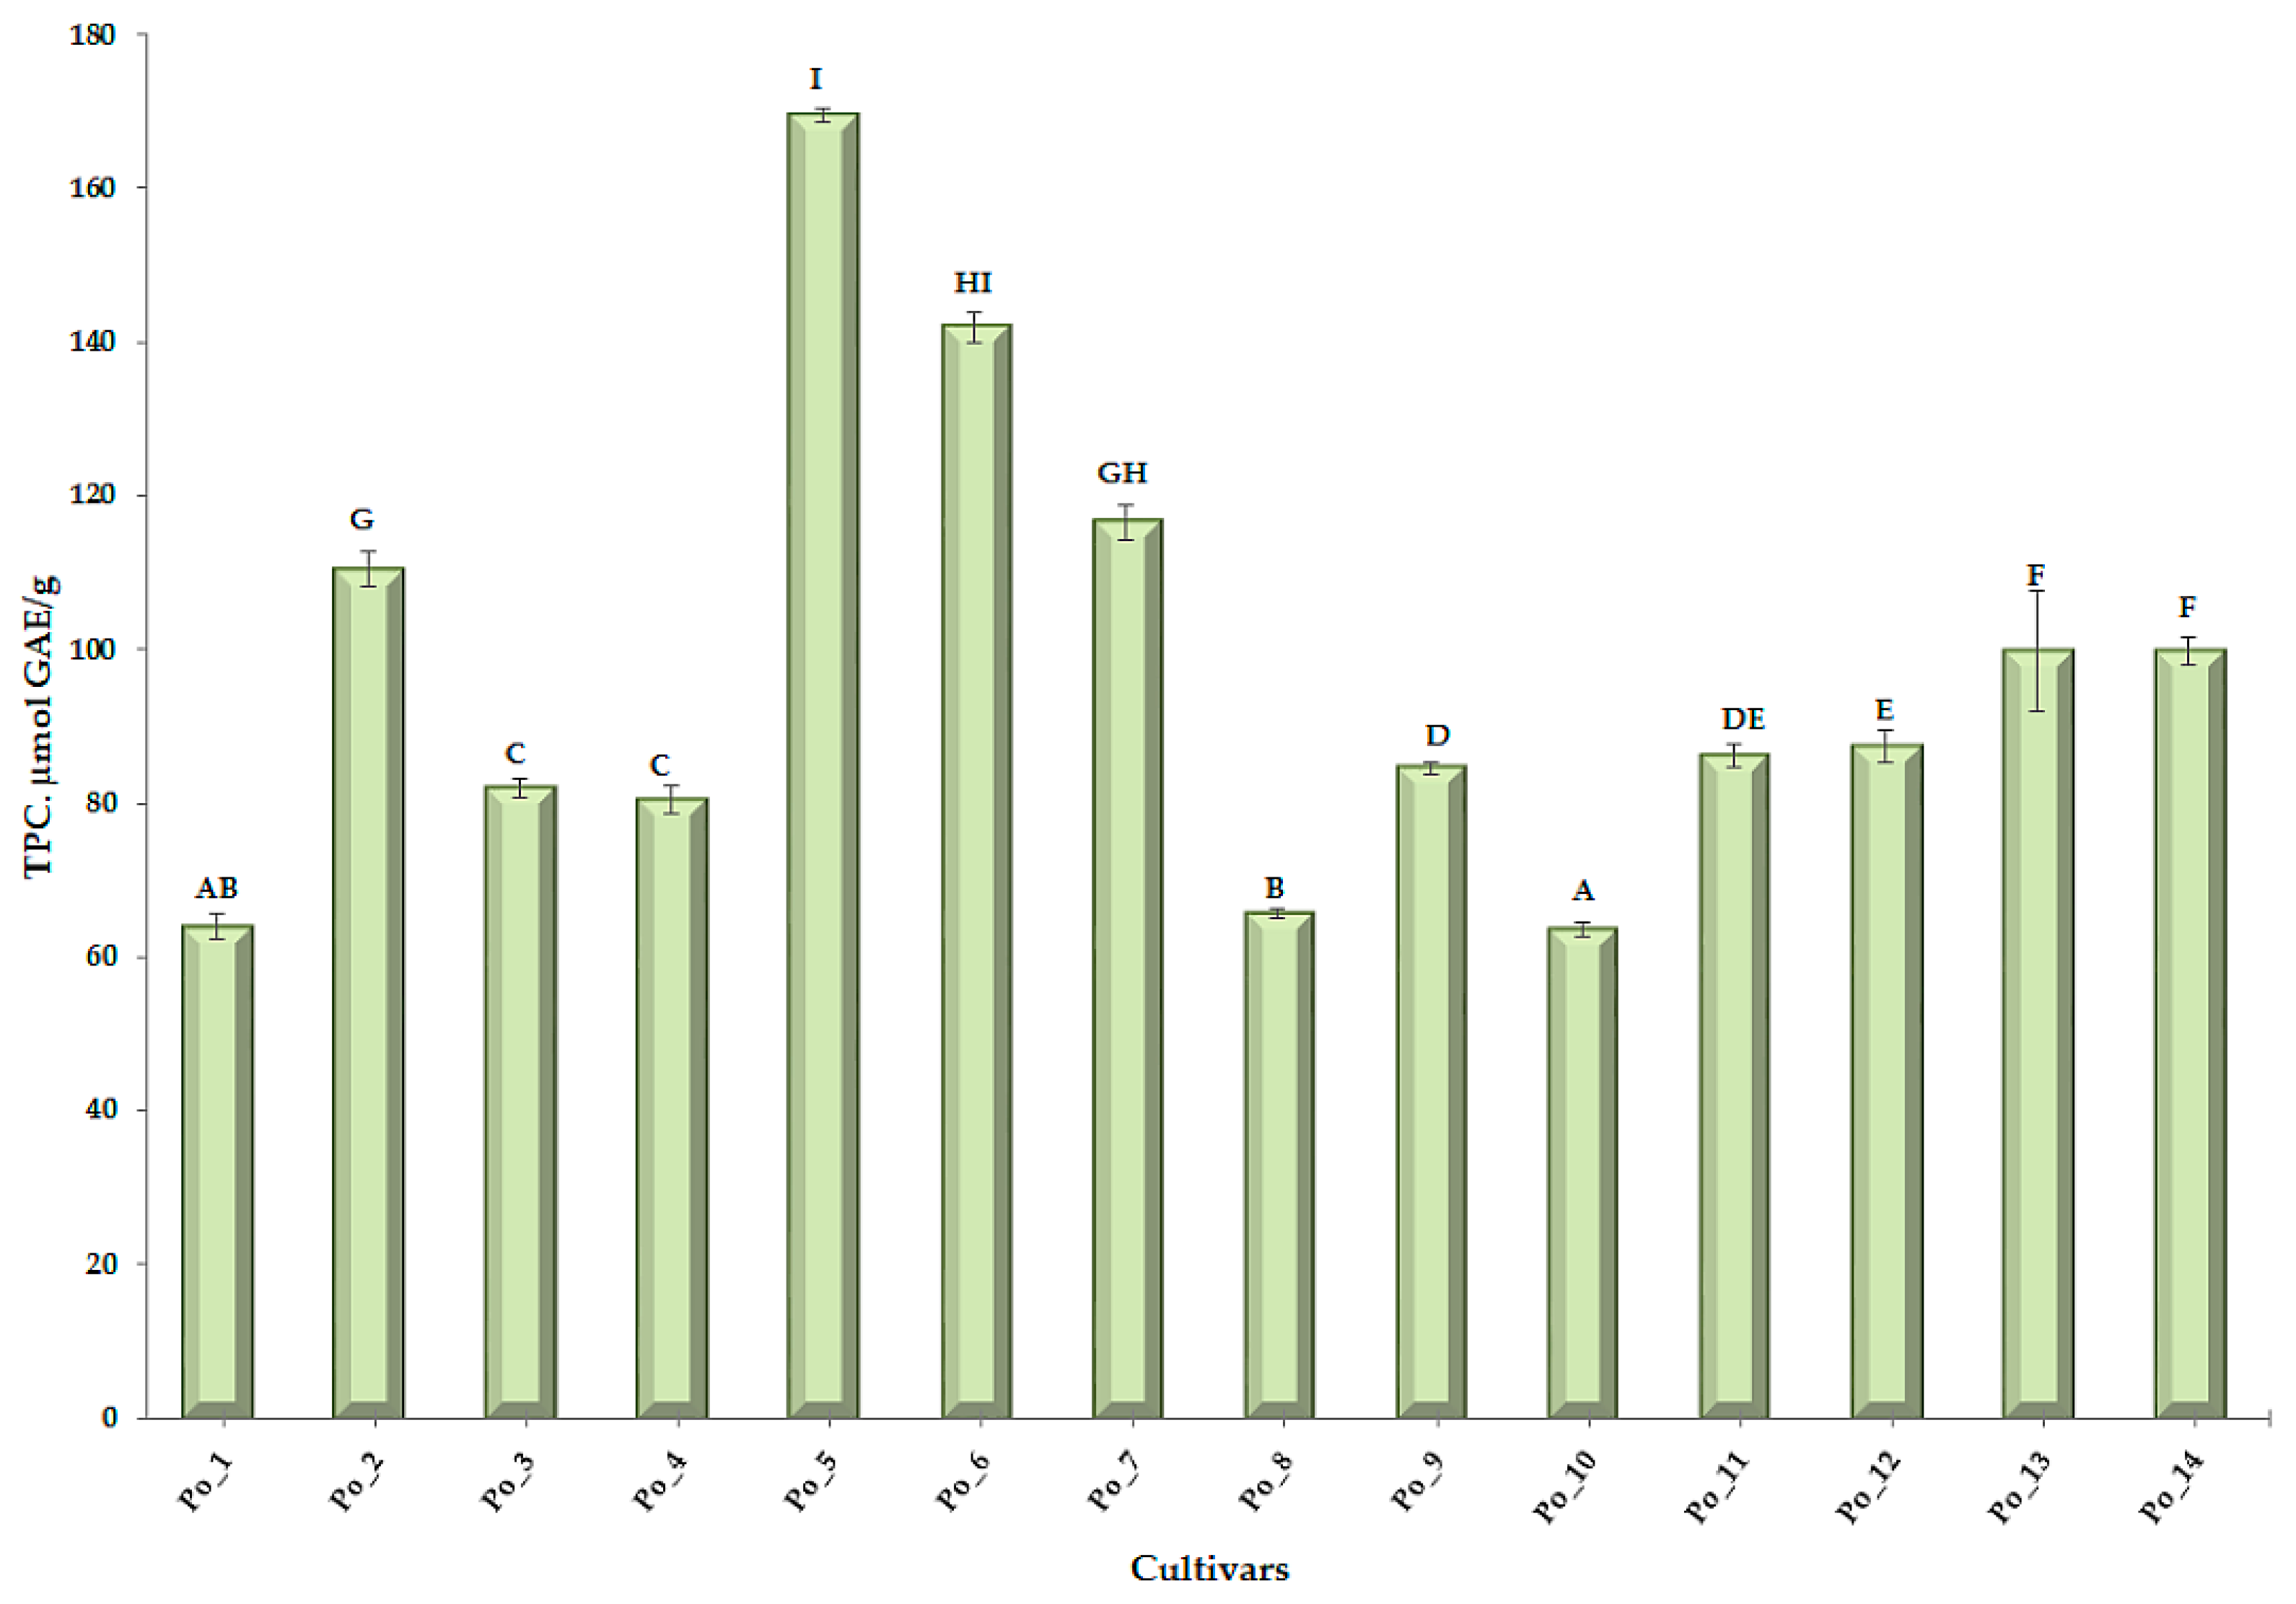
3.1.2. Total Polyphenol Content (TPC)

Comparing TPC values, several groups can be distinguished (Figure 3 and Tables S6 and S7). The following can be identified as significantly different candidates: Po_2–Po_3 (Po_4)–Po_5–Po_8–Po_10–Po_12 and Po_13 (Po_14). Po_5 cultivar had the highest TPC concentration.

3.1.3. Antioxidant Capacity (Ferric Reducing Ability of Plasma—FRAP)

For FRAP values, in contrast to TPC data, fewer significantly different samples could be distinguished (Figure 4 and Tables S8 and S9). These were as follows: Po_2–Po_10; Po_2–Po_14; Po_5–Po_10 and Po_5–Po_14. Of the cultivars, Po_2 and Po_8 had the highest FRAP values.

3.2. FT-NIR Measurements

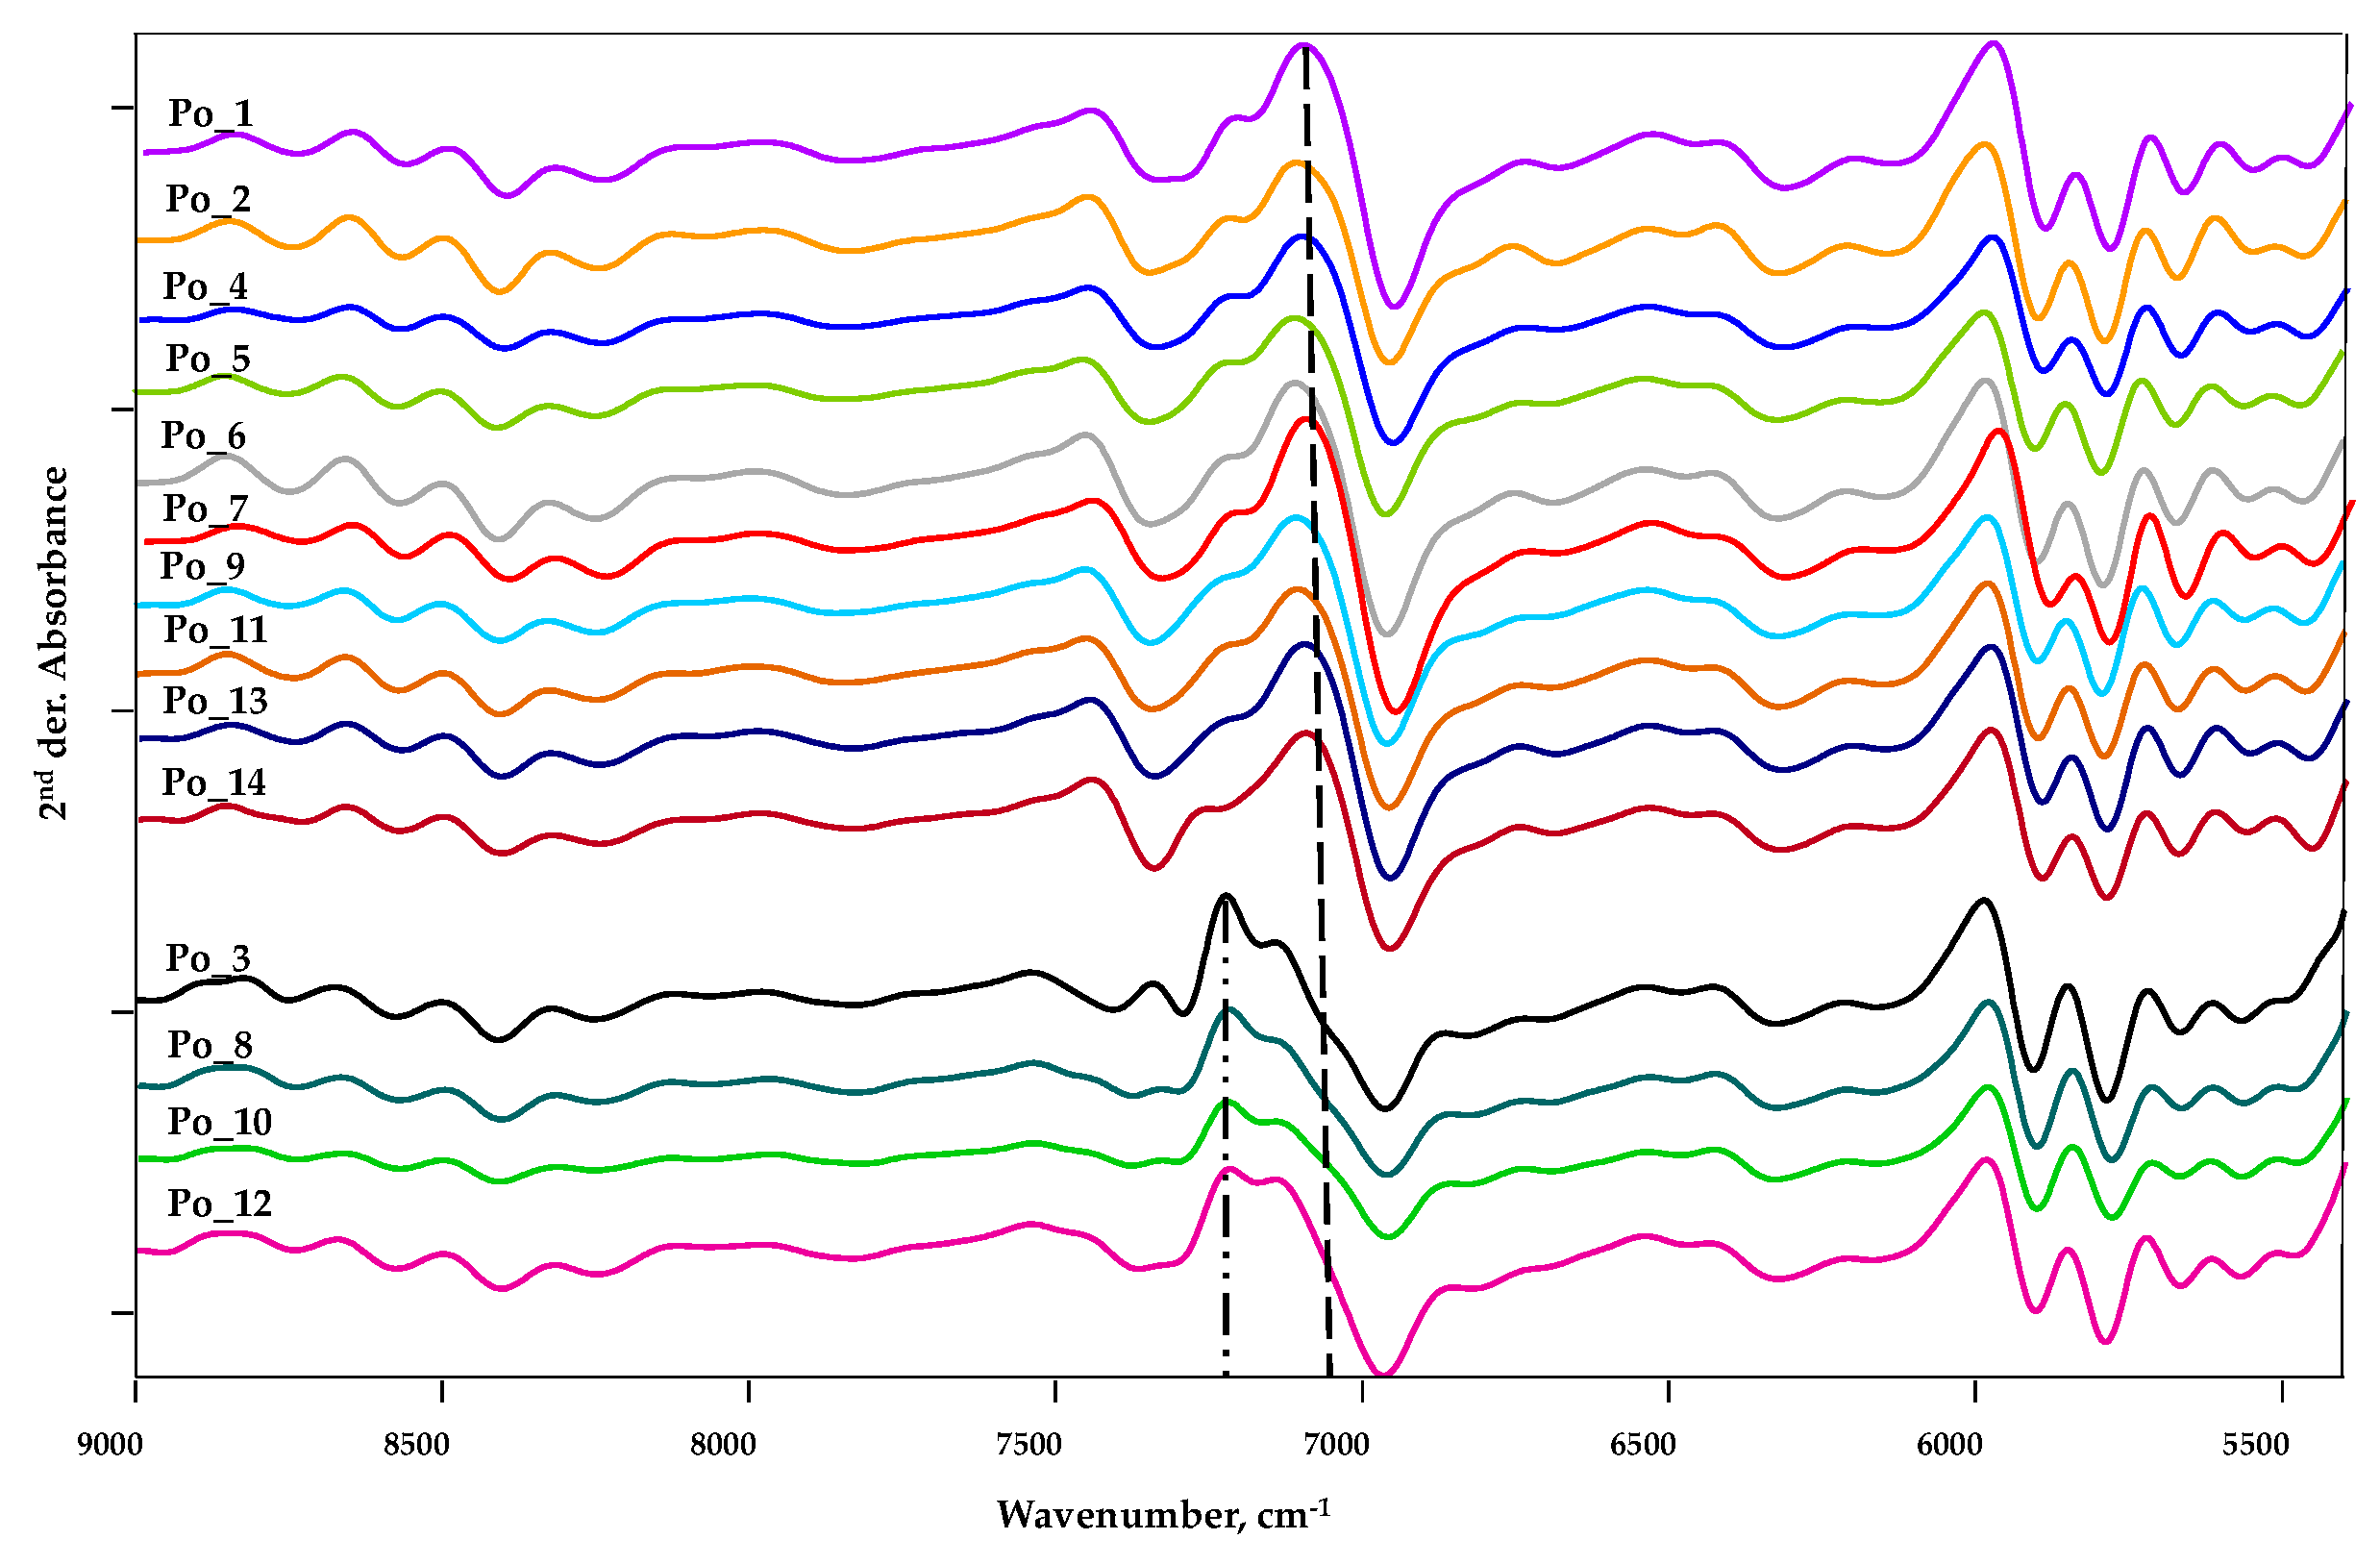
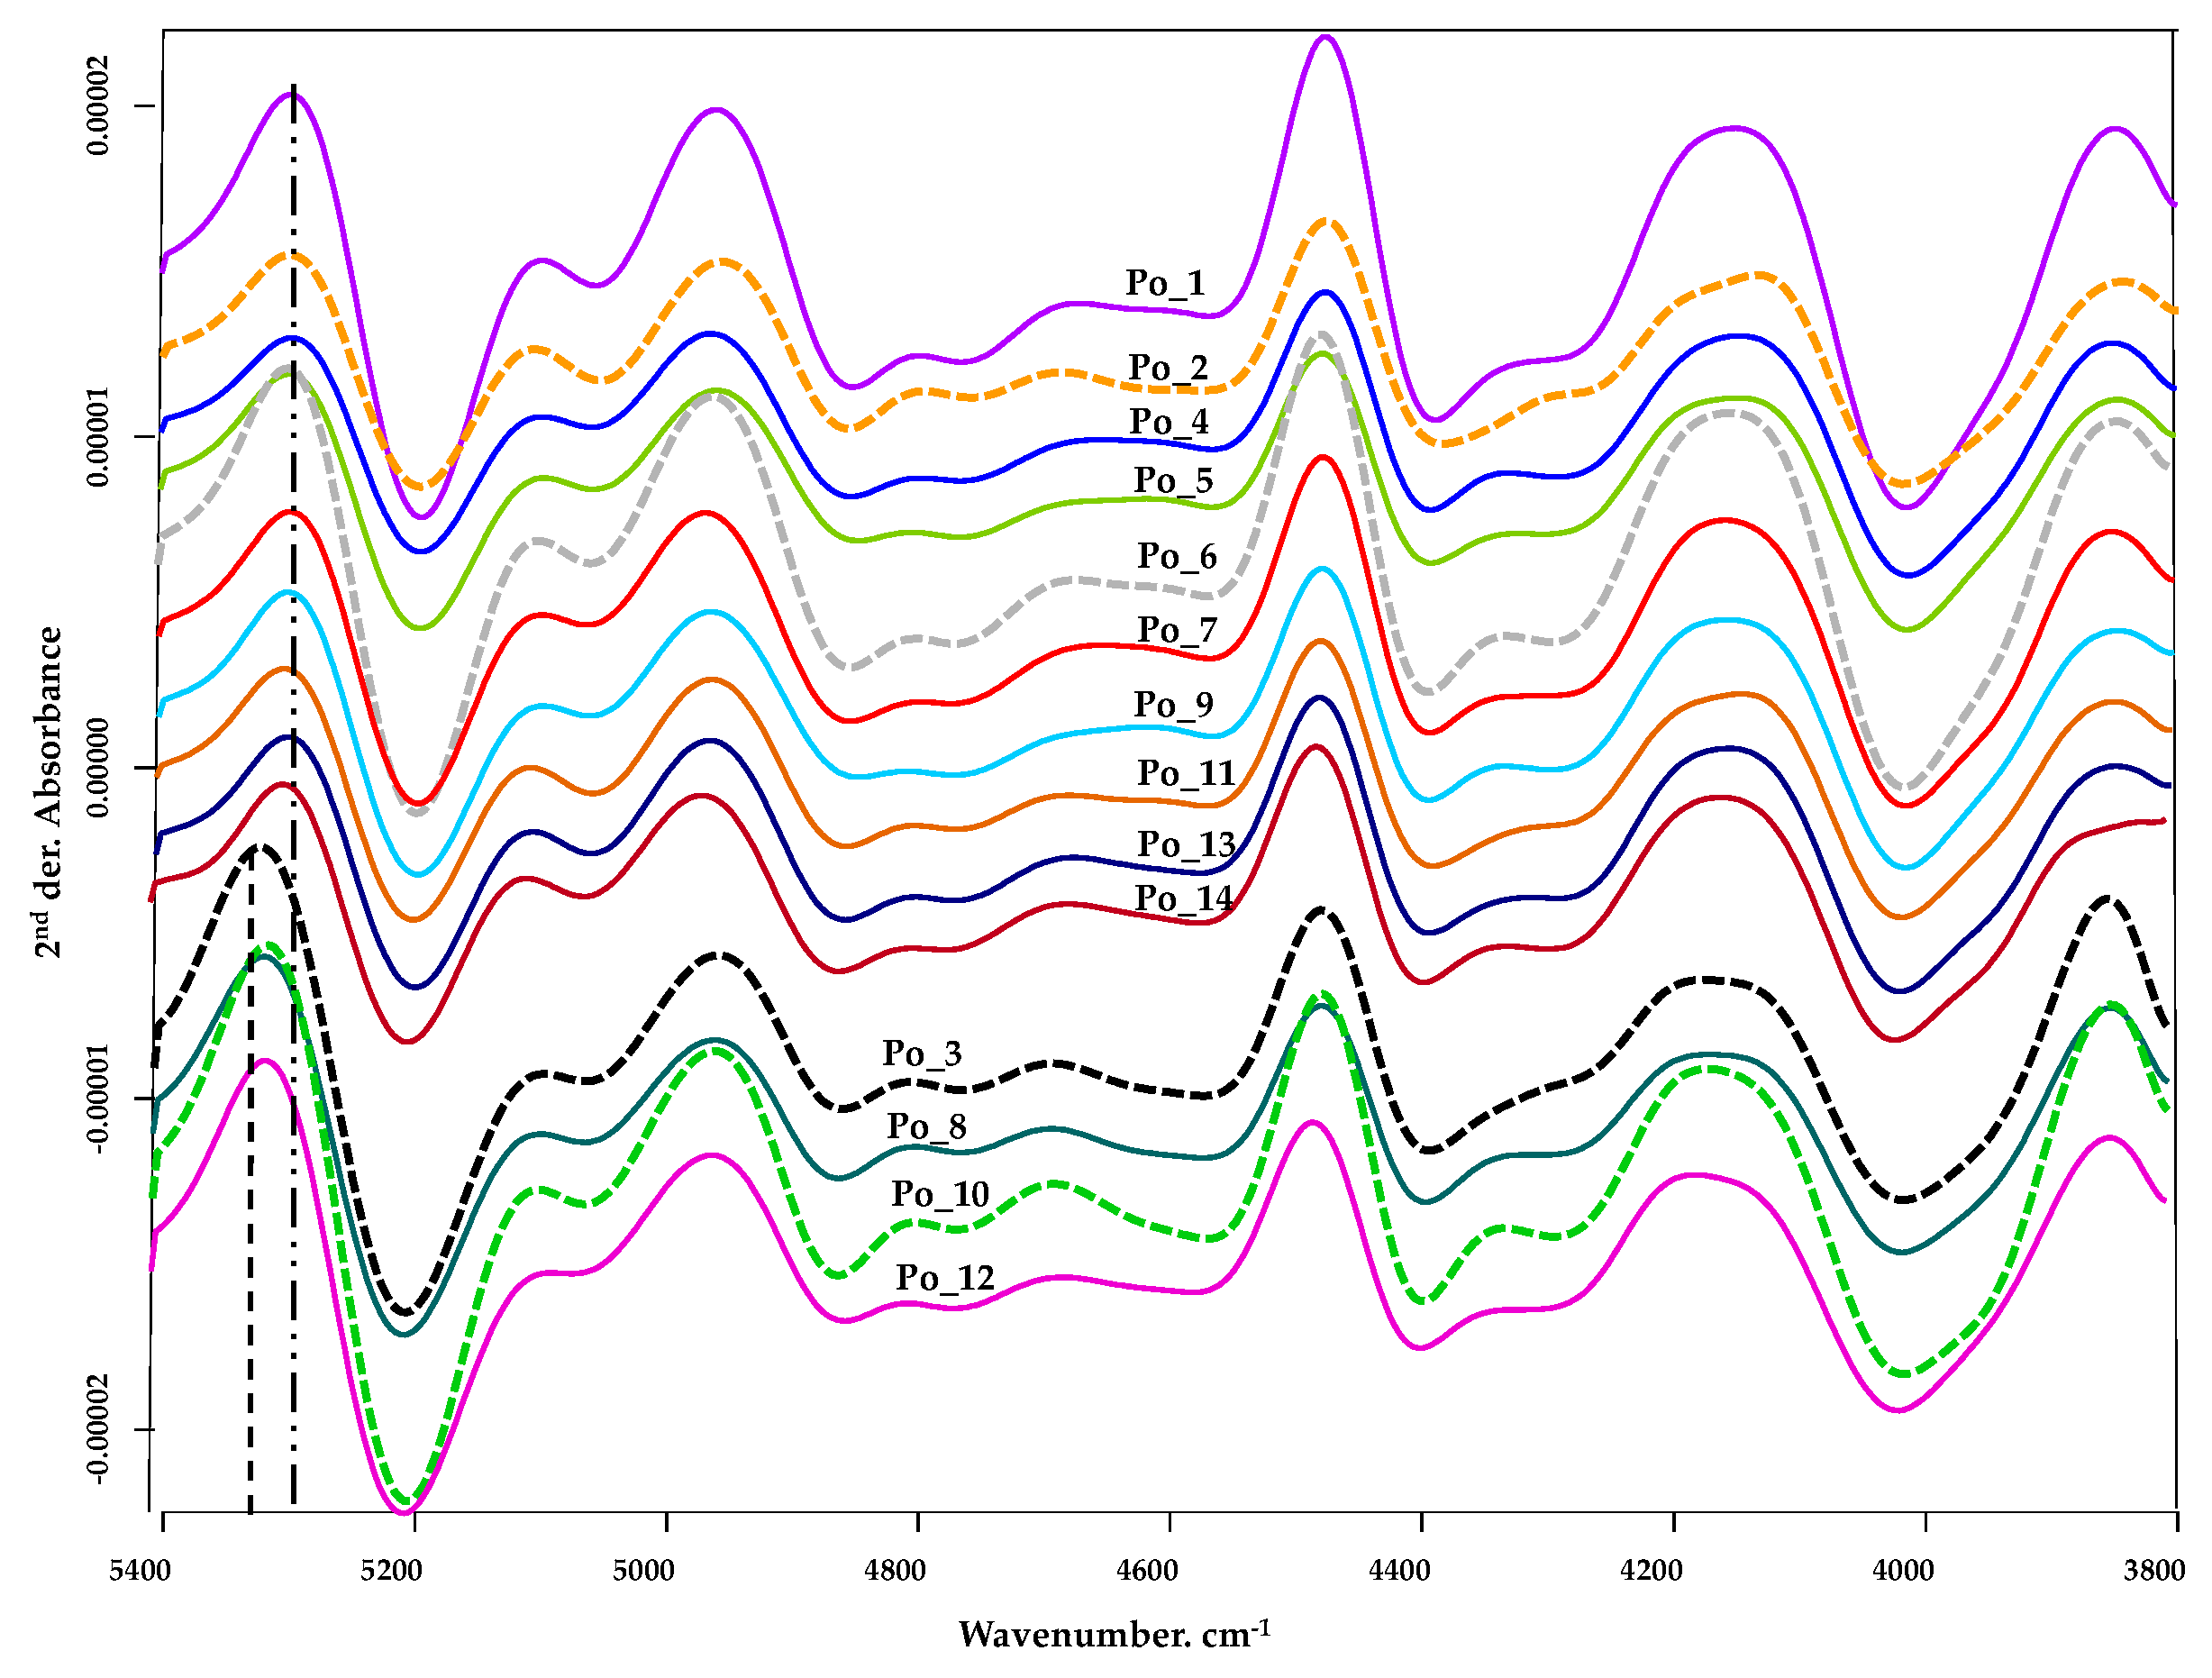
3.2.1. Spectrum Profiling

Comparing the NIR spectra, minimal differences can be observed in the traditional spectrum image. Baseline shift is a consequence of scatter due to different particle sizes. The subtle, characteristic differences become visible primarily in the second derivative curve (Figure 5).
For better clarity, some details of the measurement range were magnified, and the spectra were separated (Figure 6 and Figure 7). Within the 9000–5400 cm−1 interval, an important characteristic difference between the curves is observed in the areas 7650–7090 and 6890–6630 cm−1. This discrepancy can clearly be explained by a qualitative difference.
The most striking difference is observed in the area of 7650–7090 cm−1. Based on the characteristics of the curves, two typical groups can be distinguished. The first group includes the spectra of Po_1, Po_2, Po_4, Po_5, Po_6, Po_7, Po_9, Po_11, Po_13 and Po_14, while the second group includes the spectra of Po_3, Po_8, Po_10 and Po_12 (Figure 6). The signal of aliphatic and aromatic hydrocarbon chains can be detected primarily in this area (Table 2).
In the case of the first group, the peak at 7100 cm−1 is typical (dashed line), while in the second group, the peak at 7230 cm−1 is observed (dashed-dotted line).
A smaller difference is observed in the wavenumber interval 6890–6630 cm−1. In this area, there is mainly a difference in peak height, but this cannot be explained by a qualitative difference. These spectral differences are clearly observed in the characteristic areas of hydrocarbon chains, phenolic structures, and alcoholic OH (Table 2). Given that neither the TPC values (Figure 3, Tables S6 and S7) nor the FRAP values (Figure 4, Tables S8 and S9) of these four cultivars are outstanding, it can be reasonably assumed that their polyphenolic compounds are qualitatively different from the other ten cultivars.
In the wavelength range 5400–3800 cm−1 (Figure 7), further differences between the spectra can be observed. The initial peak is seen at 5314 cm−1 for samples Po_3, Po_8, Po_10 and Po_12 (dashed-dotted line), while for the other cultivars this peak shifts to 5290 cm−1 (dashed line). Given that the samples were dried and not lyophilized, although the drying conditions were the same, it can be assumed that this initial peak shift may be due to the formation of water molecules remaining after drying and the formation of any hydrogen bonds.
Further differences are observed for cultivars Po_2, Po_3, Po_6, and Po_10 in the region 4400–4100 cm−1 (dotted line, Figure 7) (Table 3).
The wavenumber range 4400 to 4100 cm−1 is the absorption area of many characteristic functional groups. In addition to proteins, the characteristic peaks of fats and carbohydrates (including fibers) also appear here. In our previous studies, we have already established that there is no significant difference between the cultivars in terms of carbohydrate content [40].
The differences observed here (Figure 7) can be explained clearly by the different ratio of free amino acid components. The Po_2 sample is characterized by the highest total free amino acid concentration (Figure 1). The most significant difference is observed for sample Po_2. In our opinion, such a characteristic difference in the spectrum can be explained by the fact that the individual concentrations of several amino acid components (Asp, Thr, Ser, Pro, Gly, Ala, Val, Met, Ile, Leu, Tyr, Phe, His, Arg, HME) are the highest in this sample.
The spectrum of the Po_3 sample has similar characteristics to that of the Po_2 sample. This can be explained by the fact that for several amino acid components (Ser, Thr, Ala, His, Arg, HME) there was no significant difference between the two cultivars.
When analyzing the spectra, it must be emphasized that in the NIR range, we cannot perform qualitative identification in the strict sense on the basis of the spectral images. Based on the characteristic absorption bands, we can infer the presence of proteins and carbohydrates, but these bands broaden and overlap, so we cannot connect a peak to a specific compound. In our research, we basically looked for the presence of proteins (free amino acids), phenolic/polyphenolic components, and carbohydrates responsible for antioxidant effects.

3.2.2. Chemometric Evaluation of NIR spectra

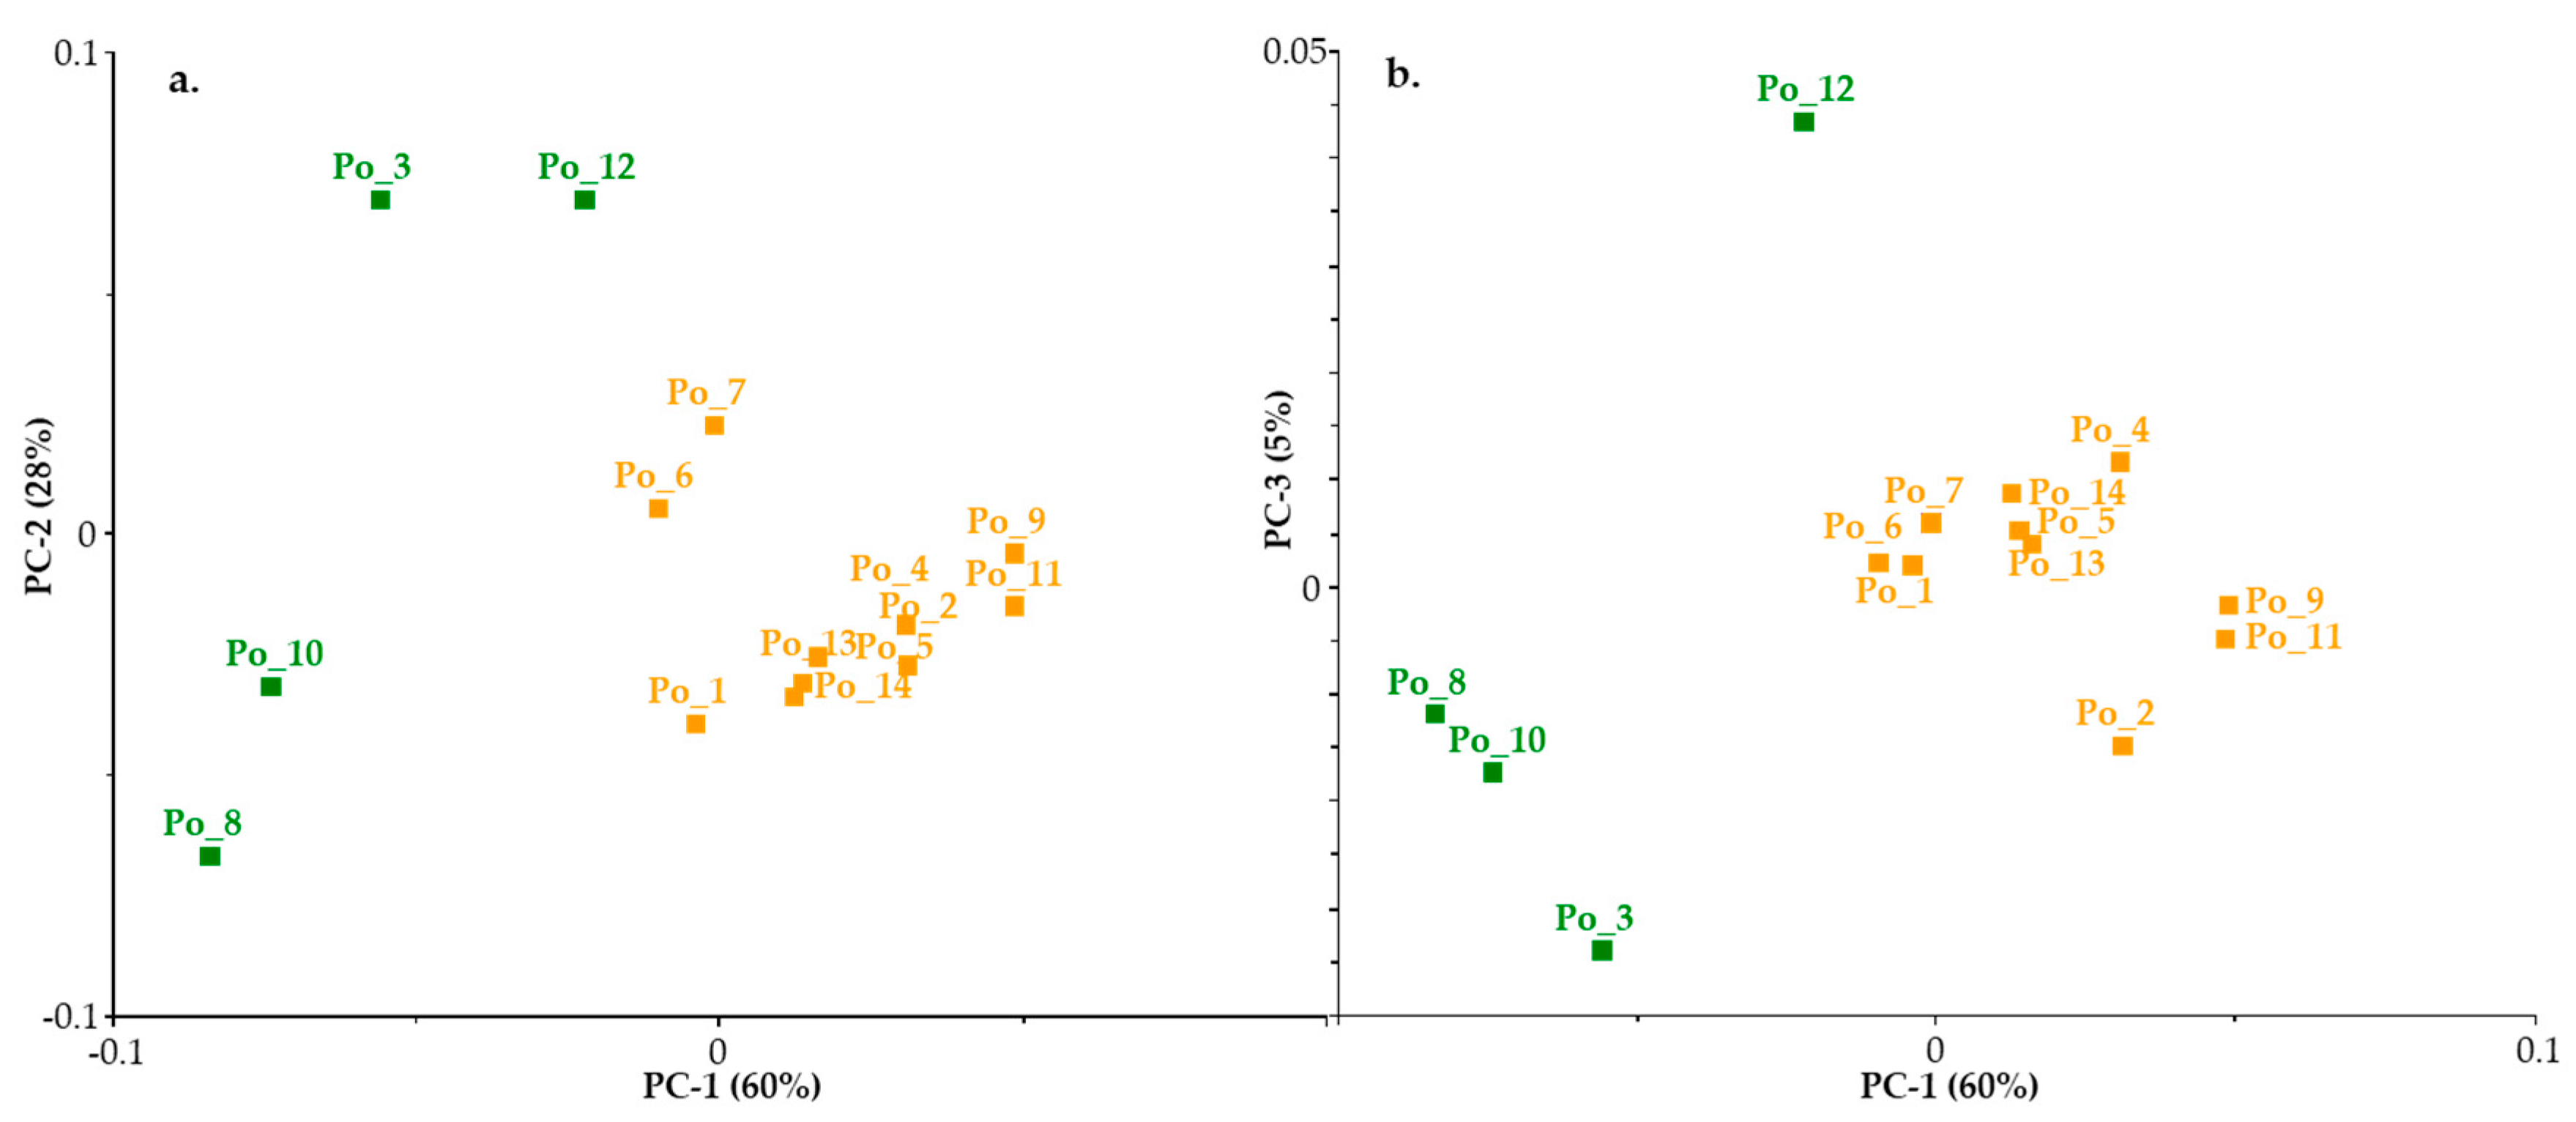
  • Principal Component Analysis (PCA)
PCA analysis of the spectra as an unsupervised pattern recognition method examined. PCA analysis of the spectra as an unsupervised pattern recognition method examined whether any pattern between the spectra could be recognized. Given that during the comparison of the second derivative curves in the spectral studies (Figure 6 and Figure 7), we observed that four cultivars—Po_3, Po_8, Po_10 and Po_12—differed from the others, before PCA a second derivative as a data preprocessing technique was applied (Figure 8a,b). PCA analysis was performed with UNSCRAMBLER 10.4 (CAMO, Oslo, Norway) software.
As a result of PCA, the same four cultivars could be distinguished, which were indicated by examination of the spectra.
The results of the cluster analysis supported the visually perceived discrepancy and the PCA result (Figure 9).
  • Linear Discriminant Analysis (LDA)
The applied LDA supervised pattern recognition is based solely on the analysis of NIR spectral data with STATISTICA™ (Tulsa, OK, USA).
Based on our reference measurement results, we formed groups based on total free amino acids, cysteine, methionine proline (Figure 10), as well as TPC and FRAP values (Figure 11).
These amino acid components were chosen because cysteine and methionine are limiting amino acids, whereas proline concentration is correlated with stress effects.
Forward stepwise model building method and threefold cross-validation were applied in the evaluation. In the first step, the three parallel spectra of the samples from 12,500 to 4000 cm−1 were used for principal component analysis. We did not apply data preprocessing. The first ten PCA scores were used for the further analysis with LDA. Proper validation should test whether the results are artefacts or not. For this purpose, as another validation method for the model, X-scrambling randomization test was used three times [41].
The classification was 100% successful for free amino acids. Due to some misclassifications, we achieved a probability of nearly 93% for cysteine, nearly 90% for methionine and nearly 95% for proline.
When examining the TCP and FRAP values, the pattern was recognized with a probability of more than 83% for both parameters (Figure 11).

4. Discussion

Based on our experimental results, the Po_2 cultivar clearly stood out from the 14 Pleurotus cultivars in terms of free amino acid content. This cultivar had a significantly higher concentration not only of the free amino acid but also for its individual amino acid components.
Based on total polyphenol values, cultivars Po_5, Po_6, and Po_7 had the highest concentration, while for FRAP values, cultivars Po_2 and Po_5 showed the highest.
Based on the analysis of the FT-NIR spectra, the cultivars Po_3, Po_8, Po_10, Po_12 can be clearly distinguished in the wavelength range of 7420–7067 cm−1 compared to the other cultivars. The spectral difference is explained by the presence of different qualities or types of polyphenols and reducing (antioxidant) components.
The characteristic separation was also supported by our PCA and cluster analyzing result.
Successful classification was performed using LDA to analyze total free amino acids, cysteine, methionine (limiting amino acids), and proline content (stress-related amino acid).
Based on our results, it can be stated that without chemical analysis, we performed a successful LDA assay with 100% accuracy for all free amino acid concentrations. Examining the cysteine content, the classification was successful with an accuracy of 92.86%, for methionine 89.74% and for proline 94.87%.
Regarding the TPC and FRAP values characteristic of stress resistance, the grouping was achieved with an accuracy of 88.1% and 83.3%, respectively. Although 90% accuracy was not achieved for any of the parameters in this case, we still consider our results to be excellent, considering that both the polyphenolic compounds and the compounds responsible for the reducing effect can be very diverse.
Based on our results, it can be stated that PCA and LDA methods based solely on the analysis of FT-NIR spectral data can be successfully used to classify Pleurotus ostreatus cultivars for total free amino acid, cysteine, methionine, and proline concentrations, as well as TPC and FRAP values.
Based on the results, we have to state that we cannot predict the values of the examined parameters, but based on the spectral data we can classify the samples into a group that can be characterized by a chemical result.
Thus, FT-NIR spectroscopy offers the possibility of non-destructive, fast qualification.

Supplementary Materials

The following are available online at https://www.mdpi.com/1424-8220/20/22/6632/s1, Table S1: Total free amino acid (fAA) concentration of cultivars; Table S2: Free amino acid concentration (mg/100g); Table S3: Results of Kruskal-Wallis test. Multiple pairwise comparisons for free total amino acid; Table S4: Results of Kruskal-Wallis test. Multiple pairwise comparisons for cysteine concentration; Table S5: Results of Kruskal-Wallis test. Multiple pairwise comparisons for methionine concentration; Table S6: Total polyphenol content (μmol GAE/g); Table S7: Results of Kruskal-Wallis test. Multiple pairwise comparisons for total polyphenol content; Table S8: FRAP values (μmol AAE/g) of cultivars; Table S9: Multiple pairwise comparisons for FRAP values.

Author Contributions

Conceptualization: M.F., E.E.M., A.G., É.S.-B. and Z.M.; methodology: M.F., É.S.-B. and Z.M.; software: M.F. and E.E.M.; investigation: E.E.M., É.S.-B. and Z.M.; data curation: M.F., E.E.M. and Z.M.; writing—original draft preparation: M.F., E.E.M., A.G. and Z.M.; writing—review and editing: M.F., E.M., A.G., É.S.-B. and Z.M.; supervision: M.F. All authors have read and agreed to the published version of the manuscript.

Funding

The Project was supported by the European Union and co-financed by the European Social Fund (grant agreement number EFOP-3.6.3-VEKOP-16-2017-00005).

Acknowledgments

We are grateful for the support of the Szent István University’s Doctoral School of Food Sciences.

Conflicts of Interest

The authors declare no conflict of interest. The funders had no role in the design of the study; in the collection, analyses, or interpretation of data; in the writing of the manuscript; or in the decision to publish the results.

References

  1. Roncero-Ramos, I.; Delgado-Andrade, C. The beneficial role of edible mushrooms in human health. Curr. Opin. Food Sci. 2017, 14, 122–128. [Google Scholar] [CrossRef]
  2. Chirinang, P.; Intarapichet, K.-O. Amino acids and antioxidant properties of oyster mushrooms. Sci. Asia 2009, 35, 326. [Google Scholar] [CrossRef]
  3. Reis, F.S.; Barros, L.; Martins, A.; Ferreira, I.C.F.R. Chemical composition and nutritional value of the most widely appreciated cultivated mushrooms: An inter-species comparative study. Food Chem. Toxicol. 2012, 50, 191–197. [Google Scholar] [CrossRef] [Green Version]
  4. Li, S.; Wang, A.; Liu, L.; Tian, G.; Wei, S.; Xu, F. Evaluation of nutritional values of shiitake mushroom (Lentinus edodes) stipes. J. Food Meas. Charact. 2018, 12, 2012–2019. [Google Scholar] [CrossRef]
  5. Akindahunsi, A.A.; Oyetayo, F.L. Nutrient and antinutrient distribution of edible mushroom, Pleurotus tuber-regium (fries) singer. LWT-Food Sci. Technol. 2006, 39, 548–553. [Google Scholar] [CrossRef]
  6. Vetter, J. Biological values of cultivated mushrooms—A review. Acta Aliment. 2019, 48, 229–240. [Google Scholar] [CrossRef]
  7. Ashraf Khan, A.; Gani, A.; Masoodi, F.A.; Mushtaq, U.; Silotry Naik, A. Structural, rheological, antioxidant, and functional properties of β–glucan extracted from edible mushrooms Agaricus bisporus, Pleurotus ostreatus and Coprinus attrimentarius. Bioact. Carbohydrates Diet. Fibre 2017, 11, 67–74. [Google Scholar] [CrossRef]
  8. Bekiaris, G.; Tagkouli, D.; Koutrotsios, G.; Kalogeropoulos, N.; Zervakis, G.I. Pleurotus mushrooms content in glucans and ergosterol assessed by ATR-FTIR spectroscopy and multivariate analysis. Foods 2020, 9, 535. [Google Scholar] [CrossRef]
  9. Kozarski, M.; Klaus, A.; Jakovljevic, D.; Todorovic, N.; Vunduk, J.; Niksic, M.; Vrvic, M.M.; Griensven, L. Van Antioxidants of Edible Mushrooms. Molecules 2015, 20, 19489–19525. [Google Scholar] [CrossRef] [Green Version]
  10. Ramírez, A.C.; Santoyo, S.; Reglero, G.; Soler-rivas, C. Radical scavenging activities, endogenous oxidative enzymes and total phenols in edible mushrooms commonly consumed in Europe. J. Sci. Food Agric. 2007, 87, 2272–2278. [Google Scholar] [CrossRef]
  11. Roncero-Ramos, I.; Mendiola-Lanao, M.; Pérez-Clavijo, M.; Delgado-Andrade, C. Effect of different cooking methods on nutritional value and antioxidant activity of cultivated mushrooms. Int. J. Food Sci. Nutr. 2017, 68, 287–297. [Google Scholar] [CrossRef] [PubMed]
  12. Manley, M. Near-infrared spectroscopy and hyperspectral imaging: Non-destructive analysis of biological materials. Chem. Soc. Rev. 2014, 43, 8200–8214. [Google Scholar] [CrossRef] [PubMed] [Green Version]
  13. Workman, J.; Weyer, L. Practical Guide and Spectral Atlas for Interpretive Near-Infrared Spectroscopy, 2nd ed.; CRC Press: Boca Raton, FL, USA, 2012; ISBN 9781574447842. [Google Scholar]
  14. Kandasamy, S.; Chinnappan, S.; Thangaswamy, S.; Balakrishnan, S.; Khalifa, A.Y.Z. Assessment of Antioxidant, Antibacterial Activities and Bioactive Compounds of the Wild Edible Mushroom Pleurotus sajor-caju. Int. J. Pept. Res. Ther. 2020, 26, 1575–1581. [Google Scholar] [CrossRef]
  15. Yan, J.; Zhu, L.; Qu, Y.; Qu, X.; Mu, M.; Zhang, M.; Muneer, G.; Zhou, Y.; Sun, L. Analyses of active antioxidant polysaccharides from four edible mushrooms. Int. J. Biol. Macromol. 2019, 123, 945–956. [Google Scholar] [CrossRef]
  16. Zhang, Y.; Dai, L.; Kong, X.; Chen, L. Characterization and in vitro antioxidant activities of polysaccharides from Pleurotus ostreatus. Int. J. Biol. Macromol. 2012, 51, 259–265. [Google Scholar] [CrossRef]
  17. Kortei, N.; Wiafe-Kwagyan, M. Comparative Appraisal of the Total Phenolic Content, Flavonoids, Free Radical Scavenging Activity and Nutritional Qualities of Pleurotus ostreatus (EM-1) and Pleurotus eous (P-31) Cultivated on Rice (Oryzae sativa) Straw in Ghana. J. Adv. Biol. Biotechnol. 2015, 3, 153–164. [Google Scholar] [CrossRef]
  18. Jeena, G.S.; Punetha, H.; Prakash, O.; Chandra, M.; Kushwaha, K.P.S. Study on in vitro antioxidant potential of some cultivated pleurotus species (oyster mushroom). Indian J. Nat. Prod. Resour. 2014, 5, 56–61. [Google Scholar]
  19. Yim, H.S.; Chye, F.Y.; Tan, C.T.; Ng, Y.C.; Ho, C.W. Antioxidant activities and total phenolic content of aqueous extract of Pleurotus ostreatus (cultivated oyster mushroom). Malays. J. Nutr. 2010, 16, 281–291. [Google Scholar]
  20. Bindhu, J.; Das, A. Evaluation of Edible Oyster Mushroom (Pleurotus ostreatus) on Oxidative Stress and Neurological Cognitive Disorder in Streptozotocin –Diabetic Rats. Clin. Investig. (Lond.) 2018, 07, 43–52. [Google Scholar] [CrossRef] [Green Version]
  21. Manzi, P.; Gambelli, L.; Marconi, S.; Vivanti, V.; Pizzoferrato, L. Nutrients in edible mushrooms: An inter-species comparative study. Food Chem. 1999, 65, 477–482. [Google Scholar] [CrossRef]
  22. Oyetayo, O.V.; Ariyo, O.O. Micro and Macronutrient Properties of Pleurotus ostreatus (Jacq.:Fries) Cultivated on Different Wood Substrates. Jordan J. Biol. Sci. 2013, 6, 223–226. [Google Scholar] [CrossRef] [Green Version]
  23. Mendez, L.A.; Sandoval Castro, C.A.; Belmar Casso, R.; Capetillo Leal, C.M. Effect of substrate and harvest on the amino acid profile of Oyster mushroom (Pleurotus ostreatus). J. Food Compos. Anal. 2005, 18, 447–450. [Google Scholar] [CrossRef]
  24. Sopanrao PATIL, S.; Abrar AHMED, S.; Manoharrao TELANG, S.; Mushtaq Vaseem BAIG, M. the Nutritional Value of Pleurotus Ostreatus (Jacq.:Fr.) Kumm Cultivated on Different Lignocellulosic Agro-Wastes. Innov. Rom. Food Biotechnol. 2010, 7, 66–76. [Google Scholar]
  25. Mattila, P.; Salo-Väänänen, P.; Könkö, K.; Aro, H.; Jalava, T. Basic composition and amino acid contents of mushrooms cultivated in Finland. J. Agric. Food Chem. 2002, 50, 6419–6422. [Google Scholar] [CrossRef]
  26. Bach, F.; Helm, C.V.; Bellettini, M.B.; Maciel, G.M.; Haminiuk, C.W.I. Edible mushrooms: A potential source of essential amino acids, glucans and minerals. Int. J. Food Sci. Technol. 2017, 52, 2382–2392. [Google Scholar] [CrossRef]
  27. Zervakis, G.I.; Bekiaris, G.; Tarantilis, P.A.; Pappas, C.S. Rapid strain classification and taxa delimitation within the edible mushroom genus Pleurotus through the use of diffuse reflectance infrared Fourier transform (DRIFT) spectroscopy. Fungal Biol. 2012, 116, 715–728. [Google Scholar] [CrossRef]
  28. Jerley, A.A.; Rani, J.J.P.; Rajalakshmi, M.; Gnanam, S.T. Impact of Mushroom Pleurotus Ostreatus on Synthesis of Chitosan & Its Effects in Antioxidant & Antibacterial Activity. JETIR 2020, 7, 399–415. [Google Scholar]
  29. Radzki, W.; Kalbarczyk, J. Water soluble polysaccharides content in three species of edible and medicinal mushrooms: Lentinula edodes, Pleurotus ostreatus, Agaricus blazei. Herba Pol. 2010, 56, 31–38. [Google Scholar]
  30. Das, B.; Rajkonwar, J.; Jagannath, A.; Raul, P.K.; Deb, U. Infra-red spectra of different species of cultivated oyster mushrooms: Possible tool for identifying bioactive compounds and establishing taxonomic linkage. Def. Life Sci. J. 2020, 5, 118–124. [Google Scholar] [CrossRef]
  31. Stamets, P. Growing Gourmet and Medical Mushrooms; Ten Speed Press: New York, NY, USA, 2000; ISBN 978-1-60774-138-1. [Google Scholar]
  32. UPOV. International Union for the Protection of New Varieties of Plants. Oyster Mushroom; King Oyster Mushroom; Lung Oyster Mushroom; UPOV: Geneva, Switzerland, 2003; pp. 1–35. [Google Scholar]
  33. Singleton, V.L.; Rossi, J.A.J. Colorimetry to total phenolics with phosphomolybdic acid reagents. Am. J. Enol. Vinic. 1965, 16, 144–158. [Google Scholar]
  34. Benzie, I.F.F.; Strain, J.J. The Ferric Reducing Ability of Plasma (FRAP) as a Measure of “Antioxidant Power”: The FRAP Assay. Anal. Biochem. 1996, 239, 70–76. [Google Scholar] [CrossRef] [PubMed] [Green Version]
  35. Ostertagová, E.; Ostertag, O.; Kováč, J. Methodology and application of the Kruskal-Wallis test. Appl. Mech. Mater. 2014, 611, 115–120. [Google Scholar] [CrossRef]
  36. Ringnér, M. What is principal component analysis? Nat. Biotechnol. 2008, 26, 303–304. [Google Scholar] [CrossRef] [PubMed]
  37. Sampaio, P.; Soares, A.; Castanho, A.; Almeida, A.S.; Oliveira, J.; Brites, C. Dataset of Near-infrared spectroscopy measurement for amylose determination using PLS algorithms. Data Br. 2017, 15, 389–396. [Google Scholar] [CrossRef]
  38. Tharwat, A.; Gaber, T.; Ibrahim, A.; Hassanien, A.E. Linear discriminant analysis: A detailed tutorial. AI Commun. 2017, 30, 169–190. [Google Scholar] [CrossRef] [Green Version]
  39. Beć, K.B.; Huck, C.W. Breakthrough potential in near-infrared spectroscopy: Spectra simulation. A review of recent developments. Front. Chem. 2019, 7, 1–22. [Google Scholar] [CrossRef] [Green Version]
  40. Mikola, E.; Geösel, A.; Stefanovits-Bányai, É.; Fodor, M. Quantitative determination of macro components and classification of some cultivated mushrooms using near- infrared spectroscopy. J. Food Process. Preserv. 2020, 1–11. [Google Scholar] [CrossRef]
  41. Rácz, A.; Héberger, K.; Fodor, M. Quantitative determination and classification of energy drinks using near-infrared spectroscopy. Anal. Bioanal. Chem. 2016, 408, 6403–6411. [Google Scholar] [CrossRef] [Green Version]
Figure 1. Total free amino acid (fAA) concentration and multiple pairwise comparisons of cultivars.
Sensors 20 06632 g001
Figure 2. Cysteine (a) and methionine (b) concentration and multiple pairwise comparisons of cultivars (DL = 1 μg/100 g). (“A–F” = Conover-Iman post hoc test groups).
Sensors 20 06632 g002
Figure 3. Total polyphenol content (TPC) and multiple pairwise comparisons of cultivars. (“A-H” = Conover-Iman post hoc test groups).
Sensors 20 06632 g003
Figure 4. FRAP values and multiple pairwise comparisons for FRAP values of cultivars. (“A-H” = Conover-Iman post hoc test groups).
Sensors 20 06632 g004
Figure 5. FT-NIR spectra of differential cultivars and their second derivative.
Sensors 20 06632 g005
Figure 6. FT-NIR spectra in measurement range 9000–5400 cm−1.
Sensors 20 06632 g006
Figure 7. FT-NIR spectra in measurement range 5400–3800 cm−1.
Sensors 20 06632 g007
Figure 8. Principal component analysis (PCA) test result PC1 vs. PC2 (a) and PC1 vs. PC3 (b).
Sensors 20 06632 g008
Figure 9. Median linkage clustering using Squared Euclidean distance.
Sensors 20 06632 g009
Figure 10. Linear discriminant analysis (LDA) results for total free amino acids (a), cysteine (b), methionine (c) and proline (d) content.
Sensors 20 06632 g010
Figure 11. LDA results for TPC (a) and FRAP (b) value.
Sensors 20 06632 g011
Table 1. Summary of the examples for the determination of amino acid content, antioxidant capacity (FRAP), total phenol content (TPC) and classification of Pleurotus ostreatus.
Examined propertyMethodReferences
Free radical scavenging activityDPPH value[2,7,14,15,16,17,18,19],
FRAP value[2,19,20]
Total polyphenol contentFolin Ciocalteu method[2,17,18,19]
Active antioxidant polysaccharidesHPLC[15]
Amino acid contentHPLC with fluorescence detector[2,21,22,23,24,25,26]
Glucans and ergosterolATR-FTIR[7,8]
Strain classification and taxa delimitationFT-IR[27]
Identifying bioactive compoundsATR-FTIR[27]
Antioxidant activityDPPH value and FTIR[28]
Water soluble polysaccharidesFTIR[29]
Phylogenetic relatedness—DNAFTIR[30]
DPPH: 2,2-diphenyl-1-picryl-hydrazyl; FRAP: Ferric Reducing Ability of Plasma; ATR-FTIR: Attenuated total reflection Fourier-transform infrared spectroscopy; FT-IR: Fourier-transform infrared spectroscopy.
Table 2. Spectra structure correlations in 7353–6900 cm−1 region [13,39].
Wavenumber, cm−1Spectra StructureMaterial Type
7353C–H methyl second combination bandAliphatic hydrocarbons
7300Combination of first overtone of methyl C–H stretching and CH3 bending Aromatic hydrocarbons
7194Combination of first overtone of methyl C–H stretching and CH3 bendingAliphatic hydrocarbons
7168C–H methylene second combination bandAliphatic hydrocarbons
7163Combination of first overtone of methyl C–H stretching and CH3 bendingAliphatic hydrocarbons
7200–7100First overtone of O–H stretching modesAlcohols
7140–6940First overtone of O–H stretching modes from phenolsPhenolic O–H
7085–7067Combination of first overtone of methylene C–H stretching and methylene C–H bending modesAliphatic hydrocarbons
7057Combination of first overtone of C–H and aryl C–HAromatic hydrocarbons
Table 3. Spectra structure correlations in 4400–4100 cm−1 region [13,39].
Wavenumber, cm−1Spectra StructureMaterial Type
4400CONH2 specifically due to peptide β-sheet structuresProteins
4365–4370CONH2 specifically due to the α-helix peptide structureProteins
4360First overtone of CH stretching and C–H bending modesC–H aryl
4348Second overtone of C–H stretching modeAmides
4333Combination of first overtone of CH2 asymmetric stretching and CH2 bending modesAliphatic hydrocarbons
4314Combination of first overtone of CH2 asymmetric stretching and CH2 bending modesAliphatic hydrocarbons
4261Combination of first overtone of CH2 symmetric stretching and CH2 bending modesAliphatic hydrocarbons
4232Combination of first overtone of CH2 symmetric stretching and CH2 bending modesAliphatic hydrocarbons
4190C–C bending and C–H stretching modesC–H Aryl
4155C–H stretching and C–H bending modesC–H Aryl
4091C–C stretching and C–H stretching modesC–H Aryl
4090CONH2 specifically due to the α-helix peptide structureProteins
Publisher’s Note: MDPI stays neutral with regard to jurisdictional claims in published maps and institutional affiliations.

