Self-Abrading Servo Electrode Helmet for Electrical Impedance Tomography


Abstract
:
1. Introduction
1.1. Background
1.1.1. Acute Stroke
1.1.2. Electrical Impedance Tomography of Acute Stroke
1.1.3. EIT Data Collection and Electrode Placement
1.2. Rationale—Self-Abrading Electrode Helmet
Ambulance and Patient Considerations
1.3. Experimental Design
2. Characterisation of Abrasion
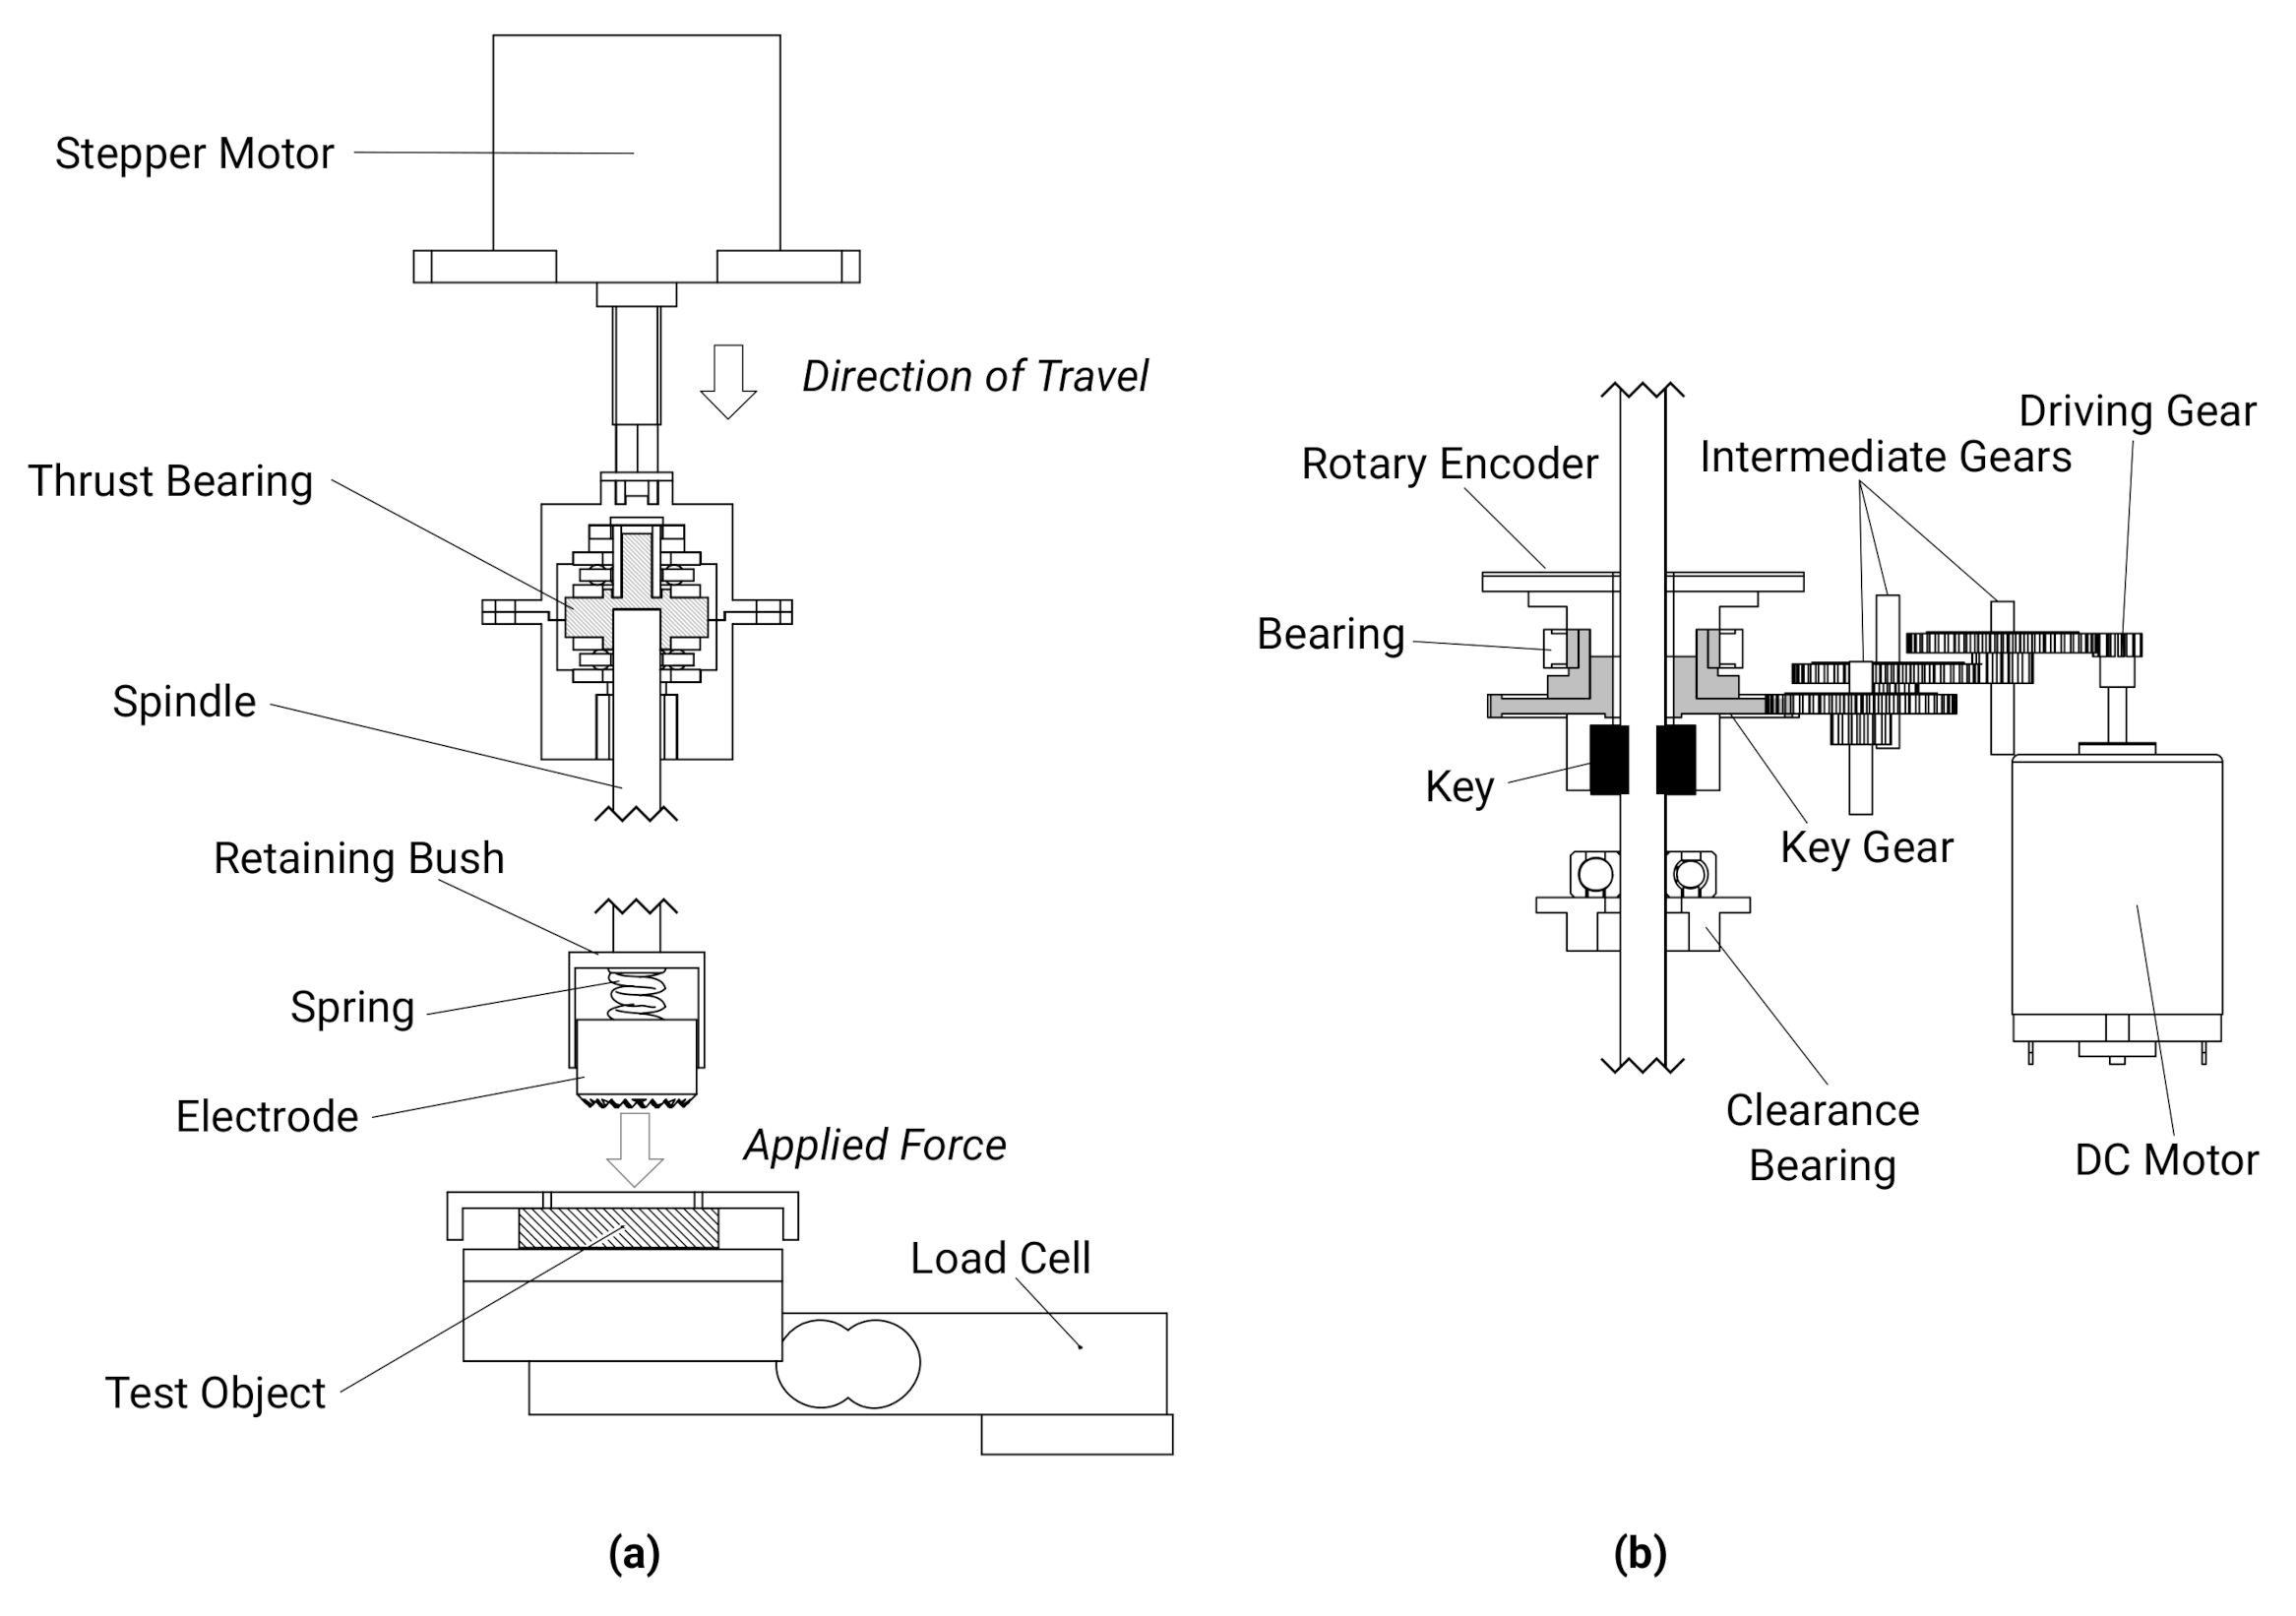
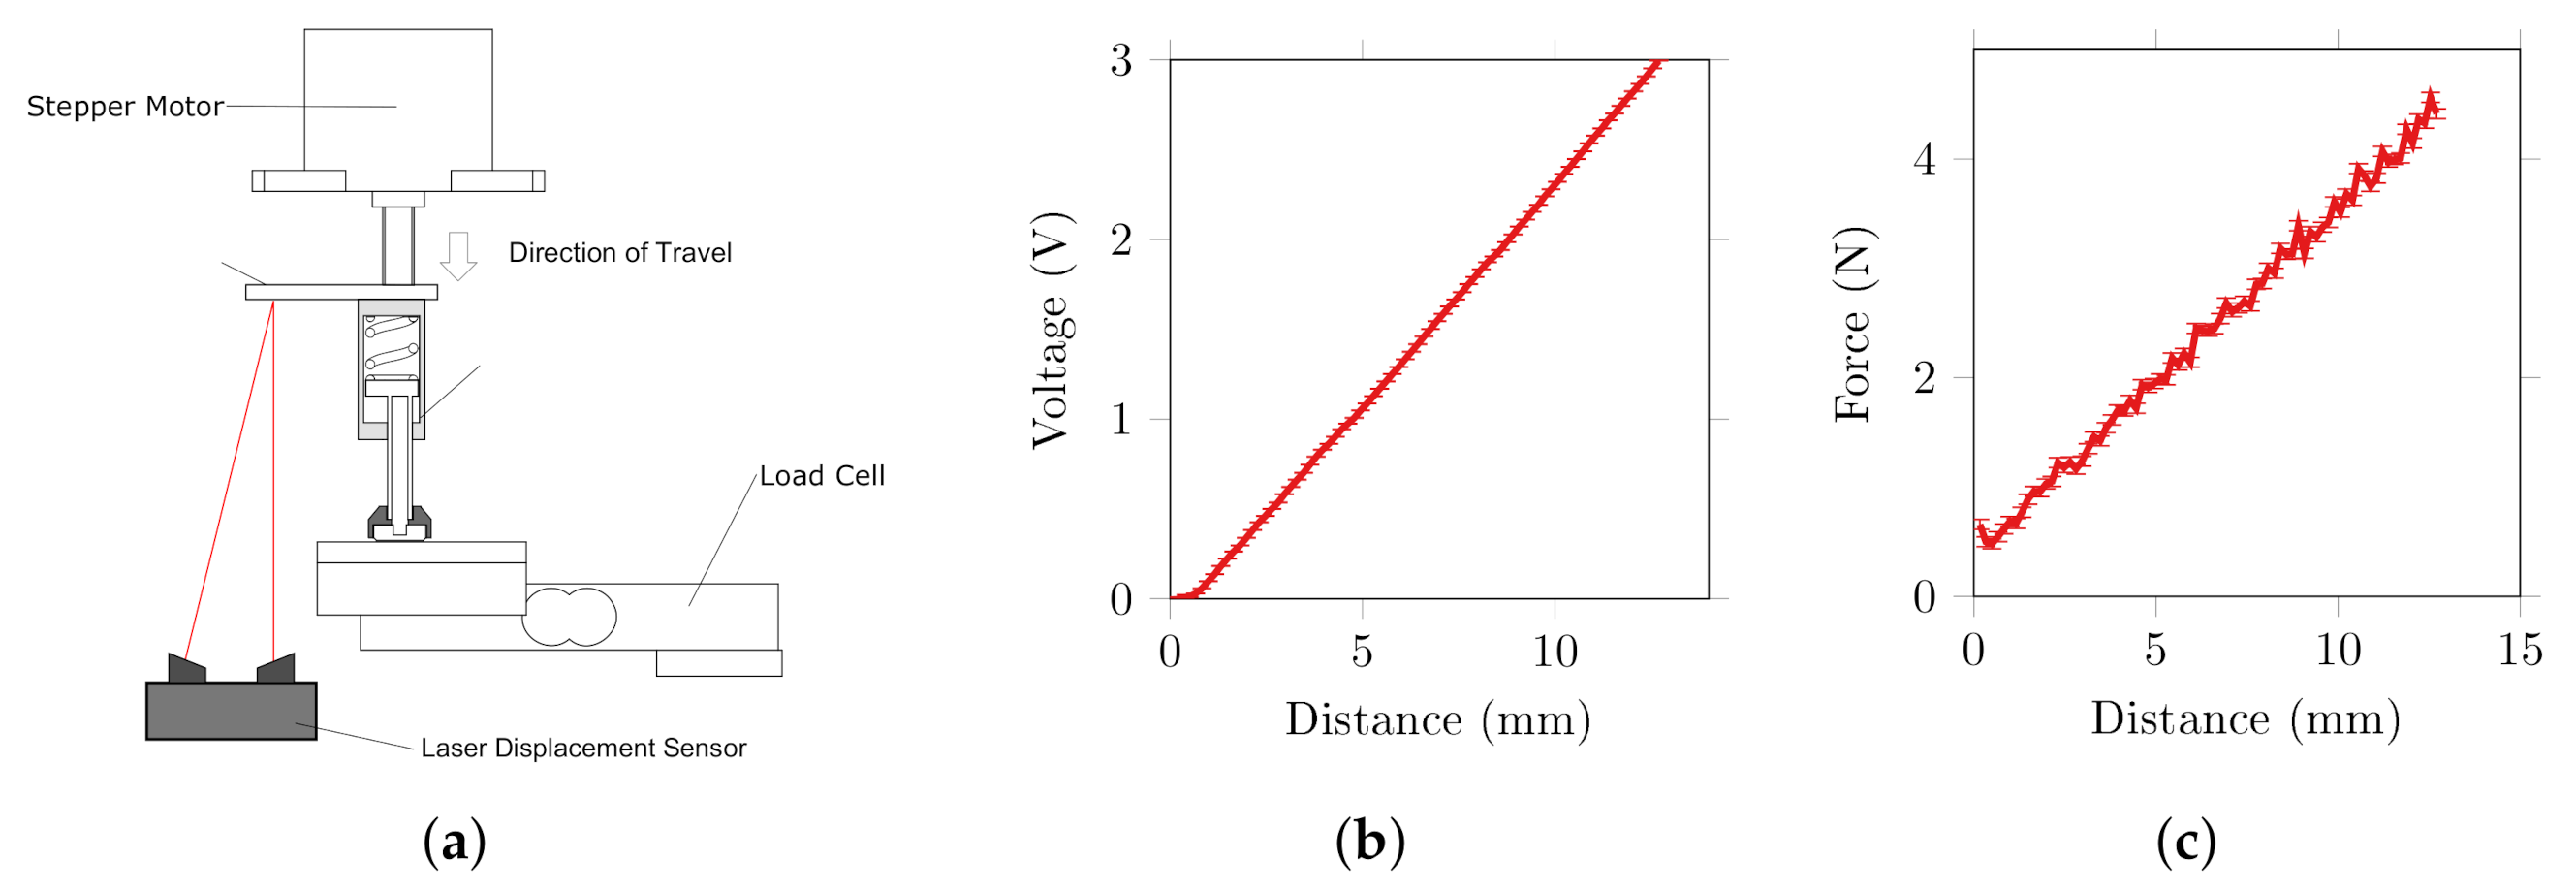
2.1. Test Rig Components and Validation
2.1.1. Force Control
2.1.2. Rotation Control
2.1.3. Impedance Measurement
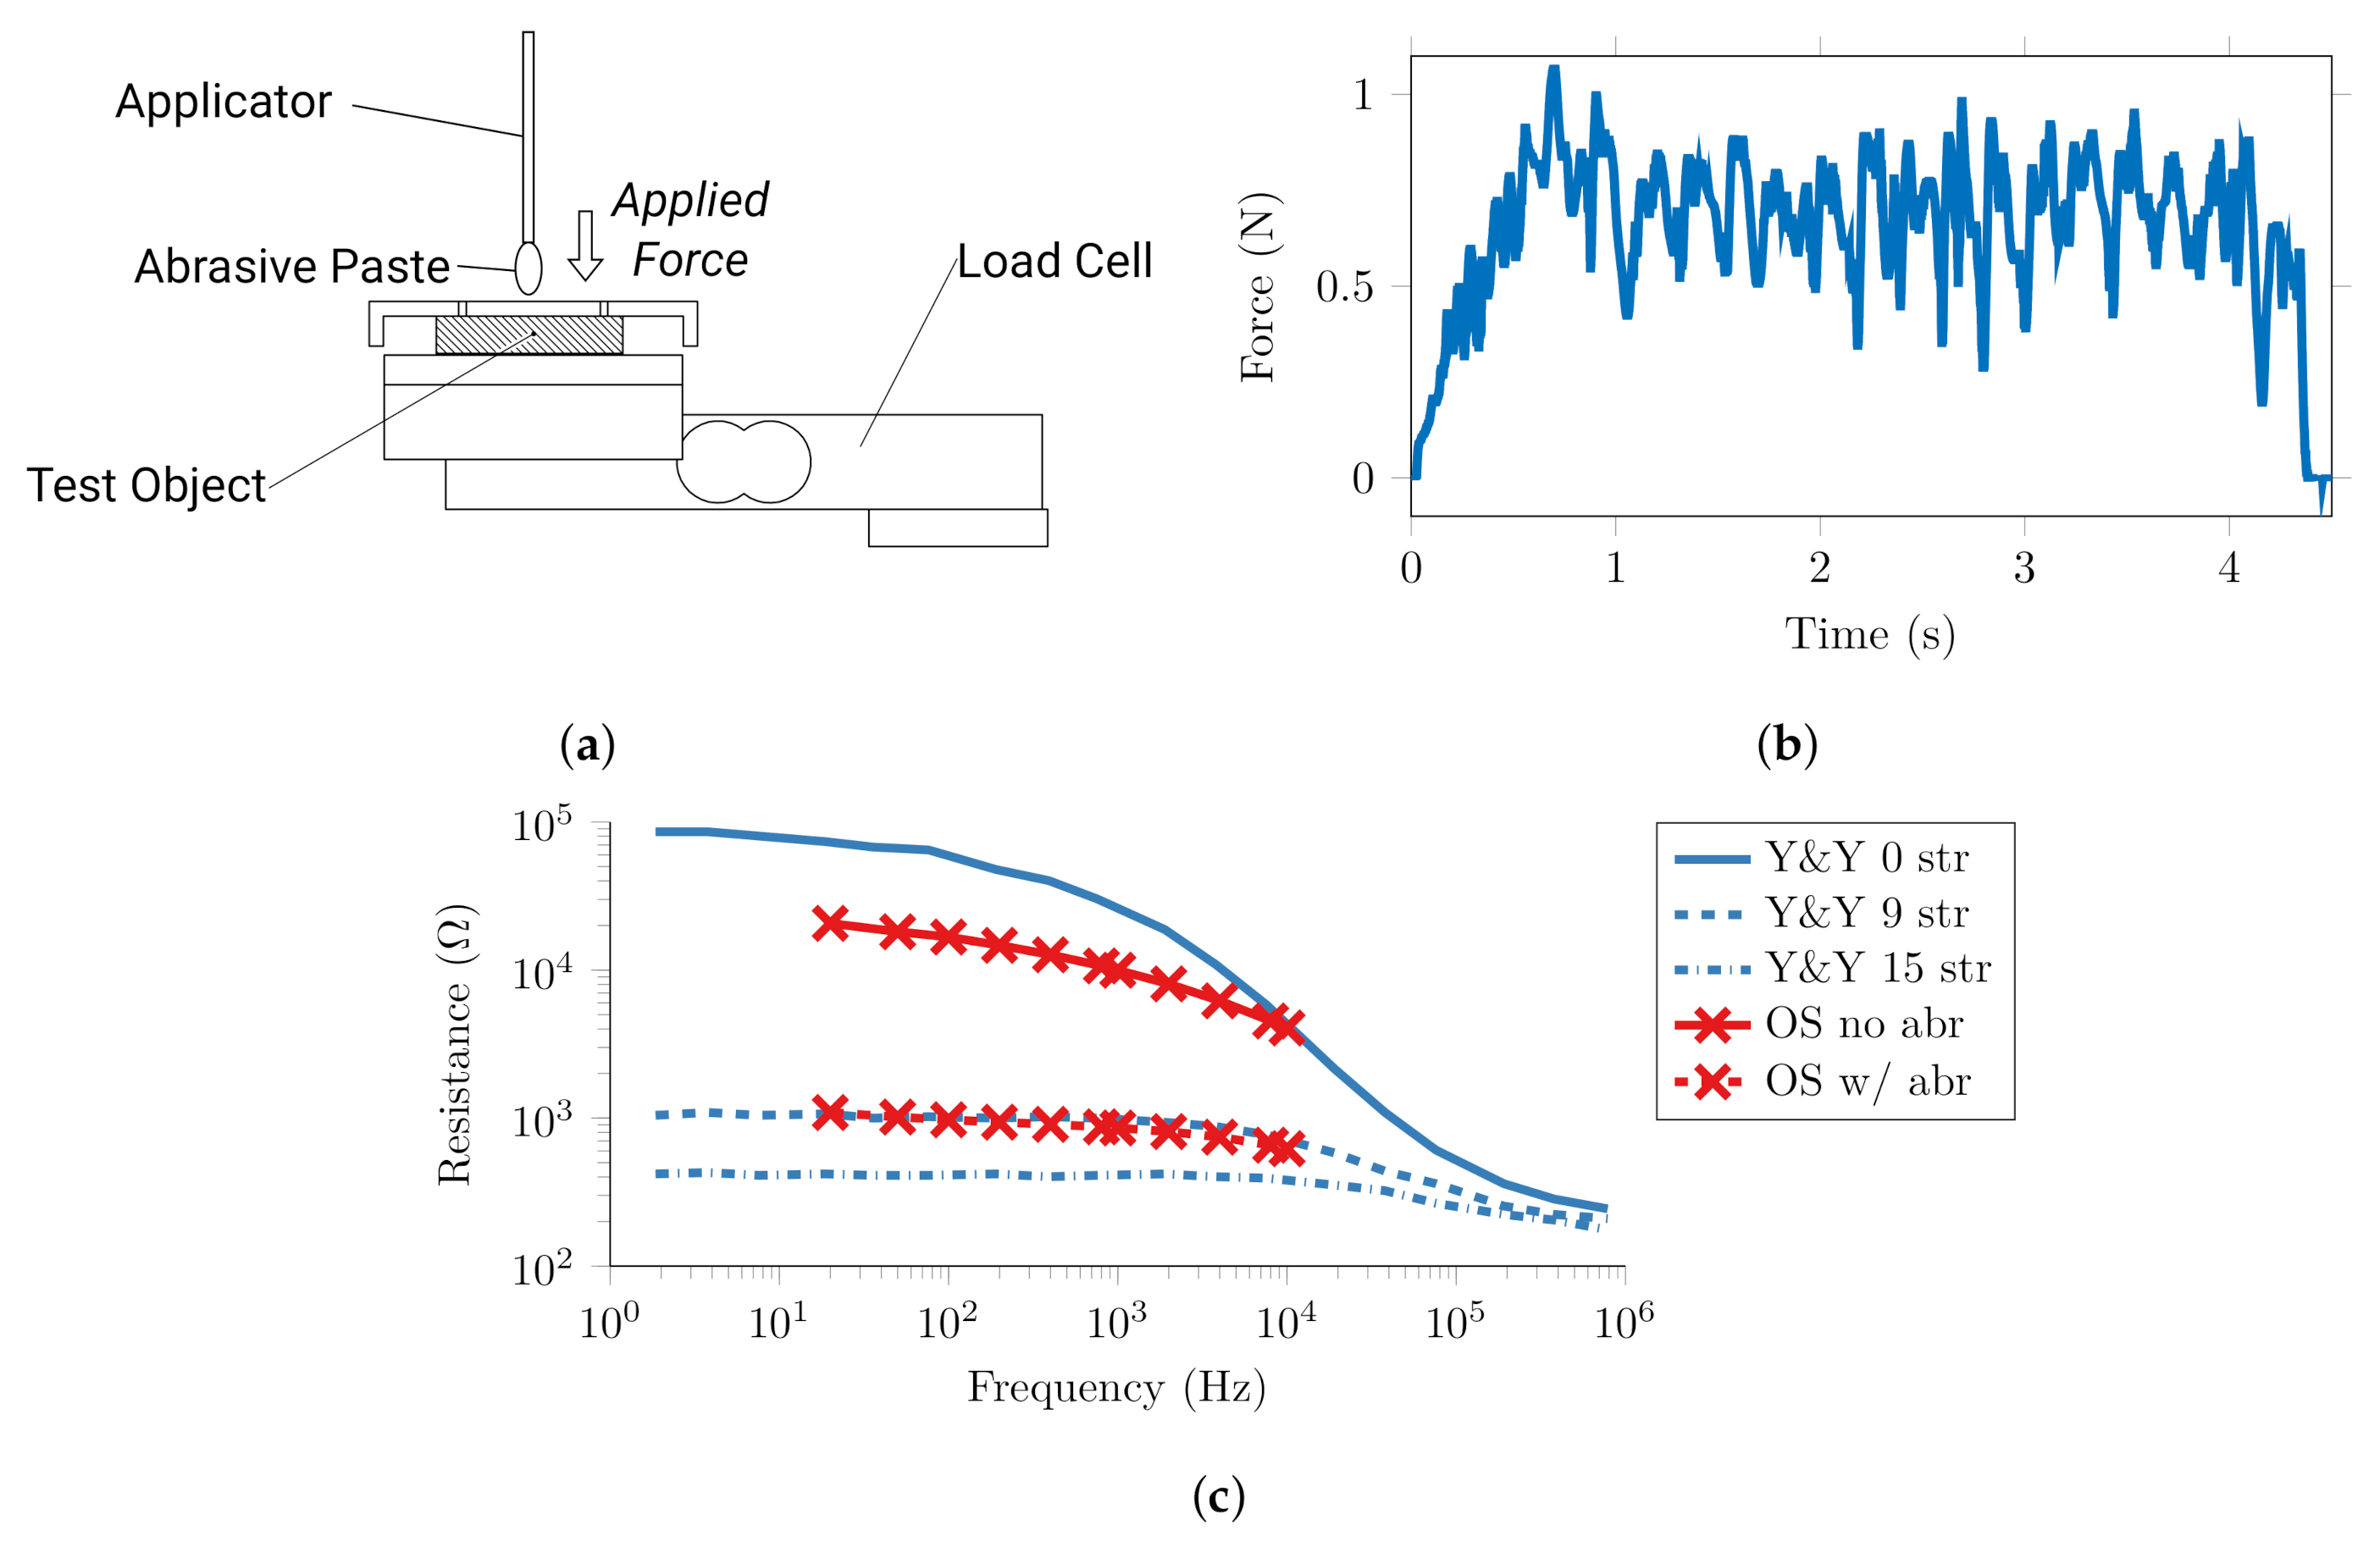
2.2. Quantification of Conventional Abrasion and Target Impedance
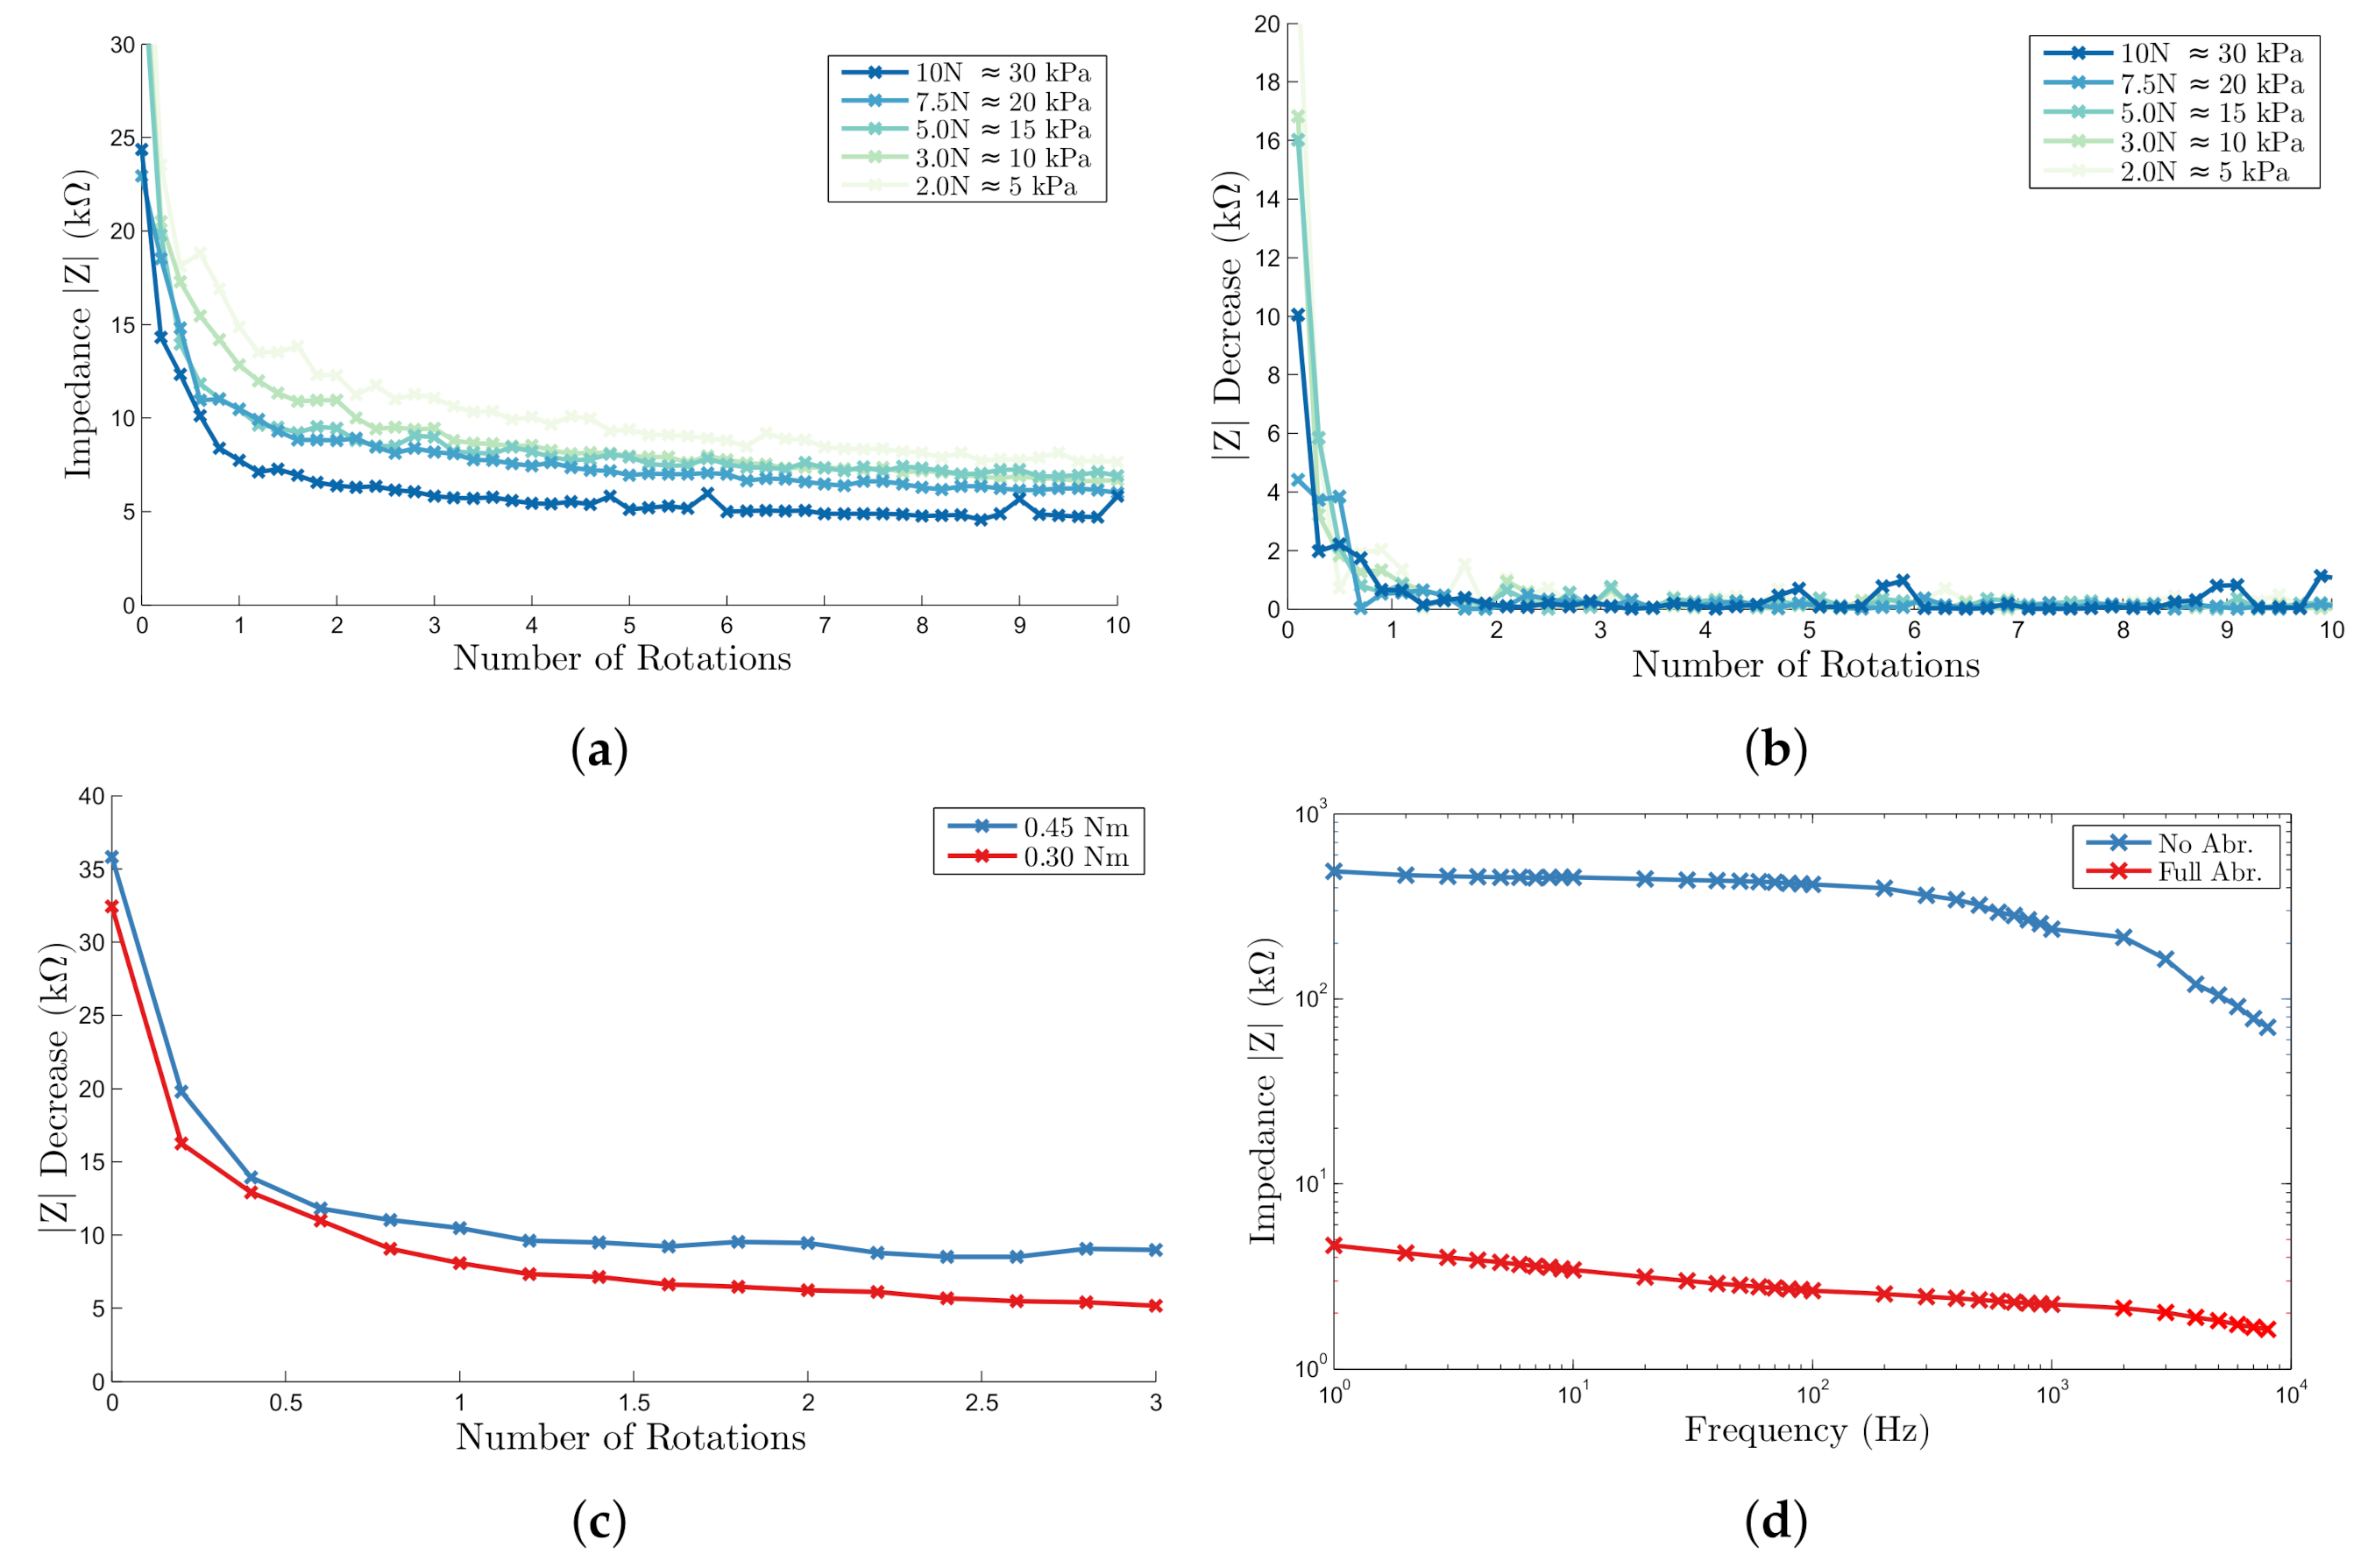
2.3. Automatic Abrasion
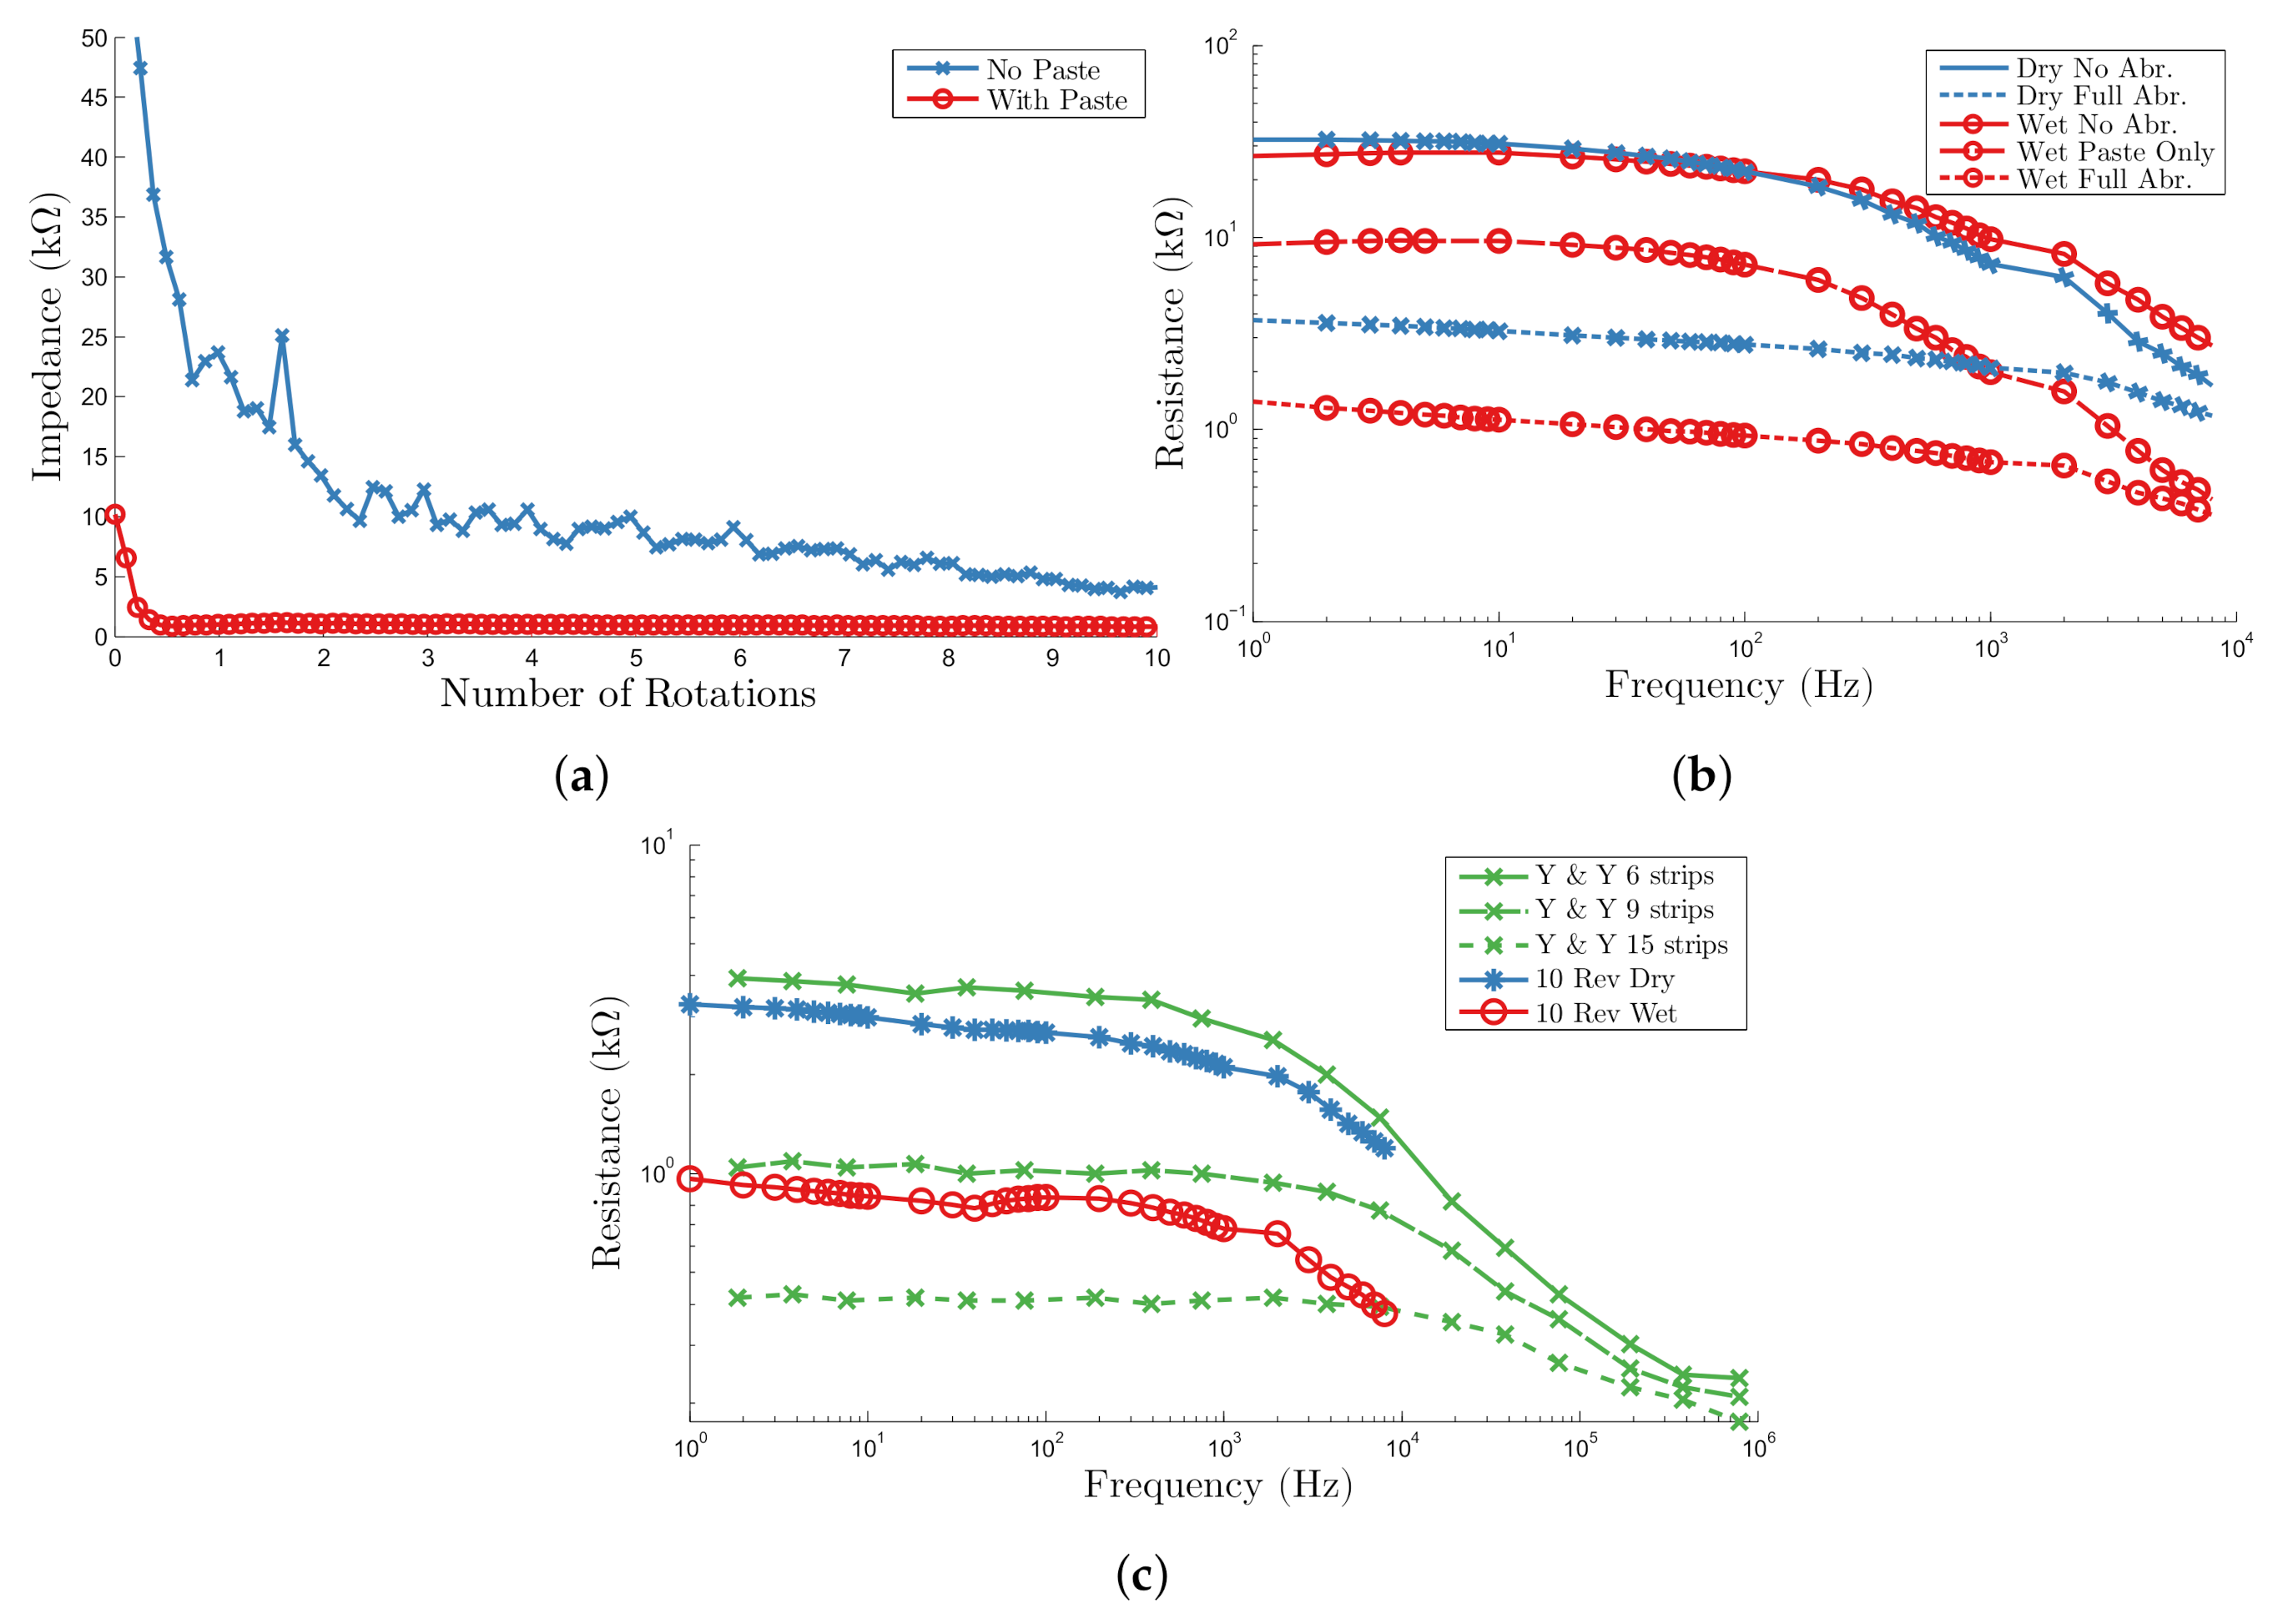
2.4. Proof of Principle on Human Skin
2.5. Implications for Single Self-Abrading Unit
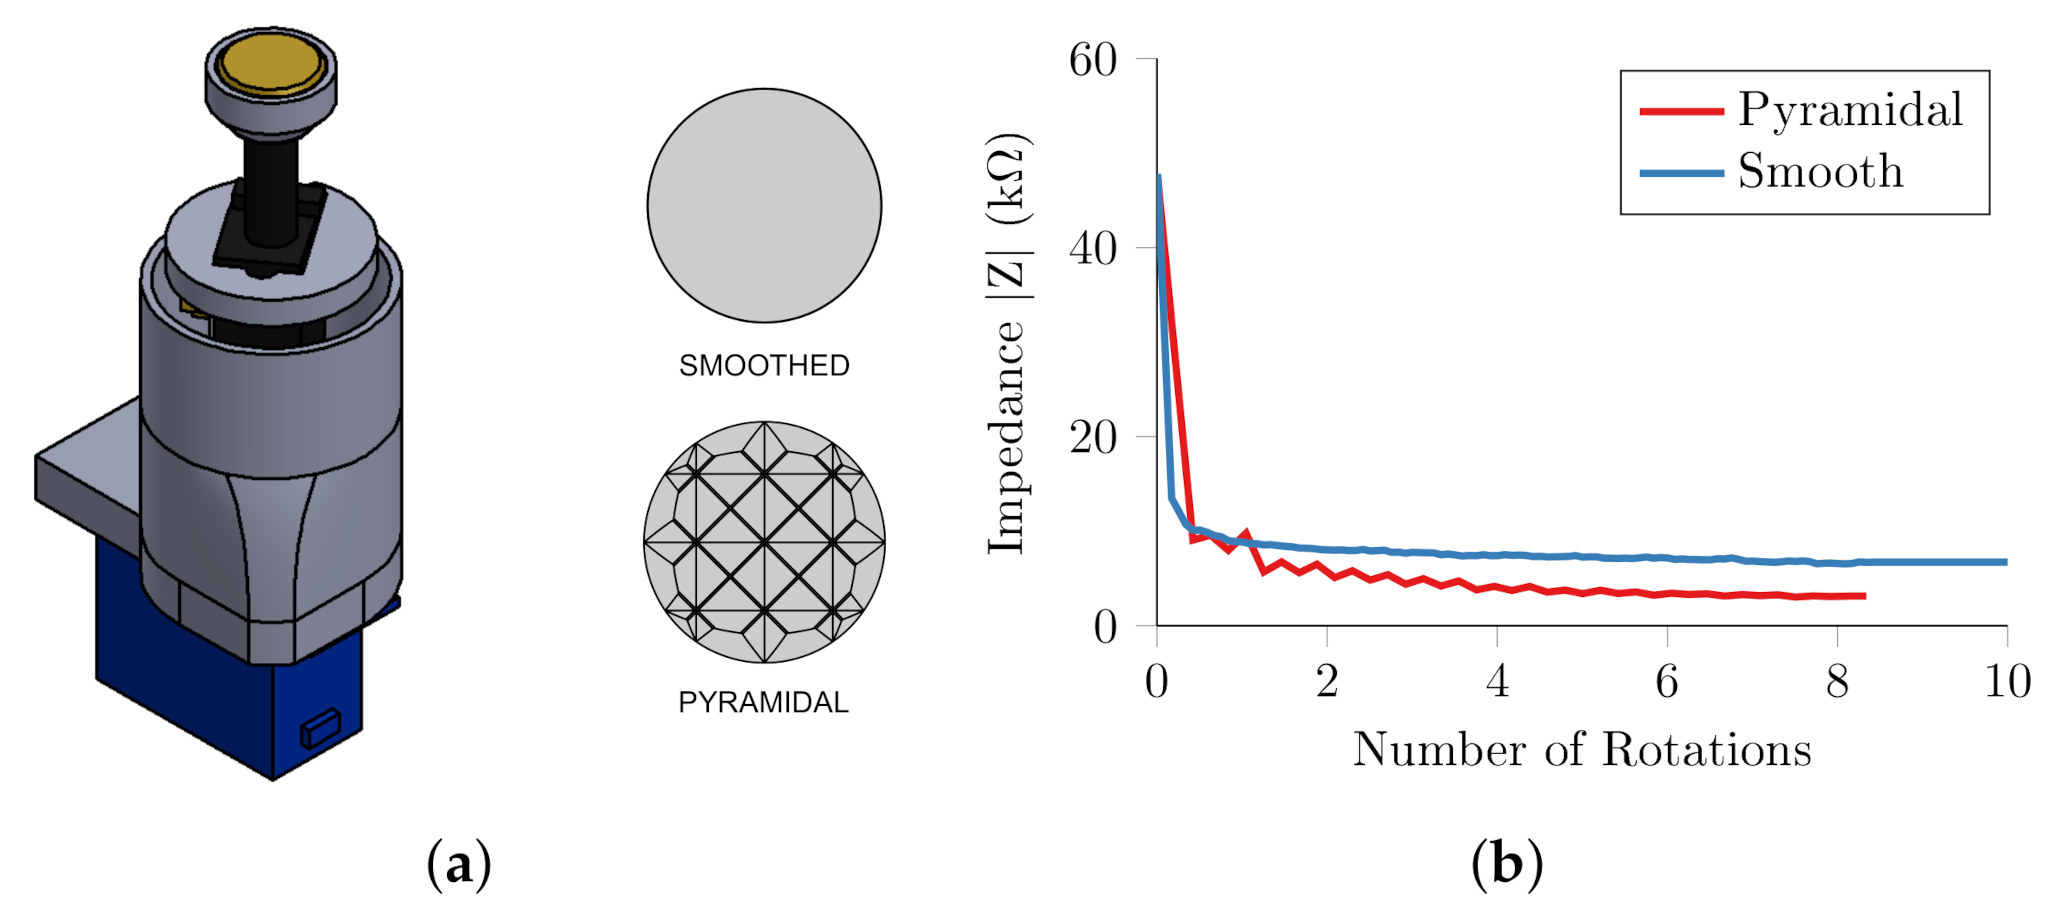
3. Self-Abrading Electrode Unit
3.1. Single Unit Design
3.1.1. Motor
3.1.2. Position Sensor and Passive Force Actuation
3.1.3. Electrode and Impedance Measurement
3.1.4. Unit Construction
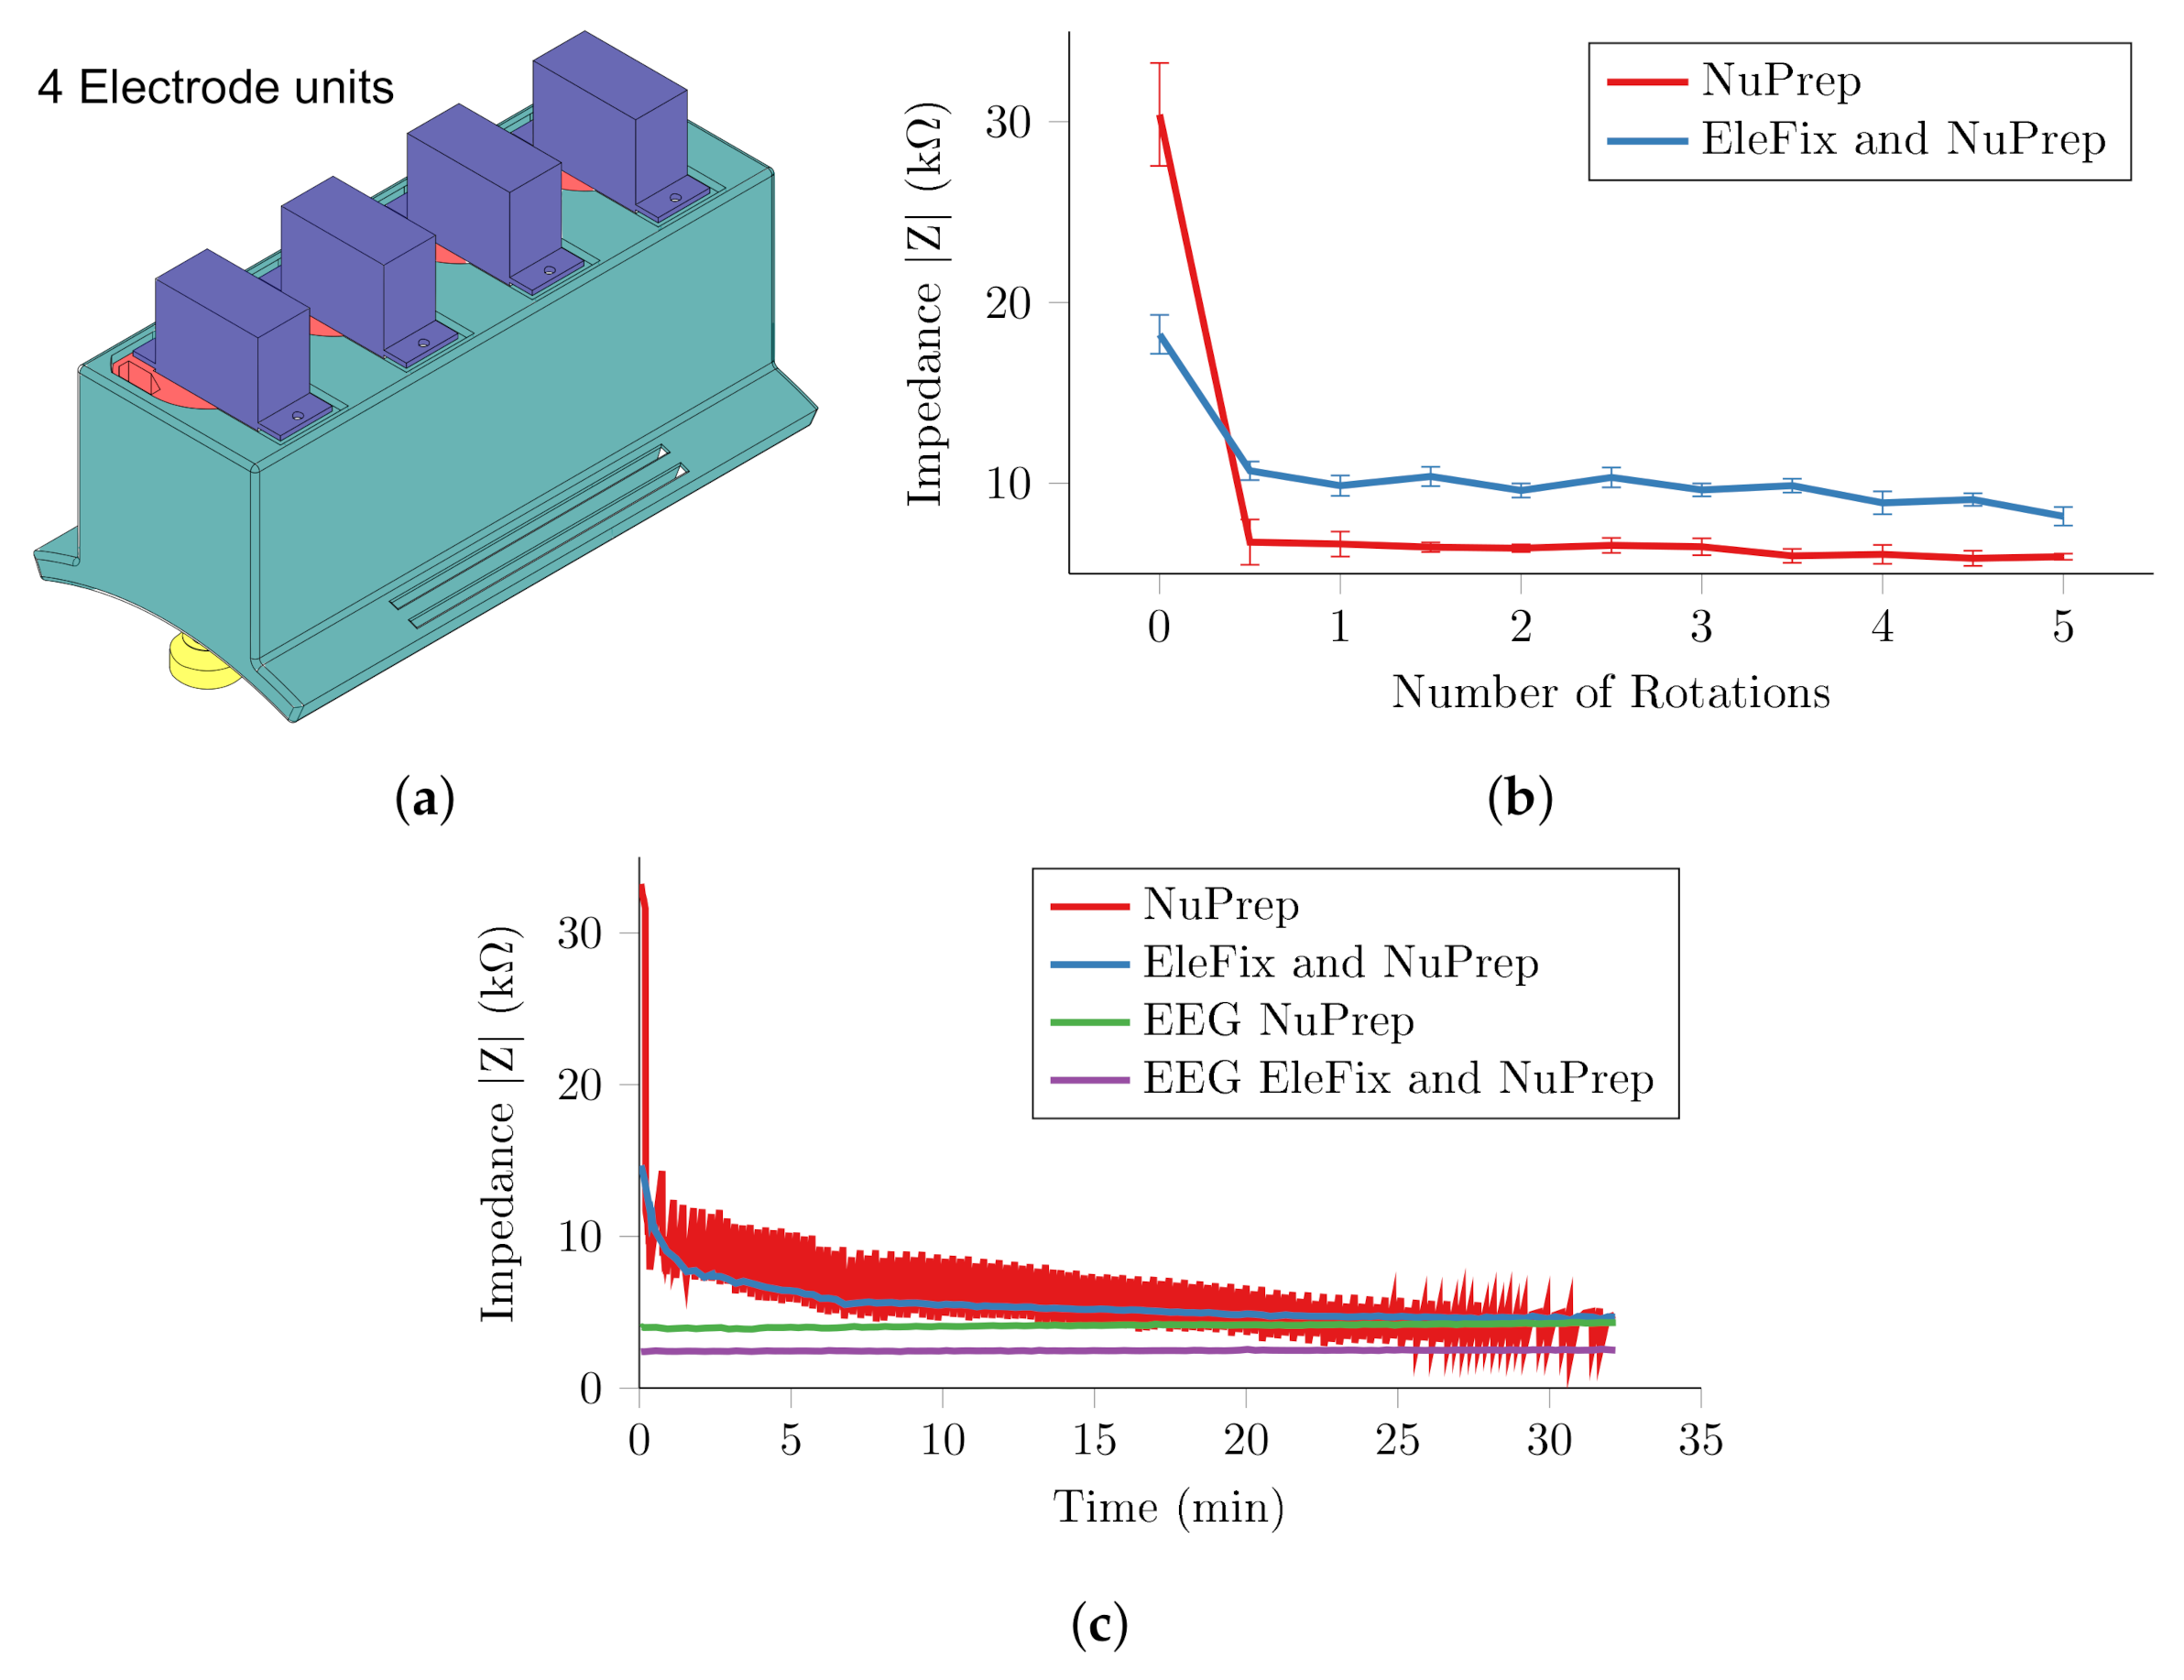
3.2. Single Unit Experiment
3.3. Four Channel System
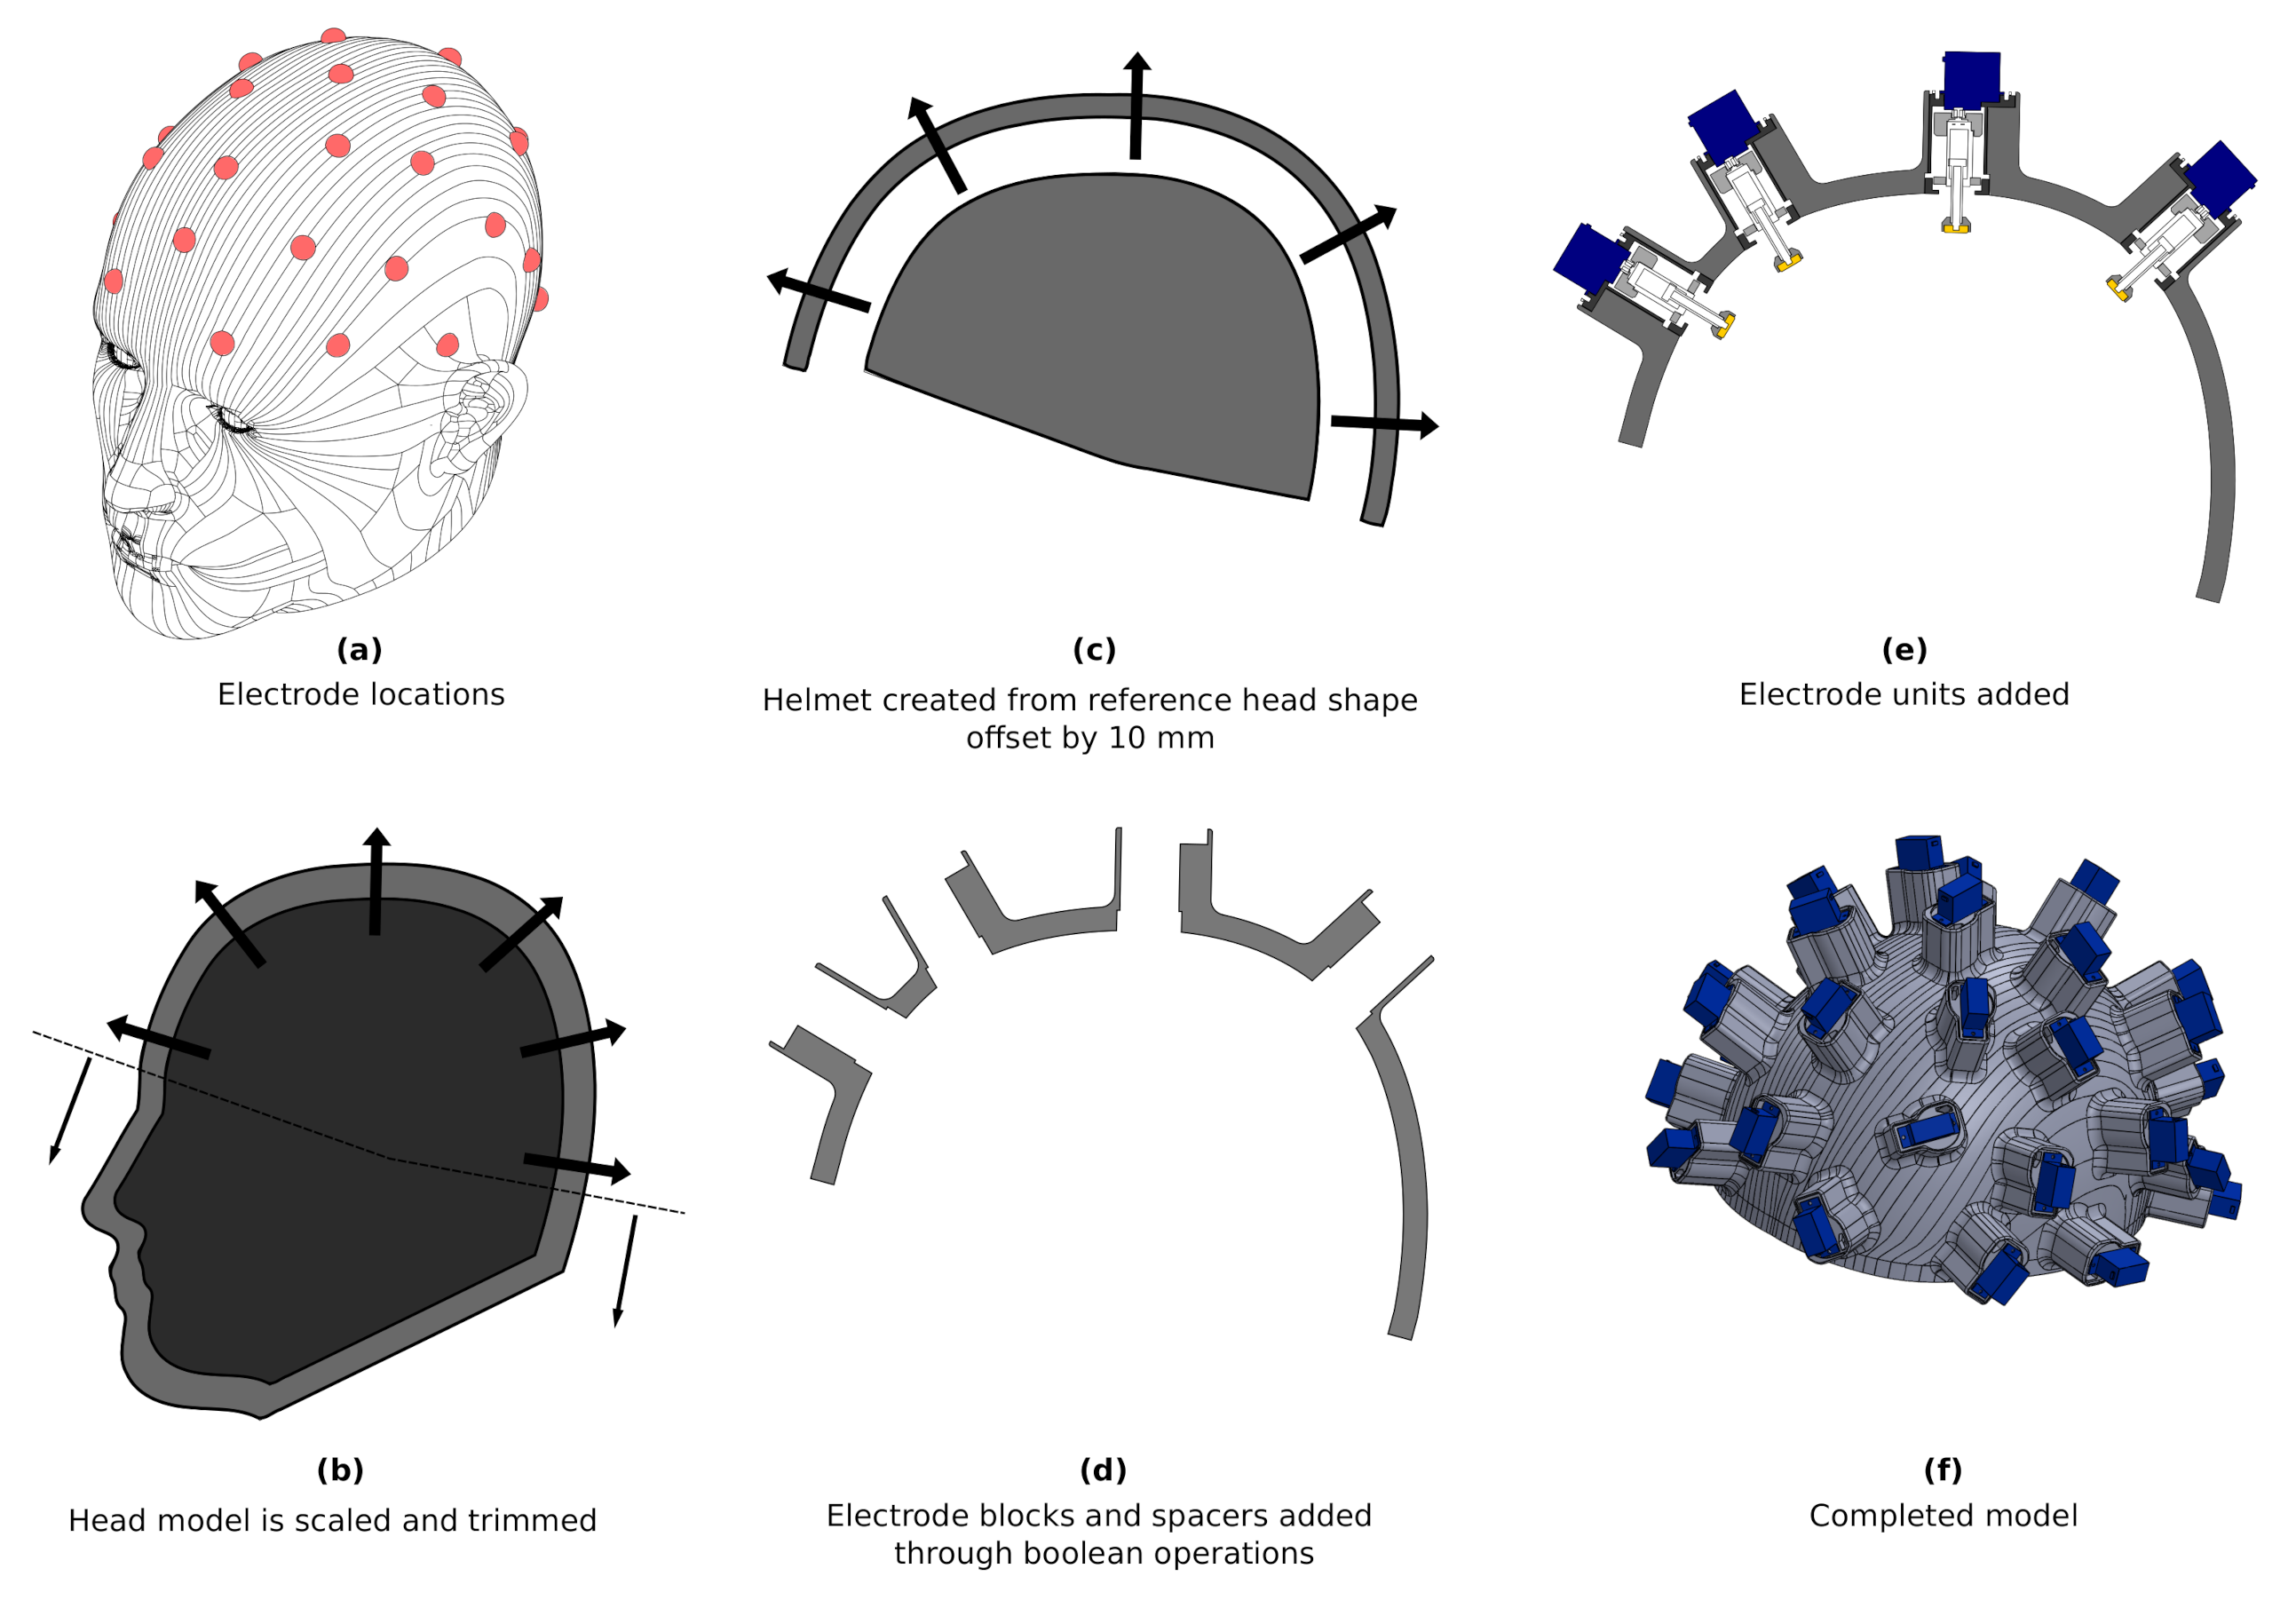
4. Electrode Bearing Helmet
4.1. Helmet Design
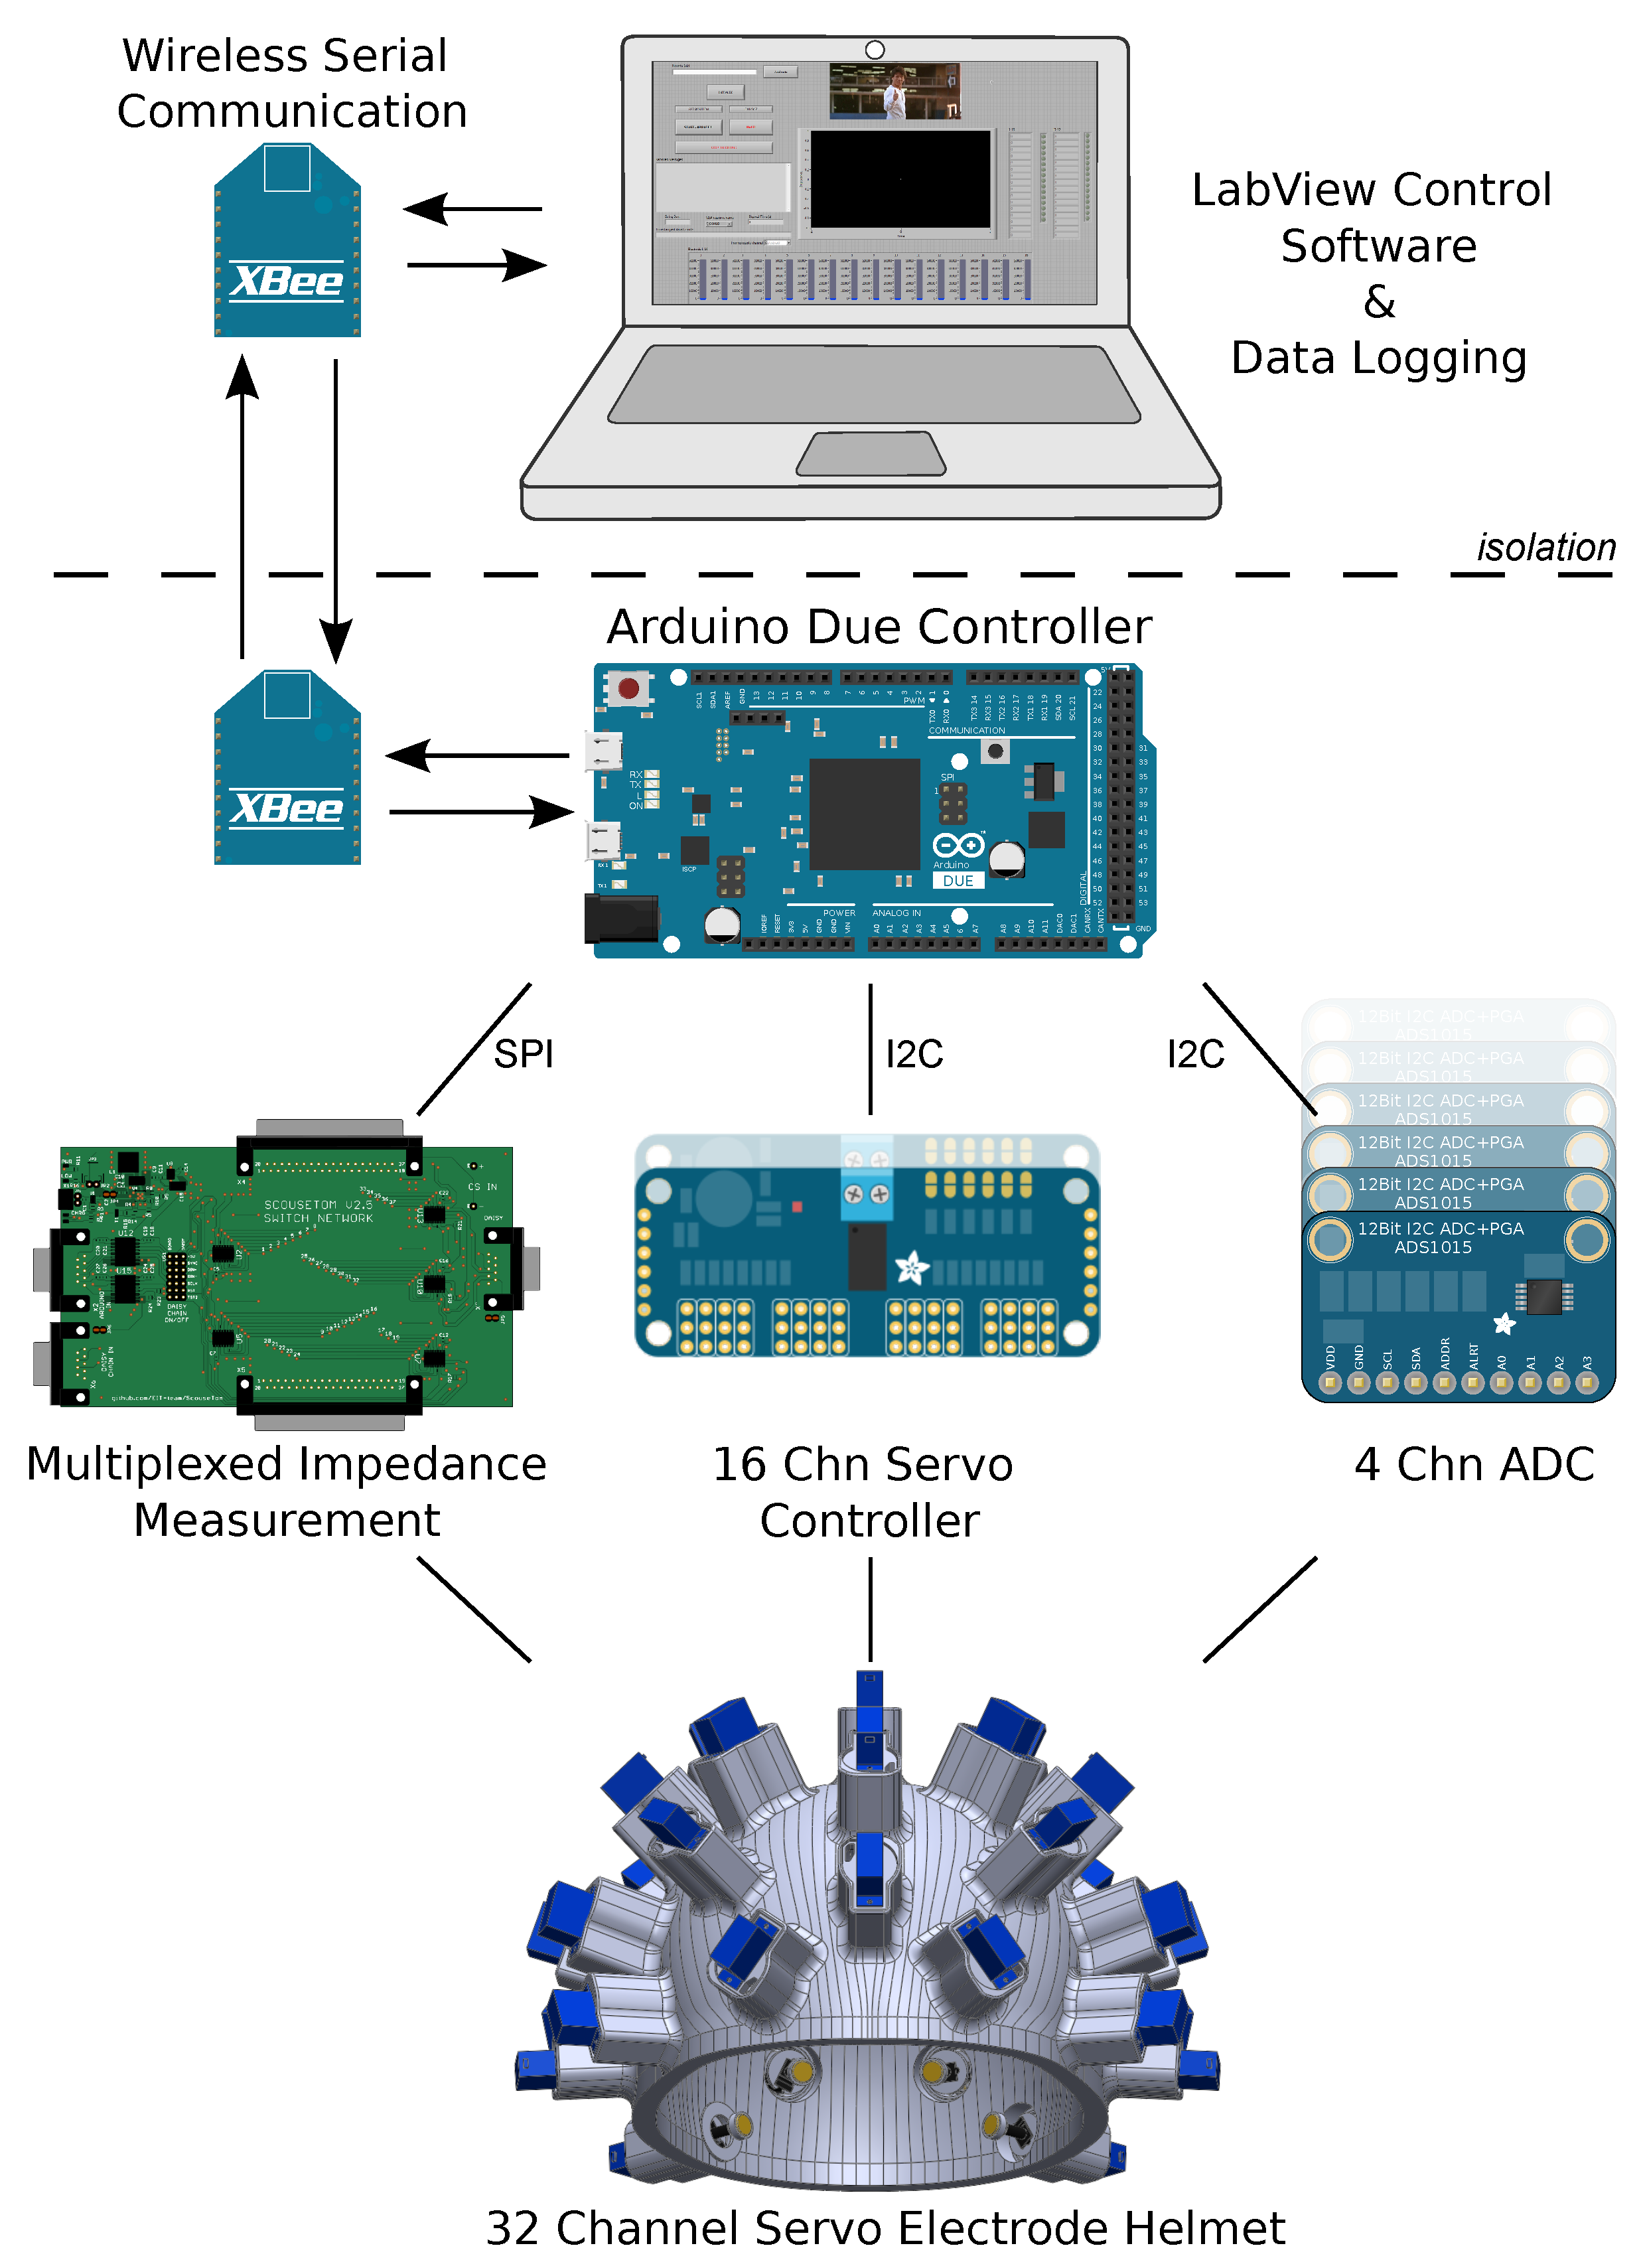
4.2. Controller
4.3. In Vivo Experiments
5. Discussion
5.1. Self-Abrading Electrode
5.2. Assessment of Helmet Design
5.3. Technical Considerations and Recommendations for Future Work
6. Conclusions
Author Contributions
Funding
Conflicts of Interest
References
- Thom, T.; Haase, N.; Rosamond, W.; Howard, V.J.; Rumsfeld, J.; Manolio, T.; Zheng, Z.J.; Flegal, K.; O’Donnell, C.; Kittner, S.; et al. Heart disease and stroke statistics—2006 update: A report from the American Heart Association Statistics Committee and Stroke Statistics Subcommittee. Circulation 2006, 113, e85–e151. [Google Scholar] [CrossRef] [PubMed] [Green Version]
- Newton, J.N.; Briggs, A.D.M.; Murray, C.J.L.; Dicker, D.; Foreman, K.J.; Wang, H.; Naghavi, M.; Forouzanfar, M.H.; Ohno, S.L.; Barber, R.M.; et al. Changes in health in England, with analysis by English regions and areas of deprivation, 1990–2013: A systematic analysis for the Global Burden of Disease Study 2013. Lancet 2015, 386, 2257–2274. [Google Scholar] [CrossRef]
- Stroke Association. Current, Future and Avoidable Costs of Stroke in the UK; Stroke Association: London, UK, 2015. [Google Scholar]
- Stemer, A.; Lyden, P. Evolution of the thrombolytic treatment window for acute ischemic stroke. Curr. Neurol. Neurosci. Rep. 2010, 10, 29–33. [Google Scholar] [CrossRef] [PubMed] [Green Version]
- NICE. Stroke and transient ischaemic attack in over 16s: Diagnosis and initial management. In Nice Guideline; National Institute for Health Care Excellence: London, UK, 2019; pp. 1–38. [Google Scholar]
- Sattin, J.A.; Olson, S.E.; Liu, L.; Raman, R.; Lyden, P.D. An expedited code stroke protocol is feasible and safe. Stroke 2006, 37, 2935–2939. [Google Scholar] [CrossRef] [PubMed]
- Eleonora, I.; Patrizia, N.; Ilaria, R.; Alessandra, D.B.; Francesco, A.; Benedetta, P.; Giovanni, P. Delay in presentation after acute ischemic stroke: The Careggi Hospital Stroke Registry. Neurol. Sci. 2014, 35, 49–52. [Google Scholar] [CrossRef] [PubMed]
- Reeves, M.J.; Arora, S.; Broderick, J.P.; Frankel, M.; Heinrich, J.P.; Hickenbottom, S.; Karp, H.; LaBresh, K.A.; Malarcher, A.; Mensah, G.; et al. Acute stroke care in the US: Results from 4 pilot prototypes of the Paul Coverdell National Acute Stroke Registry. Stroke 2005, 36, 1232–1240. [Google Scholar] [CrossRef]
- Holder, D.S. Electrical Impedance Tomography: Methods, History and Applications; CRC Press: Boca Raton, FL, USA, 2004; p. 456. [Google Scholar] [CrossRef]
- Romsauerova, A.; McEwan, A.; Horesh, L.; Yerworth, R.; Bayford, R.H.; Holder, D.S. Multi-frequency electrical impedance tomography (EIT) of the adult human head: Initial findings in brain tumours, arteriovenous malformations and chronic stroke, development of an analysis method and calibration. Physiol. Meas. 2006, 27, S147. [Google Scholar] [CrossRef]
- Dowrick, T.; Blochet, C.; Holder, D. In vivo bioimpedance measurement of healthy and ischaemic rat brain: Implications for stroke imaging using electrical impedance tomography. Physiol. Meas. 2015, 36, 1273–1282. [Google Scholar] [CrossRef]
- Hansen, A.J.; Olsen, C.E. Brain extracellular space during spreading depression and ischemia. Acta Physiol. Scand. 1980, 108, 355–365. [Google Scholar] [CrossRef]
- McCann, H.; Pisano, G.; Beltrachini, L. Variation in Reported Human Head Tissue Electrical Conductivity Values. Brain Topogr. 2019, 32, 825–858. [Google Scholar] [CrossRef] [Green Version]
- Lionheart, W.R.B. EIT reconstruction algorithms: Pitfalls, challenges and recent developments. Physiol. Meas. 2004, 25, 125–142. [Google Scholar] [CrossRef] [PubMed] [Green Version]
- Malone, E.; Jehl, M.; Arridge, S.; Betcke, T.; Holder, D. Stroke type differentiation using spectrally constrained multifrequency EIT: Evaluation of feasibility in a realistic head model. Physiol. Meas. 2014, 35, 1051–1066. [Google Scholar] [CrossRef] [PubMed]
- Yang, L.; Xu, C.; Dai, M.; Fu, F.; Shi, X.; Dong, X. A novel multi-frequency electrical impedance tomography spectral imaging algorithm for early stroke detection. Physiol. Meas. 2016, 37, 2317–2335. [Google Scholar] [CrossRef] [PubMed]
- Malone, E.; Dos Santos, G.S.; Holder, D.; Arridge, S. A Reconstruction-Classification Method for Multifrequency Electrical Impedance Tomography. IEEE Trans. Med. Imaging 2015, 34, 1486–1497. [Google Scholar] [CrossRef] [PubMed]
- McDermott, B.; Avery, J.; O’Halloran, M.; Aristovich, K.; Porter, E. Bi-frequency symmetry difference electrical impedance tomography—A novel technique for perturbation detection in static scenes. Physiol. Meas. 2019, 40, 044005. [Google Scholar] [CrossRef] [PubMed] [Green Version]
- Jehl, M.; Avery, J.; Malone, E.; Holder, D.; Betcke, T. Correcting electrode modelling errors in EIT on realistic 3D head models. Physiol. Meas. 2015, 36, 2423–2442. [Google Scholar] [CrossRef] [Green Version]
- Jehl, M.; Holder, D. Correction of electrode modelling errors in multi-frequency EIT imaging. Physiol. Meas. 2016, 37, 893–903. [Google Scholar] [CrossRef] [Green Version]
- McDermott, B.J.; Ohalloran, M.; Avery, J.; Porter, E. Bi-Frequency Symmetry Difference EIT—Feasibility and Limitations of Application to Stroke Diagnosis. IEEE J. Biomed. Health Inform. 2019, 2194, 1. [Google Scholar] [CrossRef] [Green Version]
- Vonach, M.; Marson, B.; Yun, M.; Cardoso, J.; Modat, M.; Ourselin, S.; Holder, D. A method for rapid production of subject specific finite element meshes for electrical impedance tomography of the human head. Physiol. Meas. 2012, 33, 801–816. [Google Scholar] [CrossRef] [Green Version]
- Jehl, M.; Aristovich, K.; Faulkner, M.; Holder, D. Are patient specific meshes required for EIT head imaging? Physiol. Meas. 2016, 37, 879–892. [Google Scholar] [CrossRef] [Green Version]
- McDermott, B.J.; Elahi, A.; Santorelli, A.; O’Halloran, M.; Avery, J.; Porter, E. Multi-frequency symmetry difference electrical impedance tomography with machine learning for human stroke diagnosis. Physiol. Meas. 2020. [Google Scholar] [CrossRef] [PubMed]
- Koessler, L.; Cecchin, T.; Caspary, O.; Benhadid, A.; Vespignani, H.; Maillard, L. EEG-MRI co-registration and sensor labeling using a 3D laser scanner. Ann. Biomed. Eng. 2011, 39, 983–995. [Google Scholar] [CrossRef] [PubMed]
- Ma, H.; Li, H.; Liu, X.; Li, W.; Xia, J.; Liu, B.; Shi, X.; Dong, X.; Fu, F. Real-Time Monitoring of Contact Impedance from Multiple Electrode-Scalp Interfaces during Cerebral Electrical Impedance Tomography. IEEE Access 2019, 7, 95186–95196. [Google Scholar] [CrossRef]
- Li, H.; Liu, X.; Xu, C.; Yang, B.; Fu, D.; Dong, X.; Fu, F. Managing erroneous measurements of dynamic brain electrical impedance tomography after reconnection of faulty electrodes. Physiol. Meas. 2020, 41. [Google Scholar] [CrossRef] [PubMed]
- Goren, N.; Avery, J.; Dowrick, T.; Mackle, E.; Witkowska-Wrobel, A.; Werring, D.; Holder, D. Multi-frequency electrical impedance tomography and neuroimaging data in stroke patients. Sci. Data 2018, 5, 180112. [Google Scholar] [CrossRef] [PubMed]
- Tidswell, A.T.; Bagshaw, A.P.; Holder, D.S.; Yerworth, R.J.; Eadie, L.; Murray, S.; Morgan, L.; Bayford, R.H. A comparison of headnet electrode arrays for electrical impedance tomography of the human head. Physiol. Meas. 2003, 24, 527. [Google Scholar] [CrossRef] [PubMed]
- Homölle, S.; Oostenveld, R. Using a structured-light 3D scanner to improve EEG source modeling with more accurate electrode positions. J. Neurosci. Methods 2019, 326, 108378. [Google Scholar] [CrossRef]
- Atcherson, S.R.; Gould, H.J.; Pousson, M.A.; Prout, T.M. Variability of electrode positions using electrode caps. Brain Topogr. 2007, 20, 105–111. [Google Scholar] [CrossRef]
- Russell, G.S.; Eriksen, K.J.; Poolman, P.; Luu, P.; Tucker, D.M. Geodesic photogrammetry for localizing sensor positions in dense-array EEG. Clin. Neurophysiol. 2005, 116, 1130–1140. [Google Scholar] [CrossRef]
- Dalal, S.S.; Rampp, S.; Willomitzer, F.; Ettl, S. Consequences of EEG electrode position error on ultimate beamformer source reconstruction performance. Front. Neurosci. 2014, 8, 42. [Google Scholar] [CrossRef] [Green Version]
- Wi, H.; Sohal, H.; McEwan, A.L.; Woo, E.J.; Oh, T.I. Multi-frequency electrical impedance tomography system with automatic self-calibration for long-term monitoring. IEEE Trans. Biomed. Circuits Syst. 2014, 8, 119–128. [Google Scholar] [CrossRef] [PubMed]
- Oh, T.I.; Wi, H.; Kim, D.Y.; Yoo, P.J.; Woo, E.J. A fully parallel multi-frequency EIT system with flexible electrode configuration: KHU Mark2. Physiol. Meas. 2011, 32, 835–849. [Google Scholar] [CrossRef] [PubMed]
- Guermandi, M.; Cardu, R.; Scarselli, E.F.; Guerrieri, R. Active Electrode IC for EEG and Electrical Impedance Tomography with Continuous Monitoring of Contact Impedance. IEEE Trans. Biomed. Circuits Syst. 2014, 9, 21–33. [Google Scholar] [CrossRef]
- Mathewson, K.E.; Harrison, T.J.L.; Kizuk, S.A.D. High and dry? Comparing active dry EEG electrodes to active and passive wet electrodes. Psychophysiology 2017, 54, 74–82. [Google Scholar] [CrossRef] [PubMed]
- Holder, D. Design and electrical characteristics of an electrode array for electrical impedance tomography of the female breast. Innov. Technol. Biol. Med. 1995, 16, 143–150. [Google Scholar]
- Fabrizi, L.; Sparkes, M.; Horesh, L.; Perez-Juste Abascal, J.F.; McEwan, A.; Bayford, R.H.; Elwes, R.; Binnie, C.D.; Holder, D.S. Factors limiting the application of electrical impedance tomography for identification of regional conductivity changes using scalp electrodes during epileptic seizures in humans. Physiol. Meas. 2006, 27, S163–S174. [Google Scholar] [CrossRef]
- Turner, J.; Jacques, R. Ambulance Response Programme Spring Review; Technical Report; University of Sheffield: Sheffield, UK, 2018. [Google Scholar]
- Yamamoto, T.; Yamamoto, Y. Electrical properties of the epidermal stratum corneum. Med. Biol. Eng. 1976, 14, 151–158. [Google Scholar] [CrossRef]
- Zhen, Y.-X.; Suetake, T.; Tagami, H. Number of cell layers of the stratum corneum in normal skin relationship to the anatomical location an the body, age, sex and physical parameters. Arch. Dermatol. Res. 1999, 291, 555–559. [Google Scholar] [CrossRef]
- Meckl, P.H.; Arestides, P.B.; Woods, M.C. Optimized S-curve motion profiles for minimum residual vibration. In Proceedings of the 1998 American Control Conference, Philadelphia, PA, USA, 26 June 1998; Volume 5, pp. 2627–2631. [Google Scholar] [CrossRef]
- Motmans, R.; Ceriez, E. DinBelg 2005: Body Dimensions of the Belgian Population; Technical Report; Ergonomie RC: Leuven, Belgium, 2005. [Google Scholar]
- Avery, J.; Aristovich, K.; Low, B.; Holder, D. Reproducible 3D printed head tanks for electrical impedance tomography with realistic shape and conductivity distribution. Physiol. Meas. 2017, 38, 1116–1131. [Google Scholar] [CrossRef]
- Avery, J.; Dowrick, T.; Faulkner, M.; Goren, N.; Holder, D. A Versatile and Reproducible Multi-Frequency Electrical Impedance Tomography System. Sensors 2017, 17, 280. [Google Scholar] [CrossRef]
- Jeon, S.; Chien, J.; Song, C.; Hong, J. A Preliminary Study on Precision Image Guidance for Electrode Placement in an EEG Study. Brain Topogr. 2018, 31, 174–185. [Google Scholar] [CrossRef] [PubMed]
- Arbogast, K.B.; Margulies, S.S.; Patlak, M.; Fenner, H.; Thomas, D.J. Review of Pediatric Head and Neck Injury: Implications for Helmet Standards; Technical Report; The Childrens Hospital of Philadelphia: Philadelphia, PA, USA, 2003. [Google Scholar]
- Shah, S.; Rothberger, A.; Caprio, M.; Mally, P.; Karen-Hendricks-Munoz. Quantification of impulse experienced by neonates during inter- and intra-hospital transport measured by biophysical accelerometery. J. Perinat. Med. 2008, 36, 87–92. [Google Scholar] [CrossRef] [PubMed]
- Margo, C.; Katrib, J.; Nadi, M.; Rouane, A. A four-electrode low frequency impedance spectroscopy measurement system using the AD5933 measurement chip. Physiol. Meas. 2013, 34, 391–405. [Google Scholar] [CrossRef] [PubMed]


Publisher’s Note: MDPI stays neutral with regard to jurisdictional claims in published maps and institutional affiliations. |
© 2020 by the authors. Licensee MDPI, Basel, Switzerland. This article is an open access article distributed under the terms and conditions of the Creative Commons Attribution (CC BY) license (http://creativecommons.org/licenses/by/4.0/).
Share and Cite
Avery, J.; Packham, B.; Koo, H.; Hanson, B.; Holder, D. Self-Abrading Servo Electrode Helmet for Electrical Impedance Tomography. Sensors 2020, 20, 7058. https://doi.org/10.3390/s20247058
Avery J, Packham B, Koo H, Hanson B, Holder D. Self-Abrading Servo Electrode Helmet for Electrical Impedance Tomography. Sensors. 2020; 20(24):7058. https://doi.org/10.3390/s20247058
Chicago/Turabian StyleAvery, James, Brett Packham, Hwan Koo, Ben Hanson, and David Holder. 2020. "Self-Abrading Servo Electrode Helmet for Electrical Impedance Tomography" Sensors 20, no. 24: 7058. https://doi.org/10.3390/s20247058
APA StyleAvery, J., Packham, B., Koo, H., Hanson, B., & Holder, D. (2020). Self-Abrading Servo Electrode Helmet for Electrical Impedance Tomography. Sensors, 20(24), 7058. https://doi.org/10.3390/s20247058