SoilCam: A Fully Automated Minirhizotron using Multispectral Imaging for Root Activity Monitoring

 , , ,
, , ,
Abstract
:1. Introduction
2. Background
3. Design Objective
3.1. Tube Type
3.2. Image Sensor
3.3. Locomotive Type
3.4. Control Unit
3.5. Wireless Interface
3.6. Light Source
3.7. Power Supply
3.8. System Cost
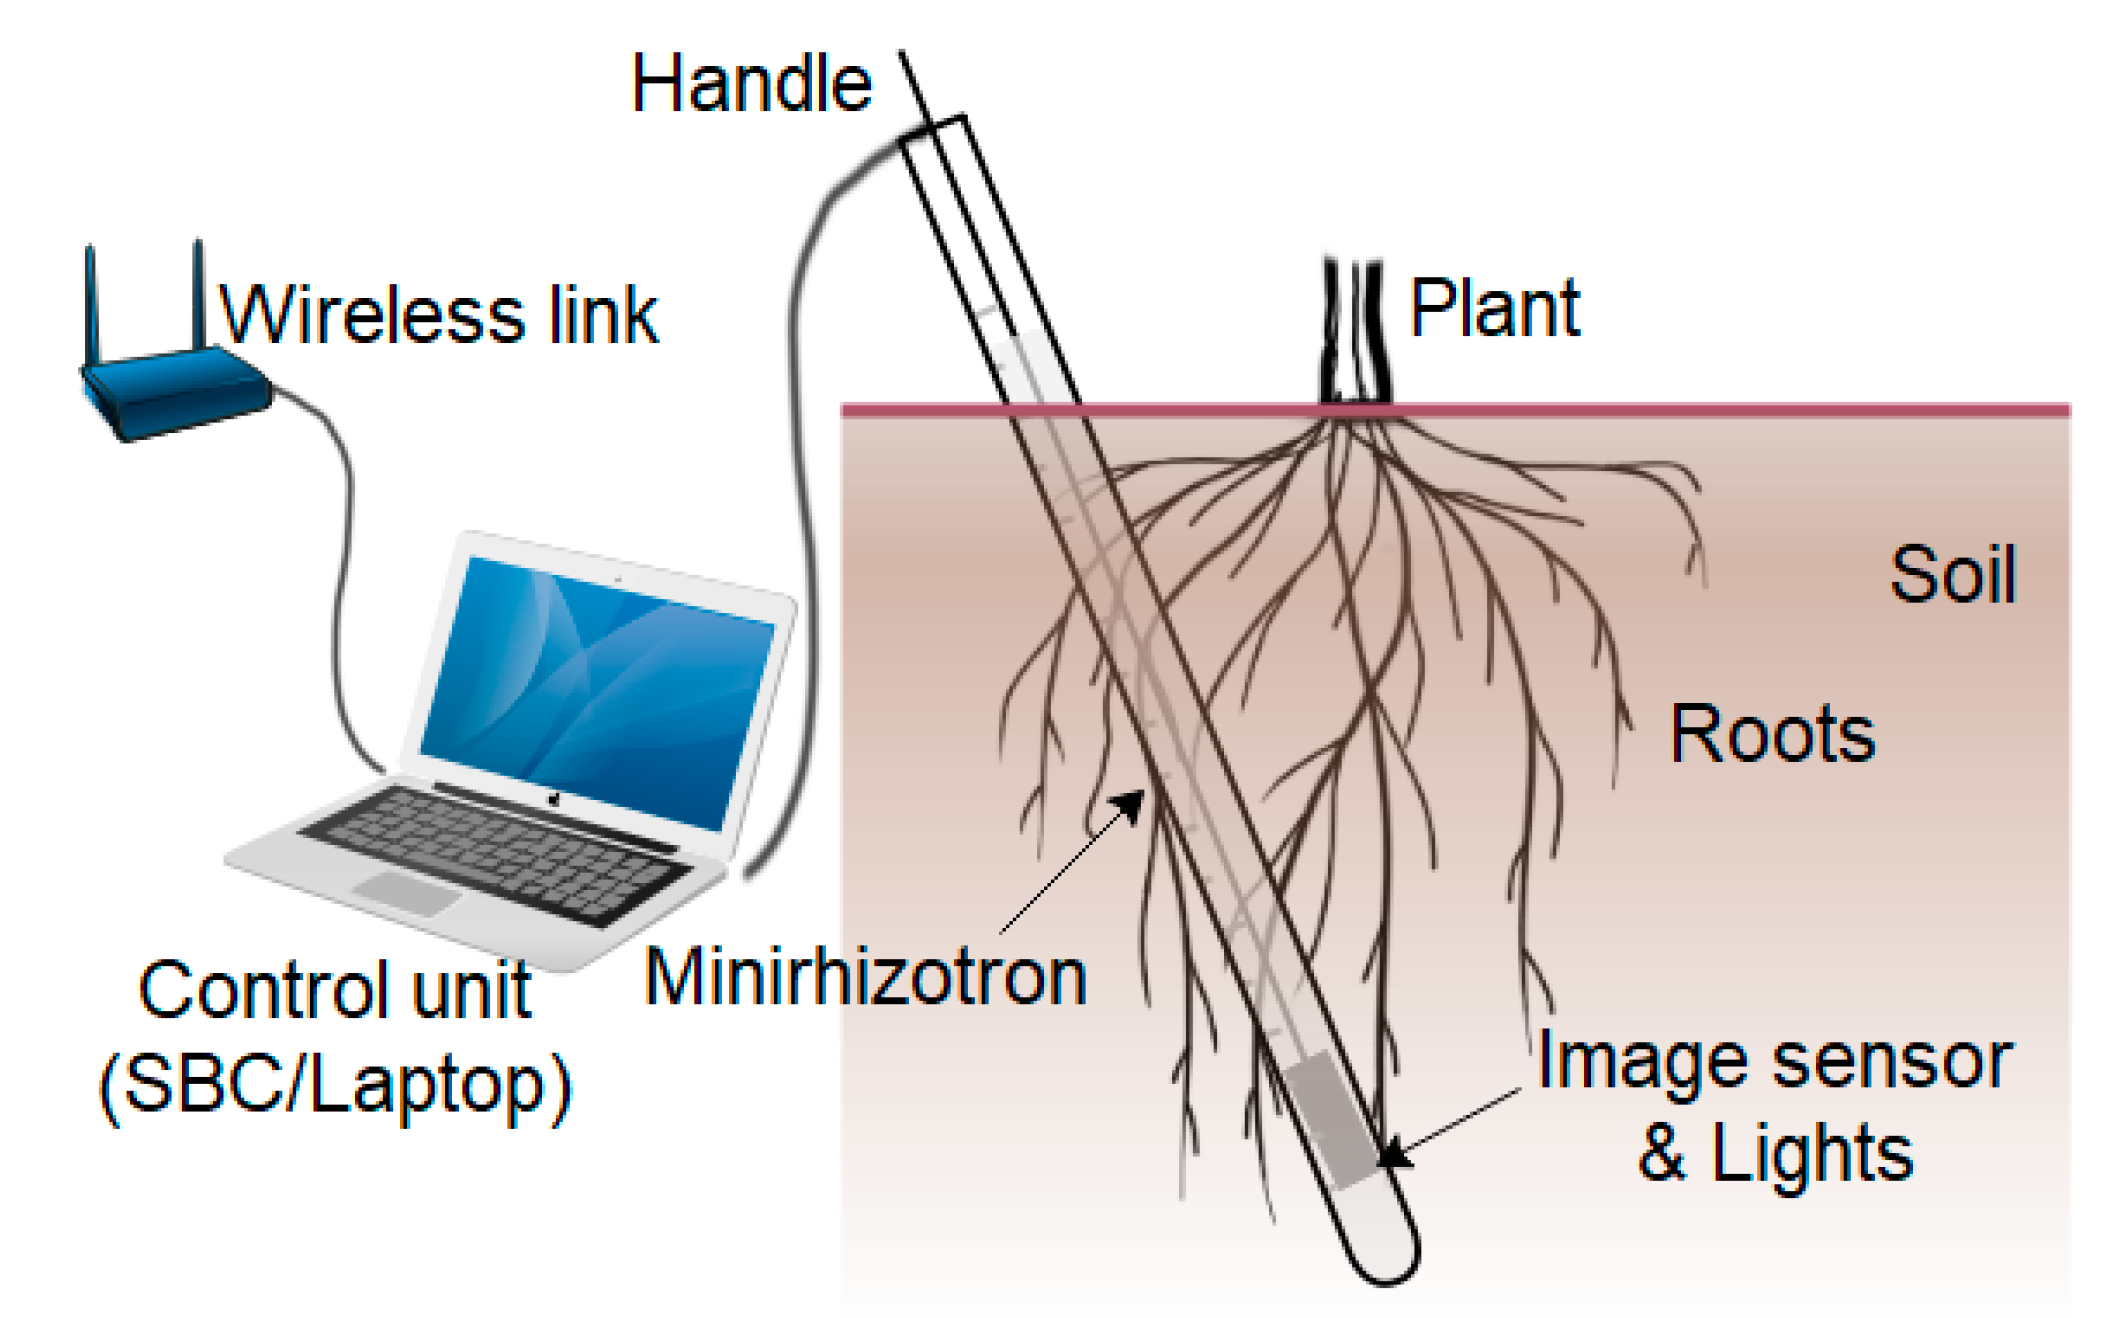
4. Proposed SoilCam Overview
- Camera unit,
- System control unit,
- Power unit, and
- Control software.
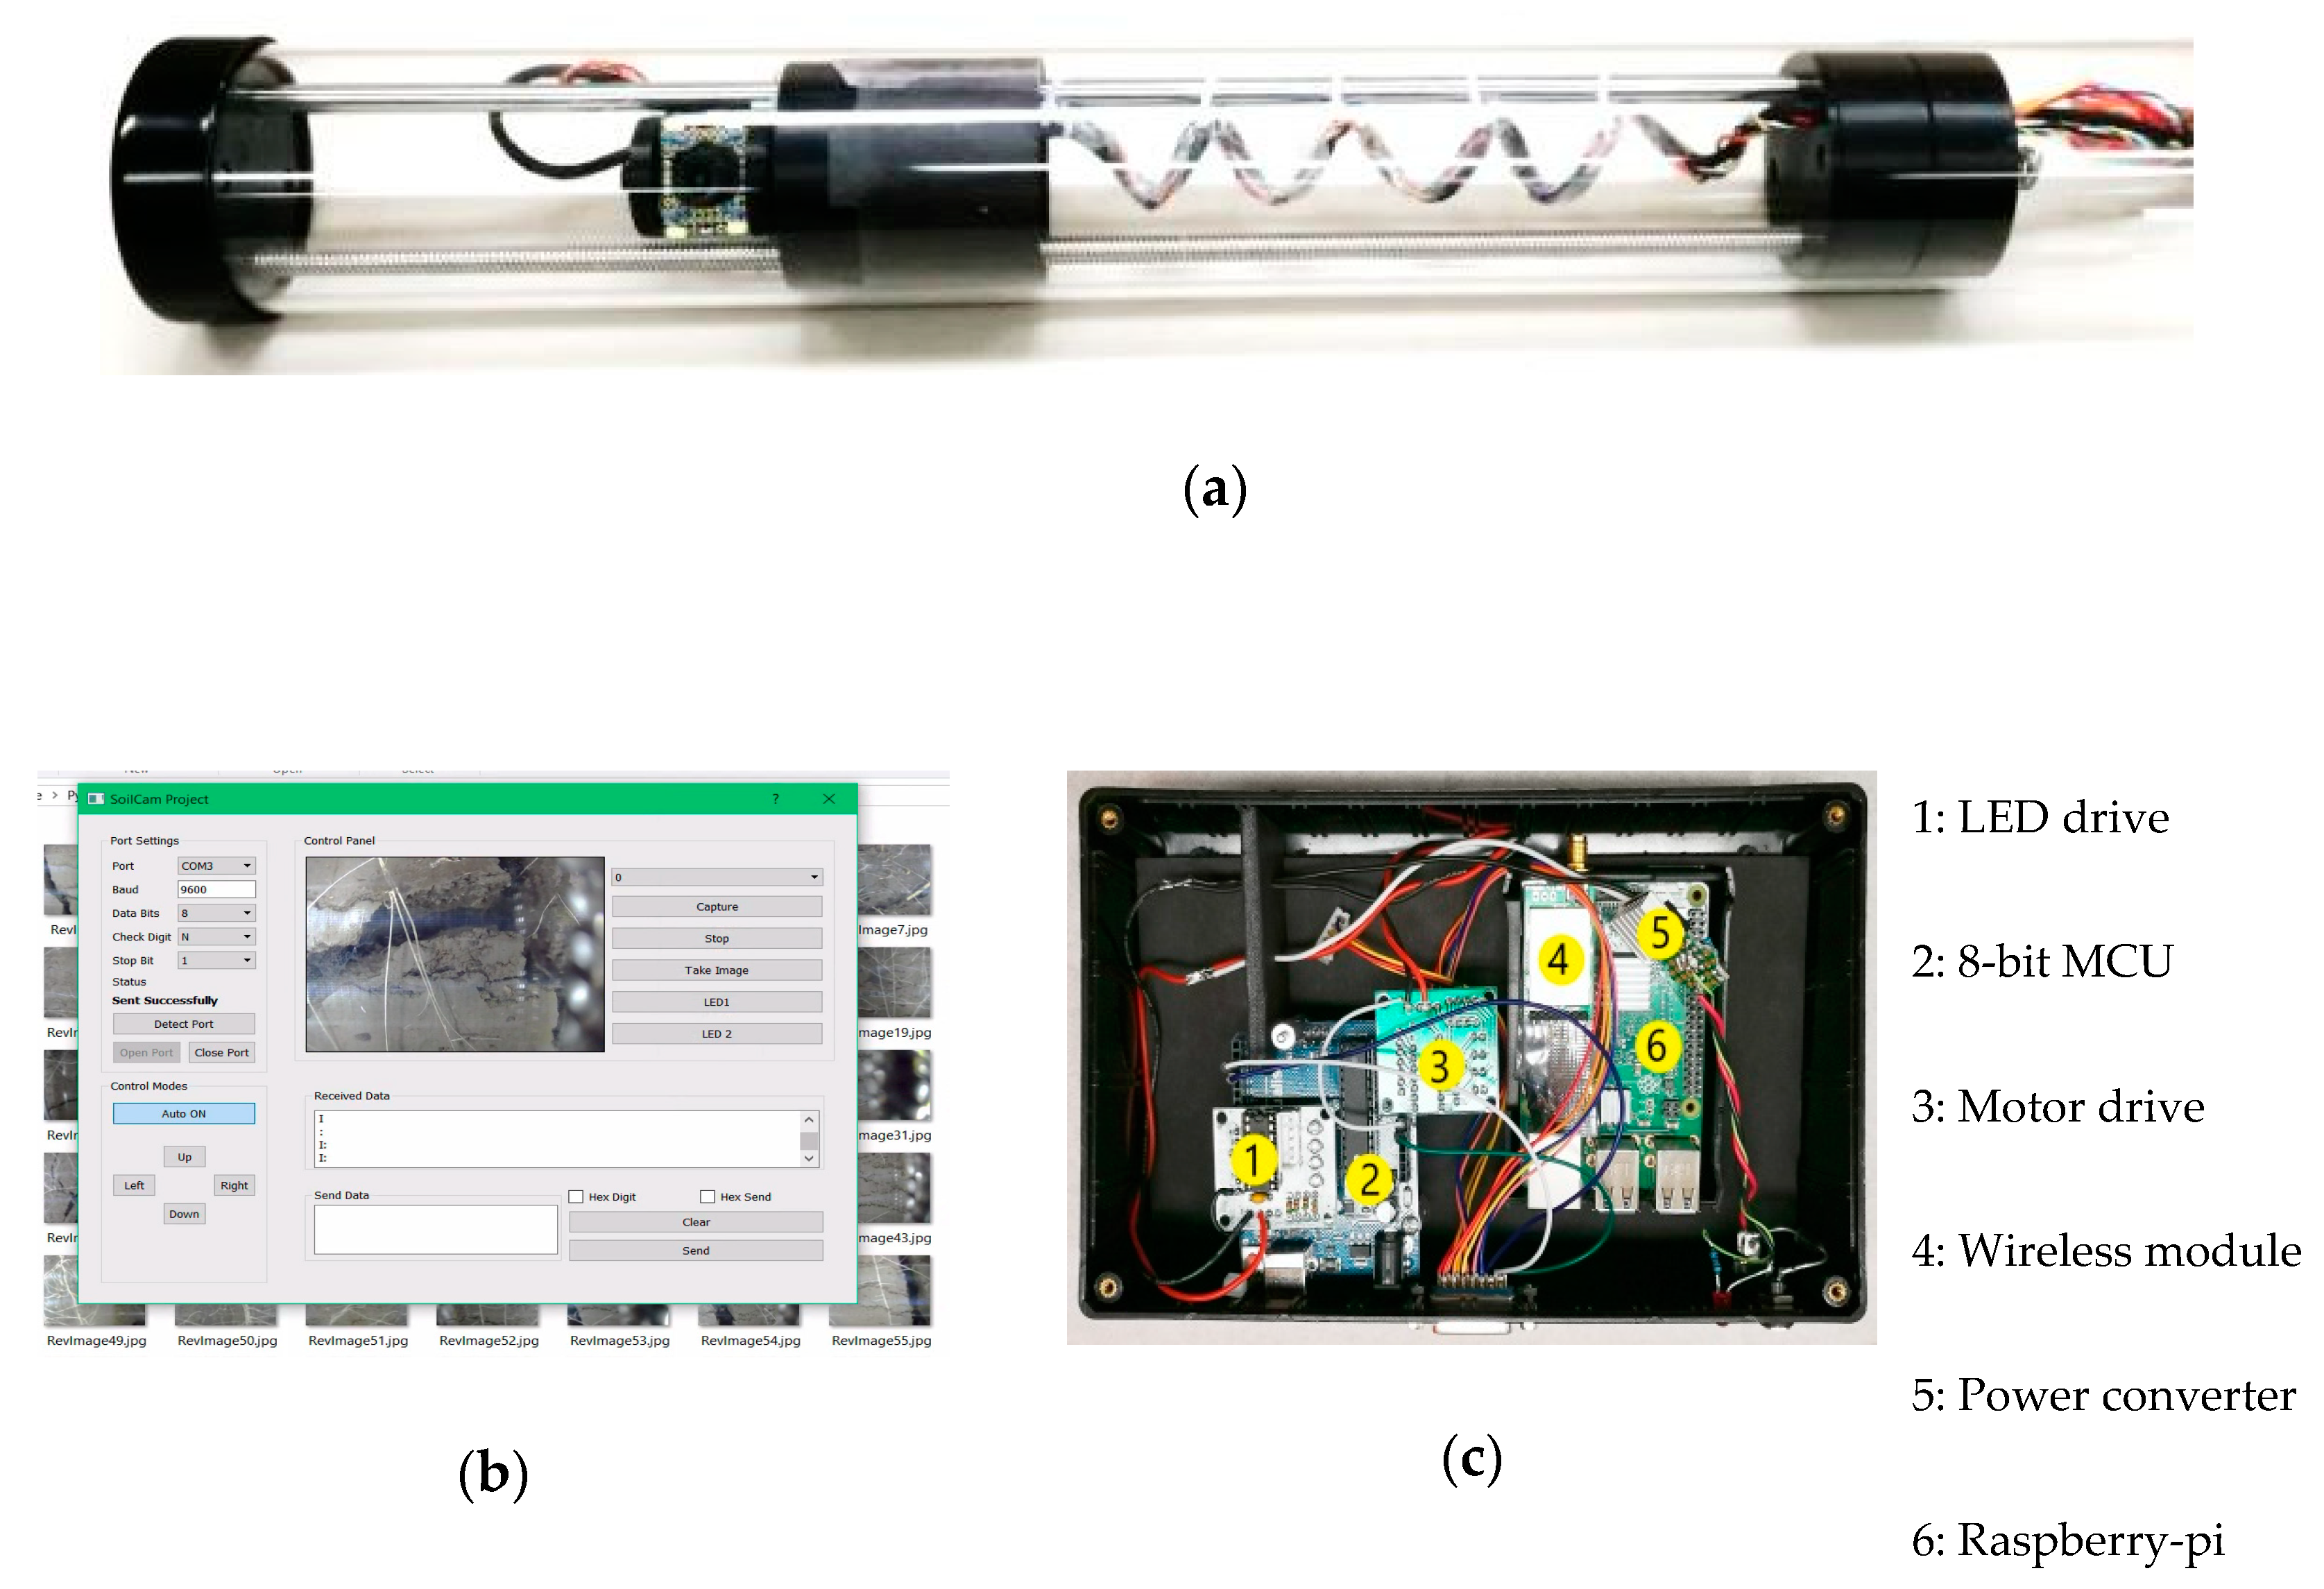
4.1. Camera Unit
4.2. System Control Unit
4.3. Power Unit
= 6.393 × 12
= 77 Wh.
= 96 × 2 / 0.8 Wh
= 241 Wh
= 241 Wh/(0.75 × 8)
= 40W.
4.4. Control Software
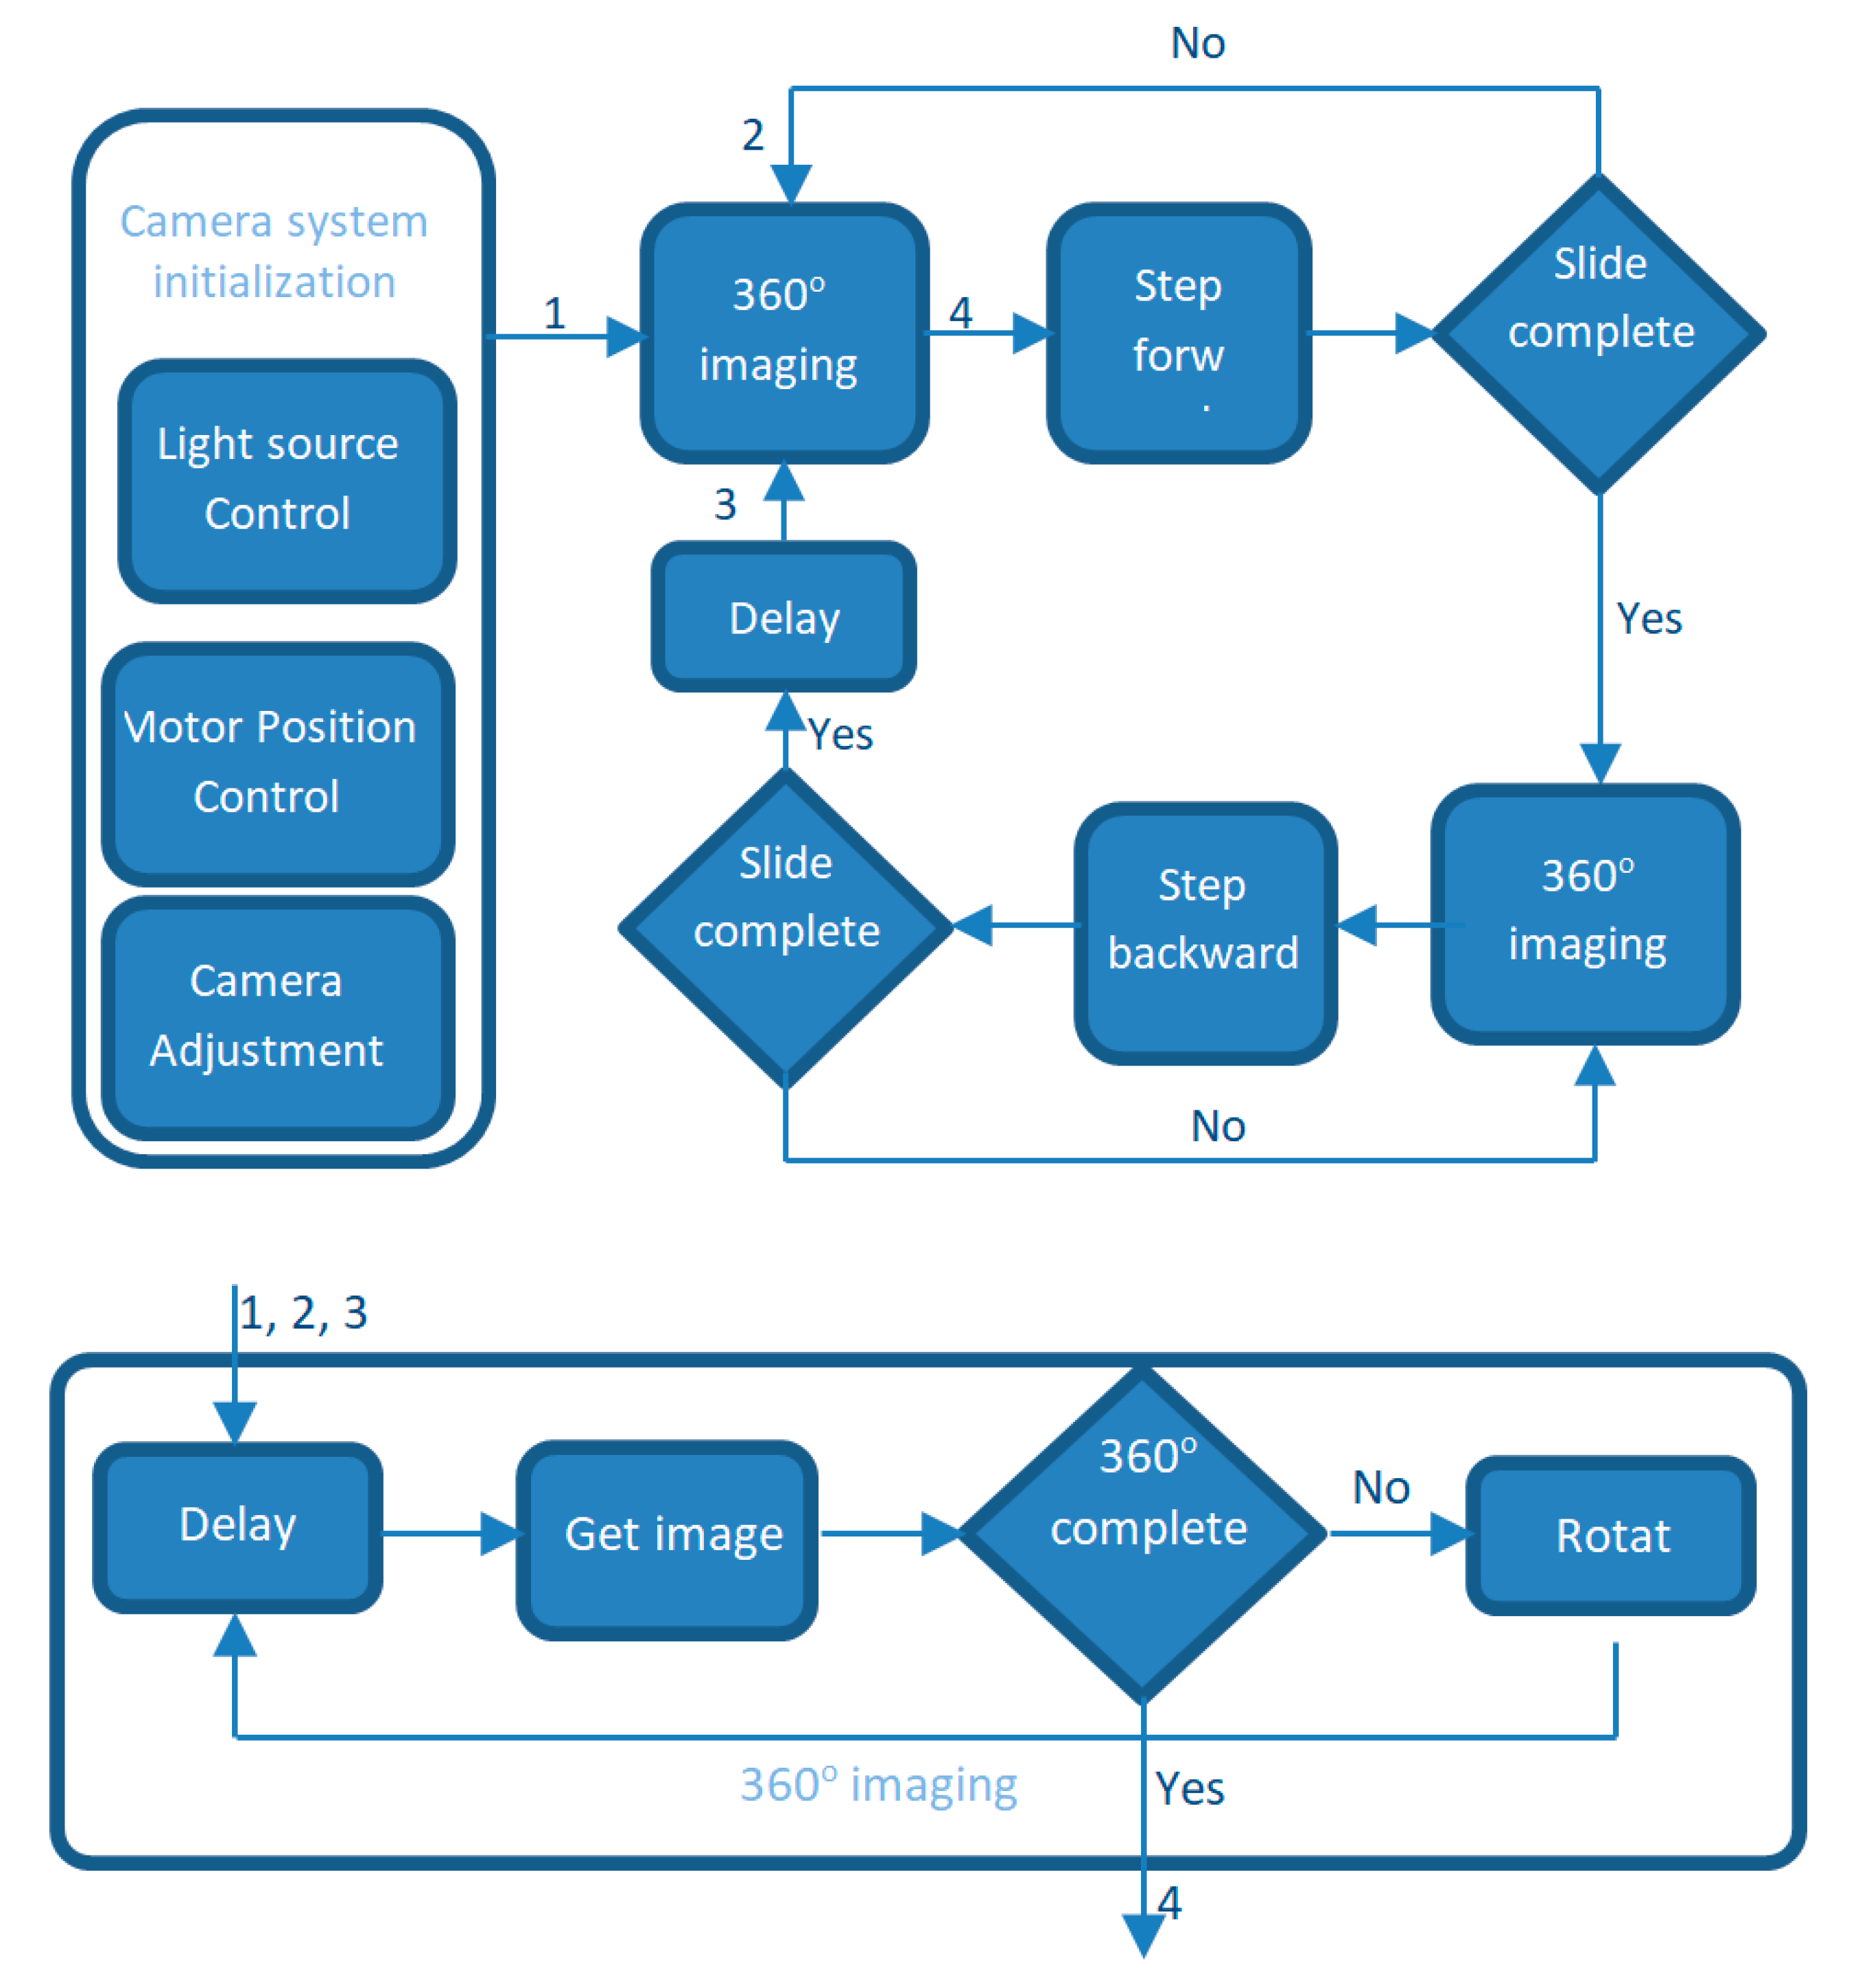
4.5. System Operation
5. SoilCam in Field Trial
- Motion blur along the direction of the camera rotation;
- Angular shift among the strips due to mechanical displacement of the rotating camera mount;
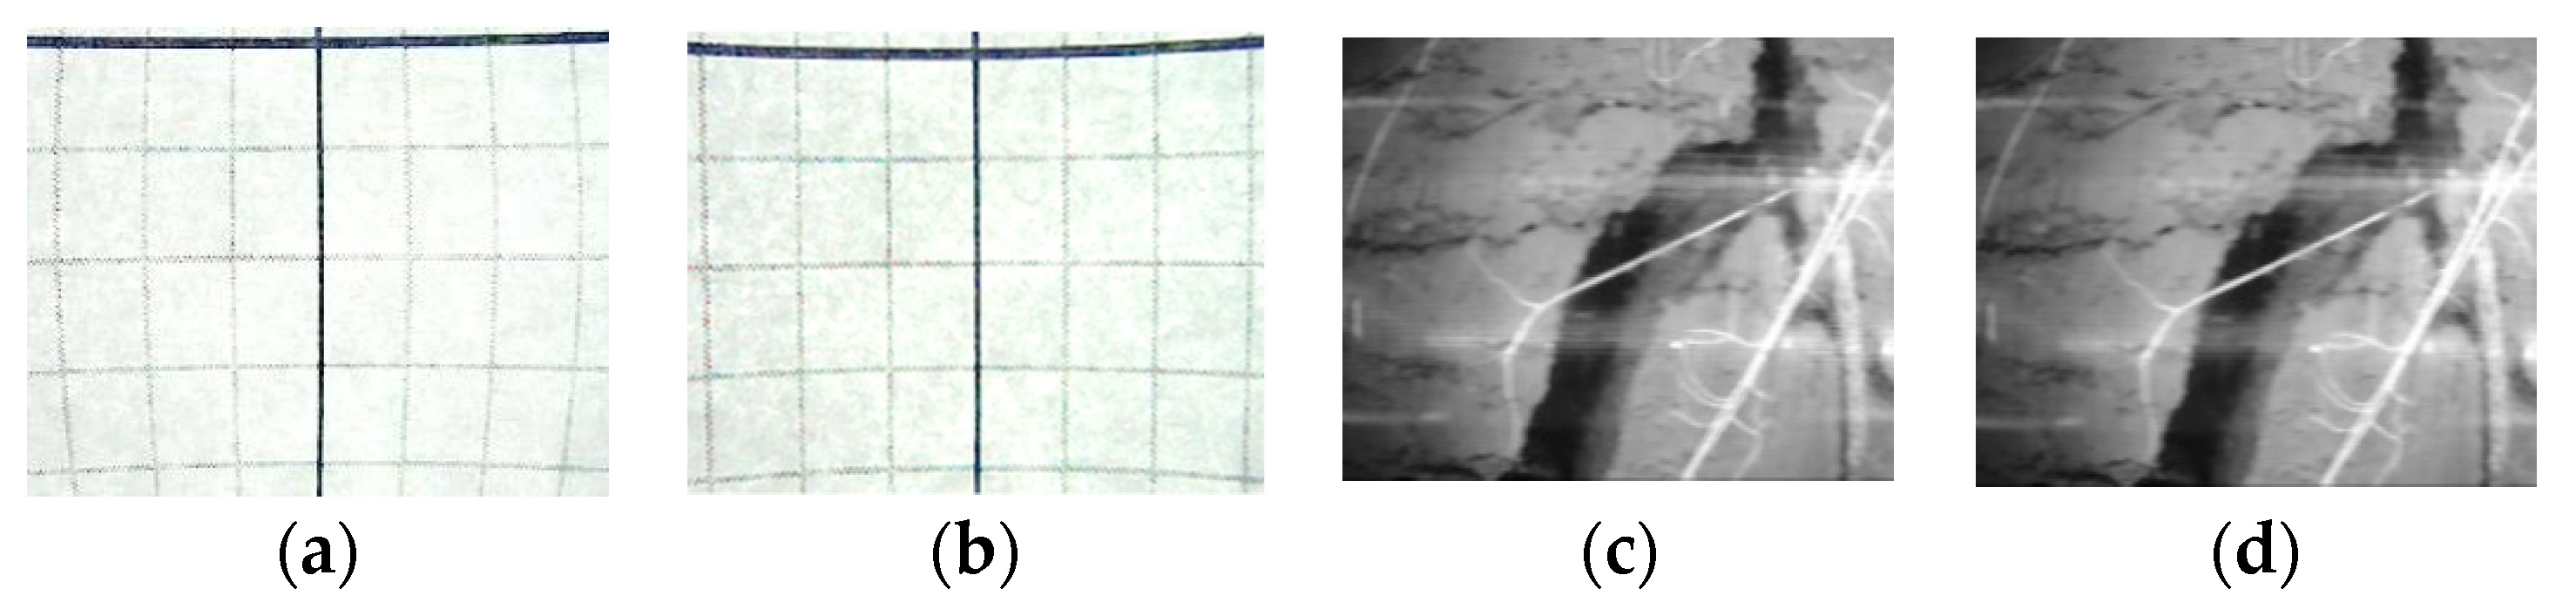
- Geometrical distortion due to the wide-angle lens;
- Geometrical distortion and focus problems due to the cylindrical surface of the imaging object, i.e. minirhizotron tube; and
- Marks of light reflection in the images mainly on the tube surface and the shiny mechanical parts
5.1. Modifying the Mechanical Design
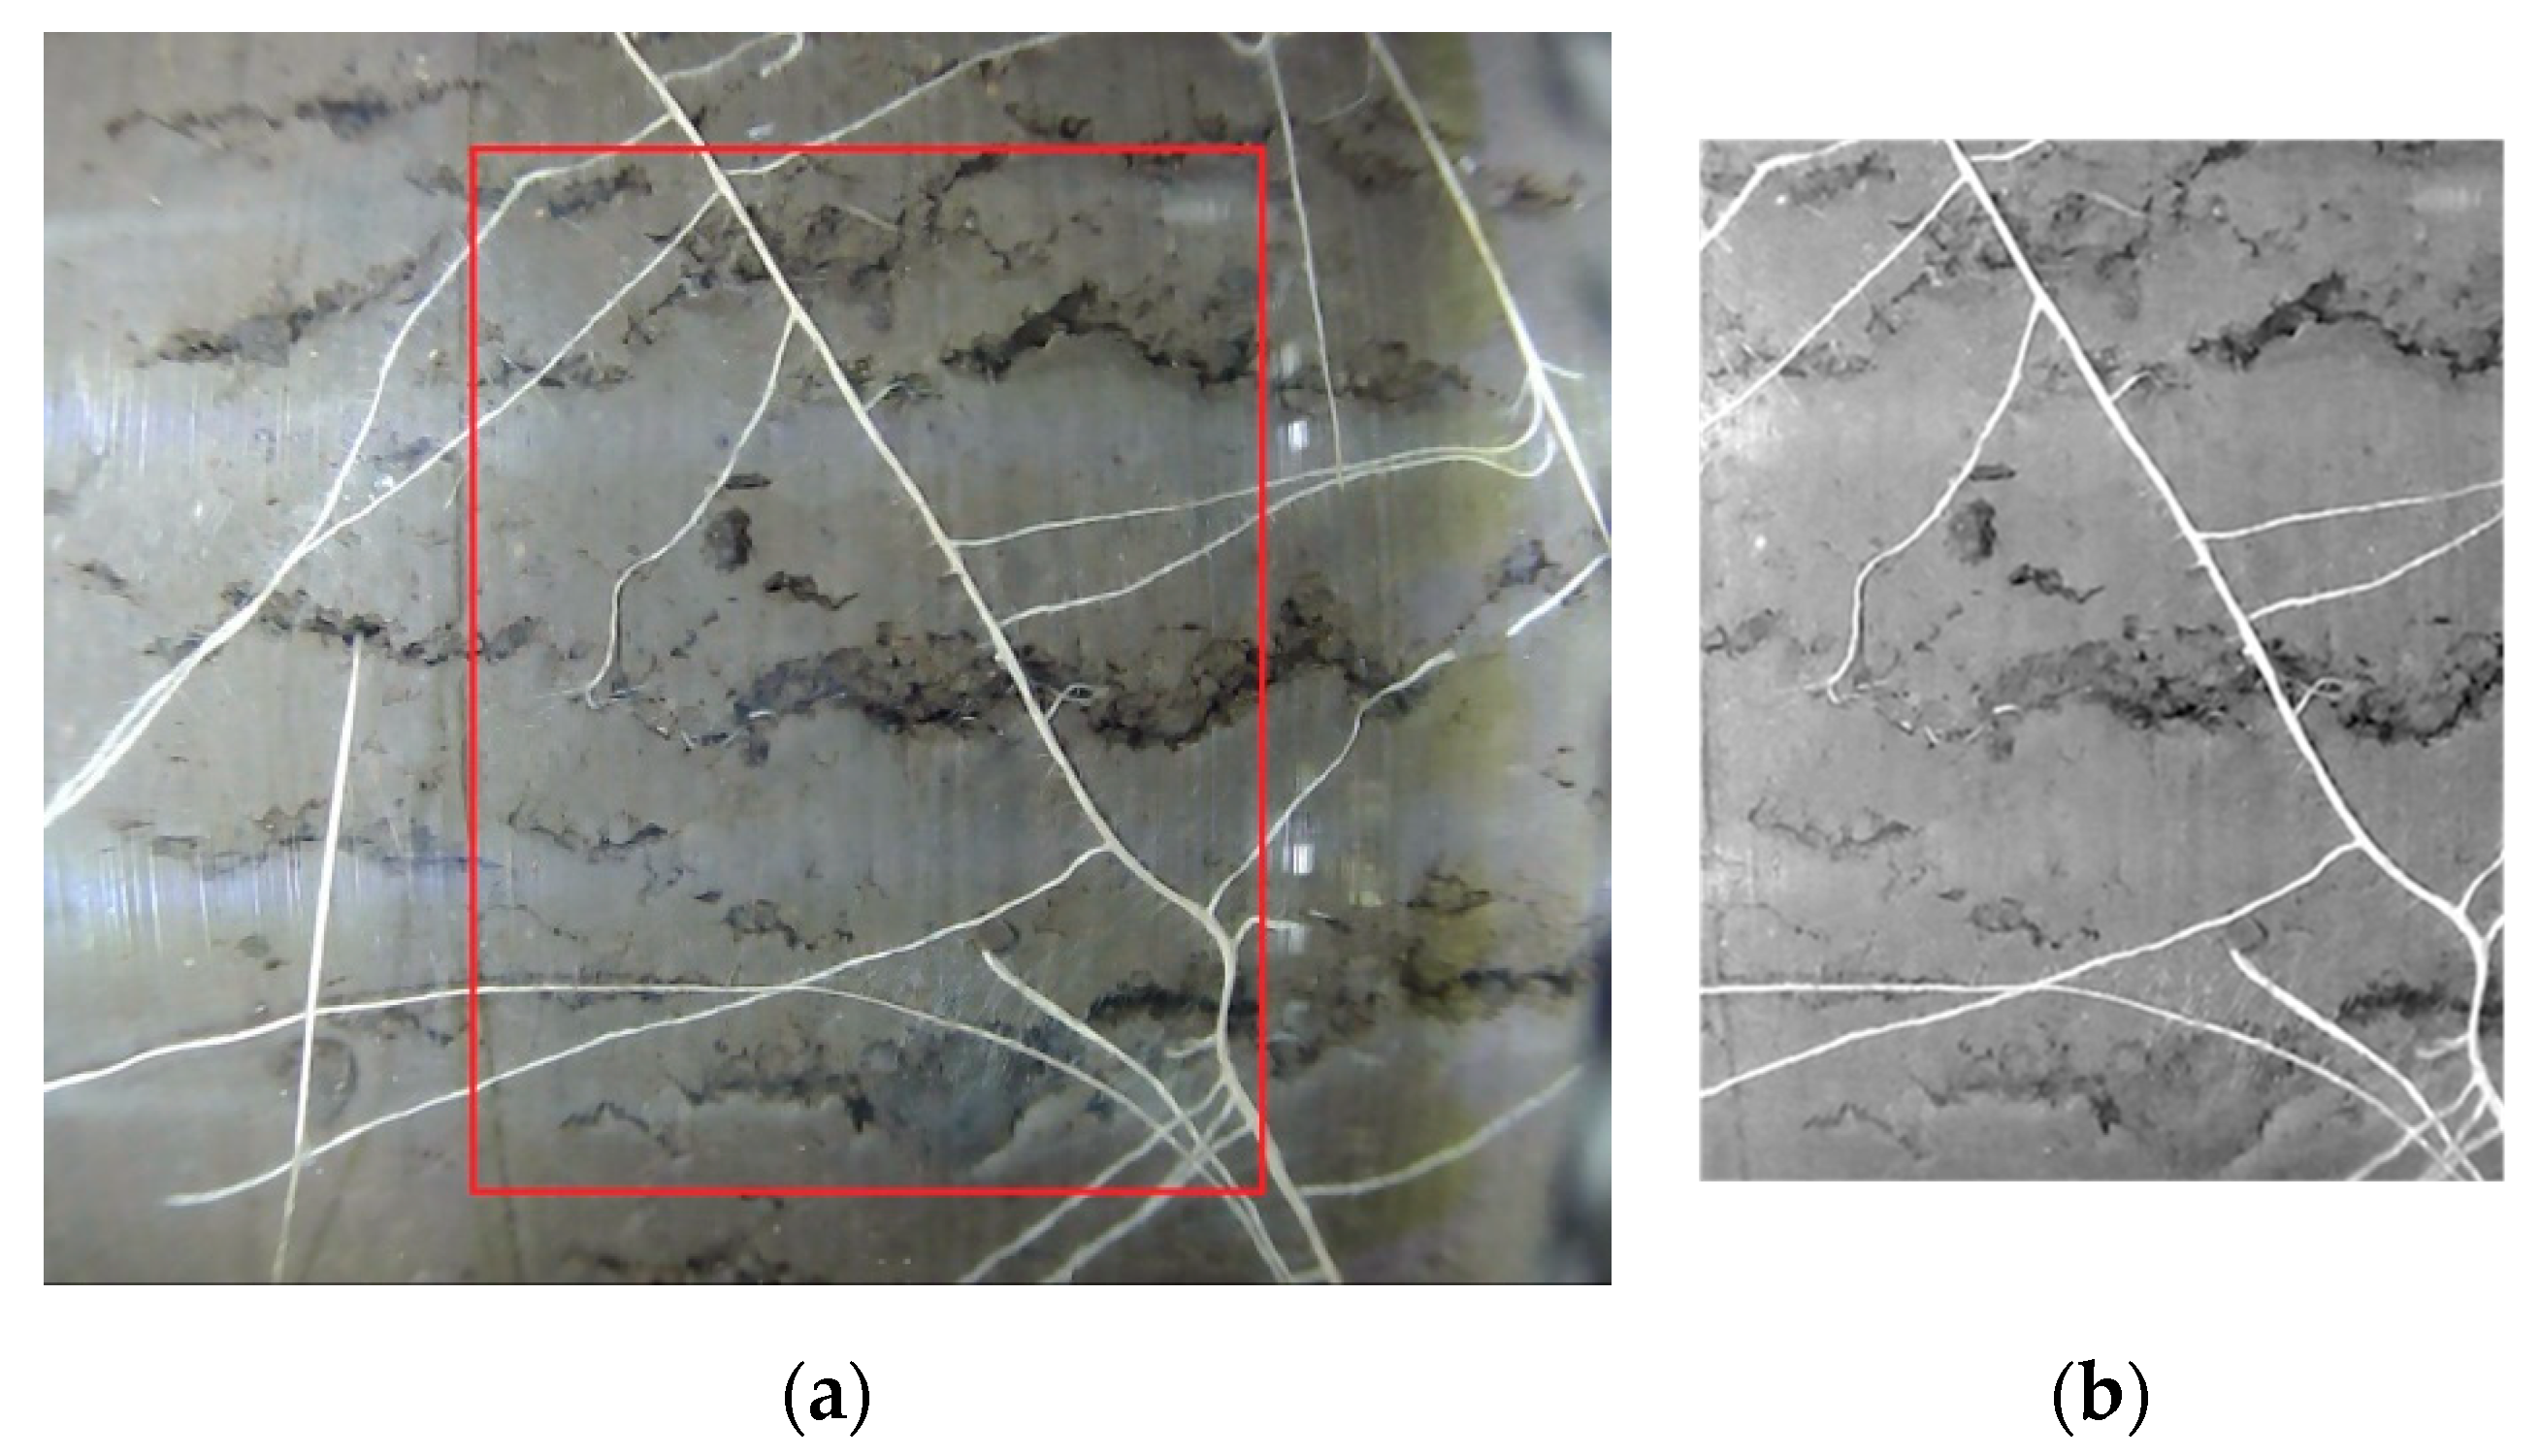
5.2. Image Post-Processing.
- Geometric correction (wide-angle lens distortion, tubular surface imaging distortion);
- Image normalization (color correction, exposure correction);
- Image crop (extraction of the usable non-overlapped images); and
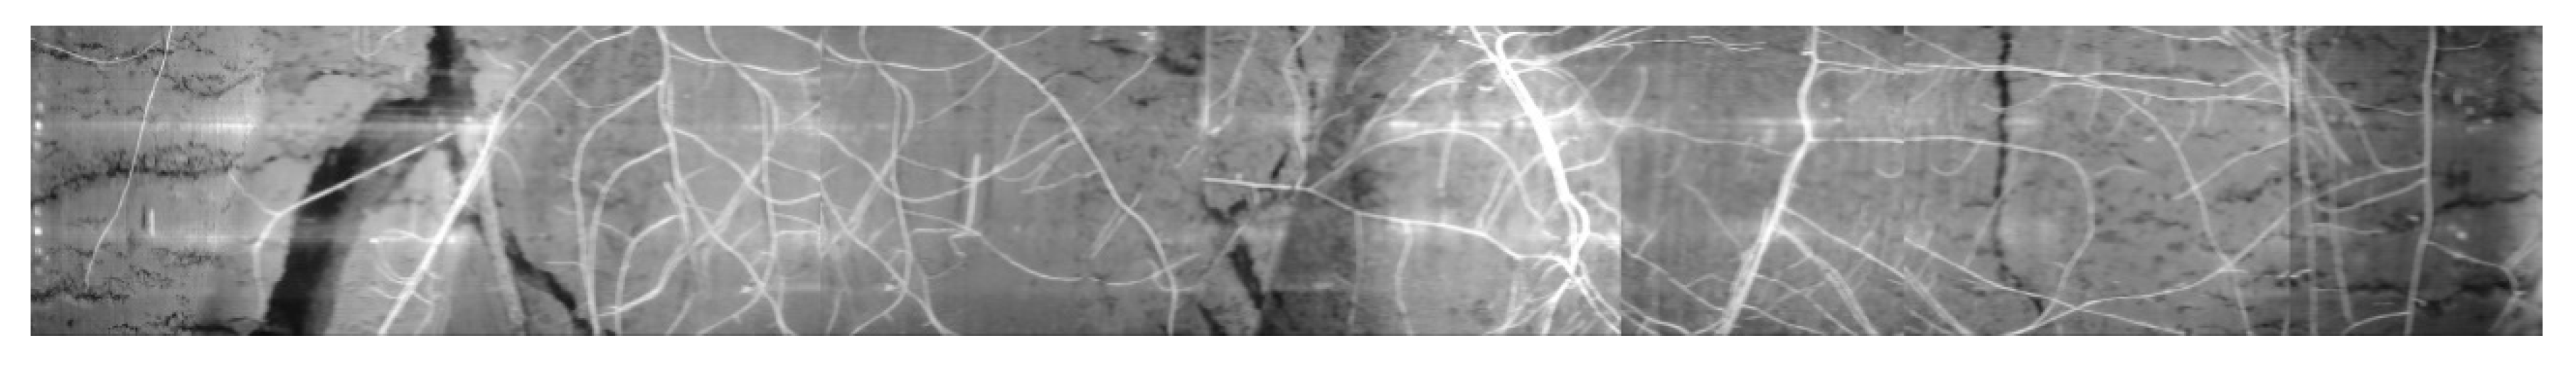
- Image stitching to get a complete 360° strip of the root image.
5.3. Multispectral Image Acquisition
6. System Performance
7. Comparison
8. Conclusions
Author Contributions
Funding
Acknowledgments
Conflicts of Interest
References
- Majdi, H. Root sampling methods - applications and limitations of the minirhizotron technique. Plant Soil 1996, 185, 255–258. [Google Scholar] [CrossRef]
- Nakaji, T.; Noguchi, K.; Oguma, H. Classification of rhizosphere components using visible–near infrared spectral images. Plant Soil 2008, 310, 245–261. [Google Scholar] [CrossRef]
- Smit, A.L.; George, E.; Groenwold, J. Root Observations and Measurements at (Transparent) Interfaces with Soil. In Root Methods; Smit, A.L., Bengough, A.G., Engels, C., van Noordwijk, M., Pellerin, S., van de Geijn, S.C., Eds.; Springer: Berlin/Heidelberg, Germany, 2000. [Google Scholar]
- Bodner, G.; Nakhforoosh, A.; Arnold, T.; Leitner, D. Hyperspectral imaging: a novel approach for plant root phenotyping. Plant Methods 2018, 14, 1–17. [Google Scholar] [CrossRef] [Green Version]
- Clark, R.T.; MacCurdy, R.B.; Jung, J.K.; Shaff, J.E.; McCouch, S.R.; Aneshansley, D.J.; Kochian, L.V. Three-Dimensional Root Phenotyping with a Novel Imaging and Software Platform. Am. Soc. Plant Biol. 2011, 156, 455–465. [Google Scholar] [CrossRef] [Green Version]
- Iyer-Pascuzzi, A.S.; Symonova, O.; Mileyko, Y.; Hao, Y.; Belcher, H.; Harer, J.; Weitz, J.S.; Benfey, P.N. Imaging and Analysis Platform for Automatic Phenotyping and Trait Ranking of Plant Root Systems. Plant Physiol. 2010, 152, 1148–1157. [Google Scholar] [CrossRef] [Green Version]
- Fiorani, F.; Rascher, U.; Jahnke, S.; Schurr, U. Imaging plants dynamics in heterogenic environments. Curr. Opin. Biotechnol. 2012, 23, 227–235. [Google Scholar] [CrossRef] [PubMed]
- Faget, M.; Herrera, J.M.; Stamp, P.; Aulinger-Leipner, I.; Frossard, E.; Liedgens, M. The use of green fluorescent protein as a tool to identify roots in mixed plant stands. Funct. Plant Biol. 2009, 36, 930–937. [Google Scholar] [CrossRef]
- Rellan-Alvarez, R.; Lobet, G.; Lindner, H.; Pradier, P.-L.; Sebastian, J.; Yee, M.-C.; Geng, Y.; Trontin, C.; LaRue, T.; Schrager-Lavelle, A.; et al. GLO-Roots: An imaging platform enabling multidimensional characterization of soil-grown root systems. eLife 2015, 4, 1–26. [Google Scholar] [CrossRef] [PubMed]
- Marc, F.; Markus, L.; Peter, S.; Patrick, F.; Juan, M.H. A minirhizotron imaging system to identify roots expressing the green fluorescent protein. Comput. Electron. Agric. 2010, 74, 163–167. [Google Scholar]
- Alain, P. Multi-spectral imaging of rhizobox systems: New perspectives for the observation and discrimination of rhizosphere components. Plant Soil 2008, 310, 263–268. [Google Scholar]
- Yu, K.; Zhao, Y.; Li, X.; Shao, Y.; Liu, F.; He, Y. Hyperspectral Imaging for Mapping of Total Nitrogen Spatial Distribution in Pepper Plant. PloS ONE 2014, 1–19. [Google Scholar] [CrossRef] [PubMed]
- Vigneau, N.; Ecarnot, M.; Rabatel, G.; Roumet, P. Potential of field hyperspectral imaging as a non destructive method to assess leaf nitrogen content in Wheat. Field Crops Res. 2011, 122, 25–31. [Google Scholar] [CrossRef] [Green Version]
- Daniela, T.; Zhe, Y.; Dennis, B.H.; Nikolaj, B.A.; Reid, D.E.; Madsen, L.H.; Bhasin, H.; Sexauer, M.; Stougaard, J.; Markmann, K. Systemic control of legume susceptibility to rhizobial infection by a mobile microRNA. Science 2018, 1–8. [Google Scholar]
- Eizenberg, H.; Shtienberg, D.; Silberbush, M.; Ephrath, J.E. A New Method for in-situ Monitoring of the Underground Development of Orobanche cumana in Sunflower (Helianthus annuus) with Mini-rhizotron. Ann. Bot. 2005, 96, 1137–1140. [Google Scholar] [CrossRef] [Green Version]
- He, H.; Sun, D. Hyperspectral imaging technology for rapid detection of various microbial contaminants in agricultural and food products. Trends Food Sci. Technol. 2015, 46, 99–109. [Google Scholar] [CrossRef]
- Williams, P.J.; Geladi, P.; Britz, T.J.; Manley, M. Investigation of fungal development in maize kernels using NIR hyperspectral imaging and multivariate data analysis. J. Cereal Sci. 2012, 55, 227–278. [Google Scholar] [CrossRef]
- Siripatrawan, U.; Makino, Y. Monitoring fungal growth on brown rice grains using rapid and non-destructive hyperspectral imaging. Int. J. Food Microbiol. 2015, 199, 93–100. [Google Scholar] [CrossRef]
- Perkins, R.G.; Williamson, C.J.; Brodie, J.; Barillé, L.; Launeau, P.; Lavaud, J.; Yallop, M.L.; Jesu, B. Microspatial variability in community structure and photophysiology of calcified macroalgal microbiomes revealed by coupling of hyperspectral and high-resolution fluorescence imaging. Nature Sci. Rep. 2016, 6, 1–14. [Google Scholar] [CrossRef] [Green Version]
- Aldana-Jague, E.; Heckrath, G.; Macdonaldc, A.; Wesemael, B.; Oost, K.V. UAS-based soil carbon mapping using VIS-NIR (480–1000 nm) multi-spectral imaging: Potential and limitations. Geoderma 2016, 275, 55–66. [Google Scholar] [CrossRef]
- Lopez, B.; Sabate, S.; Gracia, C. An inflatable minirhizotron system for stony soils. Plant Soil 1996, 179, 255–260. [Google Scholar] [CrossRef]
- Kosola, K.R. Laparascopic Sampling of Roots of Known Age from an Expandable-Wall Minirhizotron System. Agron. J. 1999, 91, 876–879. [Google Scholar] [CrossRef]
- Volkmar, K.M. A comparison of minirhizotron techniques for estimating root length density in soils of different bulk densities. Plant Soil 1993, 157, 239–245. [Google Scholar] [CrossRef]
- Amato, M.; Lupo, F.; Bitella, G.; Bochicchio, R.; Aziz, M.A.; Celano, G. A high quality low-cost digital microscope minirhizotron system. Comput. Electron. Agric. 2011, 80, 50–53. [Google Scholar] [CrossRef]
- Withington, J.M.; Elkin, A.D.; Bulaj, B.; Nski, J.O.; Tracy, K.N.; Bouma, T.J.; Oleksyn, J.; Anderson, L.J.; Nski, J.M.; Reich, P.B.; et al. The impact of material used for minirhizotron tubes for root research. New Phytol. 2003, 160, 533–544. [Google Scholar] [CrossRef] [Green Version]
- Plant Science Tools CI-600. Available online: https://cid-inc.com/plant-science-tools/root-measurement-with-minirhizotron/ci-600-in-situ-root-imager/# (accessed on 12 December 2019).
- Johnson, M.G.; Tingey, D.T.; Phillips, D.L.; Storm, M.J. Advancing fine root research with minirhizotrons. Environ. Exp. Bot. 2001, 45, 263–289. [Google Scholar] [CrossRef]
- Guang, Z.; Stanley, T. Birchfield and Christina E. Wells. Automatic discrimination of fine roots in minirhizotron images. New Phytol. 2008, 177, 549–557. [Google Scholar]
- Theivasigamani, P.; Ophem, D.; Lazarovitch, N.; Moshelion, M.; Ephrath, J.E. Automated Minirhizotron for Non-Destructive Continuous Phenotyping of Root Systems. Available online: https://scisoc.confex.com/crops/2017am/webprogram/Paper105722.html (accessed on 30 January 2020).
- Specification for the Automated Mini-Rhizotron. Available online: http://www.rhizosystems.com/Specifications.html (accessed on 12 December 2019).
- Automatic Correction of Lens Distortion by Using Digital Image Processing. Available online: http://citeseerx.ist.psu.edu/viewdoc/similar?doi=10.1.1.28.8132&type=sc (accessed on 30 January 2020).
- VSI-BARTZ MS-190—Manual UHD MR Camera System. Available online: https://www.vienna-scientific.com/products/minirhizotron-systems/manual/ (accessed on 12 December 2019).
- Poelman, G.; Koppel, J.; Brouwer, G. A telescopic method for photographing within 8 × 8 cm minirhizotrons. Plant Soil 1996, 185, 163–167. [Google Scholar] [CrossRef]
- Nagel, K.A.; Putz, A.; Gilmer, F.; Heinz, K.; Fischbach, A.; Pfeifer, J.; Faget, M.; Blossfeld, S.; Ernst, M.; Dimaki, C.; et al. GROWSCREEN-Rhizo is a novel phenotyping robot enabling simultaneous measurements of root and shoot growth for plants grown in soil-filled rhizotrons. Functional Plant Biol. 2012, 39, 891–904. [Google Scholar] [CrossRef] [Green Version]
- Clark, R.T.; Famoso, A.N.; Zhao, K.; Shafe, J.E.; Craft, E.J.; Bustamante, C.D.; Mocouch, S.R.; Aneshansley, D.J.; Kochian, L.V. High-throughput two-dimensional root system phenotyping platform facilitates genetic analysis of root growth and development. Plant Cell Environ. 2013, 36, 454–466. [Google Scholar] [CrossRef]
- Johnson, M.G.; Meyer, P.F. Mechanical Advancing Handle that Simplifies Minirhizotron Camera Registration and Image Collection. J. Environ. Qual. 1998, 27, 710–714. [Google Scholar] [CrossRef]
- The Next Generation Manual Minirhizotron. Available online: http://www.rhizosystems.com/Manual_Mini_Rhizotron.html (accessed on 12 December 2019).
- Blossfeld, S.; Gansert, D. A novel non-invasive optical method for quantitative visualization of pH dynamics in the rhizosphere of plants. Plant Cell Environ. 2017, 30, 176–186. [Google Scholar] [CrossRef]
- Allen, M.F.; Vargas, R.; Graham, E.A.; Swenson, W.; Hamilton, M.; Taggart, M.; Harmon, T.C.; Ratko, A.; Rundel, P.; Fulkerson, B.; et al. Soil Sensor Technology: Life within a Pixel. BioScience 2007, 57, 859–867. [Google Scholar] [CrossRef] [Green Version]
- Wang, P.; Marsh, E.L.; Ainsworth, E.A.; Leakey, A.; Shefin, A.M.; Schachtman, D.P. Shifts in microbial communities in soil, rhizosphere and roots of two major crop systems under elevated CO2 and O3. Nature Sci. Rep. 2017, 7, 1–12. [Google Scholar] [CrossRef] [Green Version]


| Model | CI-600 | CI-602 | MS-16/17 | AMR-B | Manual MR |
|---|---|---|---|---|---|
| Imaging unit | CIS * | CIS | CMOS * | CMOS | CMOS |
| Resolution (DPI) | 100–600 | 2500 | 300 | 1900 | |
| Tube diameter (mm) | 63.5 | 50 | 63.5 | 100 | 50 |
| Manufacturer | CID Bio-science | Vienna Scientific Instruments | RhizoSystems, LLC | ||
| Component | Power (W) | Active time (s) | Total Energy (Wh) |
|---|---|---|---|
| Camera | 1.2 | 2178 | 0.726 |
| Motor-1 | 3 | 1980 | 1.65 |
| Motor-2 | 5 | 198 | 0.275 |
| Light source | 0.4 | 2178 | 0.242 |
| Controller & SBC 1 | 1.75 | 7200 | 3.5 |
| Total energy requirement per image | 6.393 | ||
| Criteria | Range |
|---|---|
| Camera type | 2MP CMOS sensor 170° Wide angle lens, no optical filter |
| Image size | 35 × 28mm (1400 DPI) |
| Camera rotation | 360° |
| Camera system length | 550 mm |
| Camera system maximum diameter | 62 mm |
| Imaging length | 330 mm |
| Flat image area coverage | 200 mm x 330 mm |
| Camera system power | 12 V, 10 W (peak) |
| Controller power | 12 V, 5 W (peak) |
| Control unit | 32 bit SBC |
| Power source | 12 V 20 Ah Gel battery |
| Operation duration | 24 h @ 60 min imaging interval |
| Optional power | 40 W peak solar panel (not used) |
| Item | Model/Part Number | Quantity | Cost (USD) |
|---|---|---|---|
| 8 mm, 500 mm lead-screw and support rod set | T8-500 | 1 set | 170 |
| Camera (2 MP) module | ELP-USBFHD04H-L170 | 1 pc | 80 |
| Geared stepper motor | 28BYJ-48 | 2 pcs | 15 |
| Motor drive | ULN2003 | 2 pcs | 10 |
| 3D-printed parts (10 pieces) | 1 Set | 100 | |
| 32-bit SBC | Raspberry-Pi 3B | 1 pc | 85 |
| 8-bit Controller | ATMega-328 board | 1 pc | 15 |
| Light sources | LEDs | 25 | |
| Other electronics, cables, and connectors | As needed | 75 | |
| Battery | 12 V, 6 AH | 1 pc | 25 |
| Housing and hardware | As needed | 50 | |
| Total | 650 |
| Model (Commercial)/Name (Prototype) | Image Resolution (DPI) | Imaging Technique | Live Imaging | Illumination Control | Control Mode | Usable Tube Inner Diameter | Tube Length | In Situ Operation | Power Requirement |
|---|---|---|---|---|---|---|---|---|---|
| CI-600 (CI-602) [26] | 100–600 (600–1200) | RGB-CIS | Not Possible | None | Auto 360°, Manual height | 63.5 mm (50 mm) | 100 cm | Need Human interaction | Low |
| VSI MS-190 [32] | 2500 | RGB CMOS | Not available | UI adjustable brightness | Semi-Auto 360°, Manual height | 70 mm, 60 mm | 100–200 cm | Medium | |
| AMR-B [30] | 300 | None | Auto 360° Auto height | 110 mm | 100 cm | High (110W) | |||
| Manual MR [37] | 1900 | None | Manual 360°, Manual height | 50 mm | 100, 200 cm | Low | |||
| SoilCam (Proposed) | 600-2500+ | Multi/Hyper-spectral | Yes | UI adjustable brightness | Auto 360°, Auto/ Manual height | 63.5 mm, 110 mm | 100–200 cm | No human interaction required | Low (10W+ solar panel) |
| Marc Faget, 2010 [10] | 480 ** | NIR | Yes | Fixed | Manual | 63.5 mm | 100 cm | Need Human interaction | Medium |
| M. Amato, 2012 [24] | 480 * | USB Microscope | Yes | None | Manual | 63.5 mm | 200 cm | Medium | |
| Randy T. C, 2011 [38] | 2893 *** | DSLR *1 | No | Manual | Manual | 2D Flat Bed | Low | ||
© 2020 by the authors. Licensee MDPI, Basel, Switzerland. This article is an open access article distributed under the terms and conditions of the Creative Commons Attribution (CC BY) license (http://creativecommons.org/licenses/by/4.0/).
Share and Cite
Rahman, G.; Sohag, H.; Chowdhury, R.; Wahid, K.A.; Dinh, A.; Arcand, M.; Vail, S. SoilCam: A Fully Automated Minirhizotron using Multispectral Imaging for Root Activity Monitoring. Sensors 2020, 20, 787. https://doi.org/10.3390/s20030787
Rahman G, Sohag H, Chowdhury R, Wahid KA, Dinh A, Arcand M, Vail S. SoilCam: A Fully Automated Minirhizotron using Multispectral Imaging for Root Activity Monitoring. Sensors. 2020; 20(3):787. https://doi.org/10.3390/s20030787
Chicago/Turabian StyleRahman, Gazi, Hanif Sohag, Rakibul Chowdhury, Khan A. Wahid, Anh Dinh, Melissa Arcand, and Sally Vail. 2020. "SoilCam: A Fully Automated Minirhizotron using Multispectral Imaging for Root Activity Monitoring" Sensors 20, no. 3: 787. https://doi.org/10.3390/s20030787