The Design and Verification of an Active SAMSR Ultrasonic Guided Wave Monitoring System with Ultra-Low Crosstalk


Abstract
:1. Introduction
- (1)
- Ultrasonic guided wave signals with ultra-low crosstalk can be obtained even under high voltage actuation;
- (2)
- The damage detection efficiency is increased effectively by a SAMSR operation mode;
- (3)
- The effect of crosstalk is minimized as much as possible to realize the precise damage location of a hot-spot;
- (4)
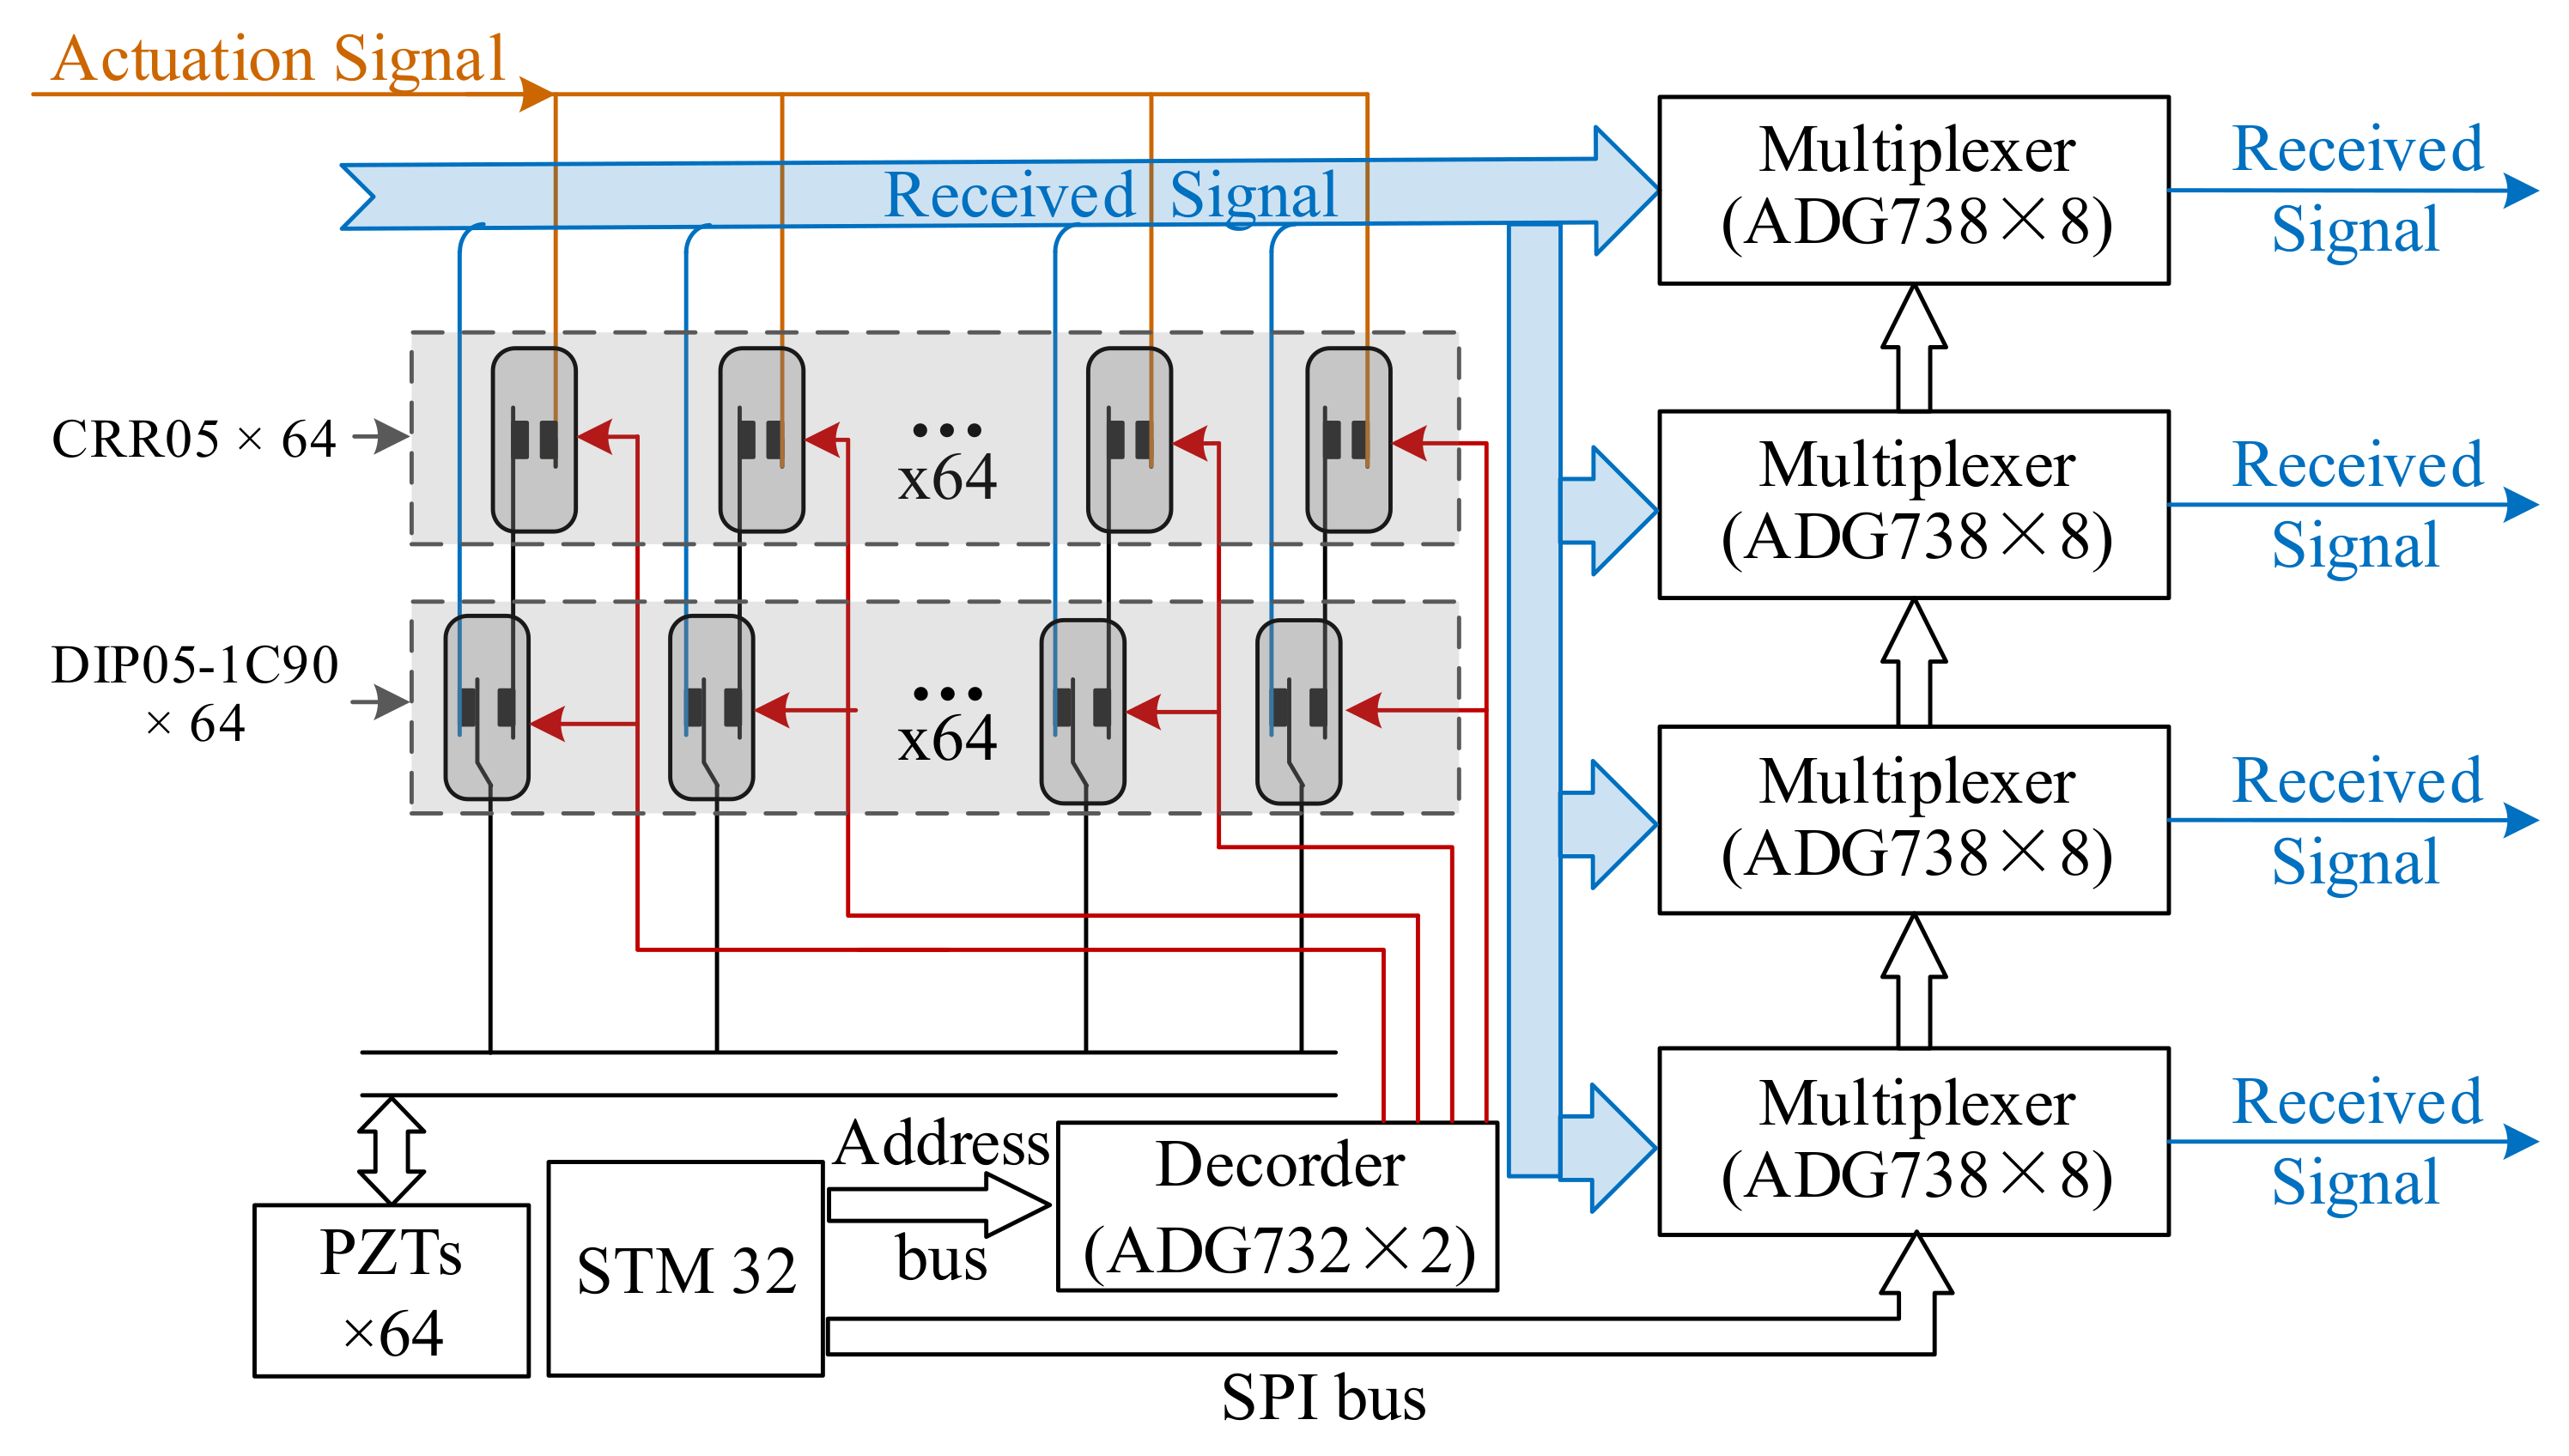
- The large-scaled structures can be monitored by the developed system due to its strong scalability. The attenuators at all levels are controlled by the same control signal from the attenuation design of interlocking isolation structures. When the attenuation series increase, the switching time would not increase correspondingly. Theoretically, the analog switch matrix based on SPI control bus structures can realize the expansion of any multichannel sensor network and the synchronous acquisition of any multichannel.
2. Design of the Ultrasonic Guided Wave Detecting System Based on PZTs Network
2.1. Basic Compositions and Principles of the Ultrasonic Guided Wave Active Detecting System
2.2. Analysis of Problems in the Ultrasonic Guided Wave System
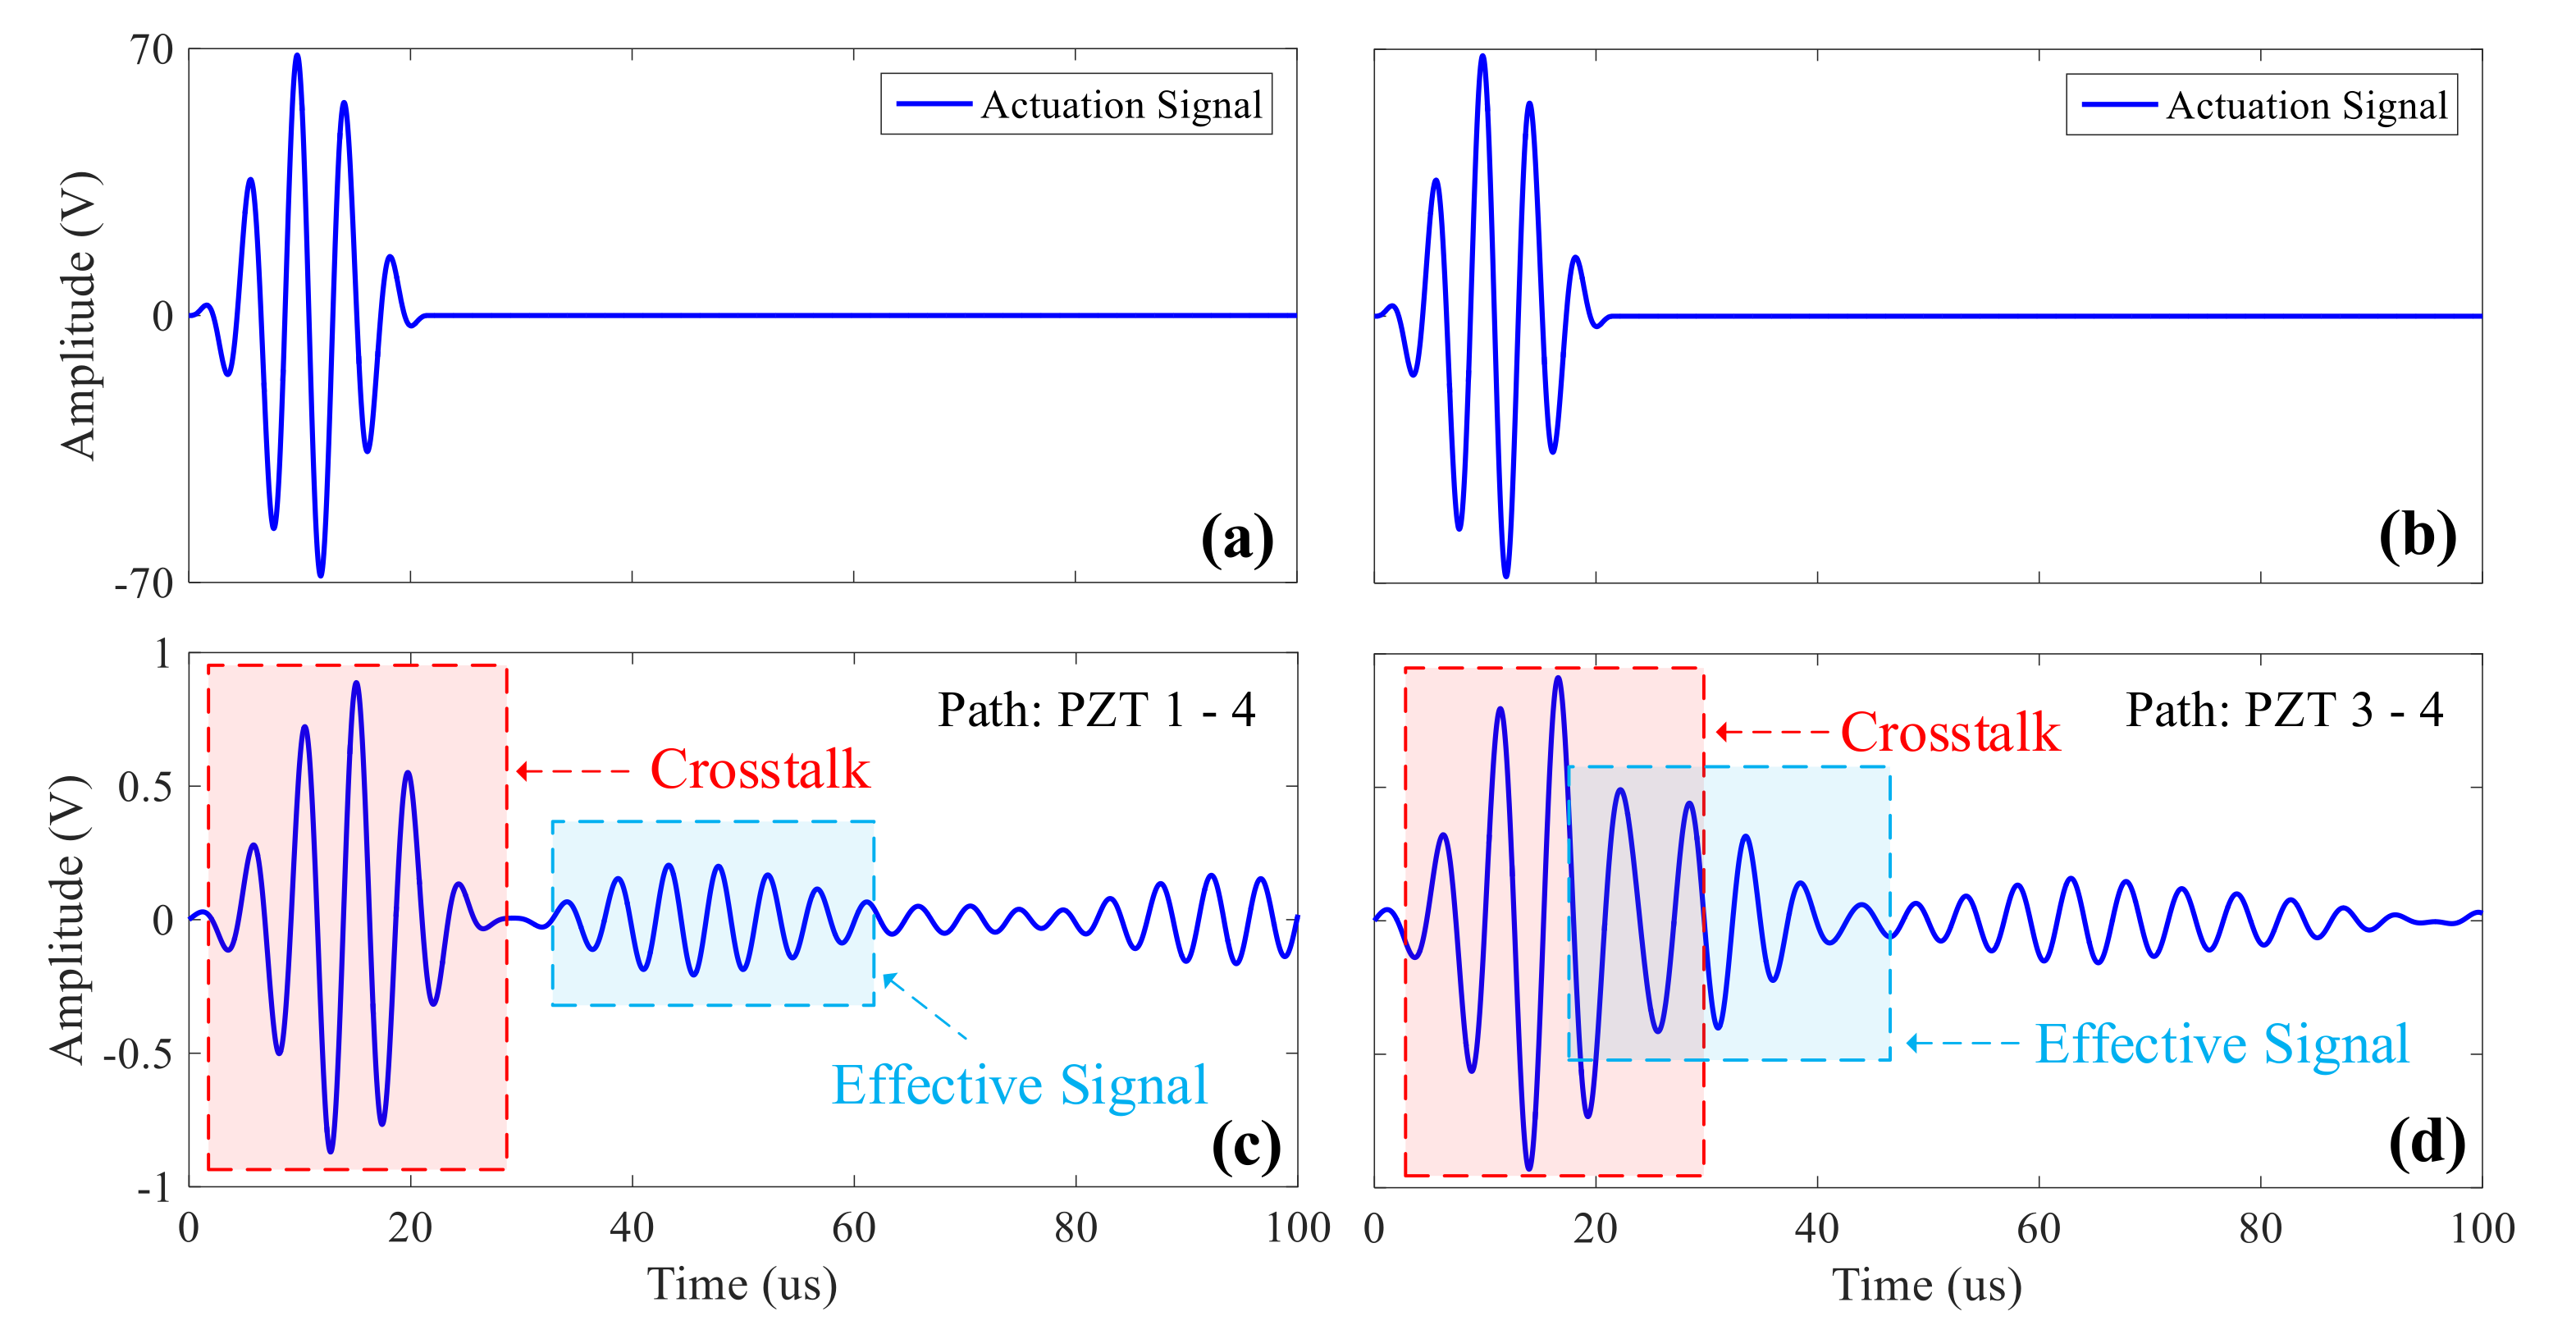
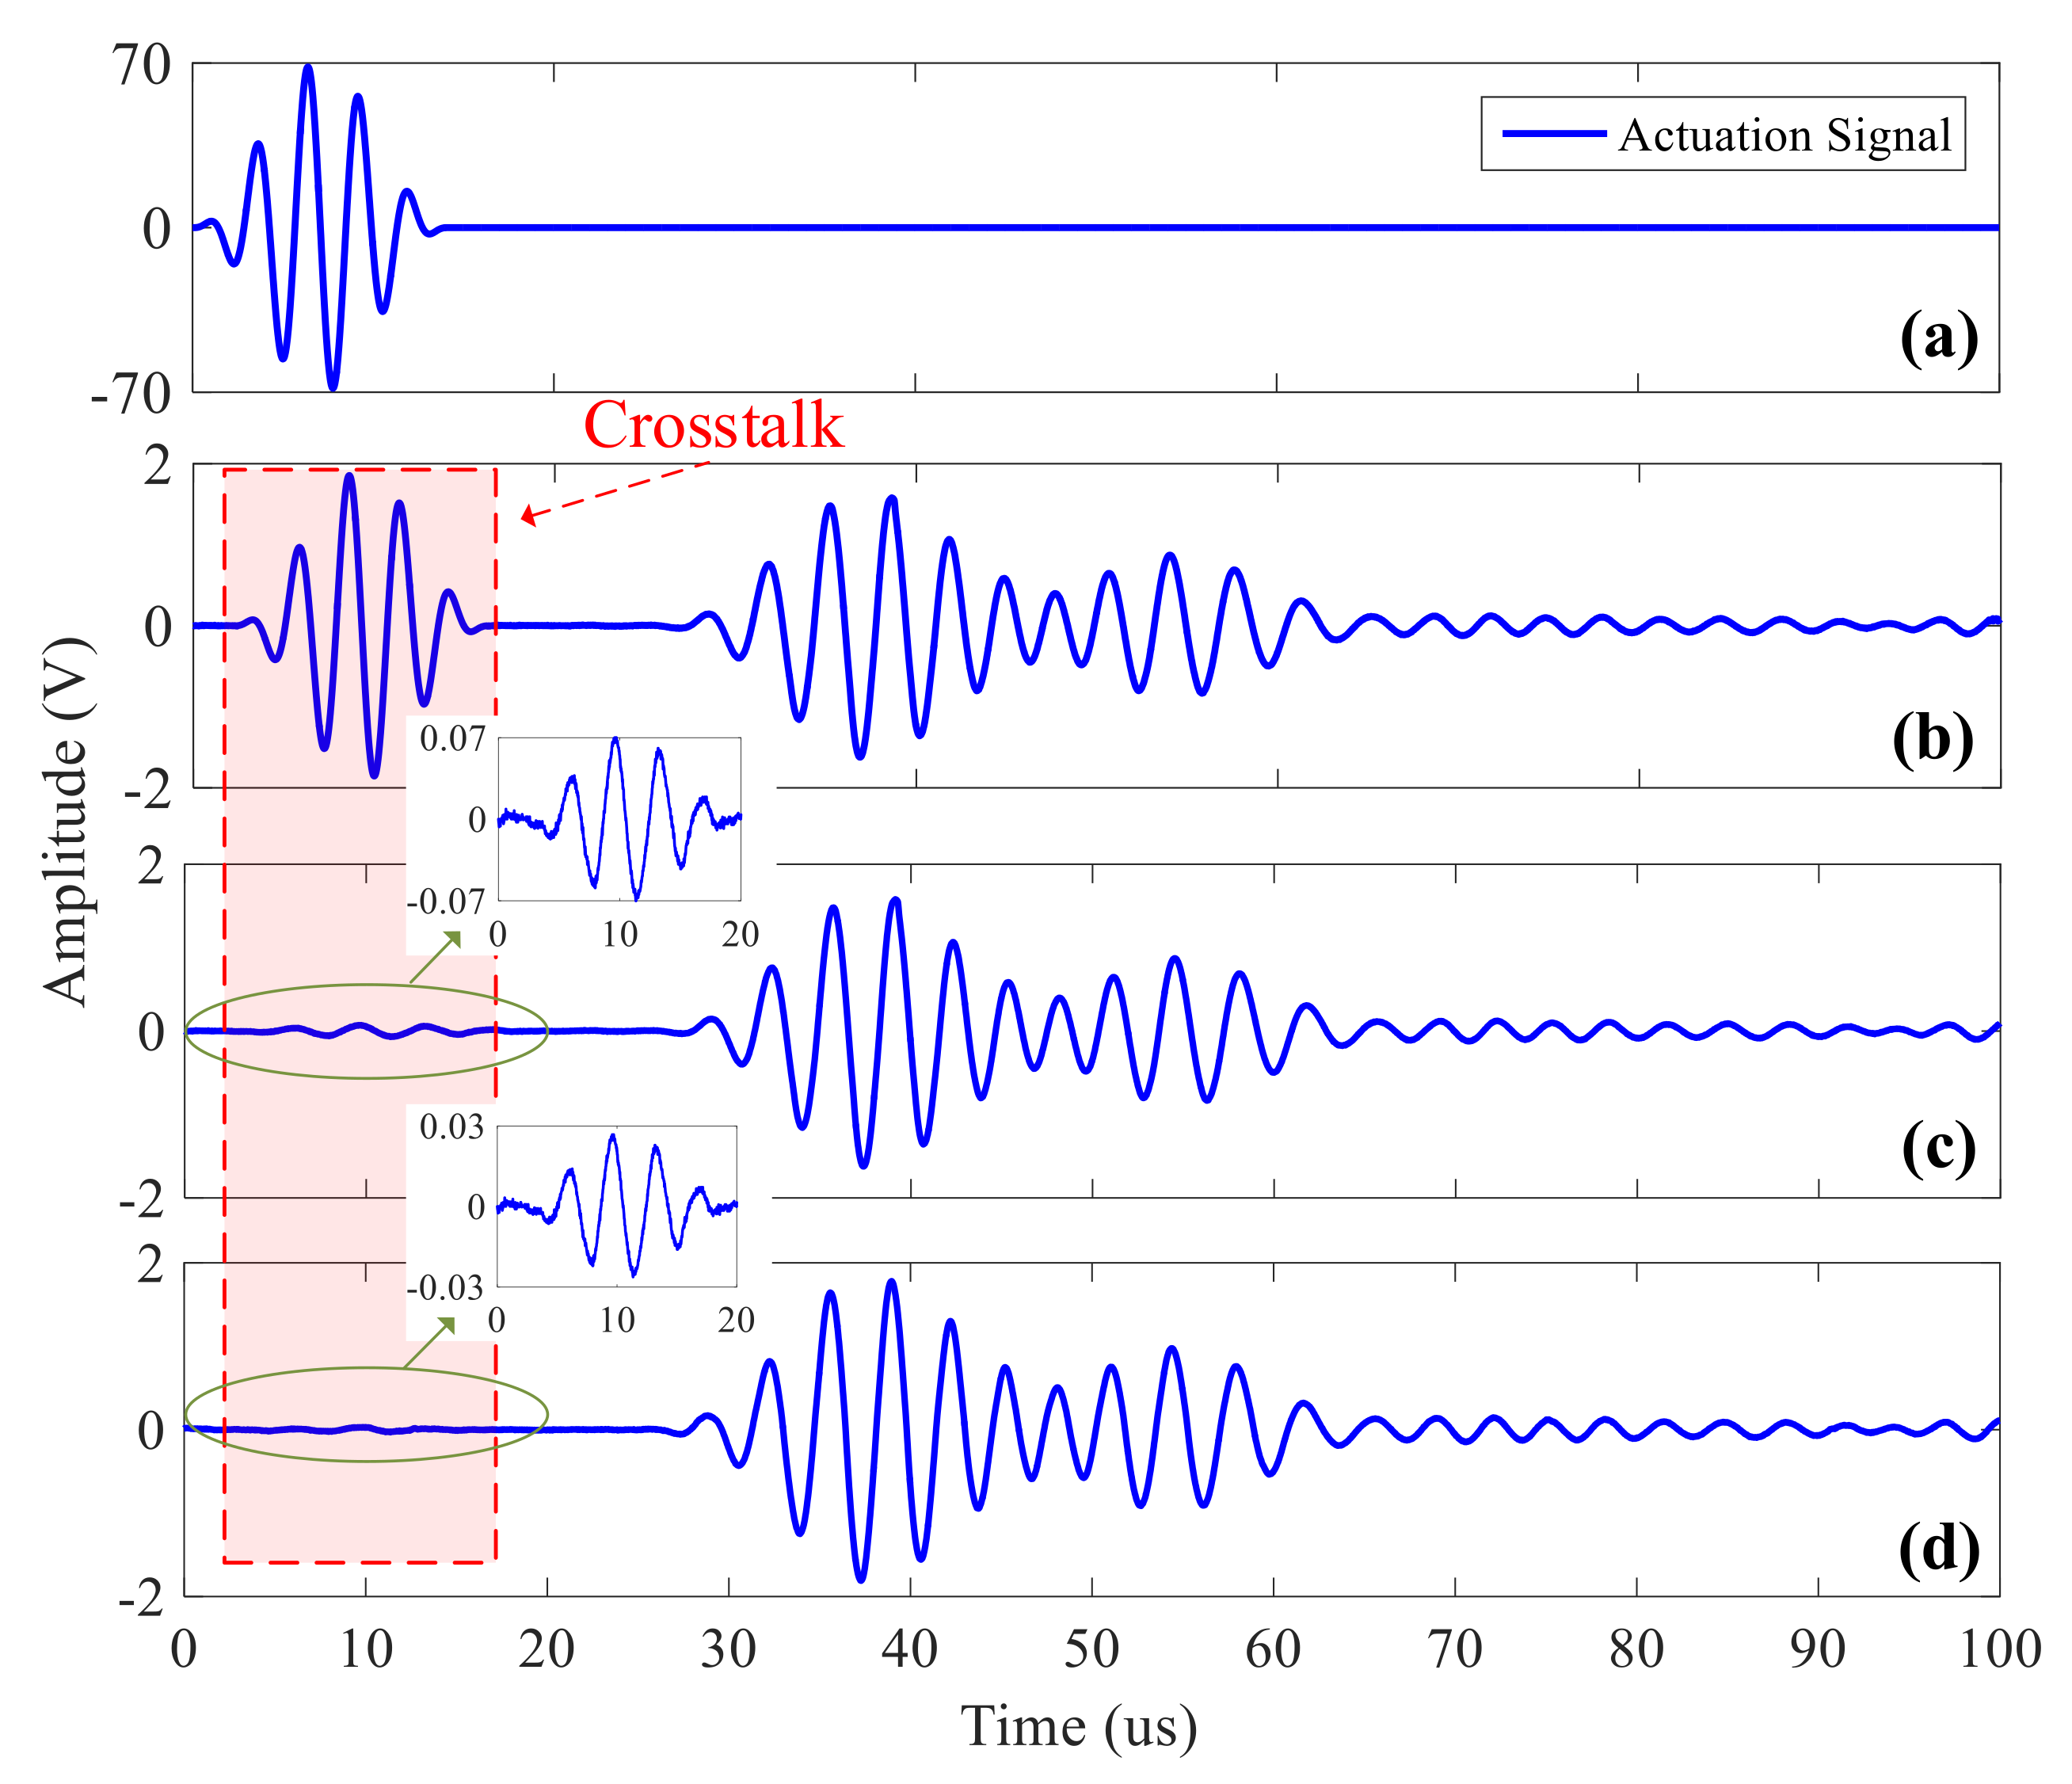
2.2.1. Analysis of Crosstalk
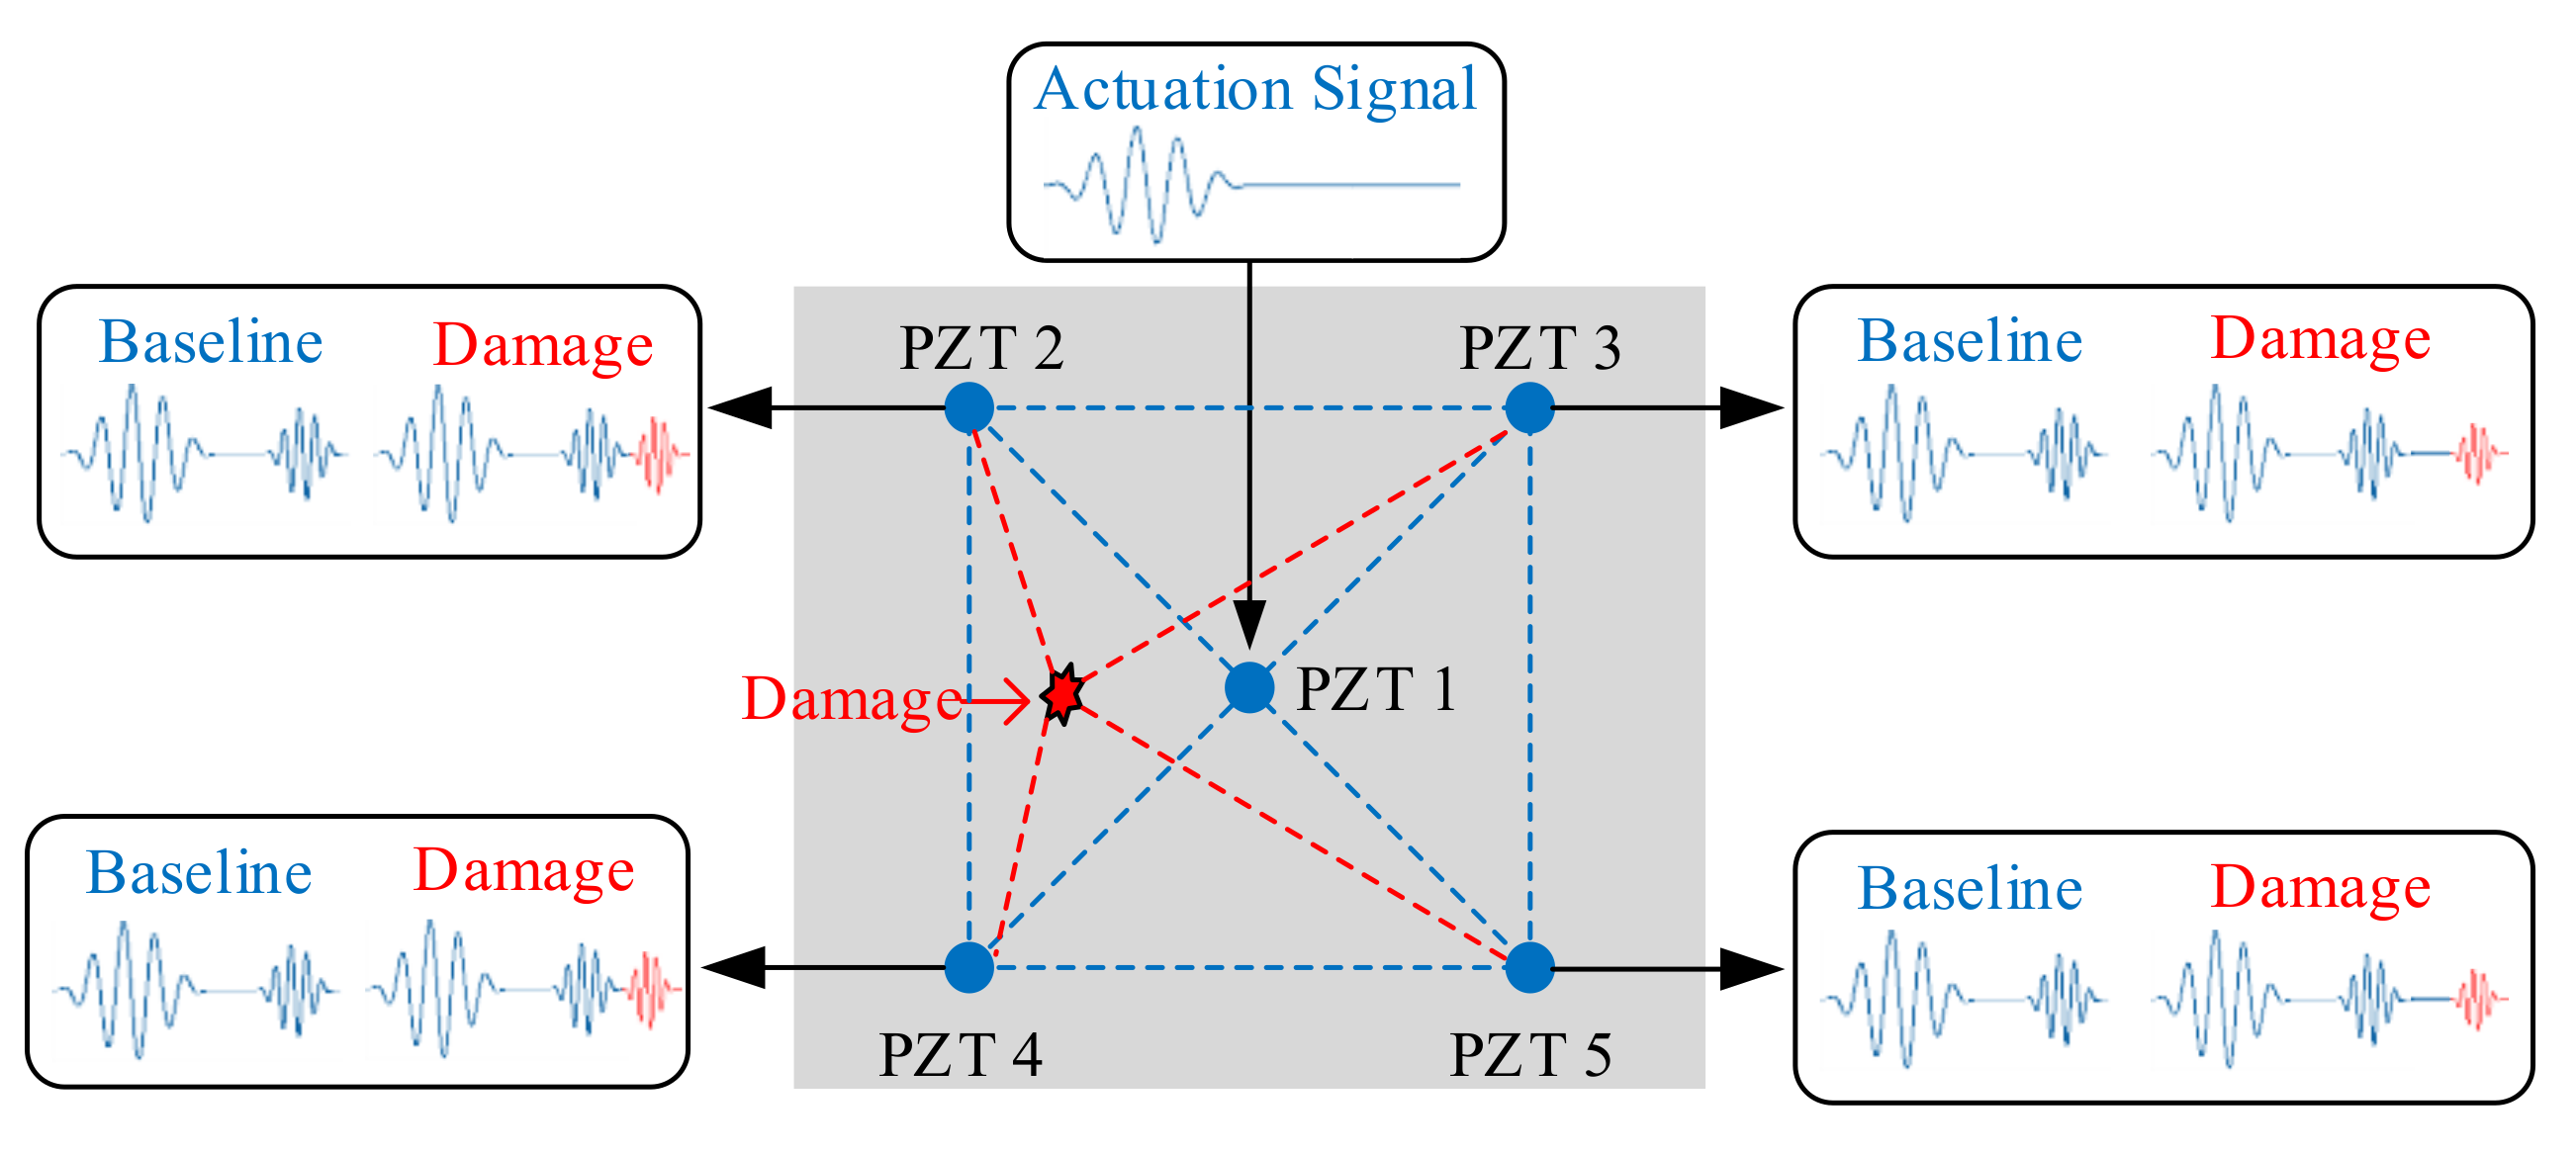
2.2.2. The Principles of SAMSR Operation Mode
3. Hardware Design
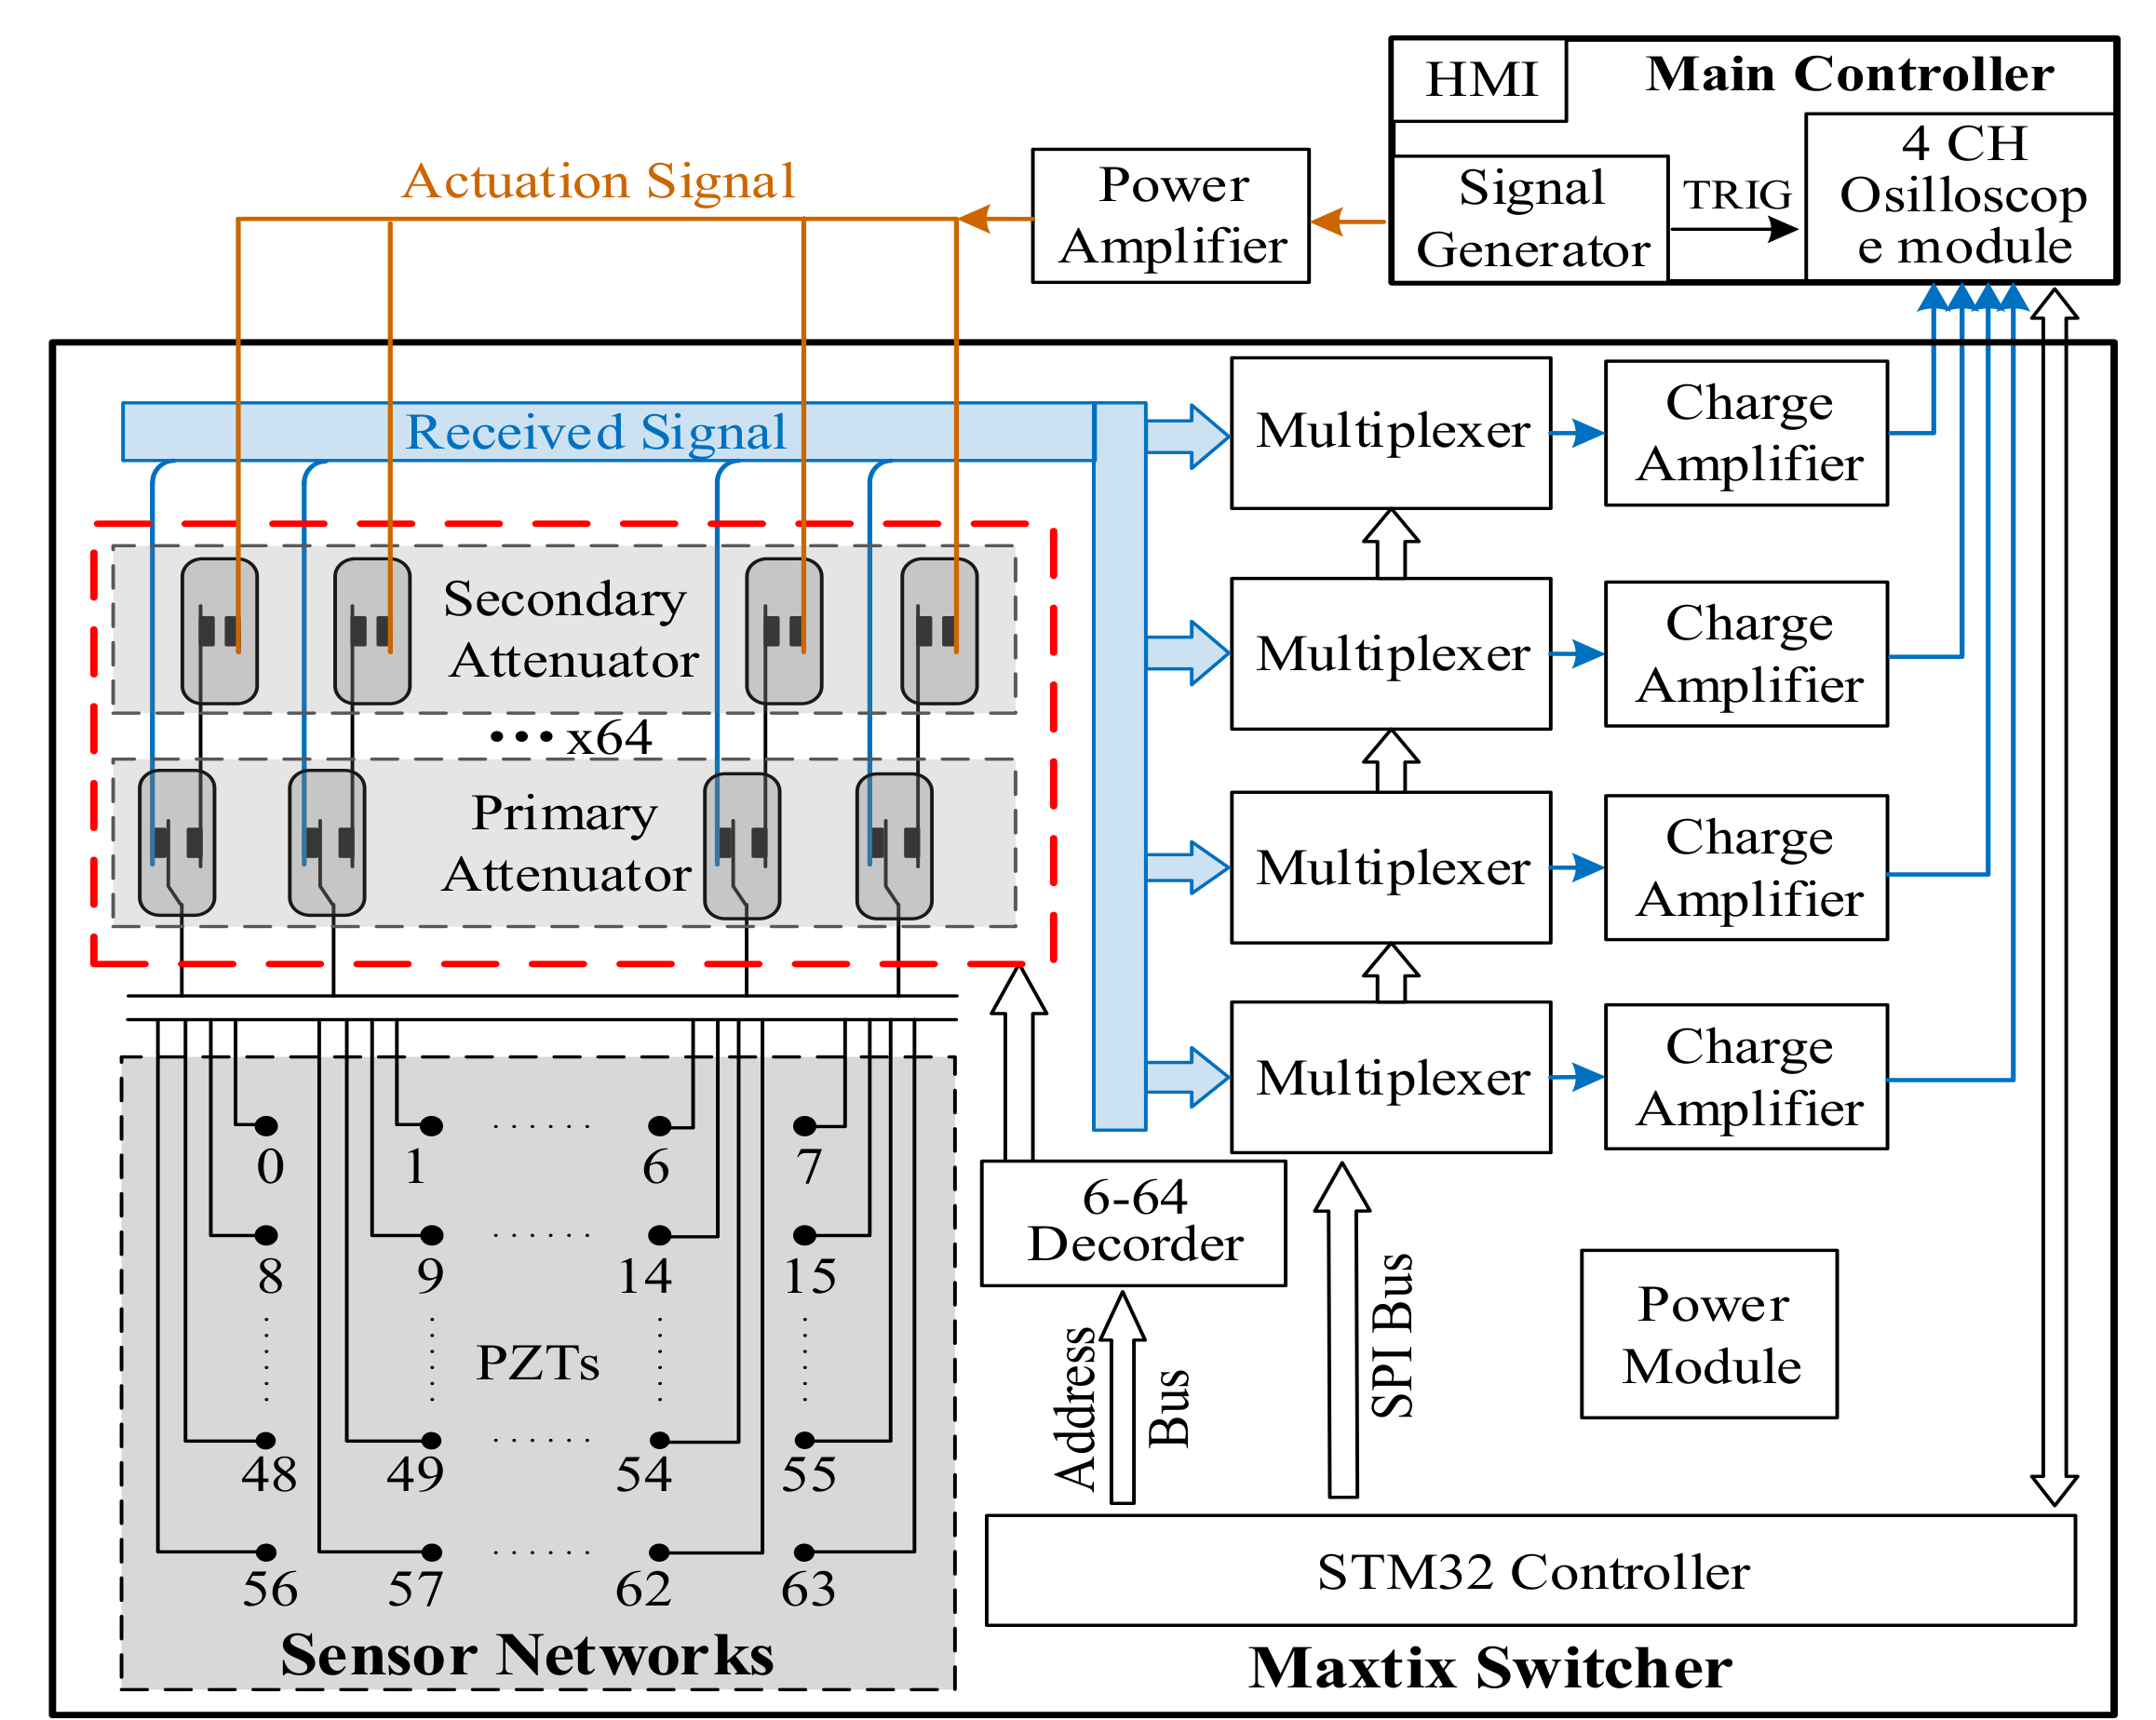
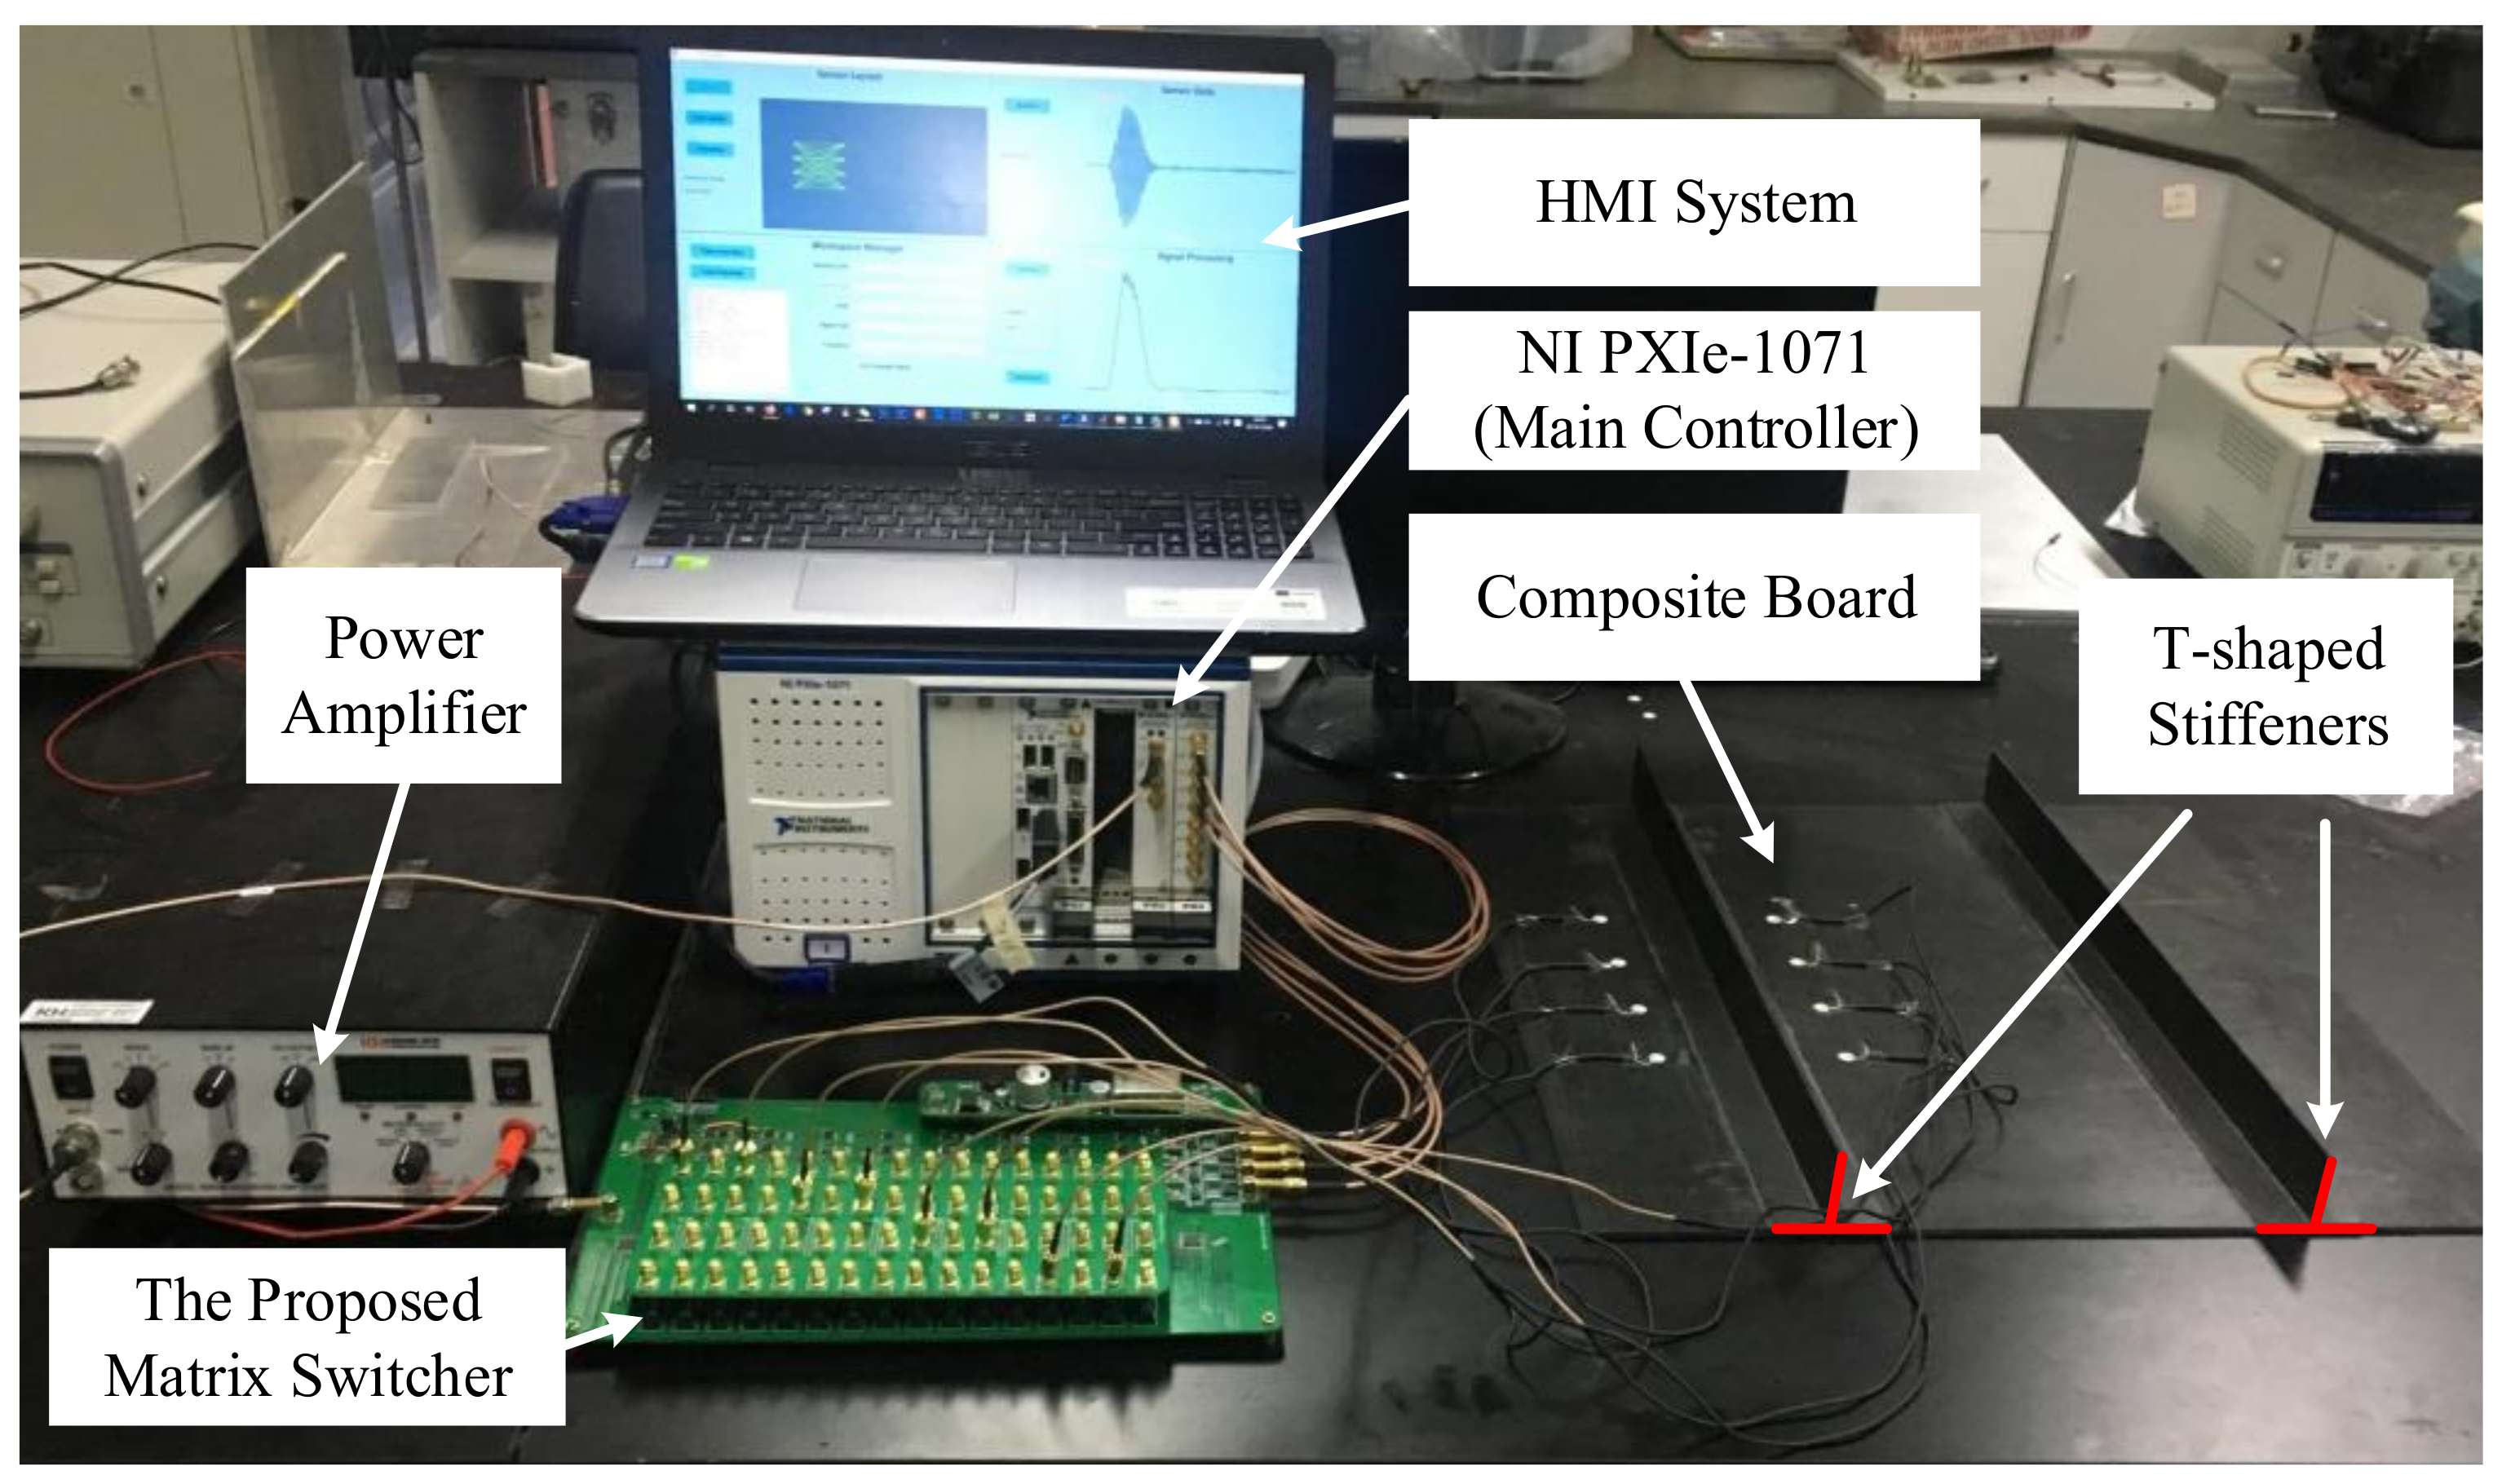
3.1. Overall Design
3.2. Realization of the Matrix Switcher Module With Ultra-Low Crosstalk
3.3. Design of a Low Noise Power Amplifier
4. Experimental Verification
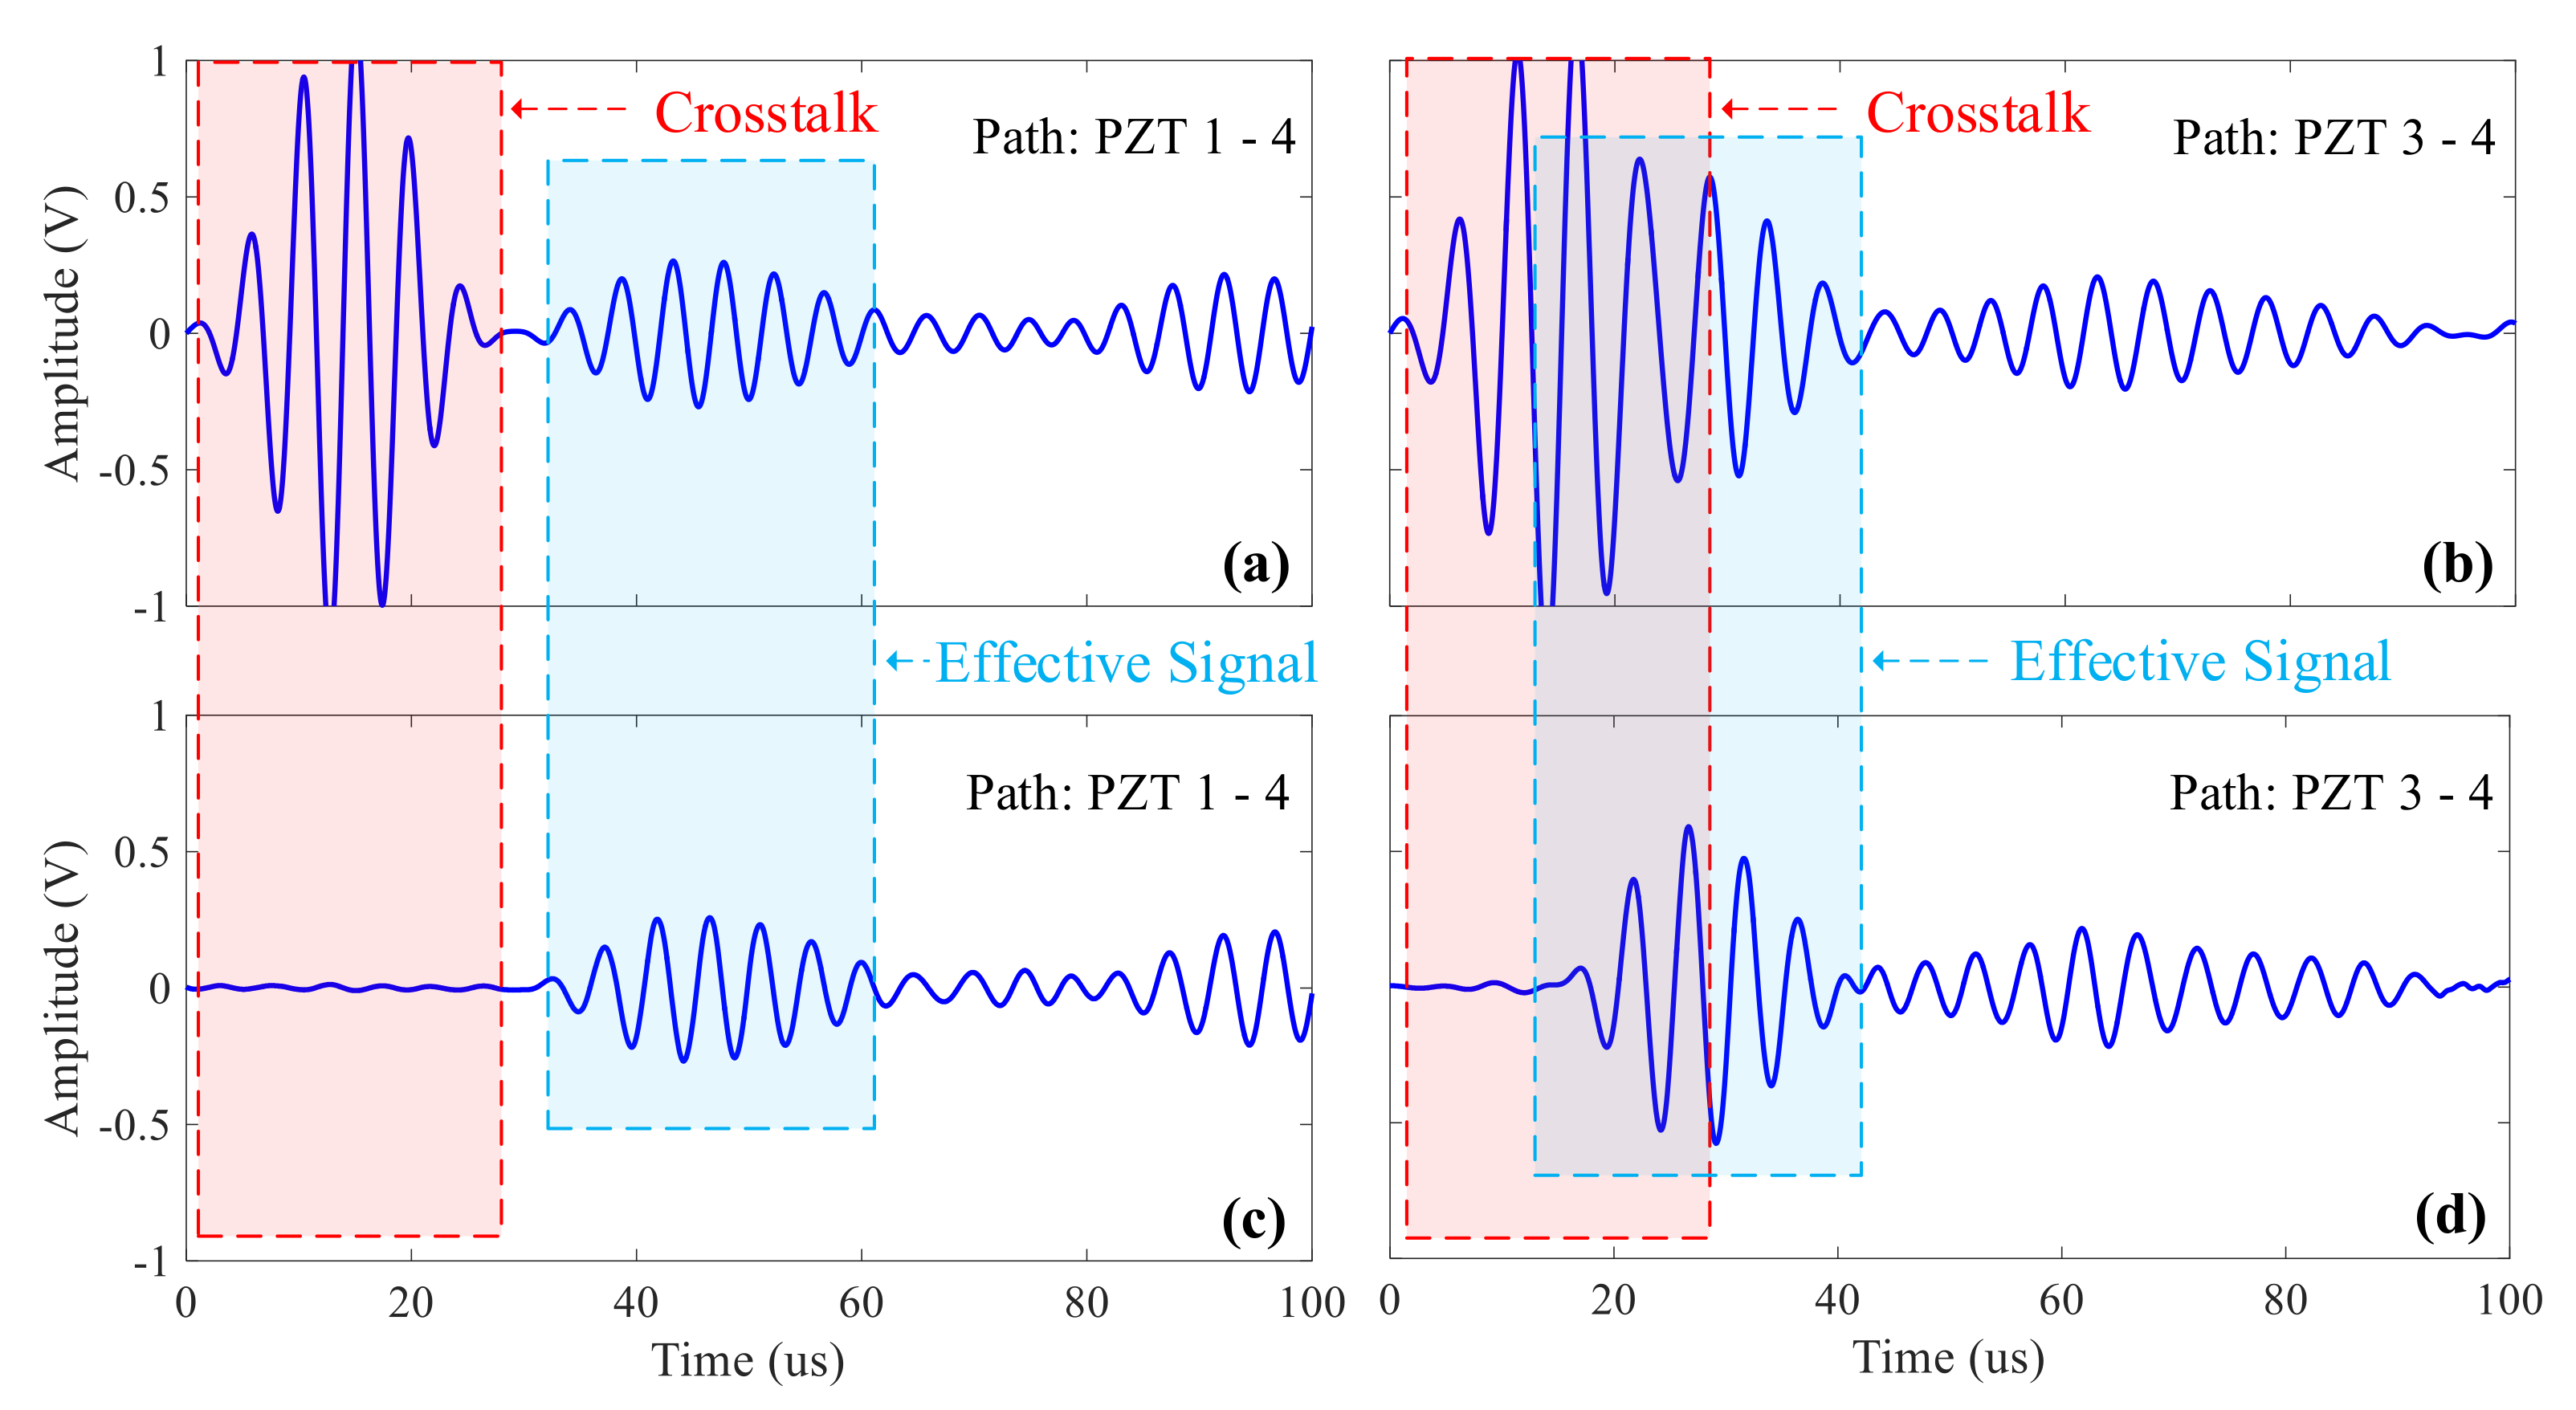
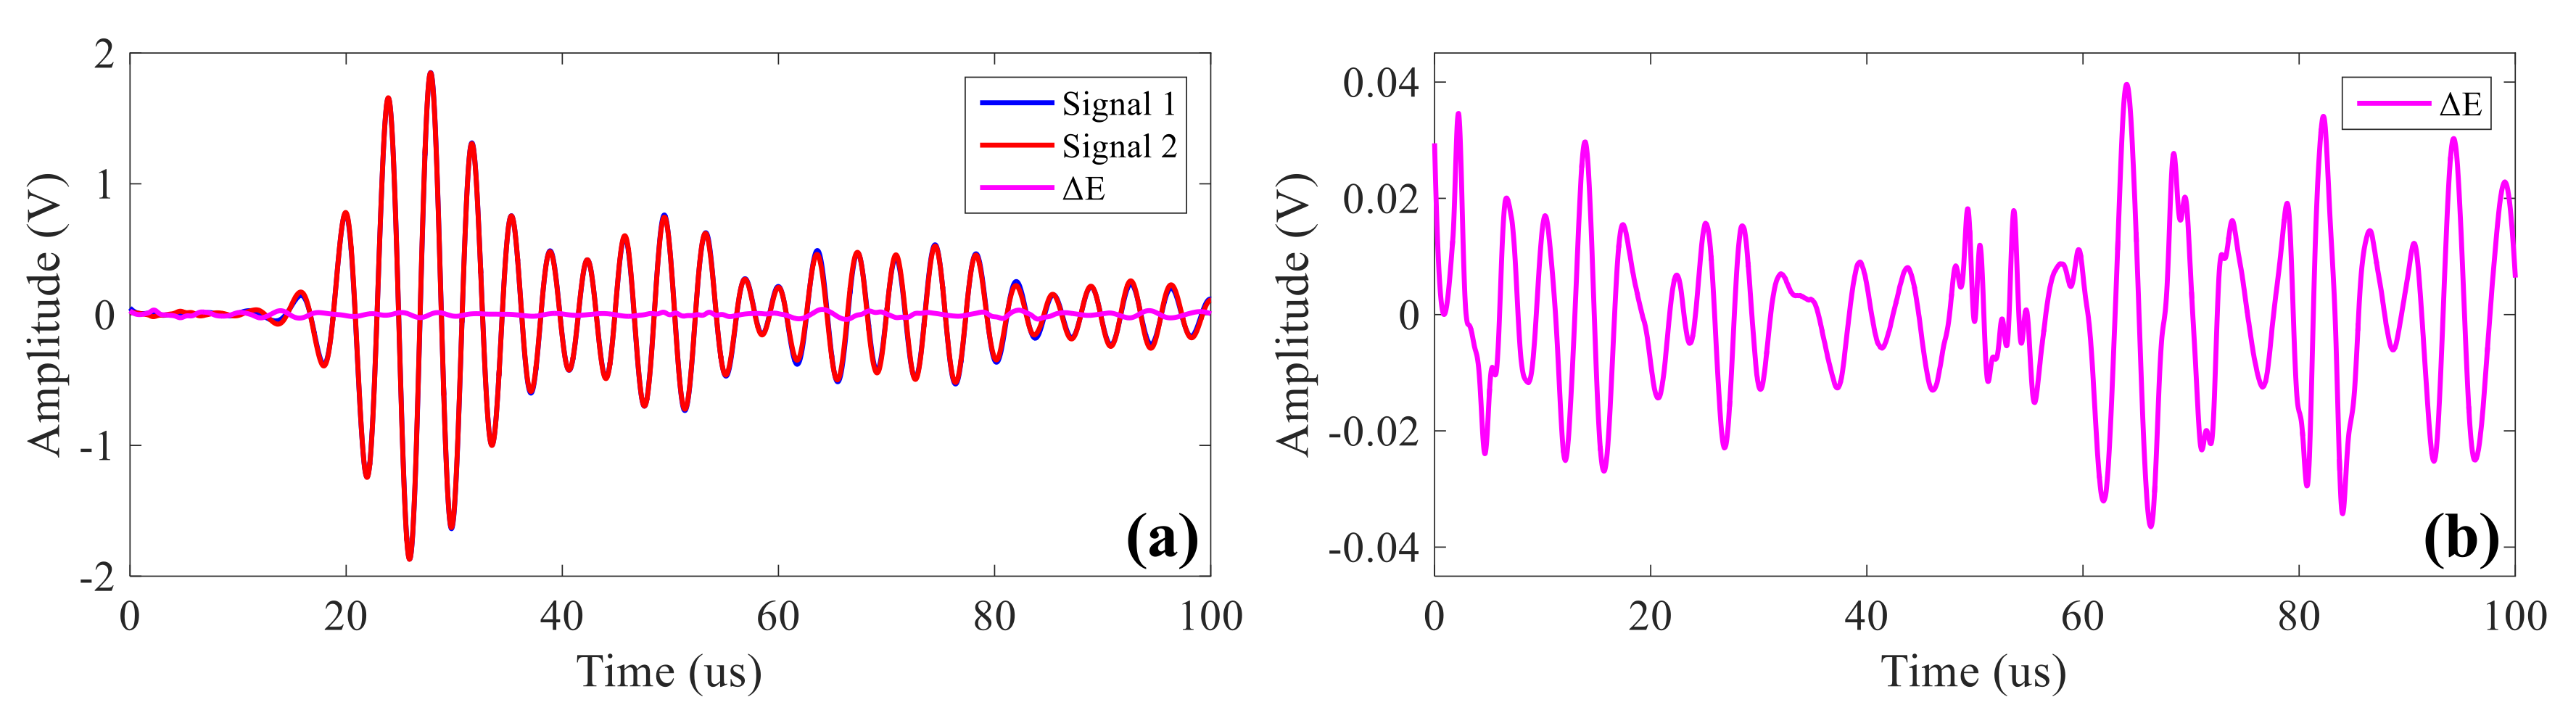
4.1. Crosstalk Test of the System
4.2. System Repeatability Test
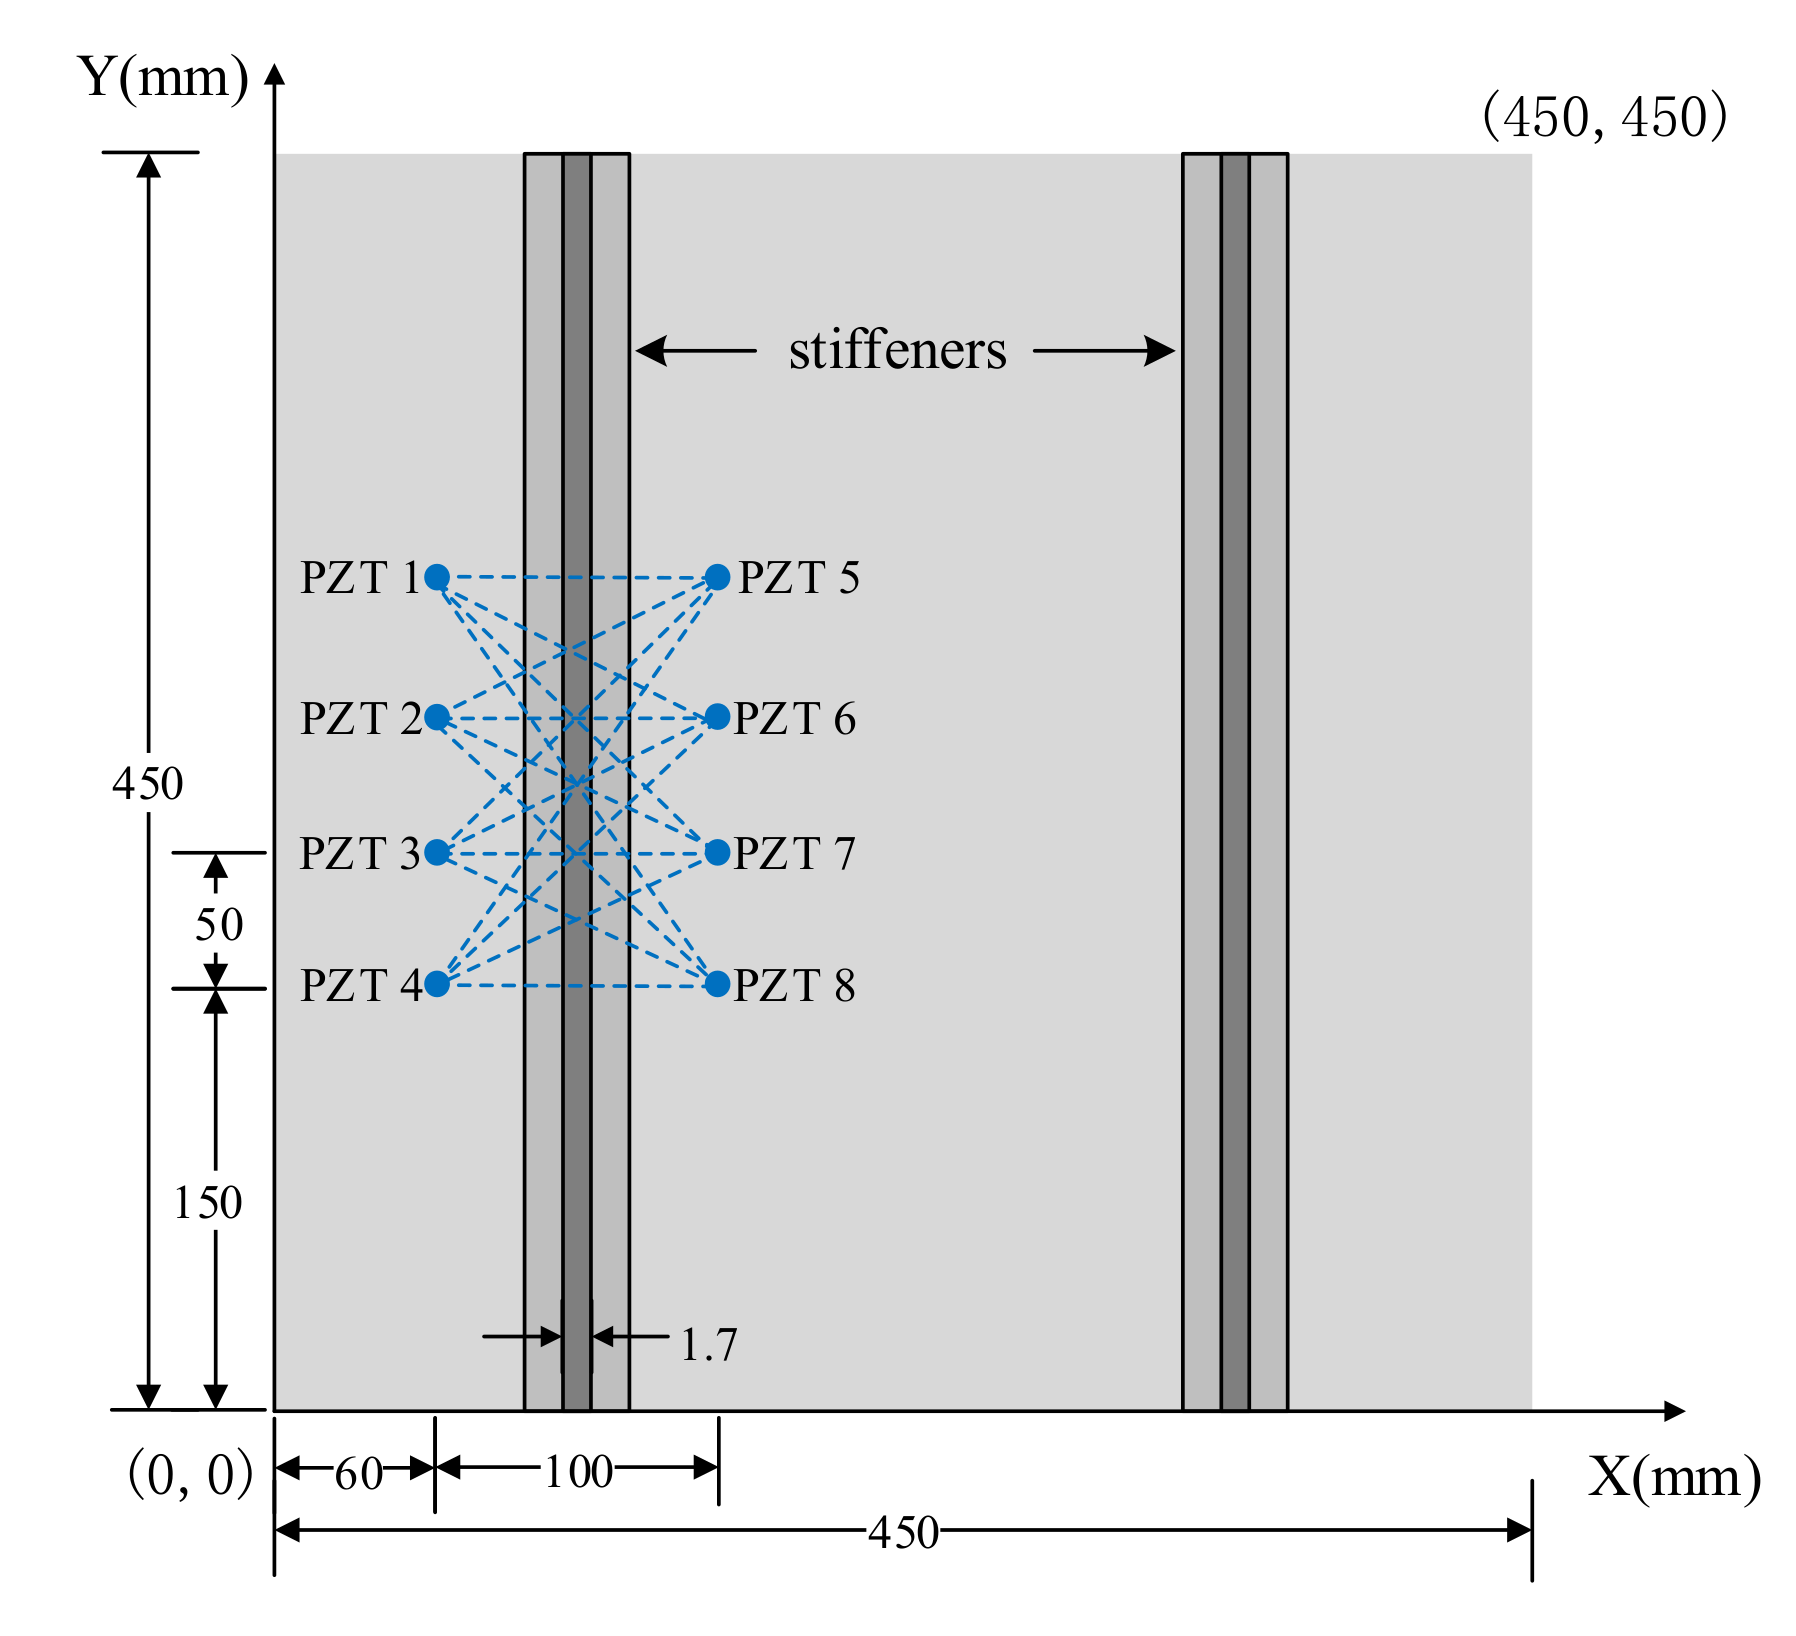
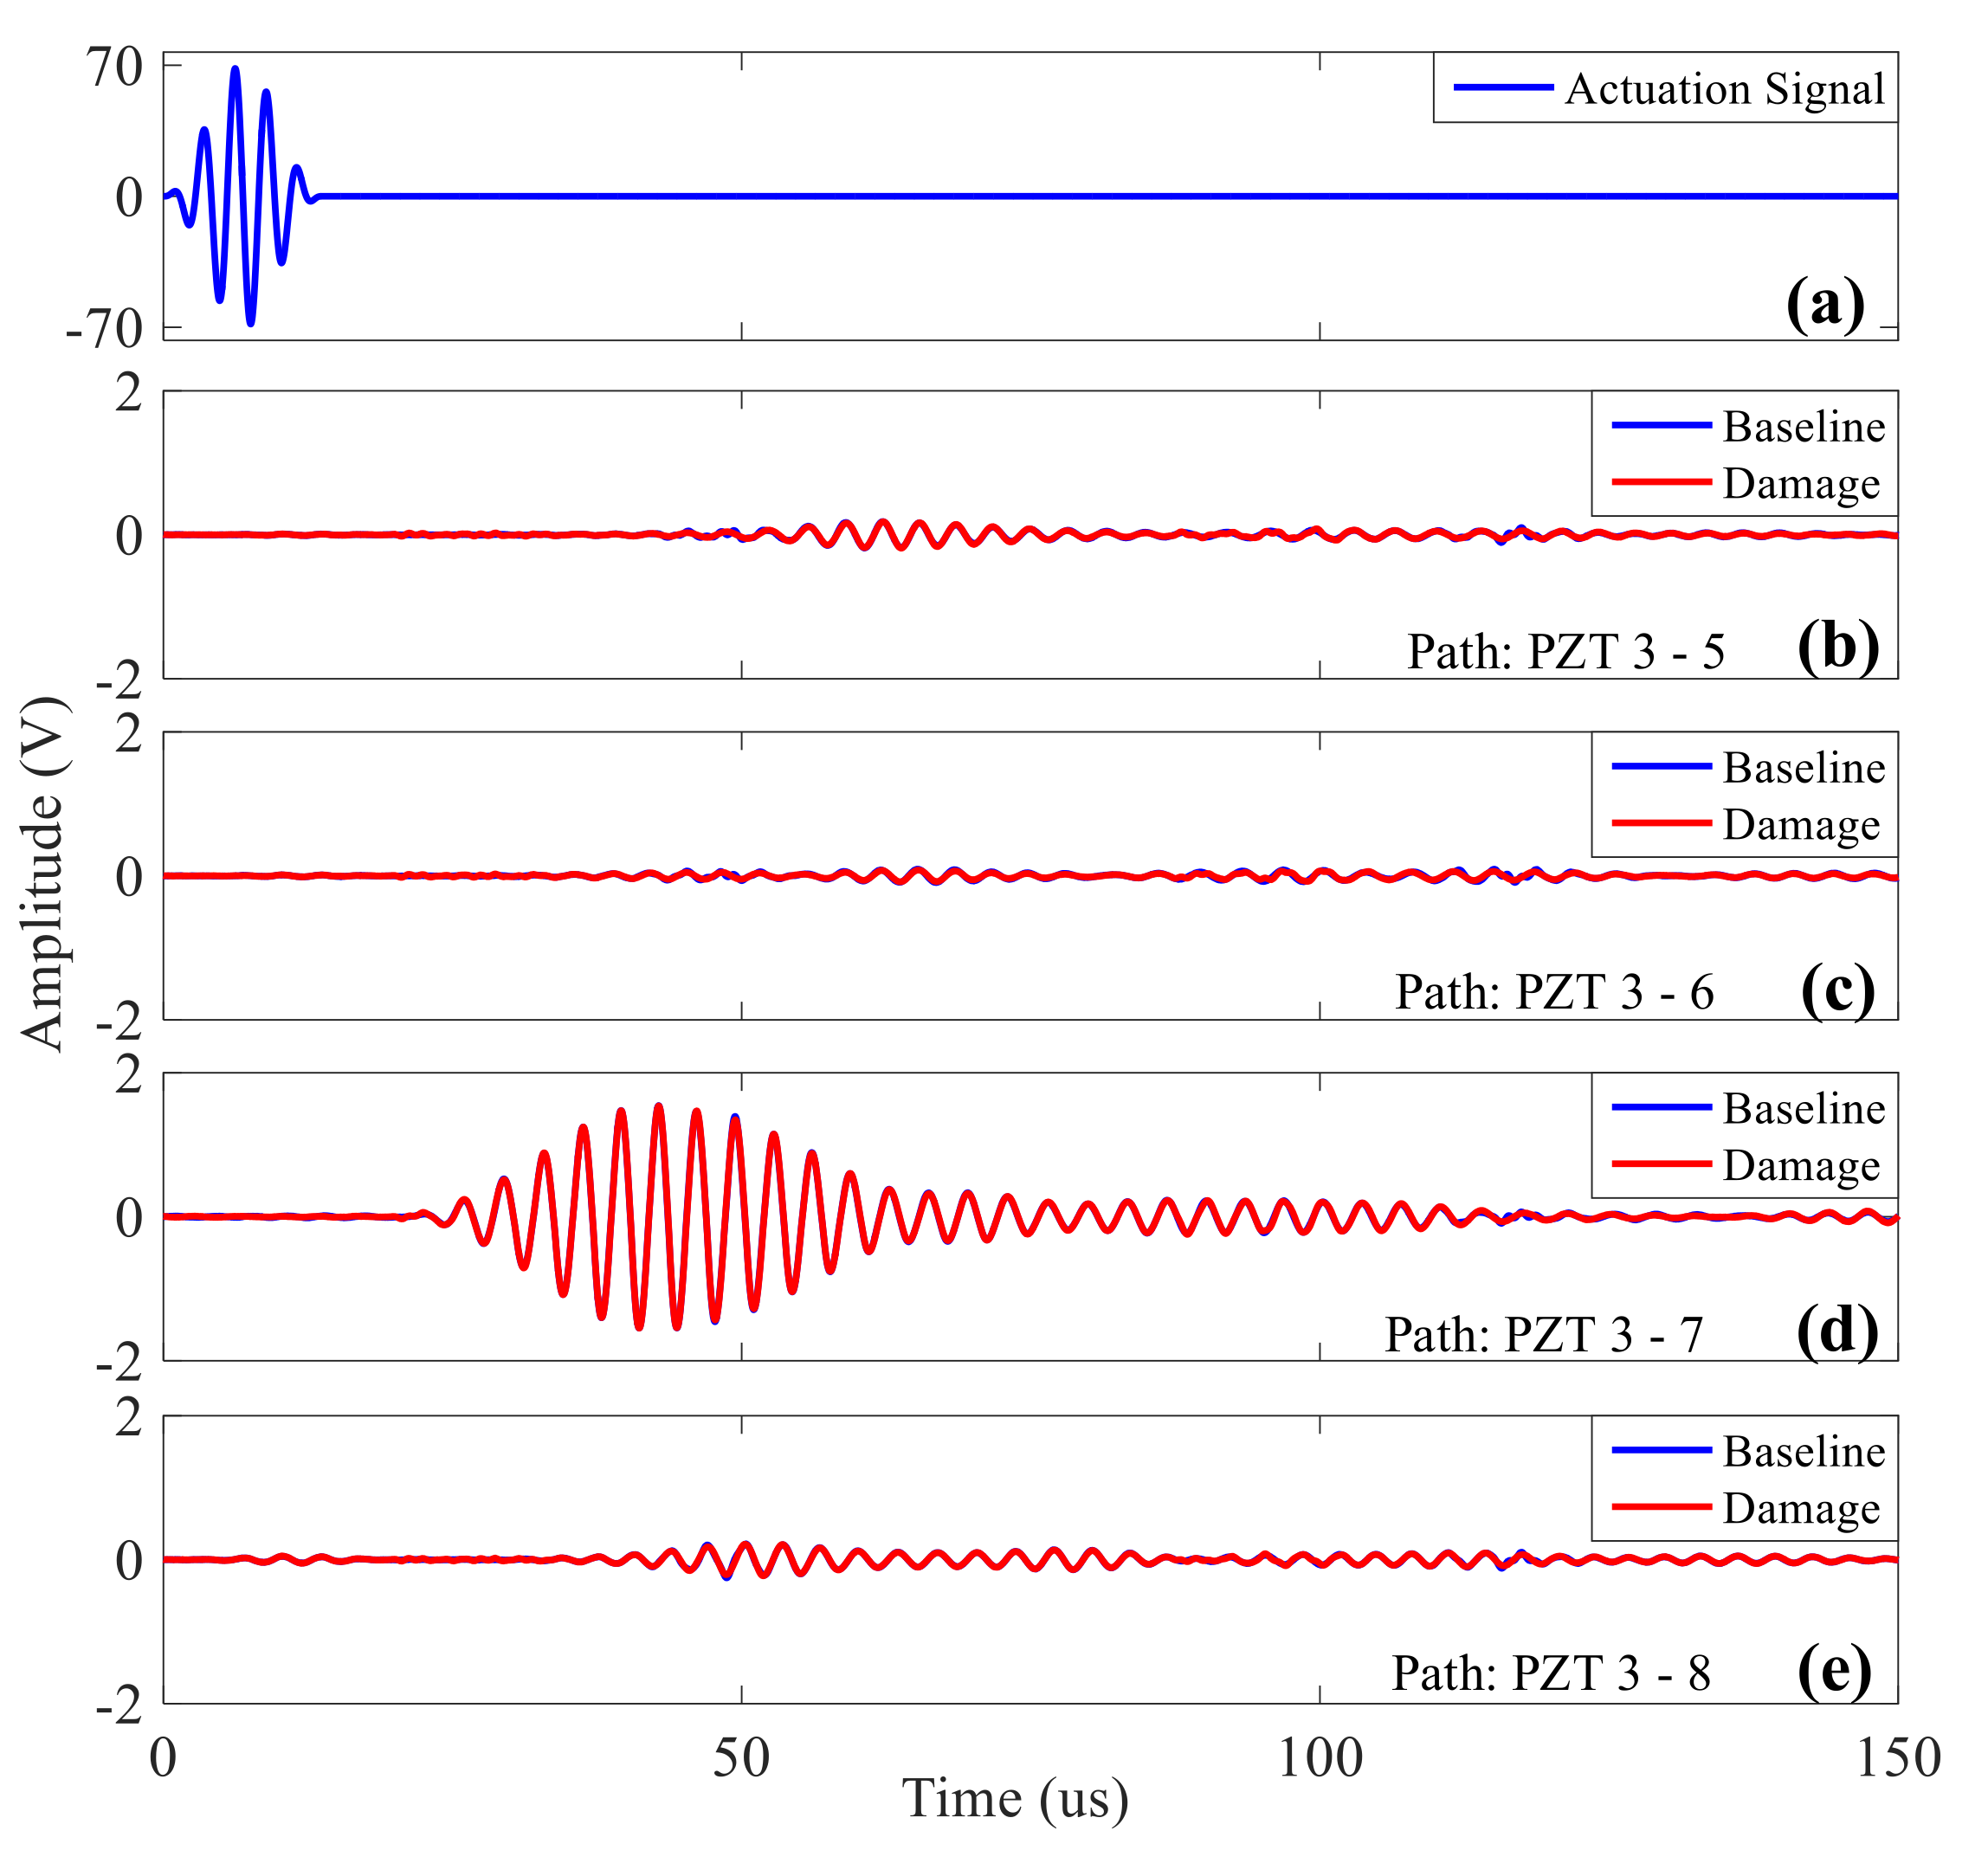
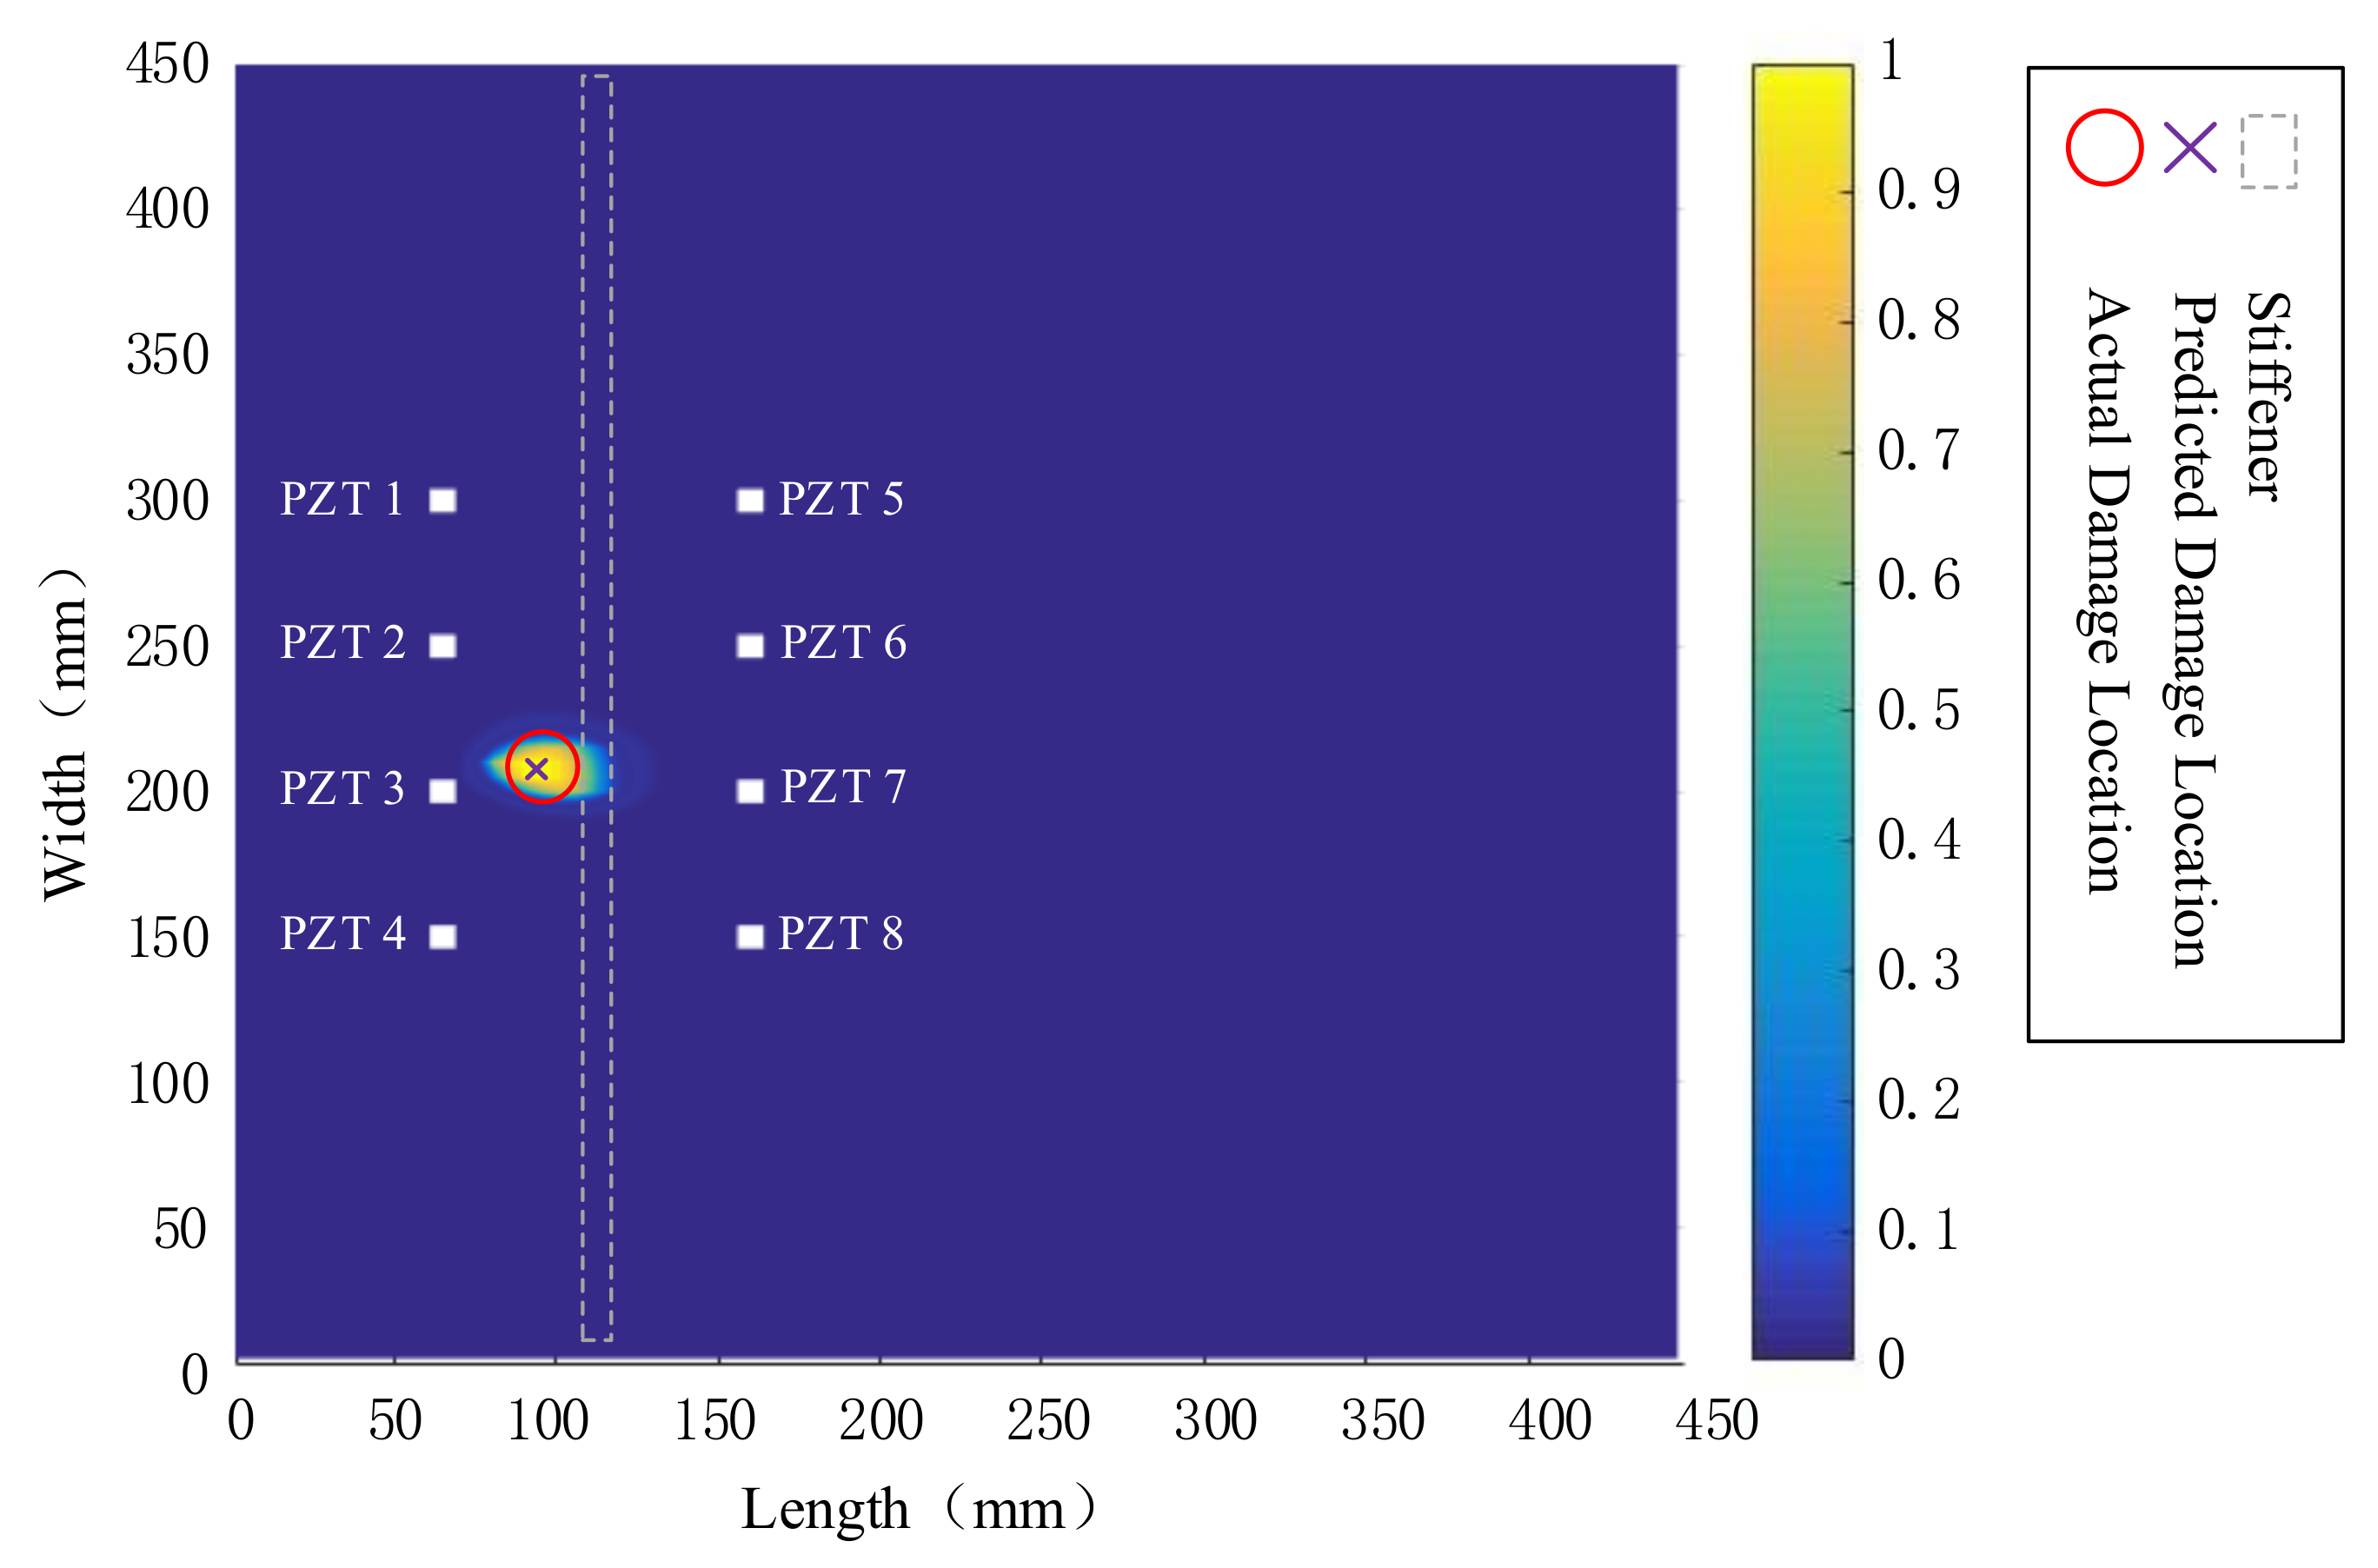
4.3. Simulated Damage Location of Hot Spot Region
5. Conclusions
- (1)
- A two-stage attenuating circuit with an interlocking isolation structure is designed to achieve high isolation between actuation and acquisition signals. Under high voltage (±70 V) actuation, ultrasonic guided wave signals with ultra-low crosstalk can also be obtained.
- (2)
- This design supports the input of an up to 64-channel sensor array and adopts the mode of single-actuation and four-simultaneous-reception. In this system, any sensor can be used as the actuation source and the other four as the reception source, which effectively improves the acquisition efficiency.
- (3)
- The system has been verified on composite materials of hot-spot areas, for which the effect of crosstalk is almost eliminated and the accurate damage location is achieved.
- (4)
- This design has strong expansibility and can be applied to higher actuation voltage and large-scaled area monitoring.
Author Contributions
Funding
Conflicts of Interest
References
- Mariani, S.; Nguyen, T.; Phillips, R.R.; Kijanka, P.; Lanza di Scalea, F.; Staszewski, W.J.; Fateh, M.; Carr, G. Noncontact ultrasonic guided wave inspection of rails. Struct. Health Monit. 2013, 12, 539–548. [Google Scholar] [CrossRef]
- Eremin, A.; Golub, M.; Glushkov, E.; Glushkova, N. Identification of delamination based on the Lamb wave scattering resonance frequencies. NDT E Int. 2019, 103, 145–153. [Google Scholar] [CrossRef]
- Tiwari, K.A.; Raisutis, R. Identification and characterization of defects in glass fiber reinforced plastic by refining the guided lamb waves. Materials 2018, 11, 1173. [Google Scholar] [CrossRef] [PubMed] [Green Version]
- Qing, X.; Li, W.; Wang, Y.; Sun, H. Piezoelectric transducer-based structural health monitoring for aircraft applications. Sens. Switz. 2019, 19, 545. [Google Scholar] [CrossRef] [PubMed]
- Qiu, L.; Yuan, S.-F. Research and application of integrated health monitoring scanning system based on PZT sensor array. Yadian Yu Shengguang Piezoelectr. Acoustoopt. 2008, 30, 39–41. [Google Scholar]
- Fu, H.; Sharif-Khodaei, Z.; Aliabadi, M.H.F. An energy-efficient cyber-physical system for wireless on-board aircraft structural health monitoring. Mech. Syst. Signal Process. 2019, 128, 352–368. [Google Scholar] [CrossRef]
- Zheng, Y.; He, C.; Wu, B.; Zhou, J. Guided wave arrays for large plate structures inspection. Shengxue Xuebao Acta Acust. 2013, 38, 71–79. [Google Scholar]
- Su, Z.; Ye, L.; Lu, Y. Guided Lamb waves for identification of damage in composite structures: A review. J. Sound Vib. 2006, 295, 753–780. [Google Scholar] [CrossRef]
- Liu, B.; Liu, T.; Zhao, J. A lamb wave wavenumber-searching method for a linear PZT sensor array. Sens. Switz. 2019, 19, 4166. [Google Scholar] [CrossRef] [Green Version]
- Qiu, L.; Yuan, S. On development of a multi-channel PZT array scanning system and its evaluating application on UAV wing box. Sens. Actuators A Phys. 2009, 151, 220–230. [Google Scholar] [CrossRef]
- Zhang, G.; Gao, W.; Song, G.; Song, Y. An imaging algorithm for damage detection with dispersion compensation using piezoceramic induced lamb waves. Smart Mater. Struct. 2017, 26, 025017. [Google Scholar] [CrossRef]
- Ccrtoii, D.; Felix, N.; Lacazc, E.; Testoii, F.; Patat, F. Investigation of cross-coupling in 1-3 piezocomposite arrays. IEEE Trans. Ultrason. Ferroelectr. Freq. Control 2001, 48, 85–92. [Google Scholar] [CrossRef]
- Liu, B.; Qiu, L.; Yuan, S.; Shao, H.; Zhang, H. The probability imaging algorithm of composite t-joint damage monitoring. Zhendong Ceshi Yu Zhenduan/J. Vib. Meas. Diagn. 2015, 35, 519–524. [Google Scholar] [CrossRef]
- Matt, H.; Bartoli, I.; Lanza Di Scalea, F. Ultrasonic guided wave monitoring of composite wing skin -to-spar bonded joints in aerospace structures. J. Acoust. Soc. Am. 2005, 118, 2240–2252. [Google Scholar] [CrossRef]
- Furse, C. A survey of phased arrays for medical applications. Appl. Comput. Electromagn. Soc. J. 2006, 21, 365–379. [Google Scholar]
- Moles, M.; Dube, N.; Labbe, S.; Ginzel, E. Review of ultrasonic phased arrays for pressure vessel and pipeline weld inspections. J. Press. Vessel Technol. Trans. ASME 2005, 127, 351–356. [Google Scholar] [CrossRef]
- Yuan, C.; Xie, C.Z.; Li, L.C.; Zhang, F.Z.; Gubanski, S.M. Ultrasonic Phased Array Detection of Internal Defects in Composite Insulators. IEEE Trns. Dielectr. Electr. Insul. 2016, 23, 525–531. [Google Scholar] [CrossRef]
- Ko, J.M.; Ni, Y.Q. Technology developments in structural health monitoring of large-scale bridges. Eng. Struct. 2005, 27, 1715–1725. [Google Scholar] [CrossRef]
- Ewald, V.; Groves, R.M.; Benedictus, R. Transducer placement option for ultrasonic lamb wave structural health monitoring (SHM) on damage tolerant aircraft substructure. Proceedings of 11th International Workshop on Structural Health Monitoring 2017: Real-Time Material State Awareness and Data-Driven Safety Assurance (IWSHM 2017), Stanford, CA, USA, 12–14 September 2017; pp. 1811–1818. [Google Scholar]
- Fan, Z.; Castaings, M.; Lowe, M.J.S.; Biateau, C.; Fromme, P. Feature-guided waves for monitoring adhesive shear modulus in bonded stiffeners. NDT E Int. 2013, 54, 96–102. [Google Scholar] [CrossRef]
- Sun, H.; Zhou, L. Damage imaging for composite structures based on fractal dimension. Yi Qi Yi Biao Xue Bao/Chin. J. Sci. Instrum. 2013, 34, 401–407. [Google Scholar]
- Wu, Z.; Liu, K.; Wang, Y.; Zheng, Y. Validation and evaluation of damage identification using probability-based diagnostic imaging on a stiffened composite panel. J. Intell. Mater. Syst. Struct. 2015, 26, 2181–2195. [Google Scholar] [CrossRef]


© 2020 by the authors. Licensee MDPI, Basel, Switzerland. This article is an open access article distributed under the terms and conditions of the Creative Commons Attribution (CC BY) license (http://creativecommons.org/licenses/by/4.0/).
Share and Cite
Xue, W.; Yang, M.; Hong, D.; Wu, D.; Wang, Y.; Qing, X. The Design and Verification of an Active SAMSR Ultrasonic Guided Wave Monitoring System with Ultra-Low Crosstalk. Sensors 2020, 20, 898. https://doi.org/10.3390/s20030898
Xue W, Yang M, Hong D, Wu D, Wang Y, Qing X. The Design and Verification of an Active SAMSR Ultrasonic Guided Wave Monitoring System with Ultra-Low Crosstalk. Sensors. 2020; 20(3):898. https://doi.org/10.3390/s20030898
Chicago/Turabian StyleXue, Wendong, Mengjiao Yang, Deming Hong, Di Wu, Yishou Wang, and Xinlin Qing. 2020. "The Design and Verification of an Active SAMSR Ultrasonic Guided Wave Monitoring System with Ultra-Low Crosstalk" Sensors 20, no. 3: 898. https://doi.org/10.3390/s20030898