Improvement of Pulse Voltage Generated by Wiegand Sensor Through Magnetic-Flux Guidance


Abstract
:1. Introduction
2. Wiegand Sensor
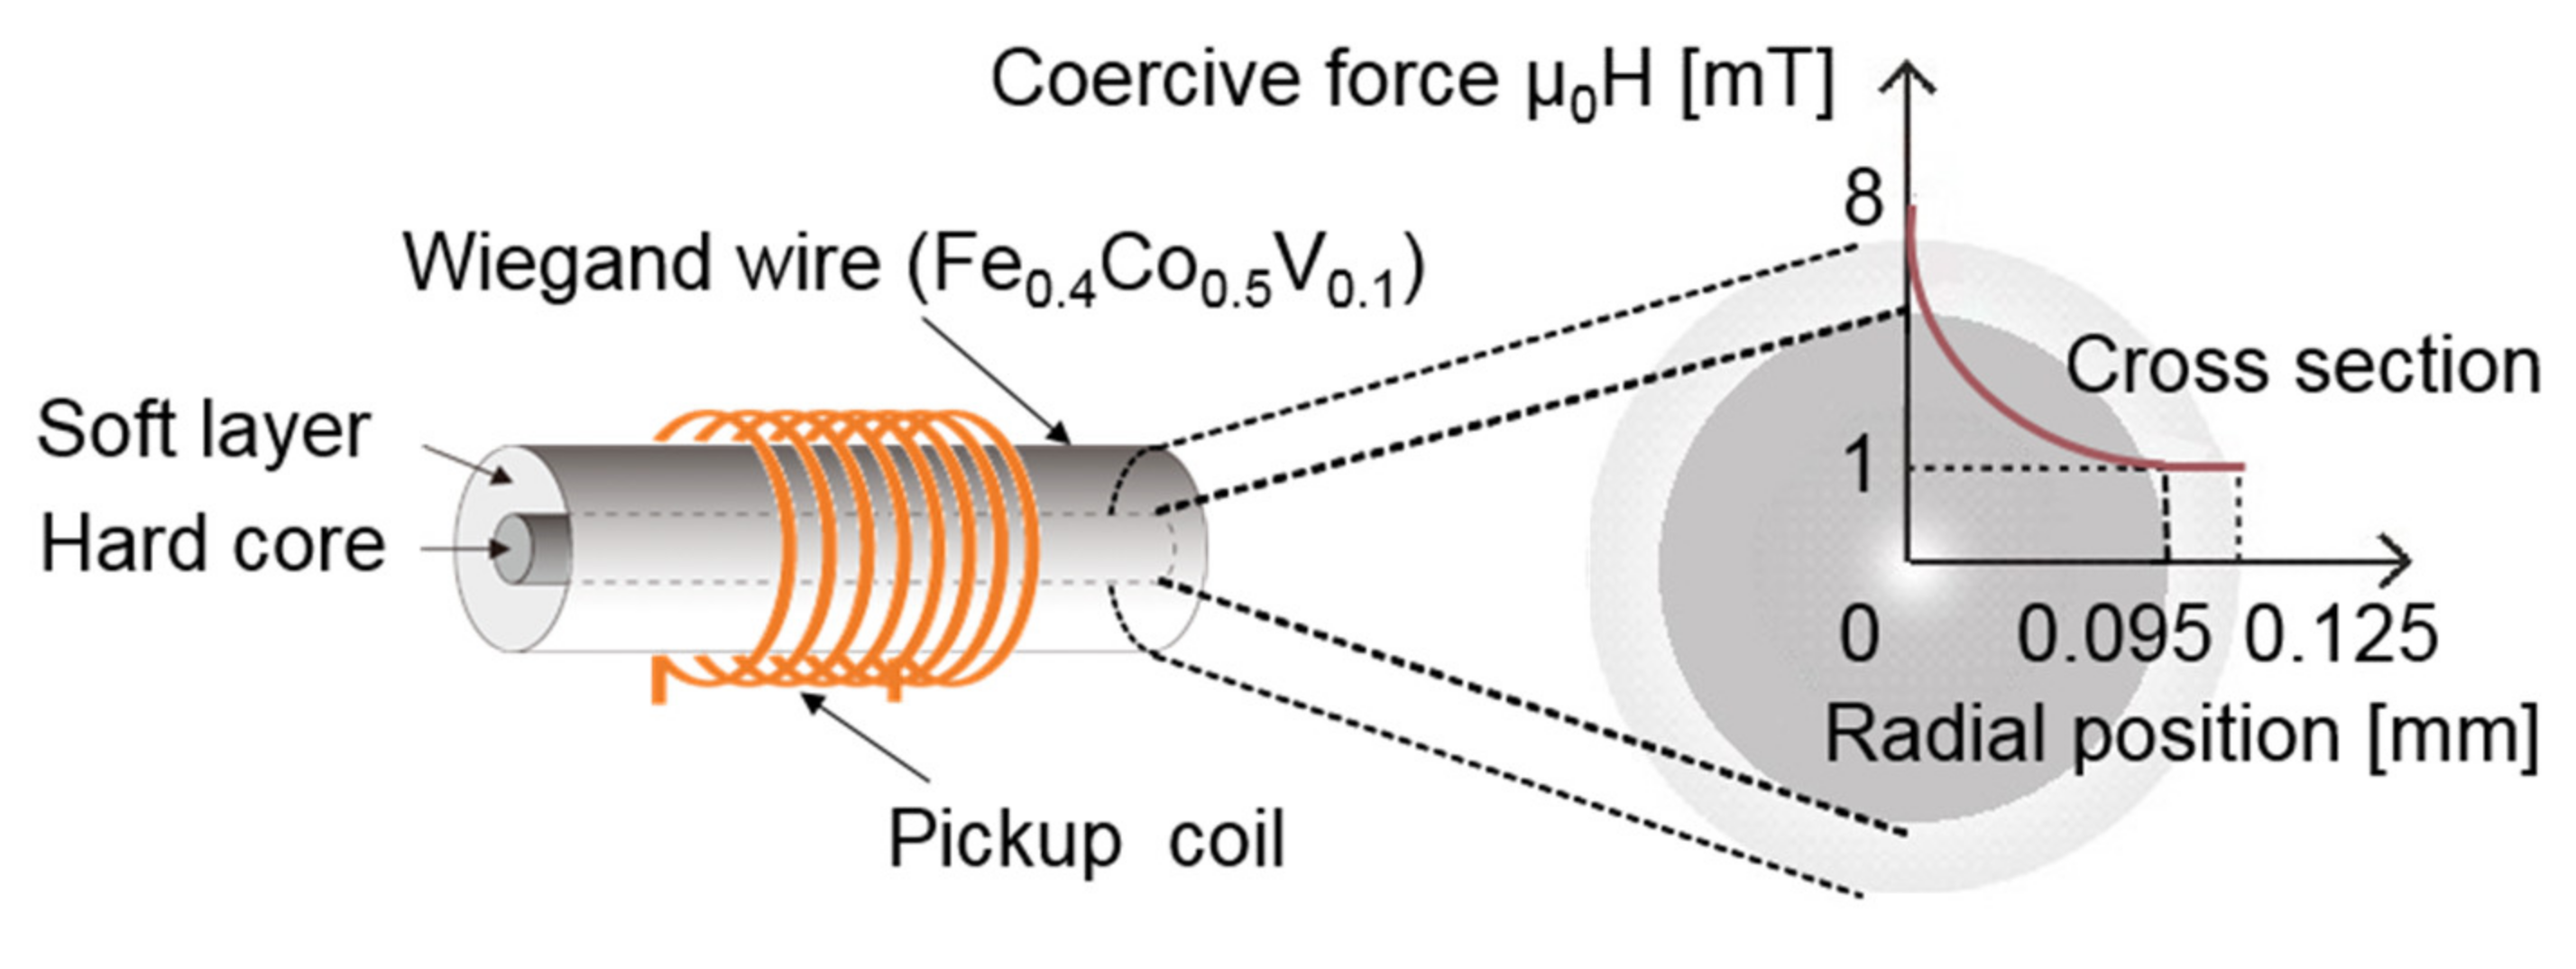
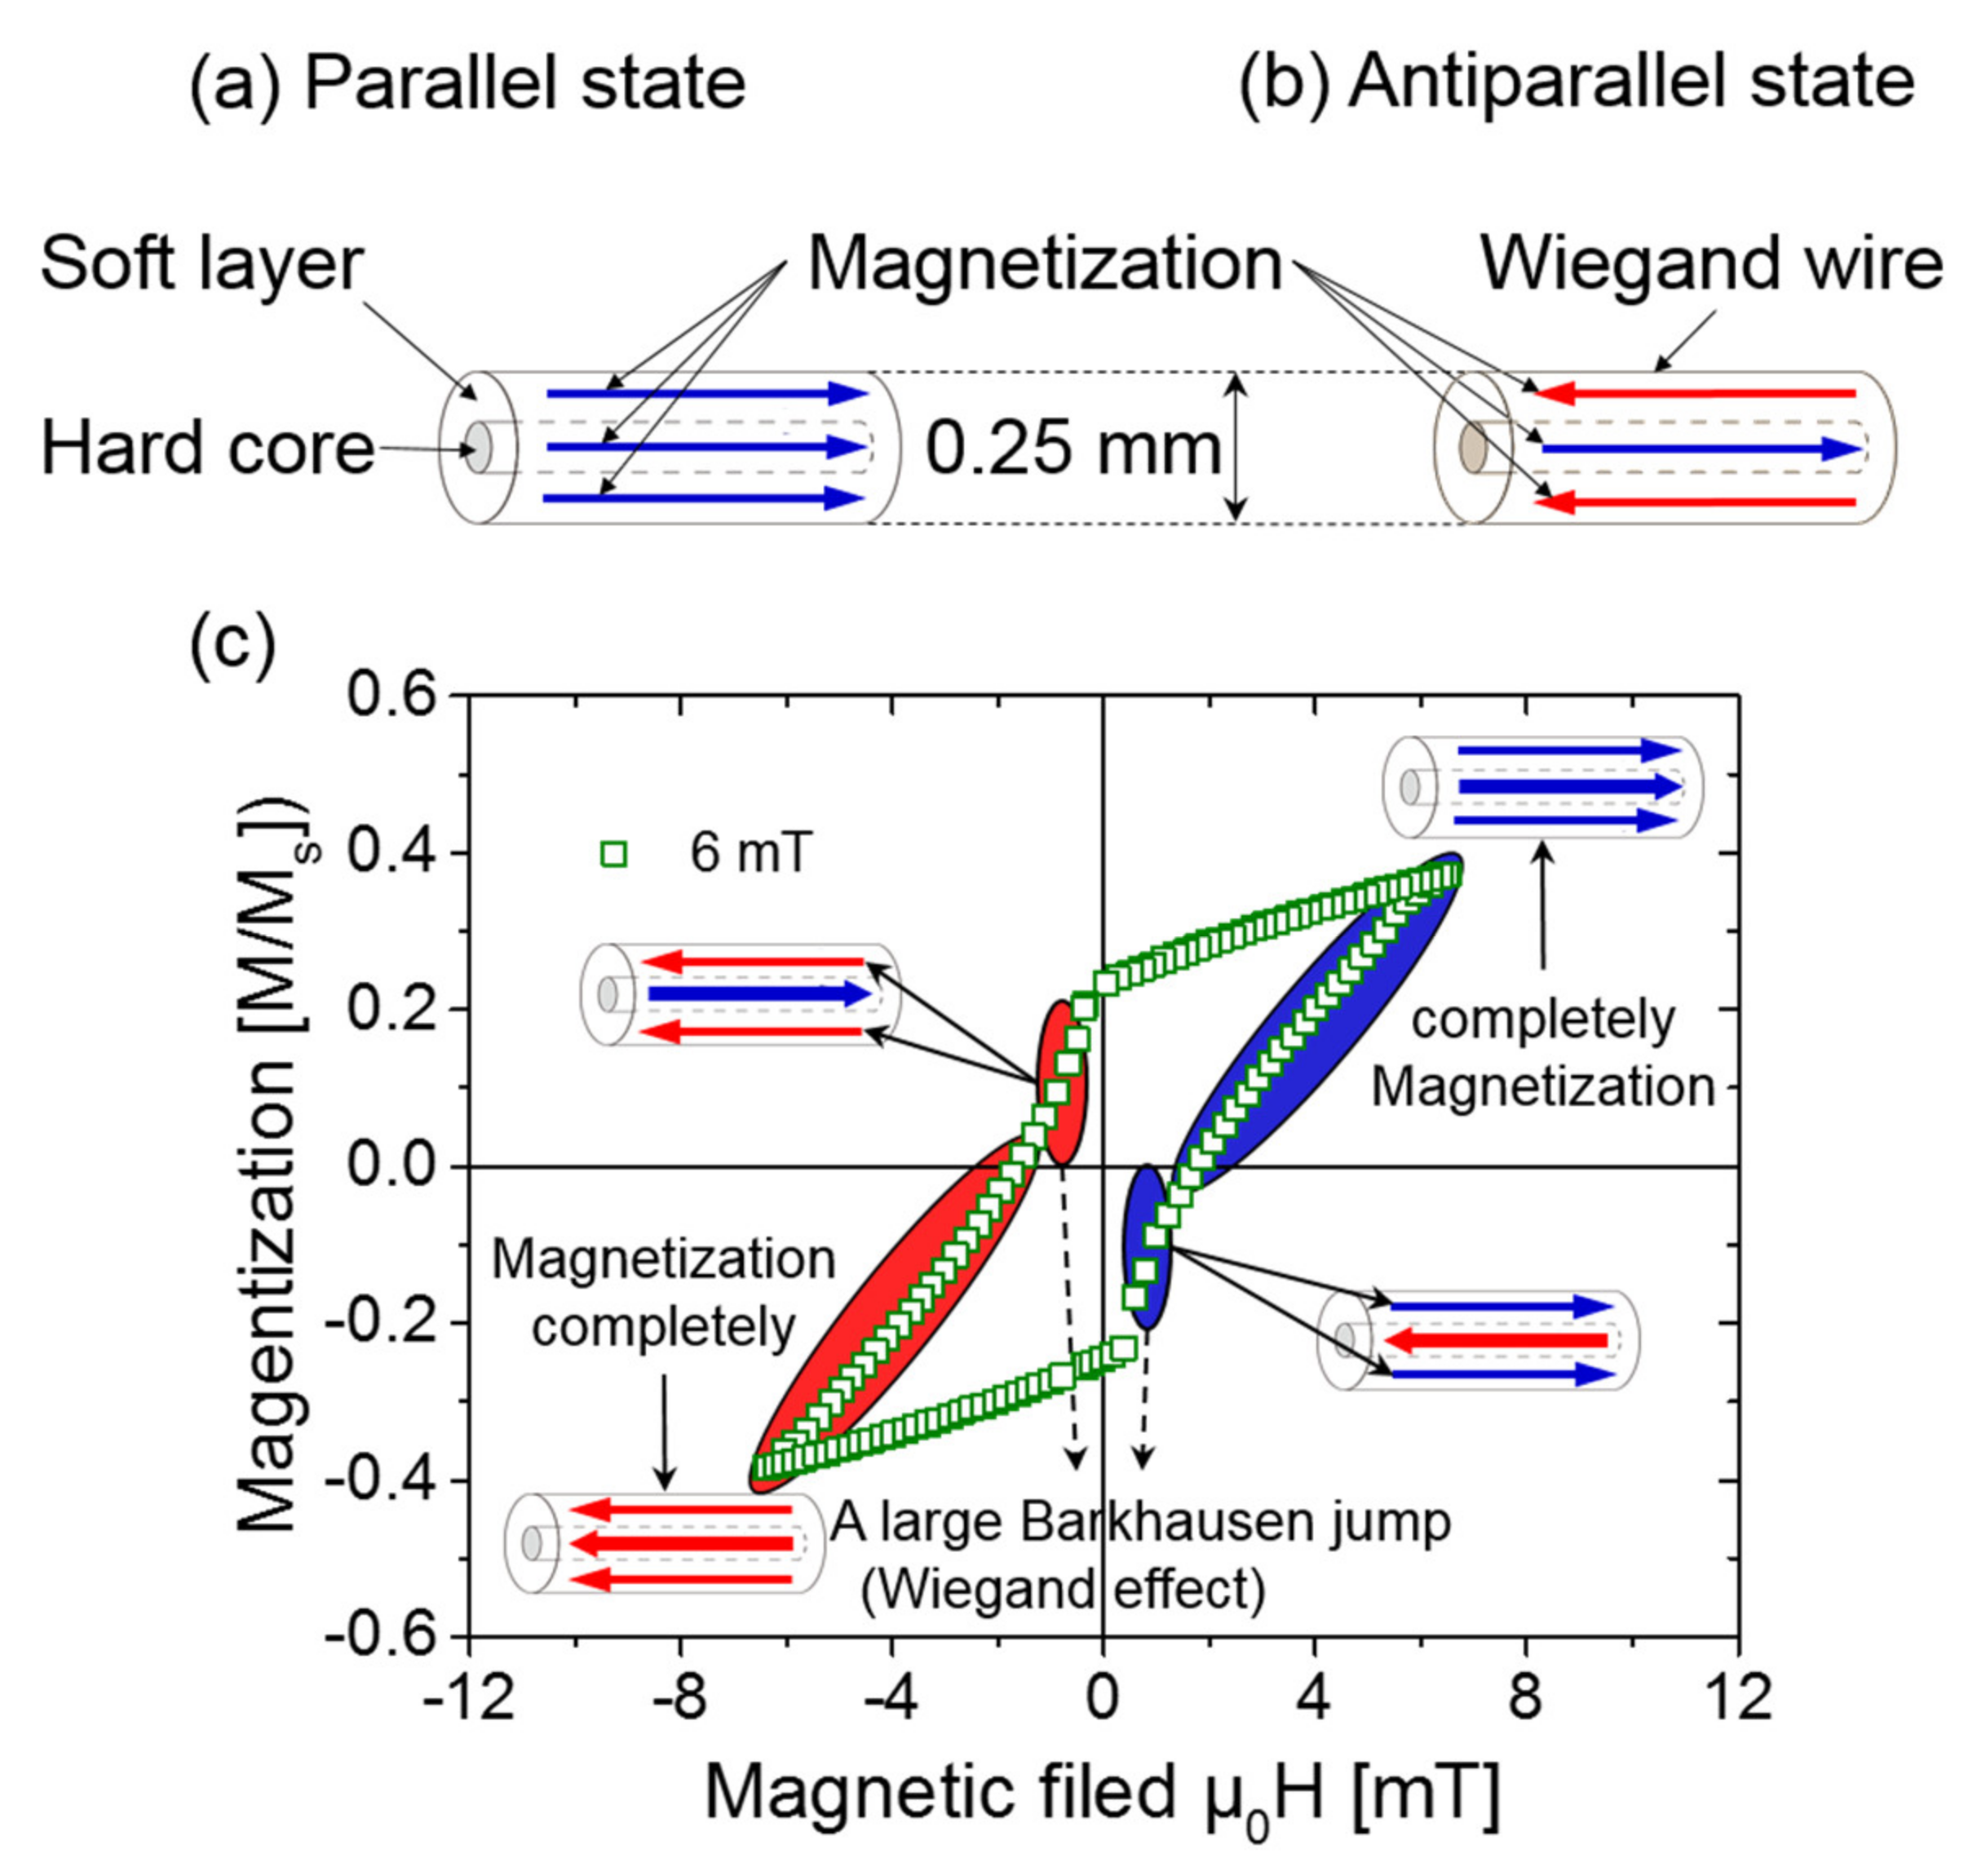
2.1. Wiegand Effect
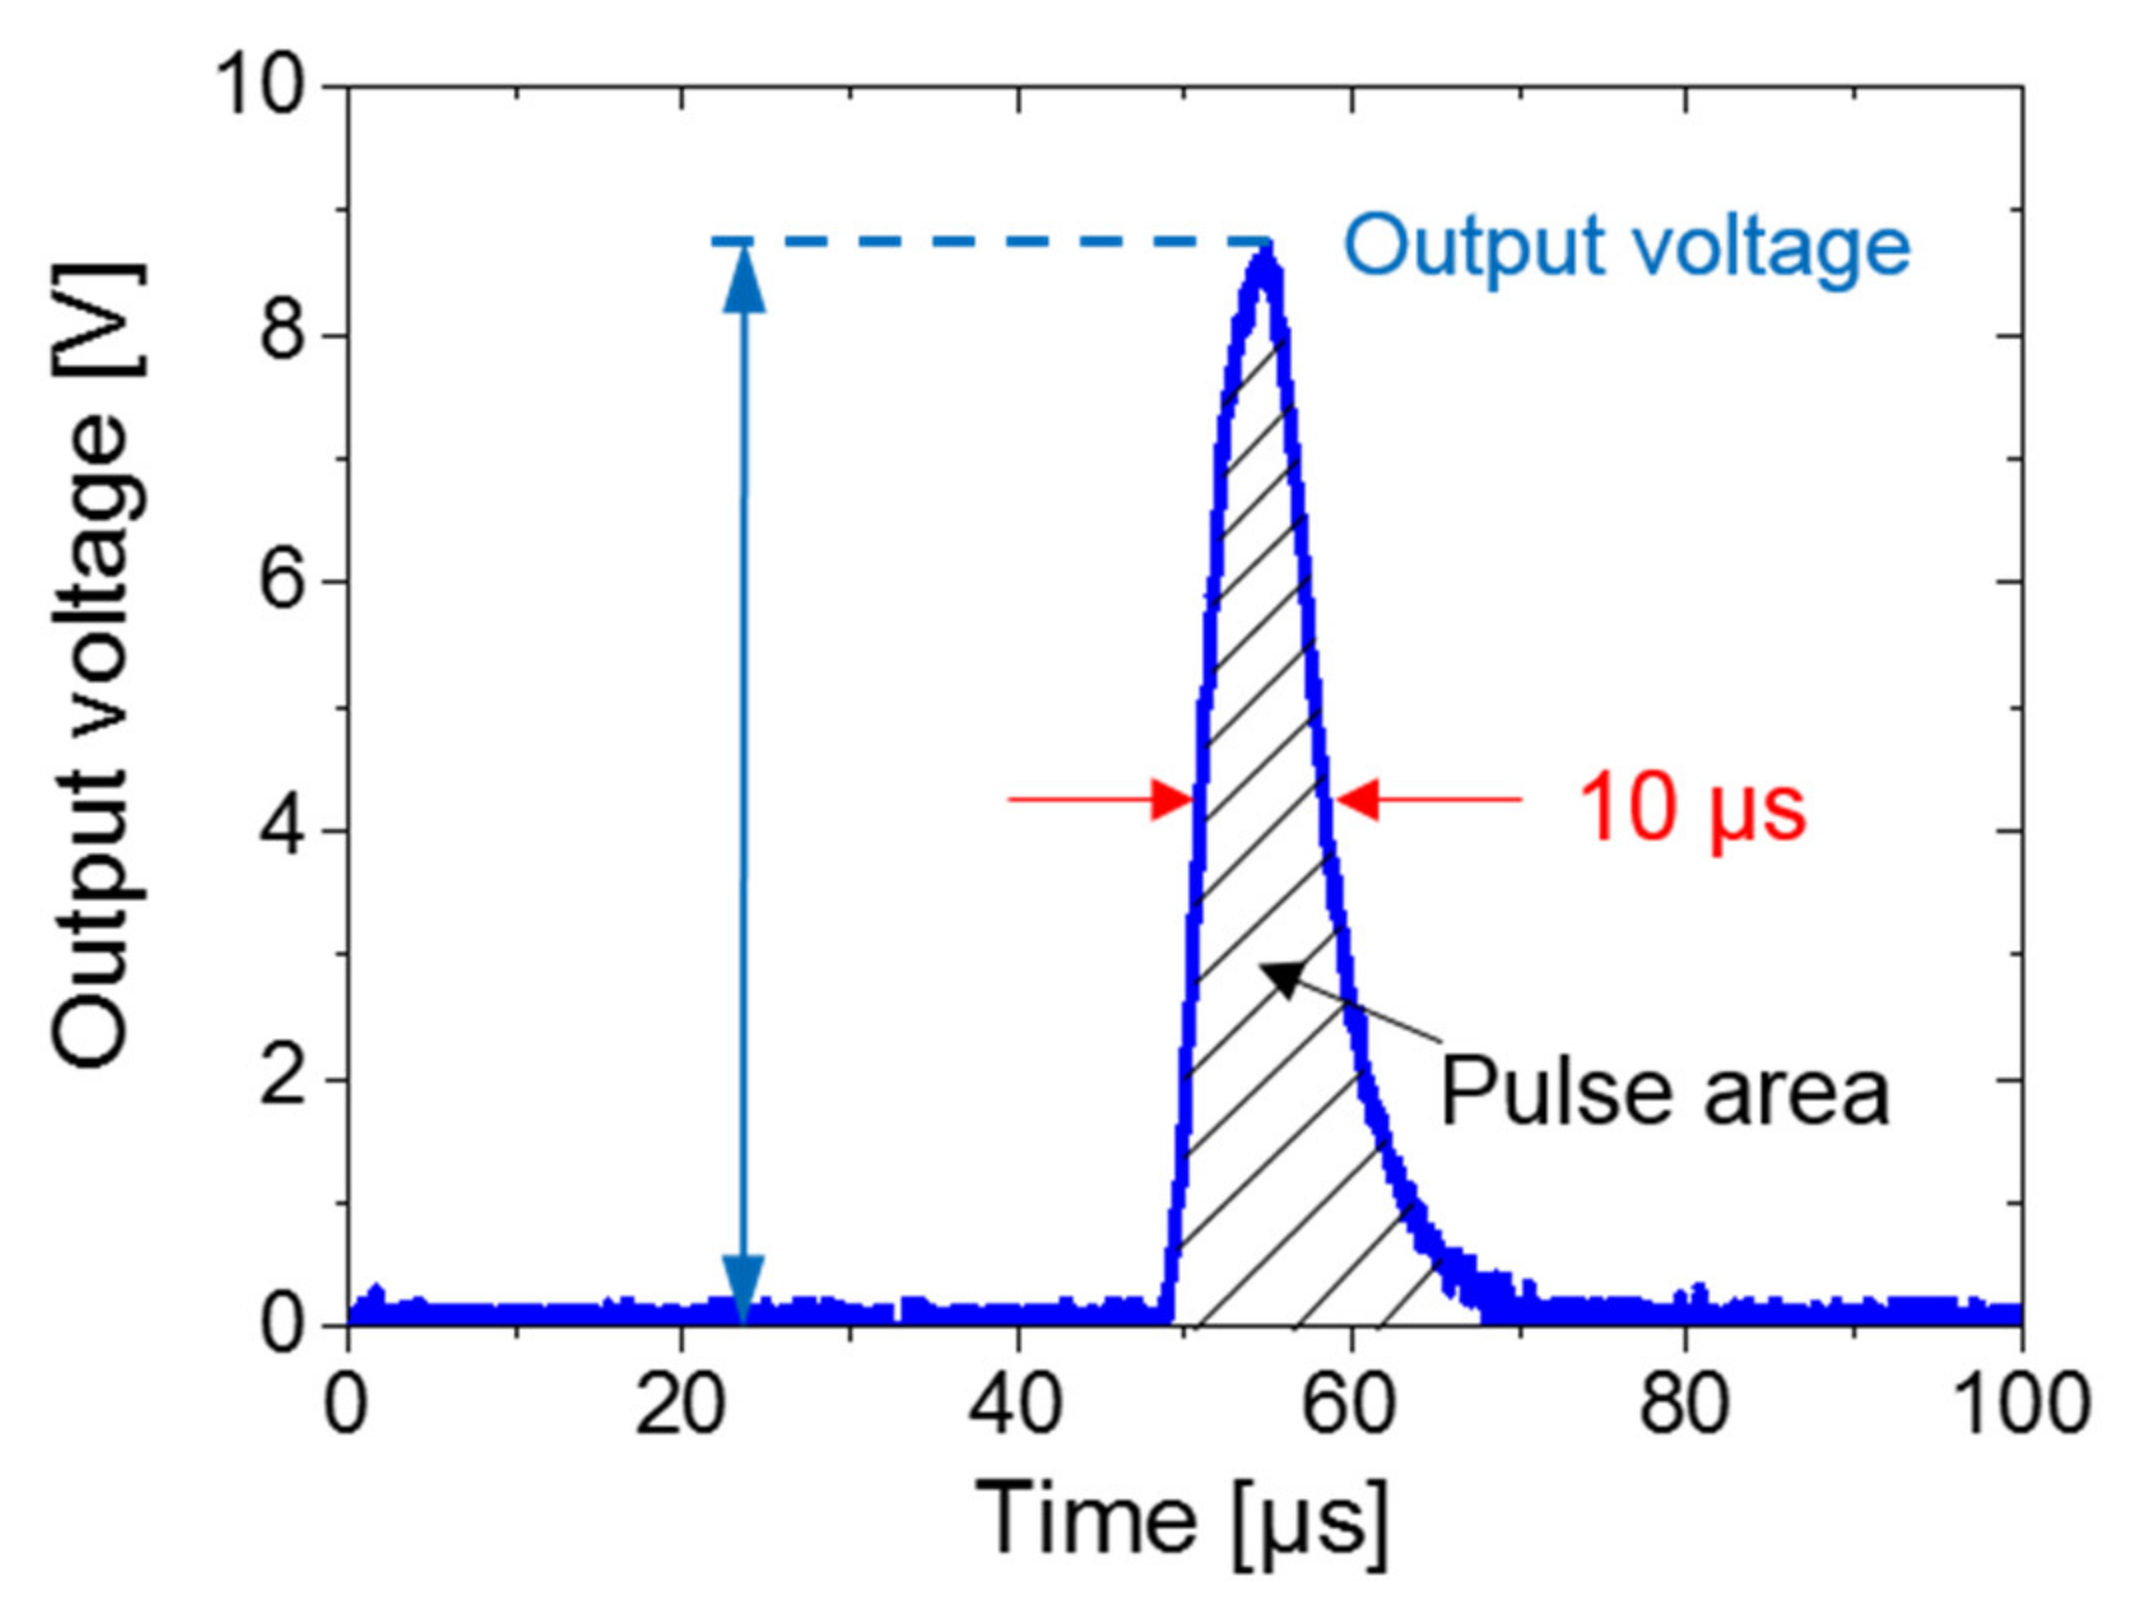
2.2. Wiegand Pulse and Its Energy
3. Methods
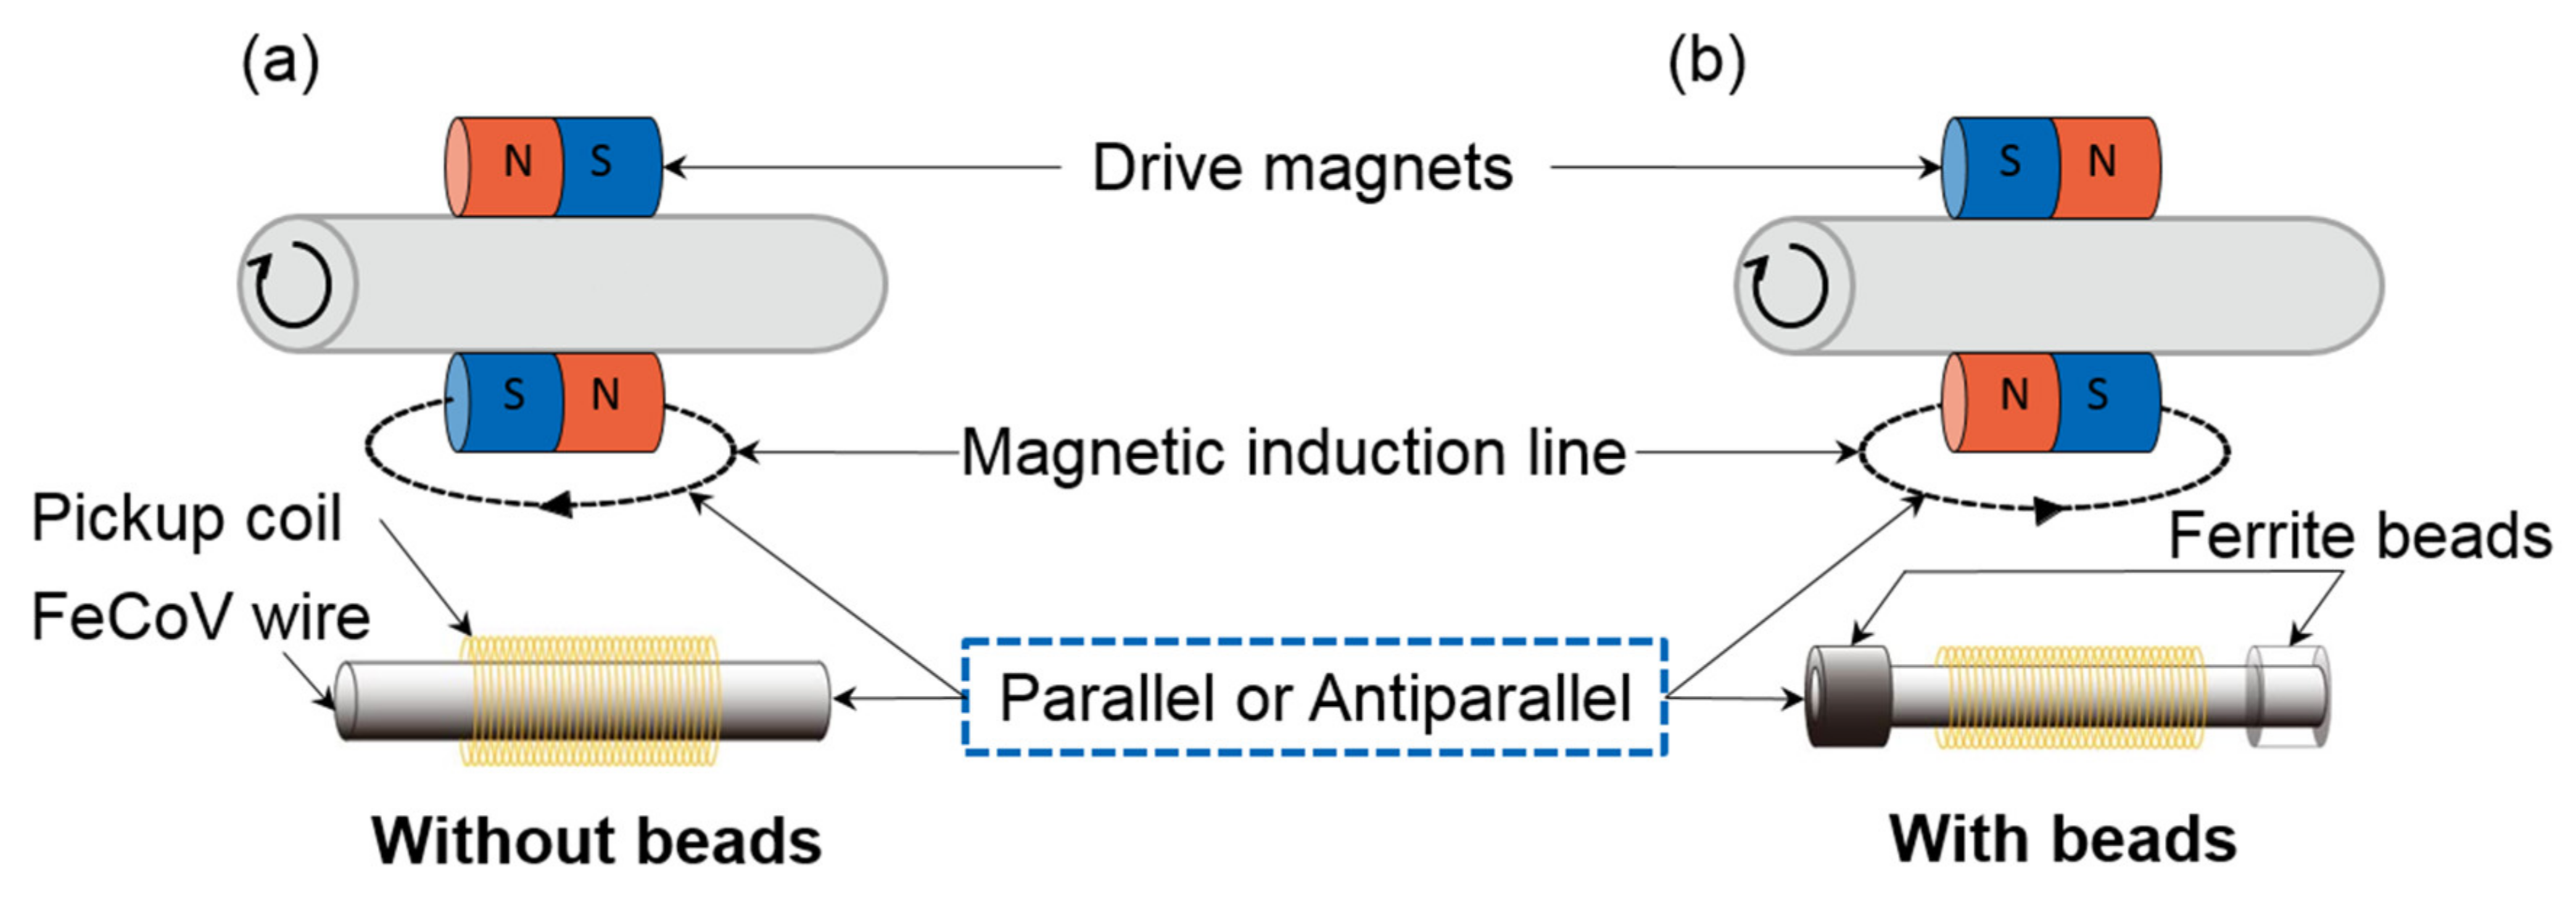
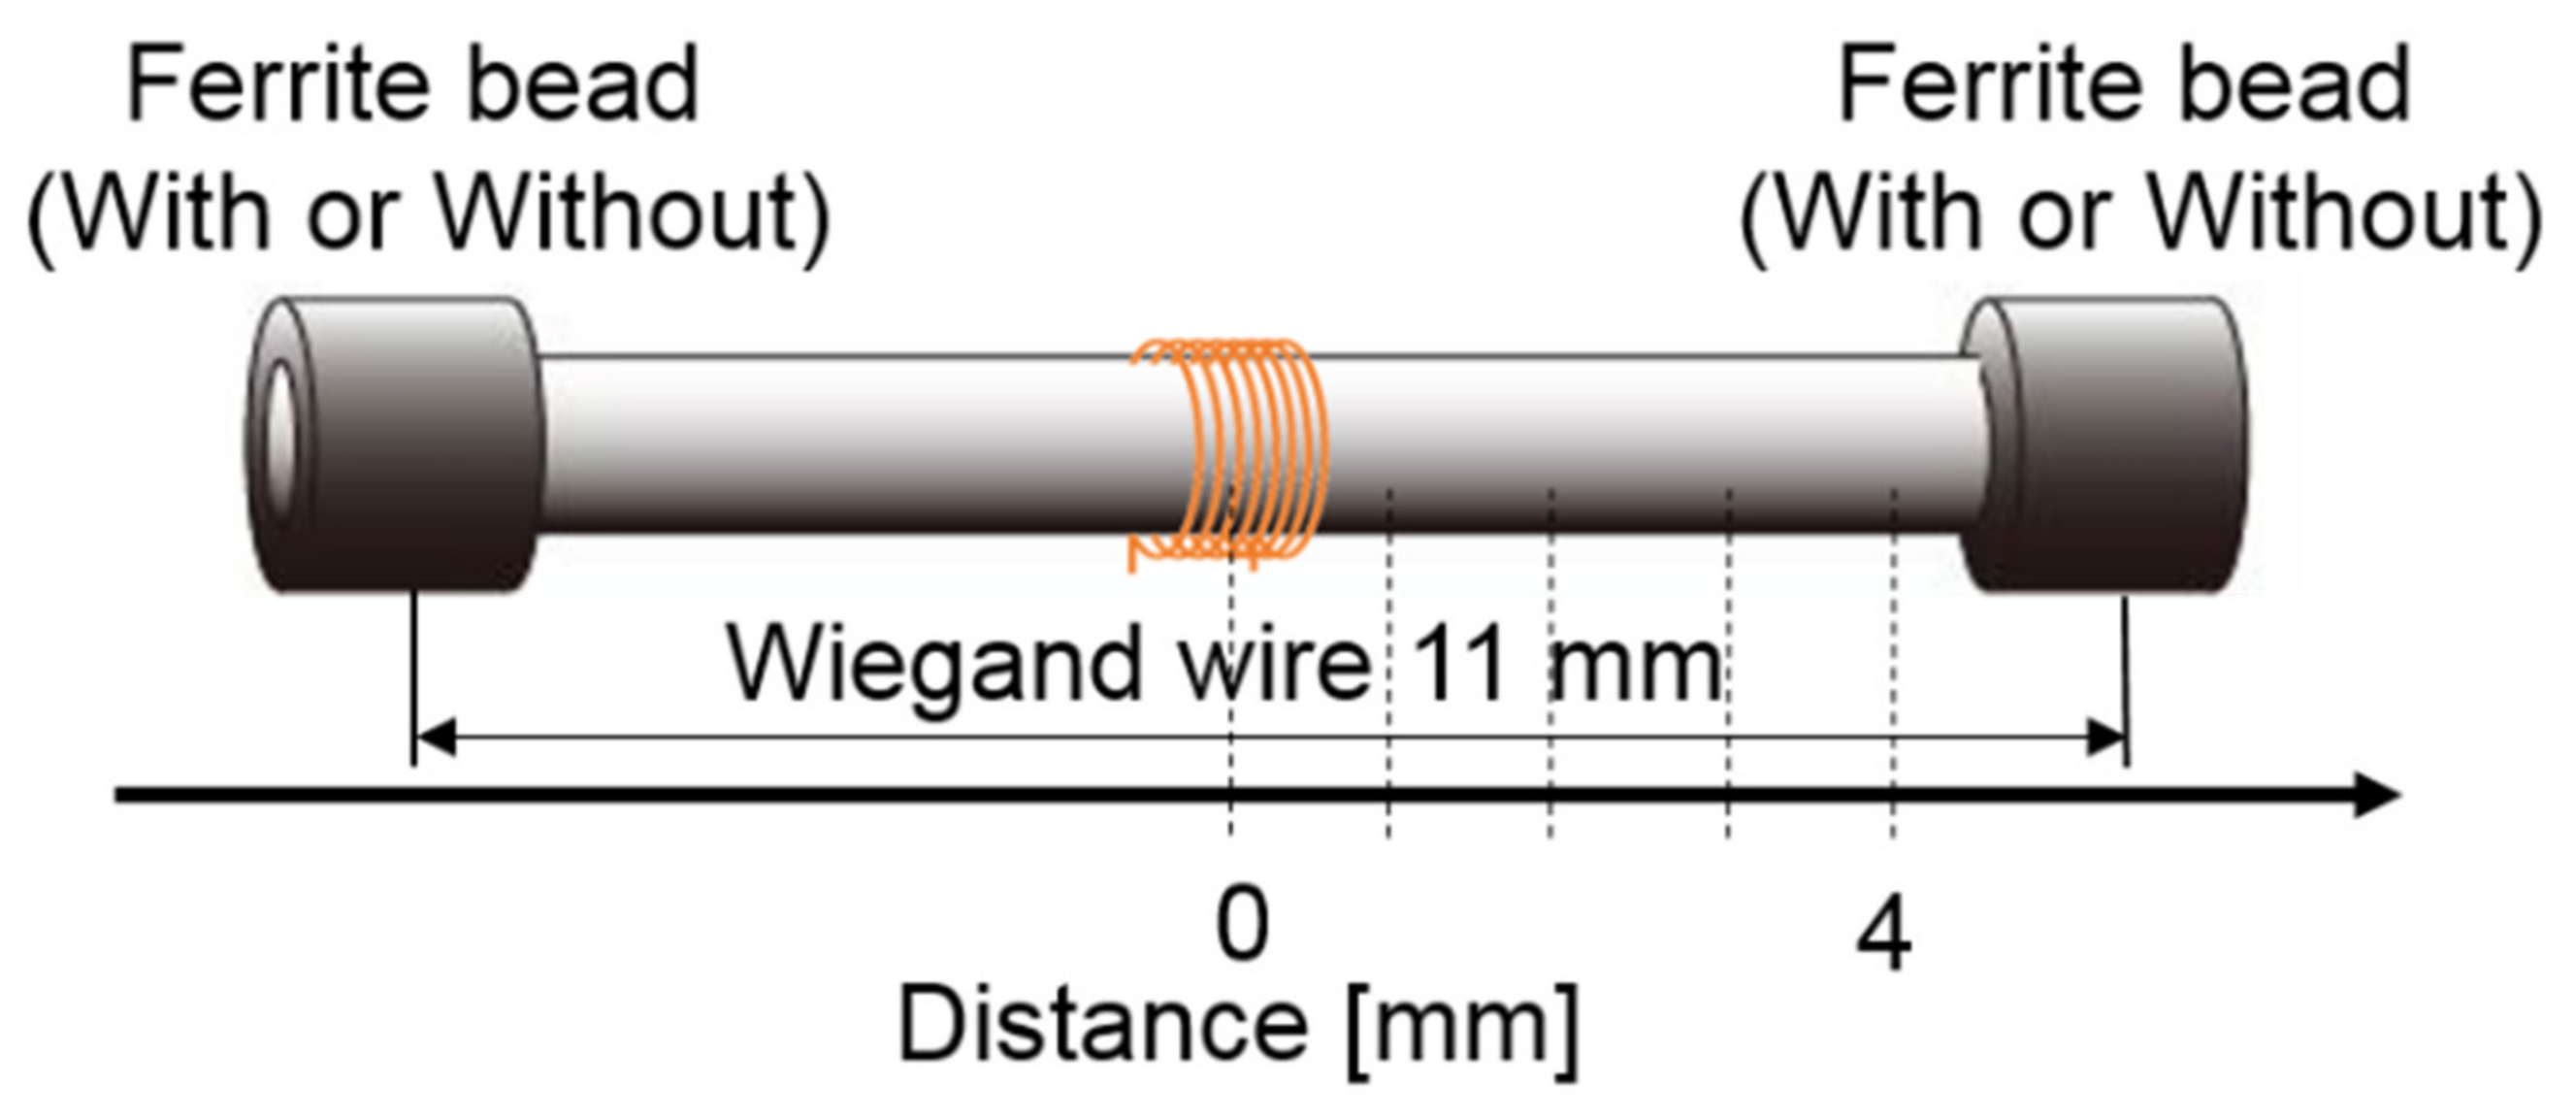
3.1. Enhance the Magnetic Flux
3.2. Change the Position of the Pickup Coil
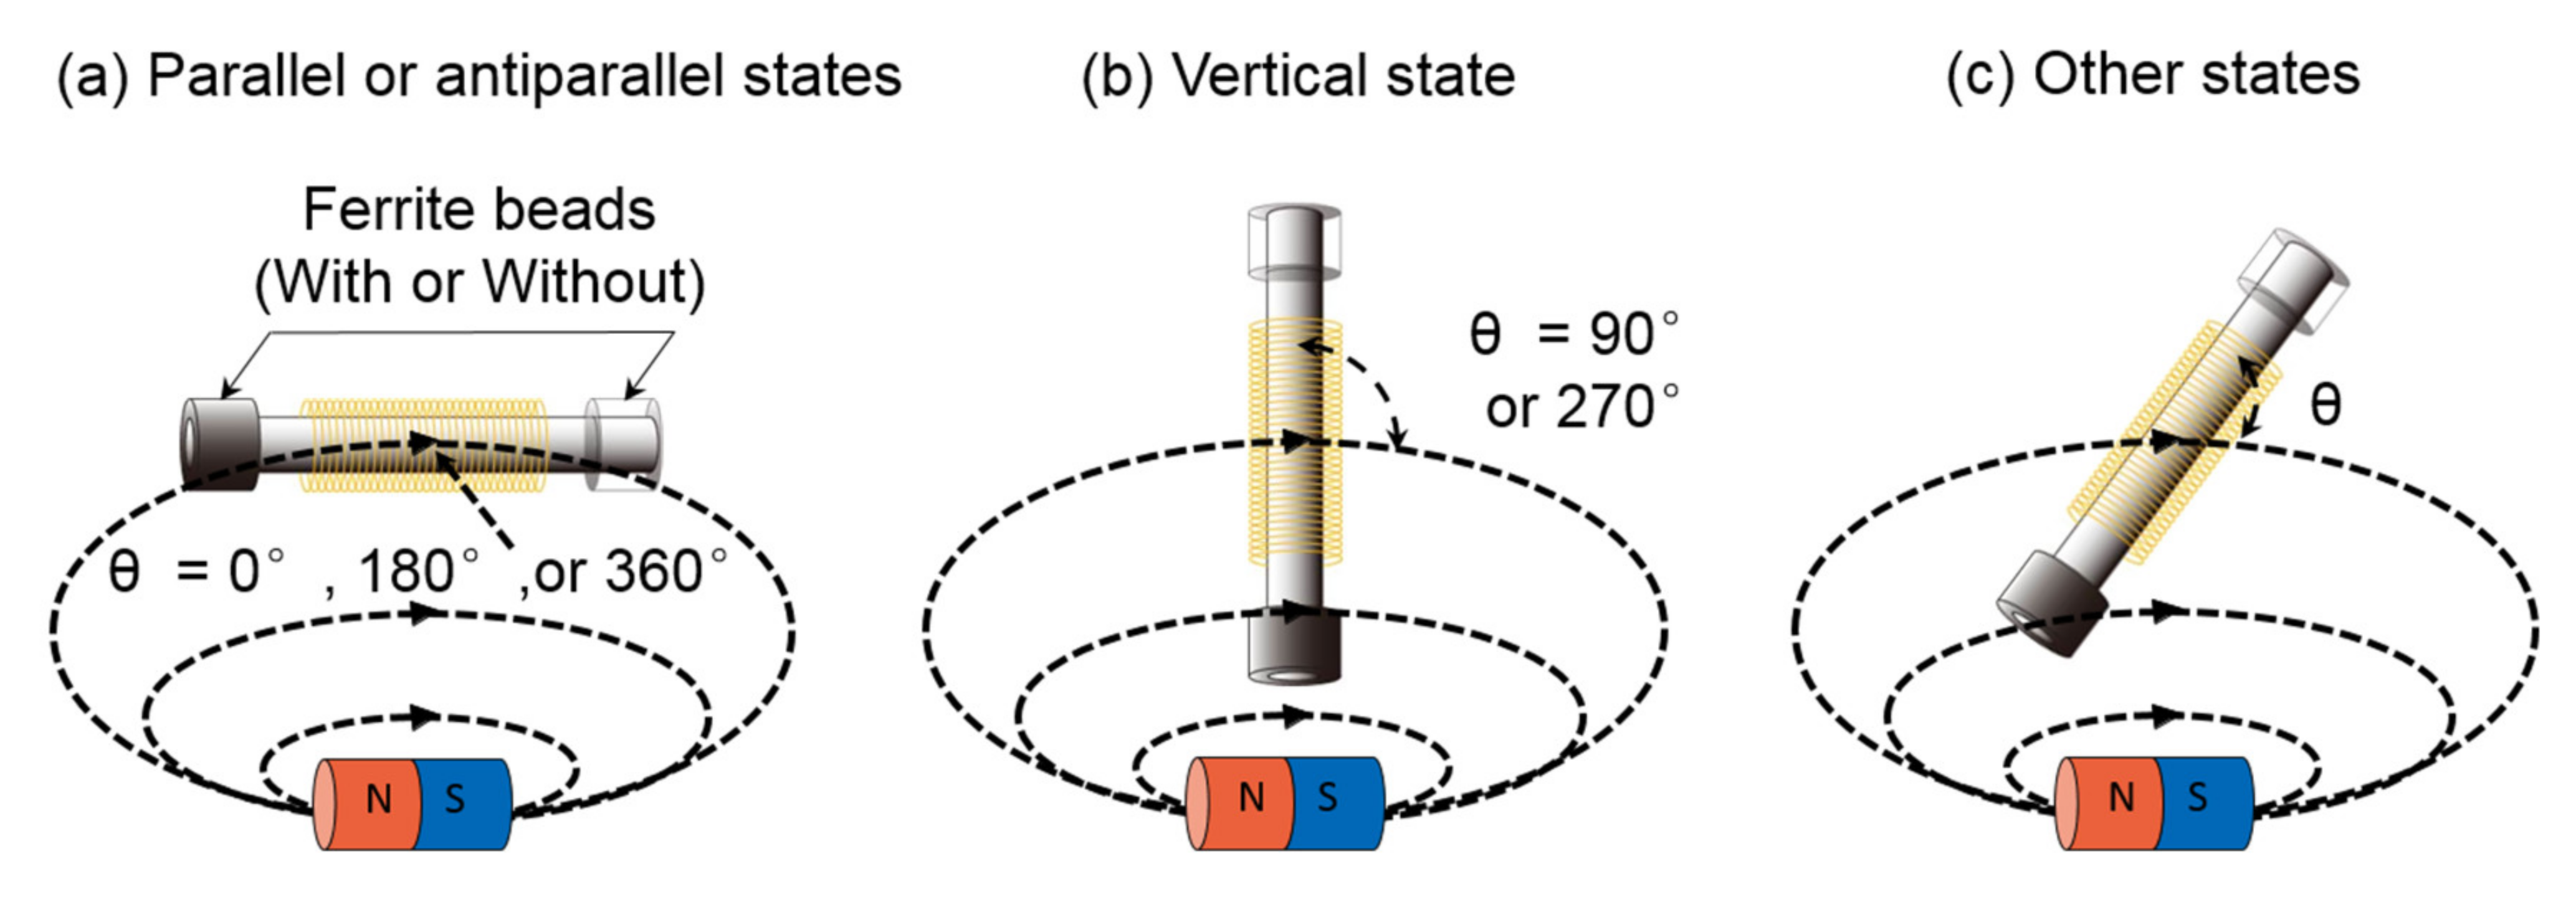
3.3. Adjust the Angle of the Sensor in the Magnetic Field
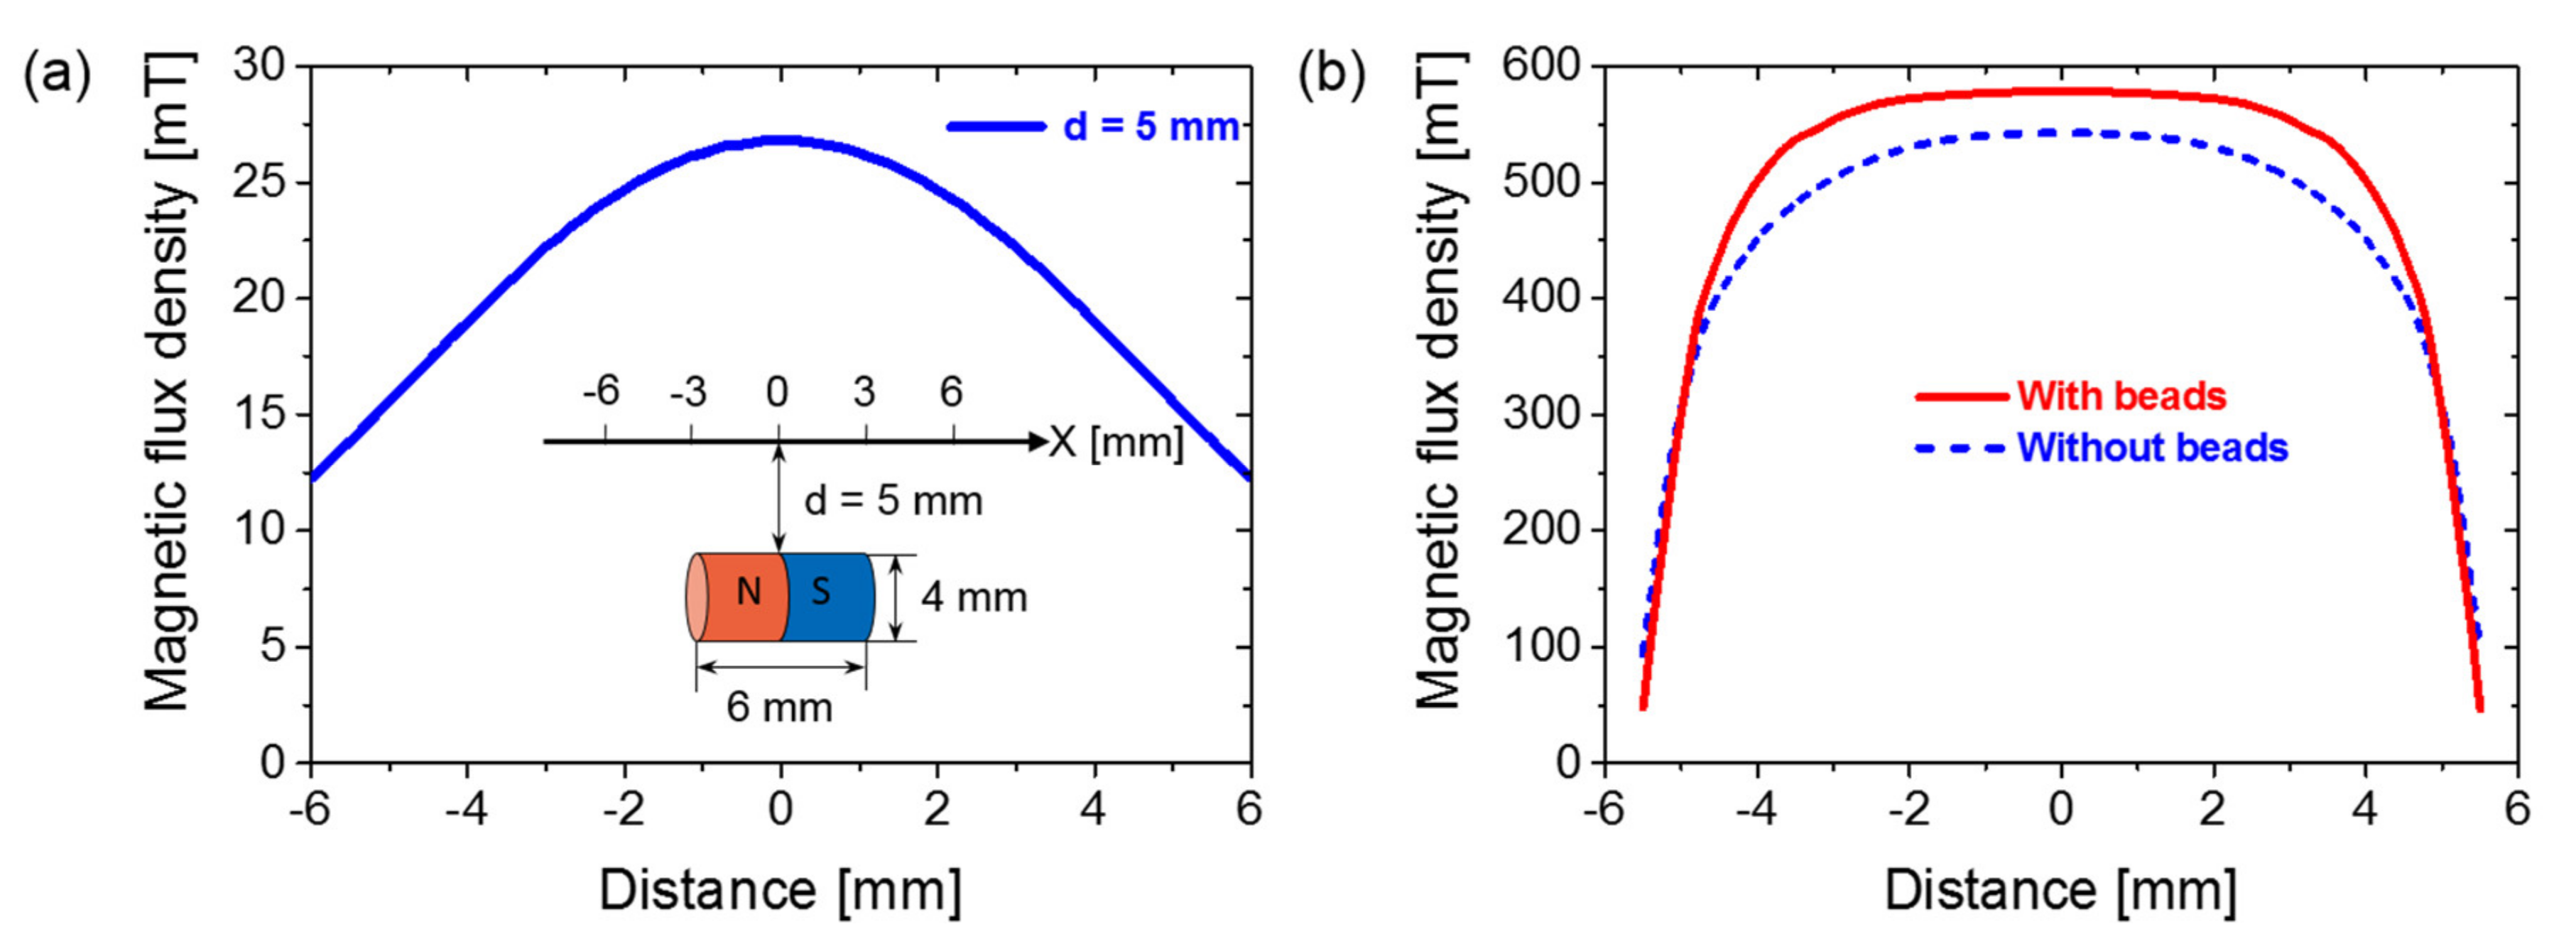
3.4. Simulate the Distribution of the Magnetic Field
4. Results and Discussion
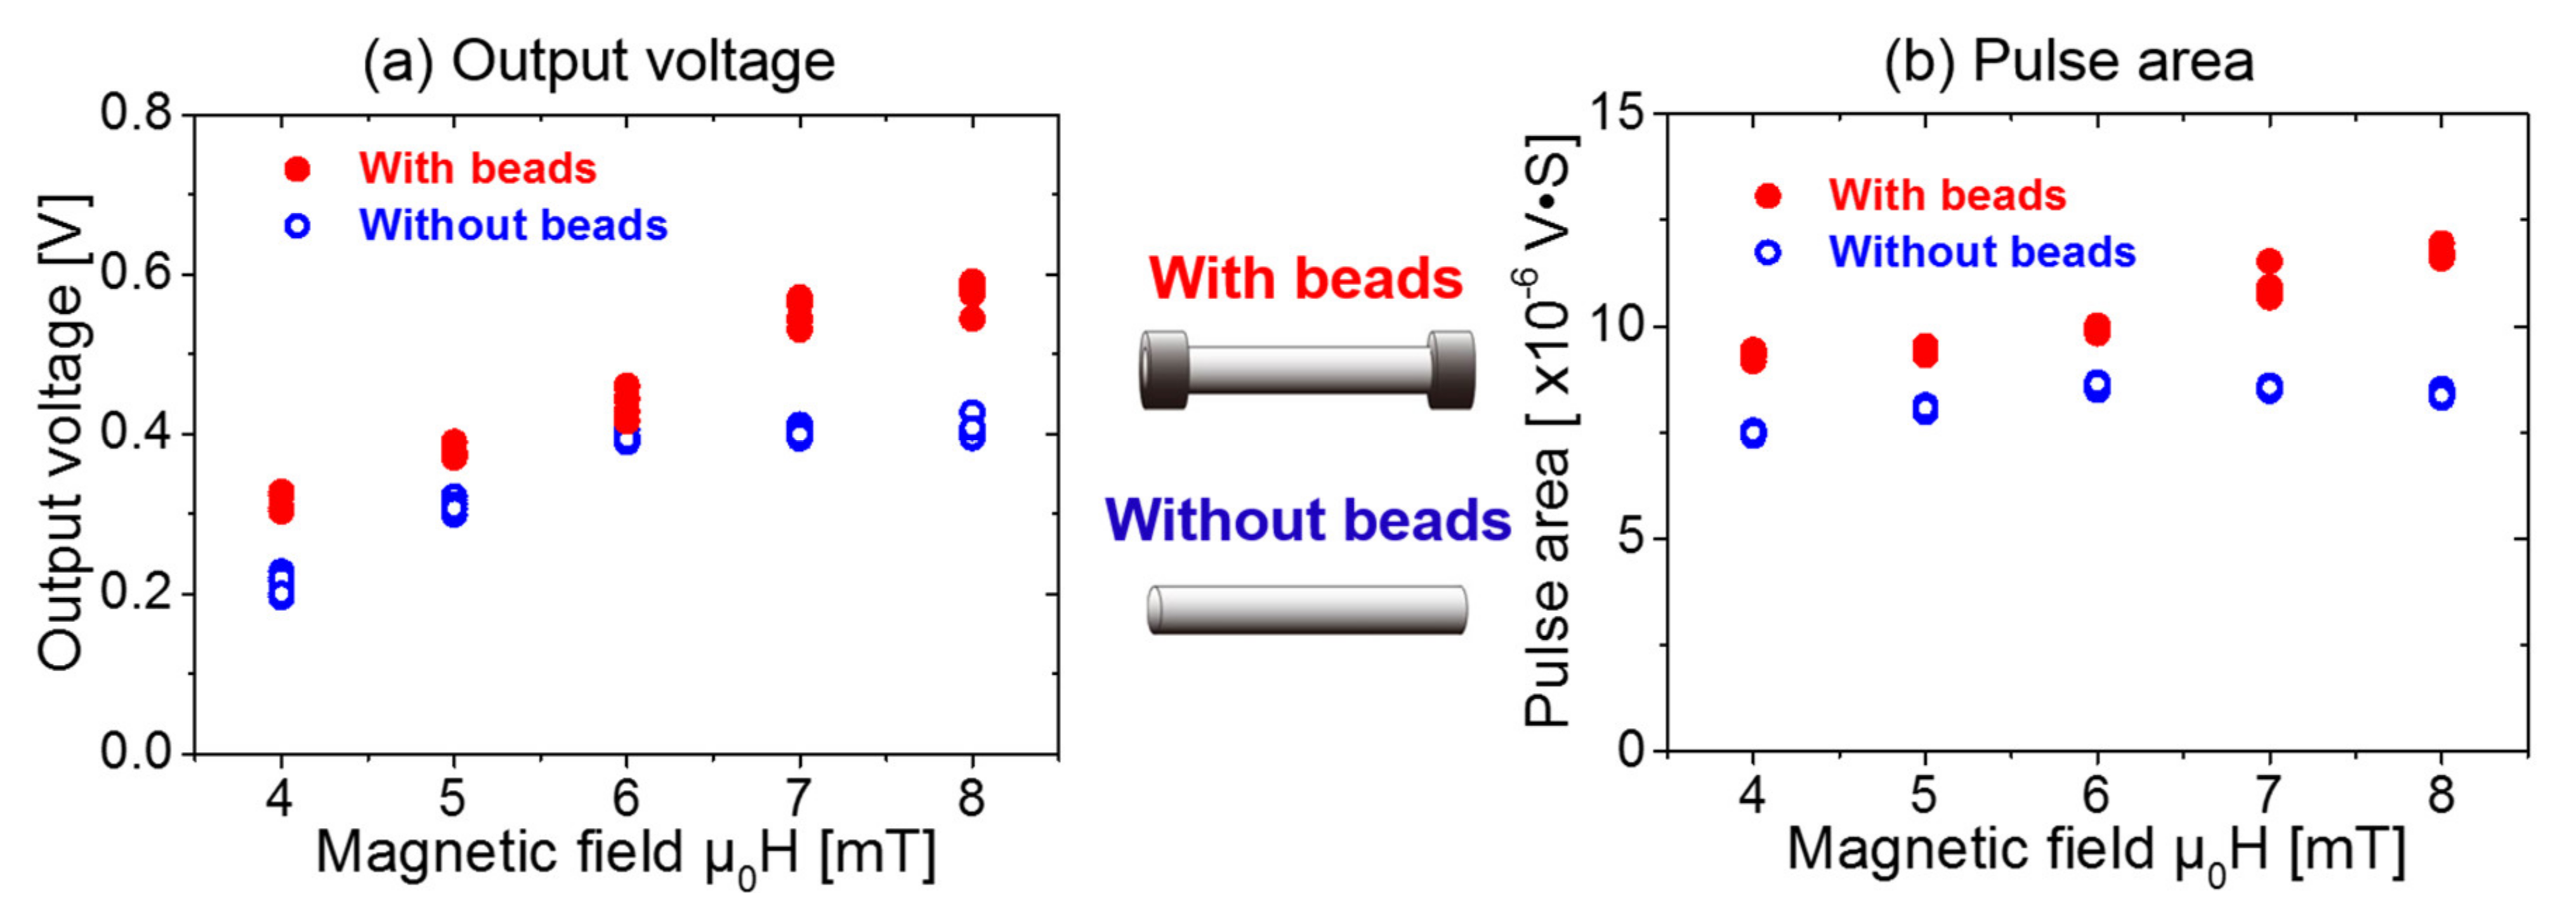
4.1. Relationship between Magnetic Flux and Energy
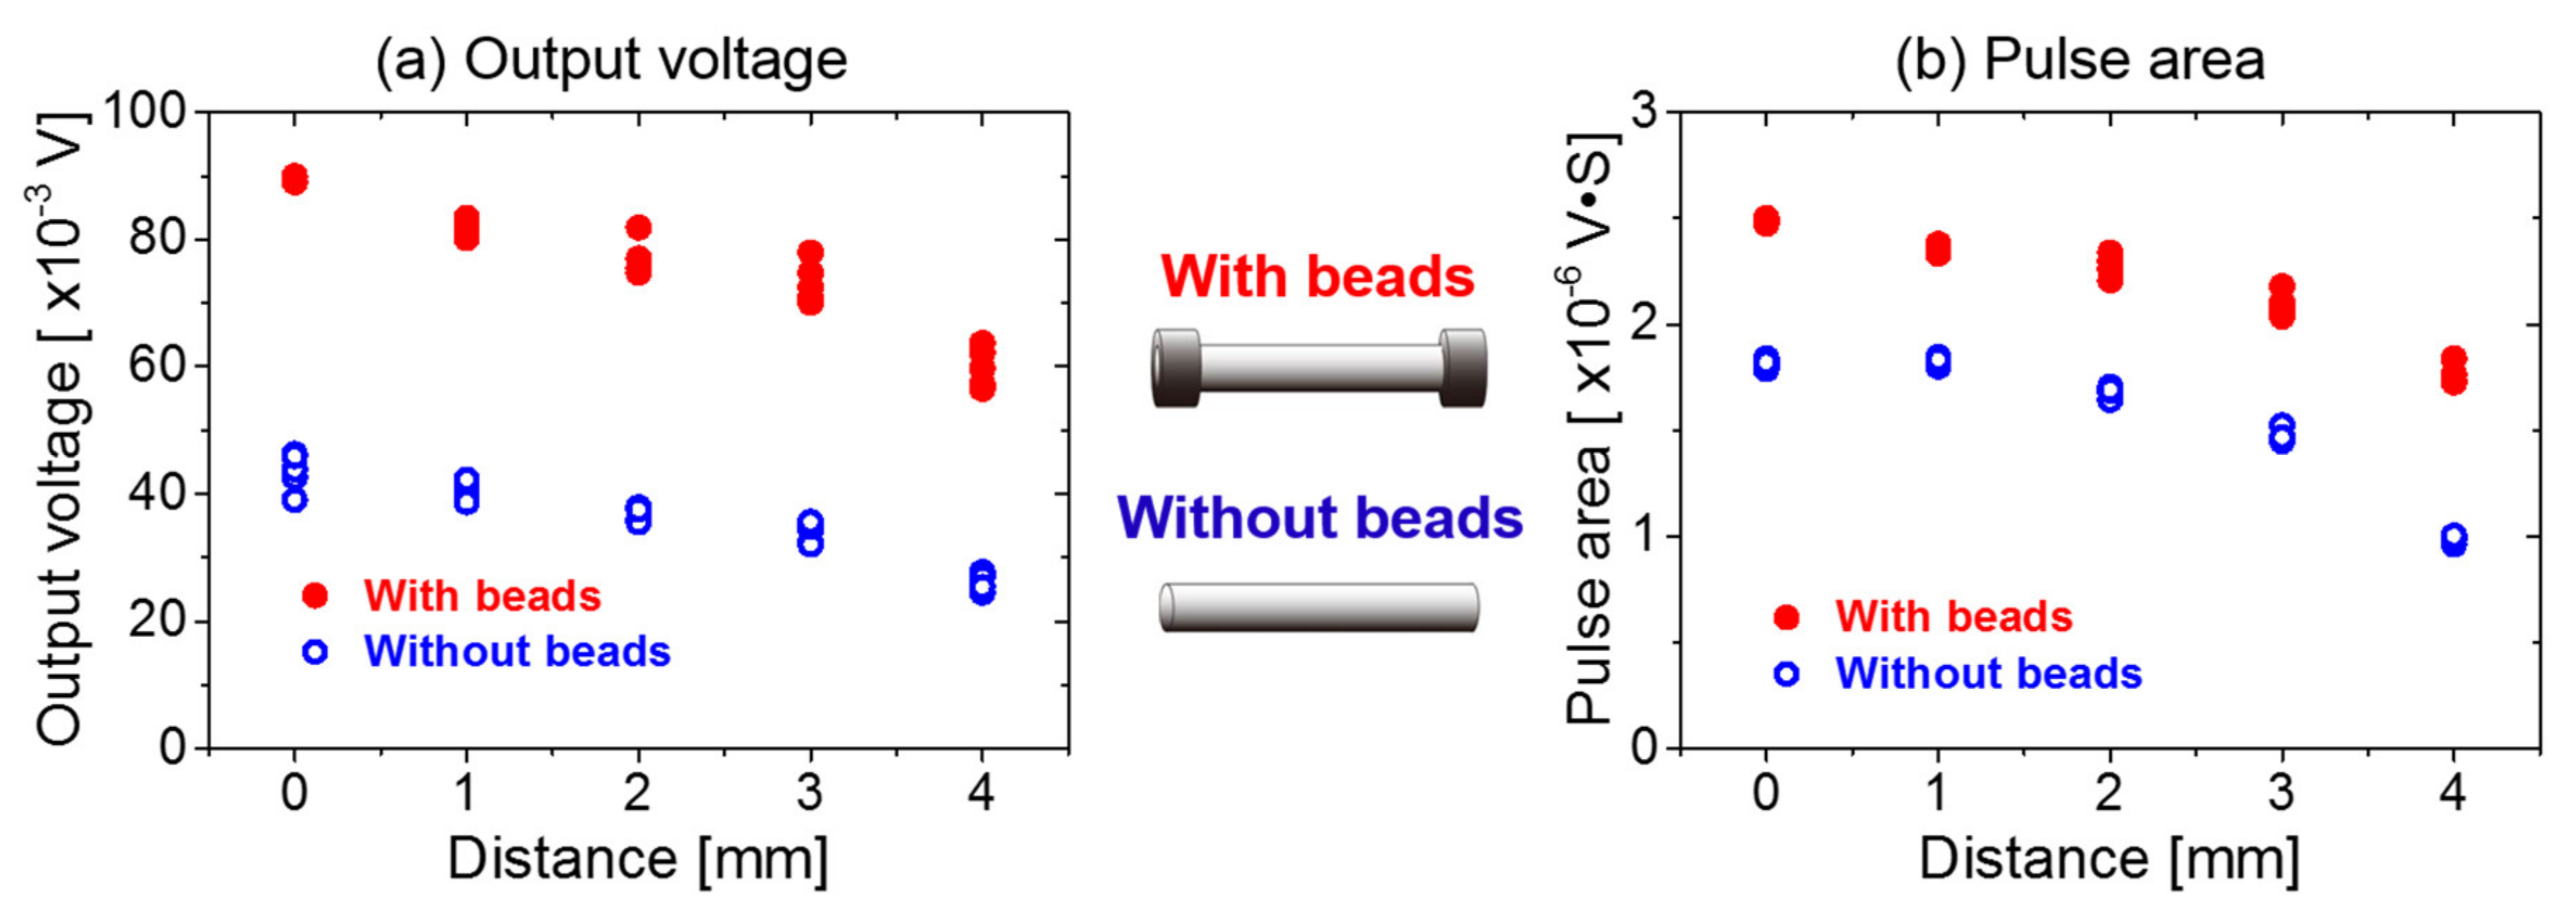
4.2. Relationship between the Position of the Pickup Coil and Energy
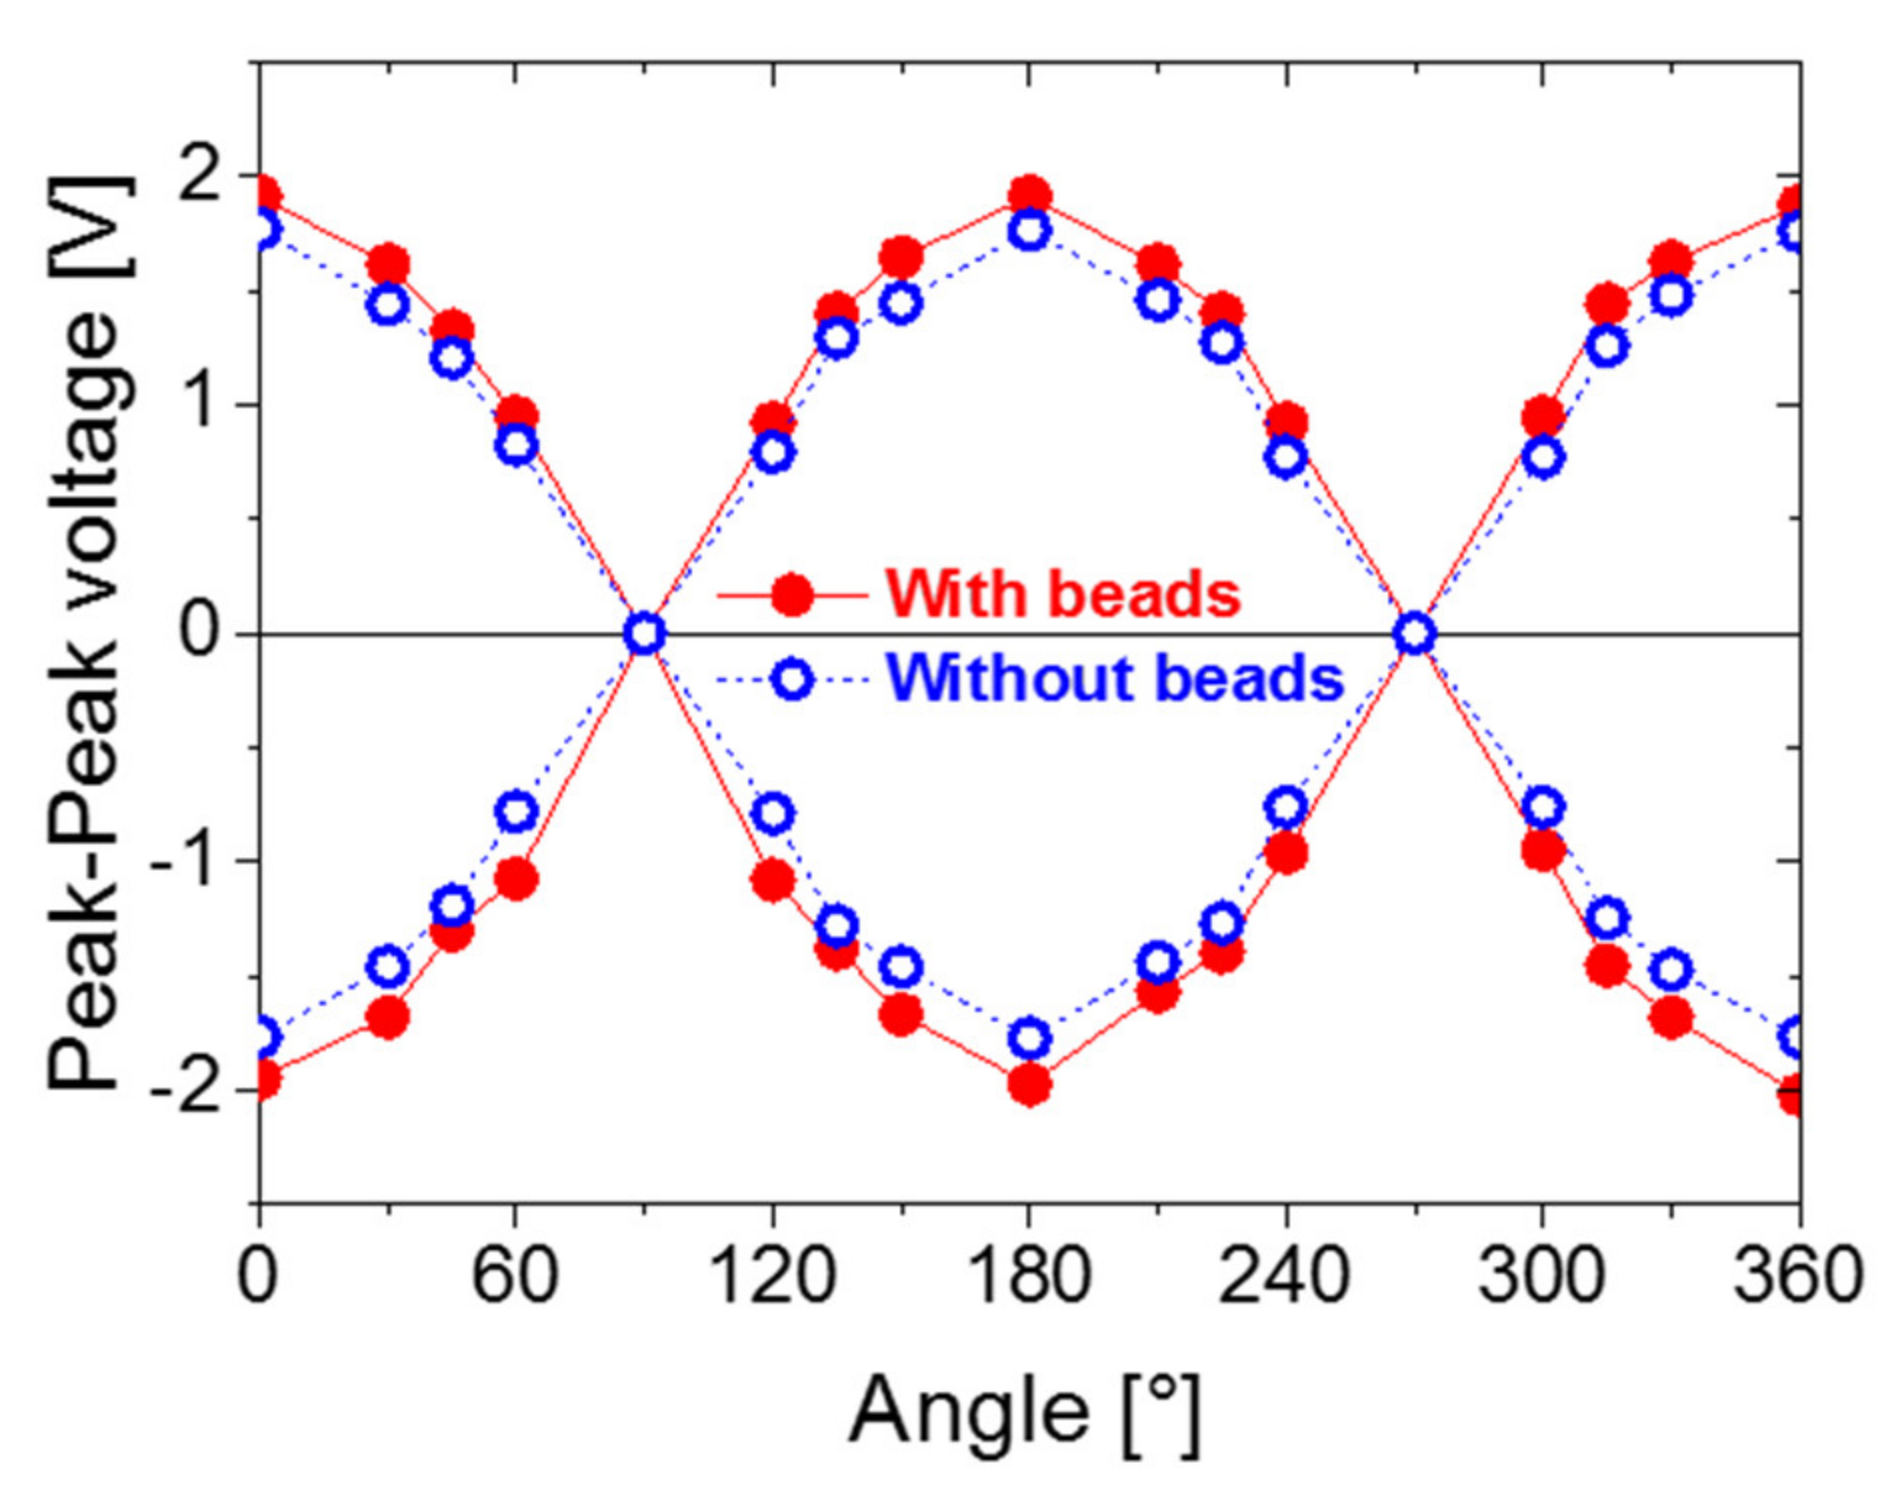
4.3. Relationship between the Angle and Energy
5. Conclusions
Author Contributions
Funding
Conflicts of Interest
References
- Jan, B.; Farman, H.; Khan, M.; Talha, M.; Din, I.U. Designing a smart transportation system: An Internet of things and big data approach. IEEE Wirel. Commun. 2019, 26, 73–79. [Google Scholar] [CrossRef]
- Bazzani, M.; Conzon, D.; Scalera, A.; Spirito, M.; Trainito, C. Enabling the IoT paradigm in e-health solutions through the VIRTUS middleware. In Proceedings of the IEEE 11th International Conference on Trust Security and Privacy in Computing and Communications, Liverpool, UK, 25–27 June 2012; pp. 1954–1959. [Google Scholar]
- Takemura, Y.; Fujiyama, N.; Takebuchi, A.; Yamada, T. Battery-less hall sensor operated by energy harvesting from a single Wiegand pulse. IEEE Trans. Magn. 2017, 53, 4002706. [Google Scholar] [CrossRef] [Green Version]
- Wiegand, J.R.; Velinsky, M. Bistable Magnetic Device. U.S. Patent 3,820,090, 25 June 1974. [Google Scholar]
- Wiegand, J.R. Switchable Magnetic Device. U.S. Patent 4,247,601, 27 January 1981. [Google Scholar]
- Abe, S.; Matsushita, A.; Naoe, M. Annealing and torsion stress effect on magnetic anisotropy and magnetostriction of Vicalloy fine wire. IEEE Trans. Magn. 1997, 33, 3916–3918. [Google Scholar] [CrossRef]
- Takahashi, K.; Takebuchi, A.; Yamada, T.; Takemura, Y. Power supply for medical implants by Wiegand pulse generated from a magnetic wire. J. Magn. Soc. Jpn. 2018, 42, 49–54. [Google Scholar] [CrossRef] [Green Version]
- Takemura, Y.; Aoki, T.; Tanaka, H.; Yamada, T.; Abe, S.; Kohno, S.; Nakamura, H. Control of demagnetizing field and magneto static coupling in FeCoV wires for zero-speed sensor. IEEE Trans. Magn. 2006, 42, 3300–3302. [Google Scholar] [CrossRef]
- Takahashi, K.; Yamada, T.; Takemura, Y. Circuit parameters of a receiver coil using a Wiegand sensor for wireless power transmission. Sensors 2019, 19, 2710. [Google Scholar] [CrossRef] [Green Version]
- Serizawa, R.; Yamada, T.; Masuda, S.; Abe, S.; Kohno, S.; Kaneko, F.; Takemura, Y. Energy harvesting derived from magnetization reversal in FeCoV wire. In Proceedings of the IEEE Sensors, Taipei, Taiwan, 28–31 October 2012. [Google Scholar]
- Sun, X.; Yamada, T.; Takemura, Y. Output characteristics and circuit modeling of Wiegand sensor. Sensors 2019, 19, 2991. [Google Scholar] [CrossRef] [Green Version]
- Malmhall, R.; Mohri, K.; Humphrey, F.B.; Manabe, T.; Kawamura, H.; Yamasaki, J.; Ogasawara, I. Bistable magnetization reversal in 50 µm diameter annealed cold drawn amorphous wires. IEEE Trans. Magn. 1987, 23, 3242–3244. [Google Scholar] [CrossRef]
- Takebuchi, A.; Kameda, N.; Yamada, T.; Takemura, Y. Vibration-type energy harvesting element using a large Barkhausen jump in magnetic wires. In Proceedings of the Joint MMM-Intermag Conference, San Diego, CA, USA, 11–15 January 2016; p. 445. [Google Scholar]
- Tanaka, H.; Yamada, T.; Takemura, Y.; Abe, S.; Kohno, S.; Nakamura, H. Constant velocity of domain wall propagation independent of applied field strength in vicalloy wire. IEEE Trans. Magn. 2007, 43, 2397–2399. [Google Scholar] [CrossRef]
- Saggini, S.; Ongaro, F.; Corradini, L.; Affanni, A. Low-power energy harvesting solutions for Wiegand transducers. IEEE J. Emerg. Sel. Topics Power Electron. 2015, 3, 766–779. [Google Scholar] [CrossRef]
- Takebuchi, A.; Yamada, T.; Takemura, Y. Reduction of vibration amplitude in vibration-type electricity generator using magnetic wire. J. Magn. Soc. Jpn. 2017, 41, 34–40. [Google Scholar] [CrossRef] [Green Version]
- Chang, C.-C.; Chang, J.-Y. Novel Wiegand effect-based energy harvesting device for linear positioning measurement system. In Proceedings of the Asia-Pacific Magnetic Recording Conference (APMRC), Shanghai, China, 15–17 November 2018. [Google Scholar]
- Kohara, T.; Yamada, T.; Abe, S.; Kohno, S.; Kaneko, F.; Takemura, Y. Effective excitation by single magnet in rotation sensor and domain wall displacement of FeCoV wire. J. Appl. Phys. 2011, 109, 07E531. [Google Scholar] [CrossRef] [Green Version]
- Moure, A.; Izquierdo Rodríguez, M.A.; Hernández Rueda, S.; Gonzalo, A.; Rubio-Marcos, F.; Urquiza Cuadros, D.; Pérez-Lepe, A.; Fernández, J.F. Feasible integration in asphalt of piezoelectric cymbals for vibration energy harvesting. Energy Convers. Manag. 2016, 112, 246–253. [Google Scholar] [CrossRef]
- Ostasevicius, V.; Markevicius, V.; Jurenas, V.; Zilys, M.; Cepenas, M.; Kizauskiene, L.; Kizauskiene, L. Cutting tool vibration energy harvesting for wireless sensors applications. Sens. Actuators A Phys. 2015, 233, 310–318. [Google Scholar] [CrossRef] [Green Version]


© 2020 by the authors. Licensee MDPI, Basel, Switzerland. This article is an open access article distributed under the terms and conditions of the Creative Commons Attribution (CC BY) license (http://creativecommons.org/licenses/by/4.0/).
Share and Cite
Yang, C.; Sakai, T.; Yamada, T.; Song, Z.; Takemura, Y. Improvement of Pulse Voltage Generated by Wiegand Sensor Through Magnetic-Flux Guidance. Sensors 2020, 20, 1408. https://doi.org/10.3390/s20051408
Yang C, Sakai T, Yamada T, Song Z, Takemura Y. Improvement of Pulse Voltage Generated by Wiegand Sensor Through Magnetic-Flux Guidance. Sensors. 2020; 20(5):1408. https://doi.org/10.3390/s20051408
Chicago/Turabian StyleYang, Chao, Takafumi Sakai, Tsutomu Yamada, Zenglu Song, and Yasushi Takemura. 2020. "Improvement of Pulse Voltage Generated by Wiegand Sensor Through Magnetic-Flux Guidance" Sensors 20, no. 5: 1408. https://doi.org/10.3390/s20051408