Optimal Design Methodology of Tapered Waveguide Transducers for Thickness Monitoring

Abstract
:1. Introduction
2. Propagation Characteristics of SH0* Wave Propagation in Tapered Waveguide Units
2.1. Feasibility of SH0* Wave Propagation in Tapered Waveguide Units
2.2. Limitations of Tapered Waveguide Units for SH0* Mode Propagation
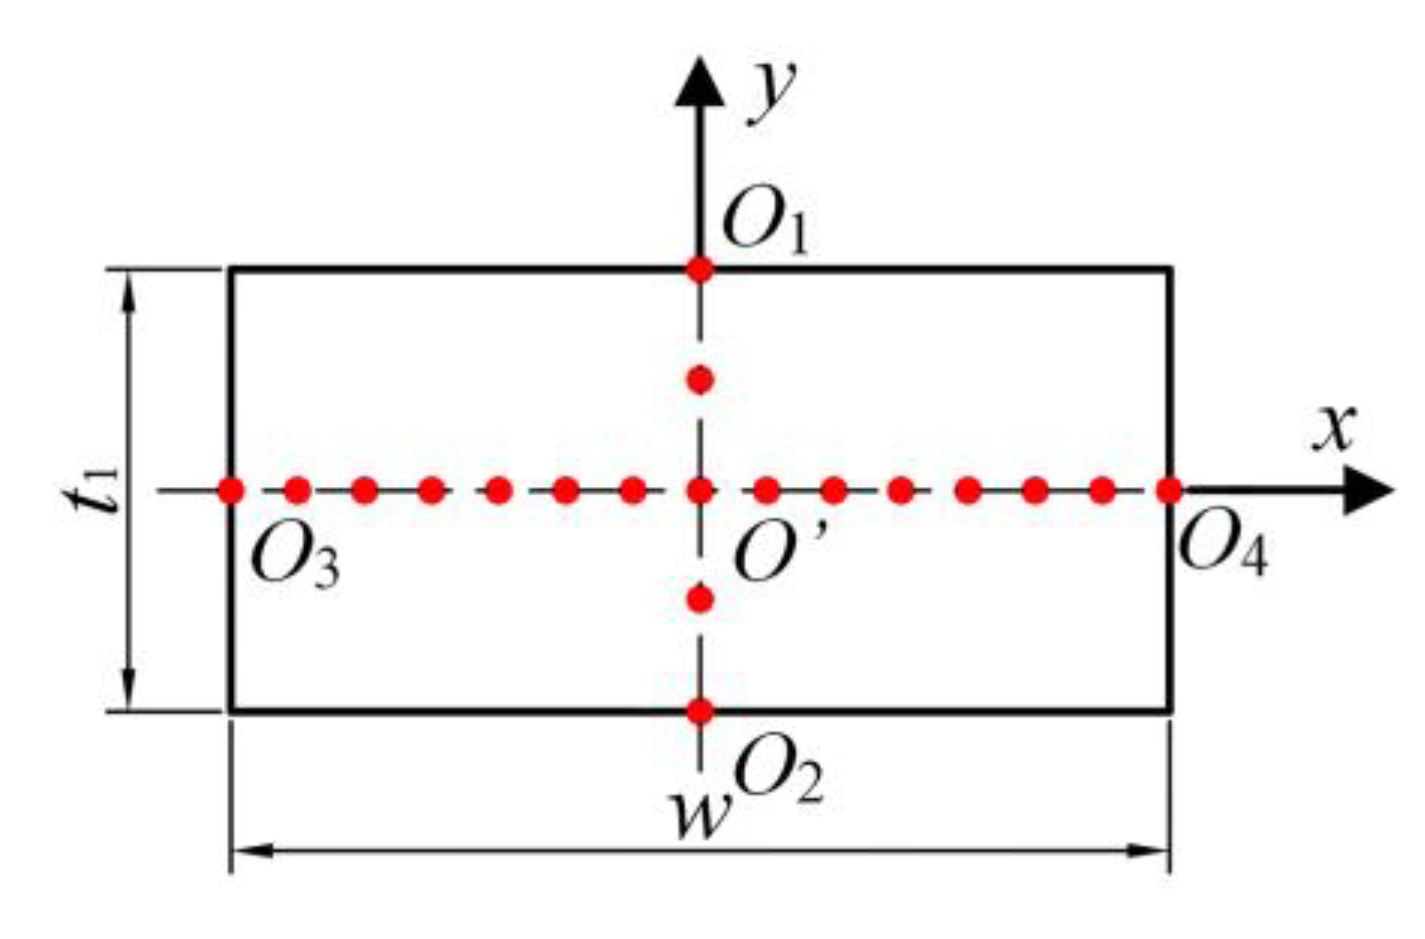
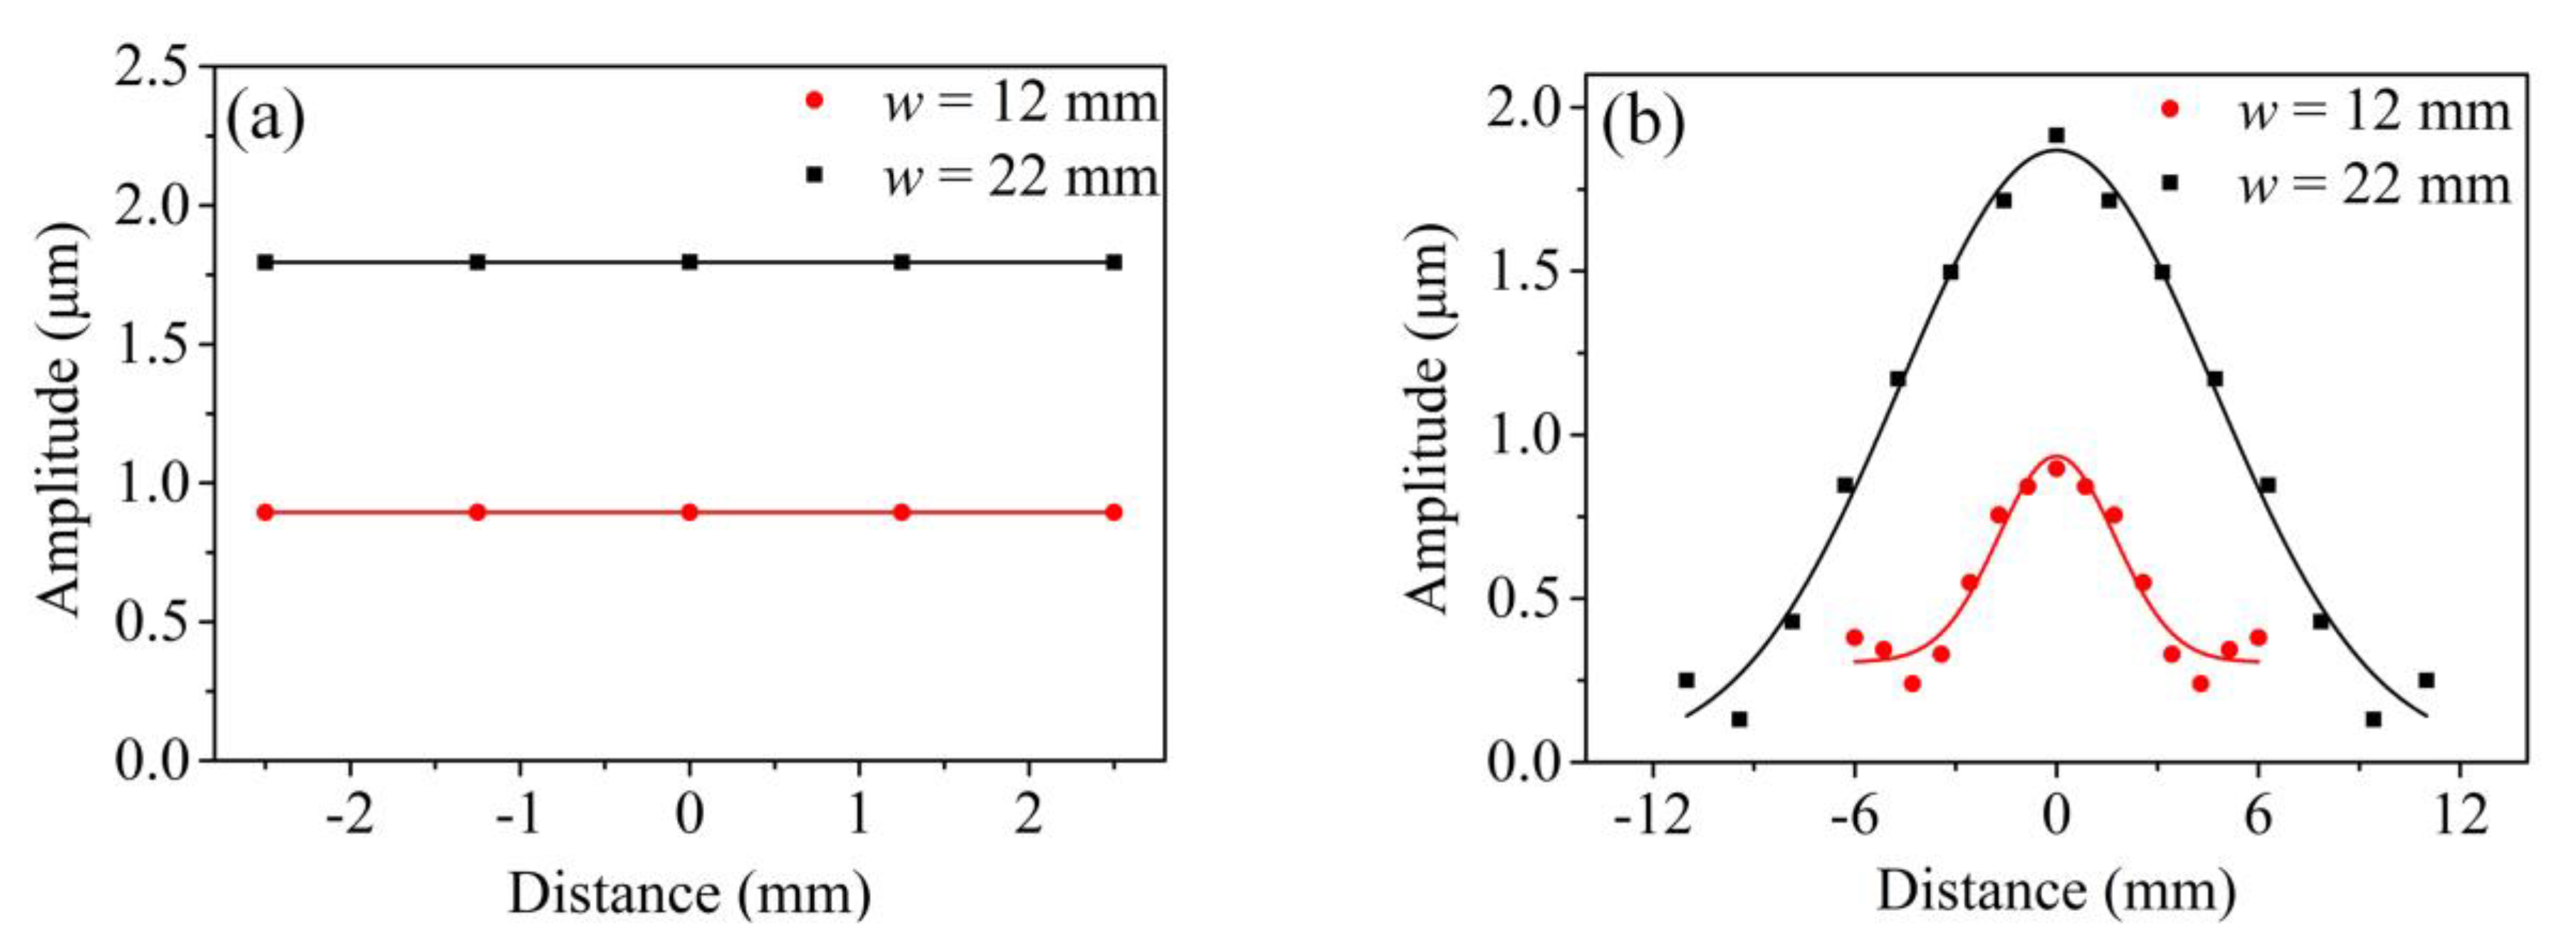
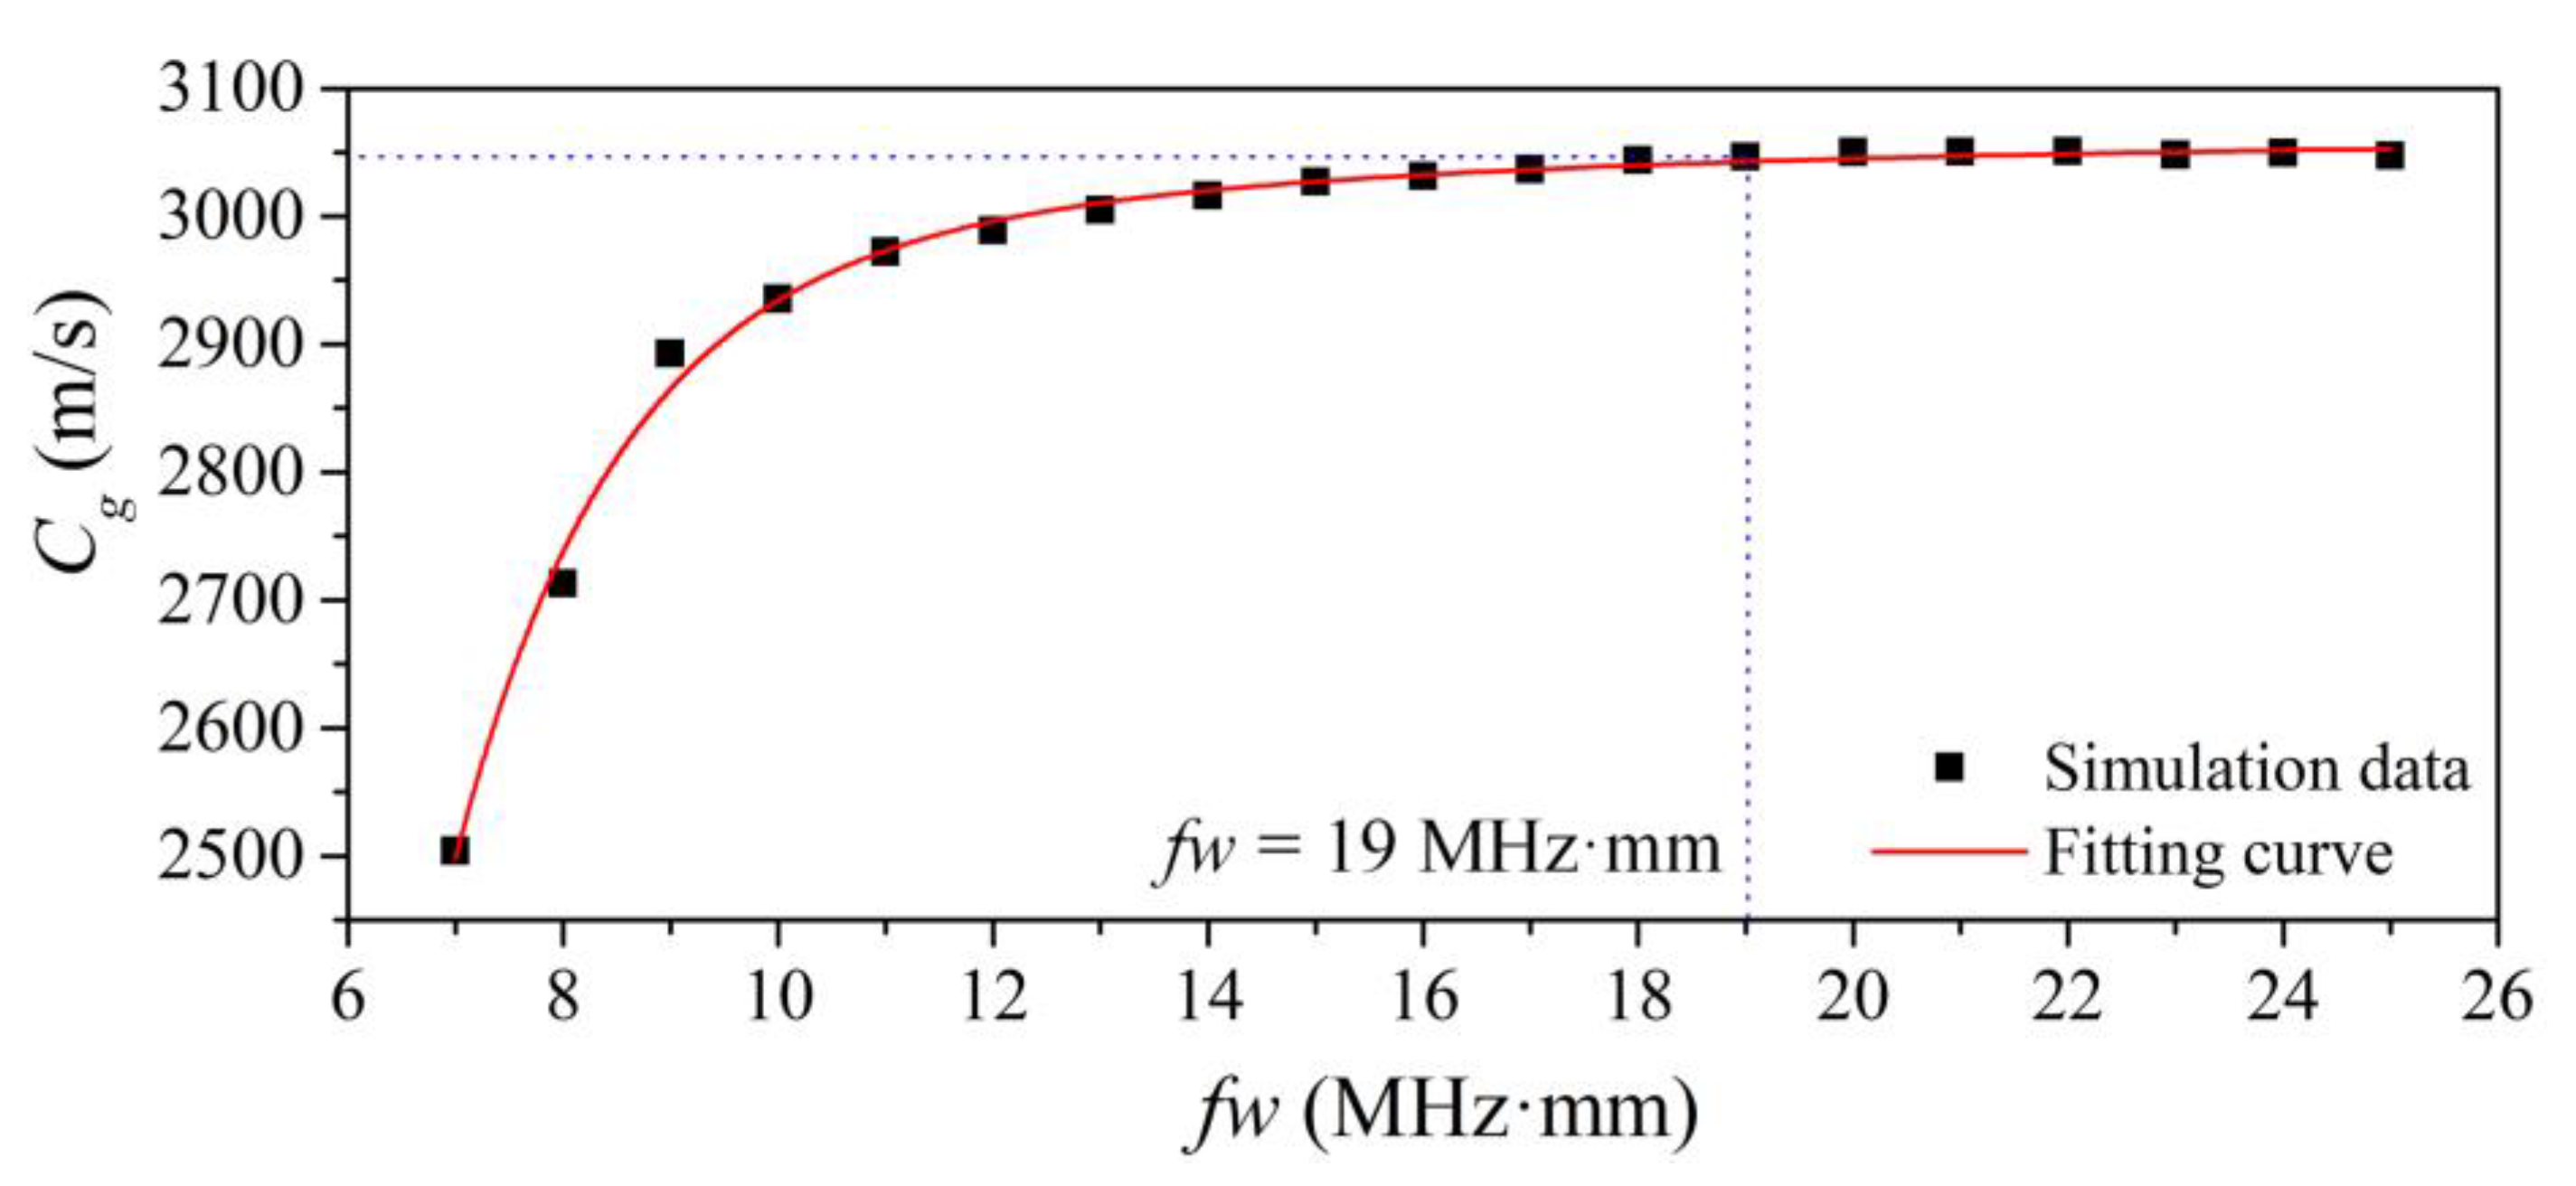
2.2.1. The Width of the Tapered Waveguide Unit
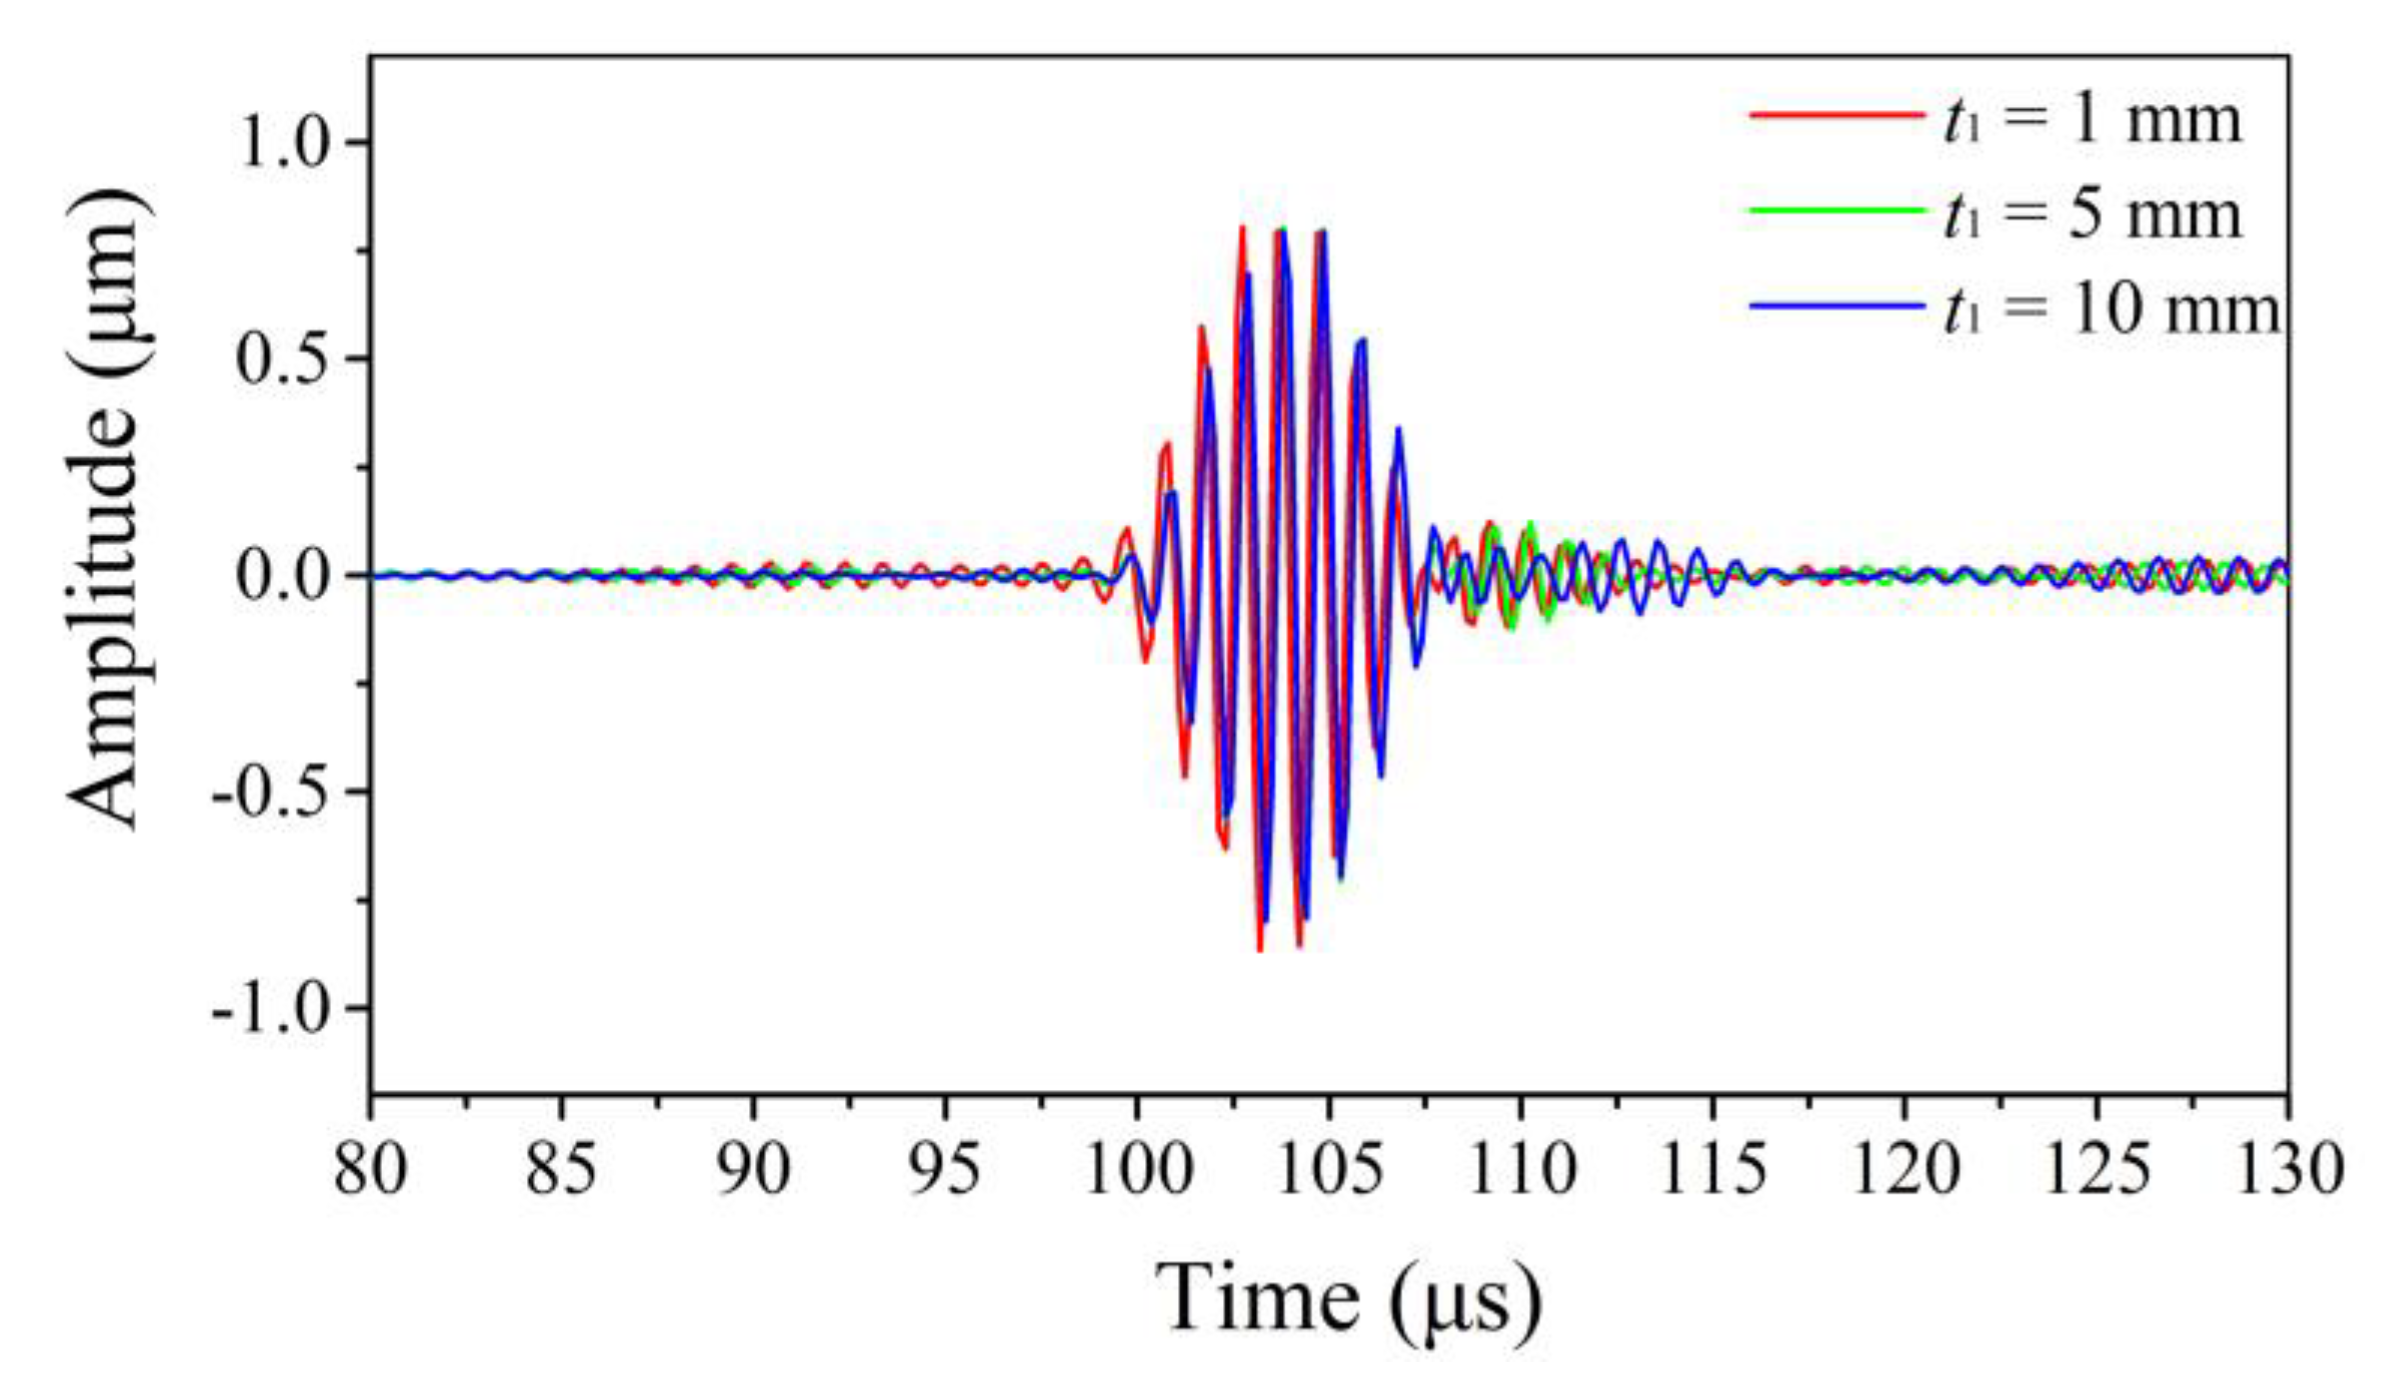
2.2.2. The Thickness of the Thick End t1
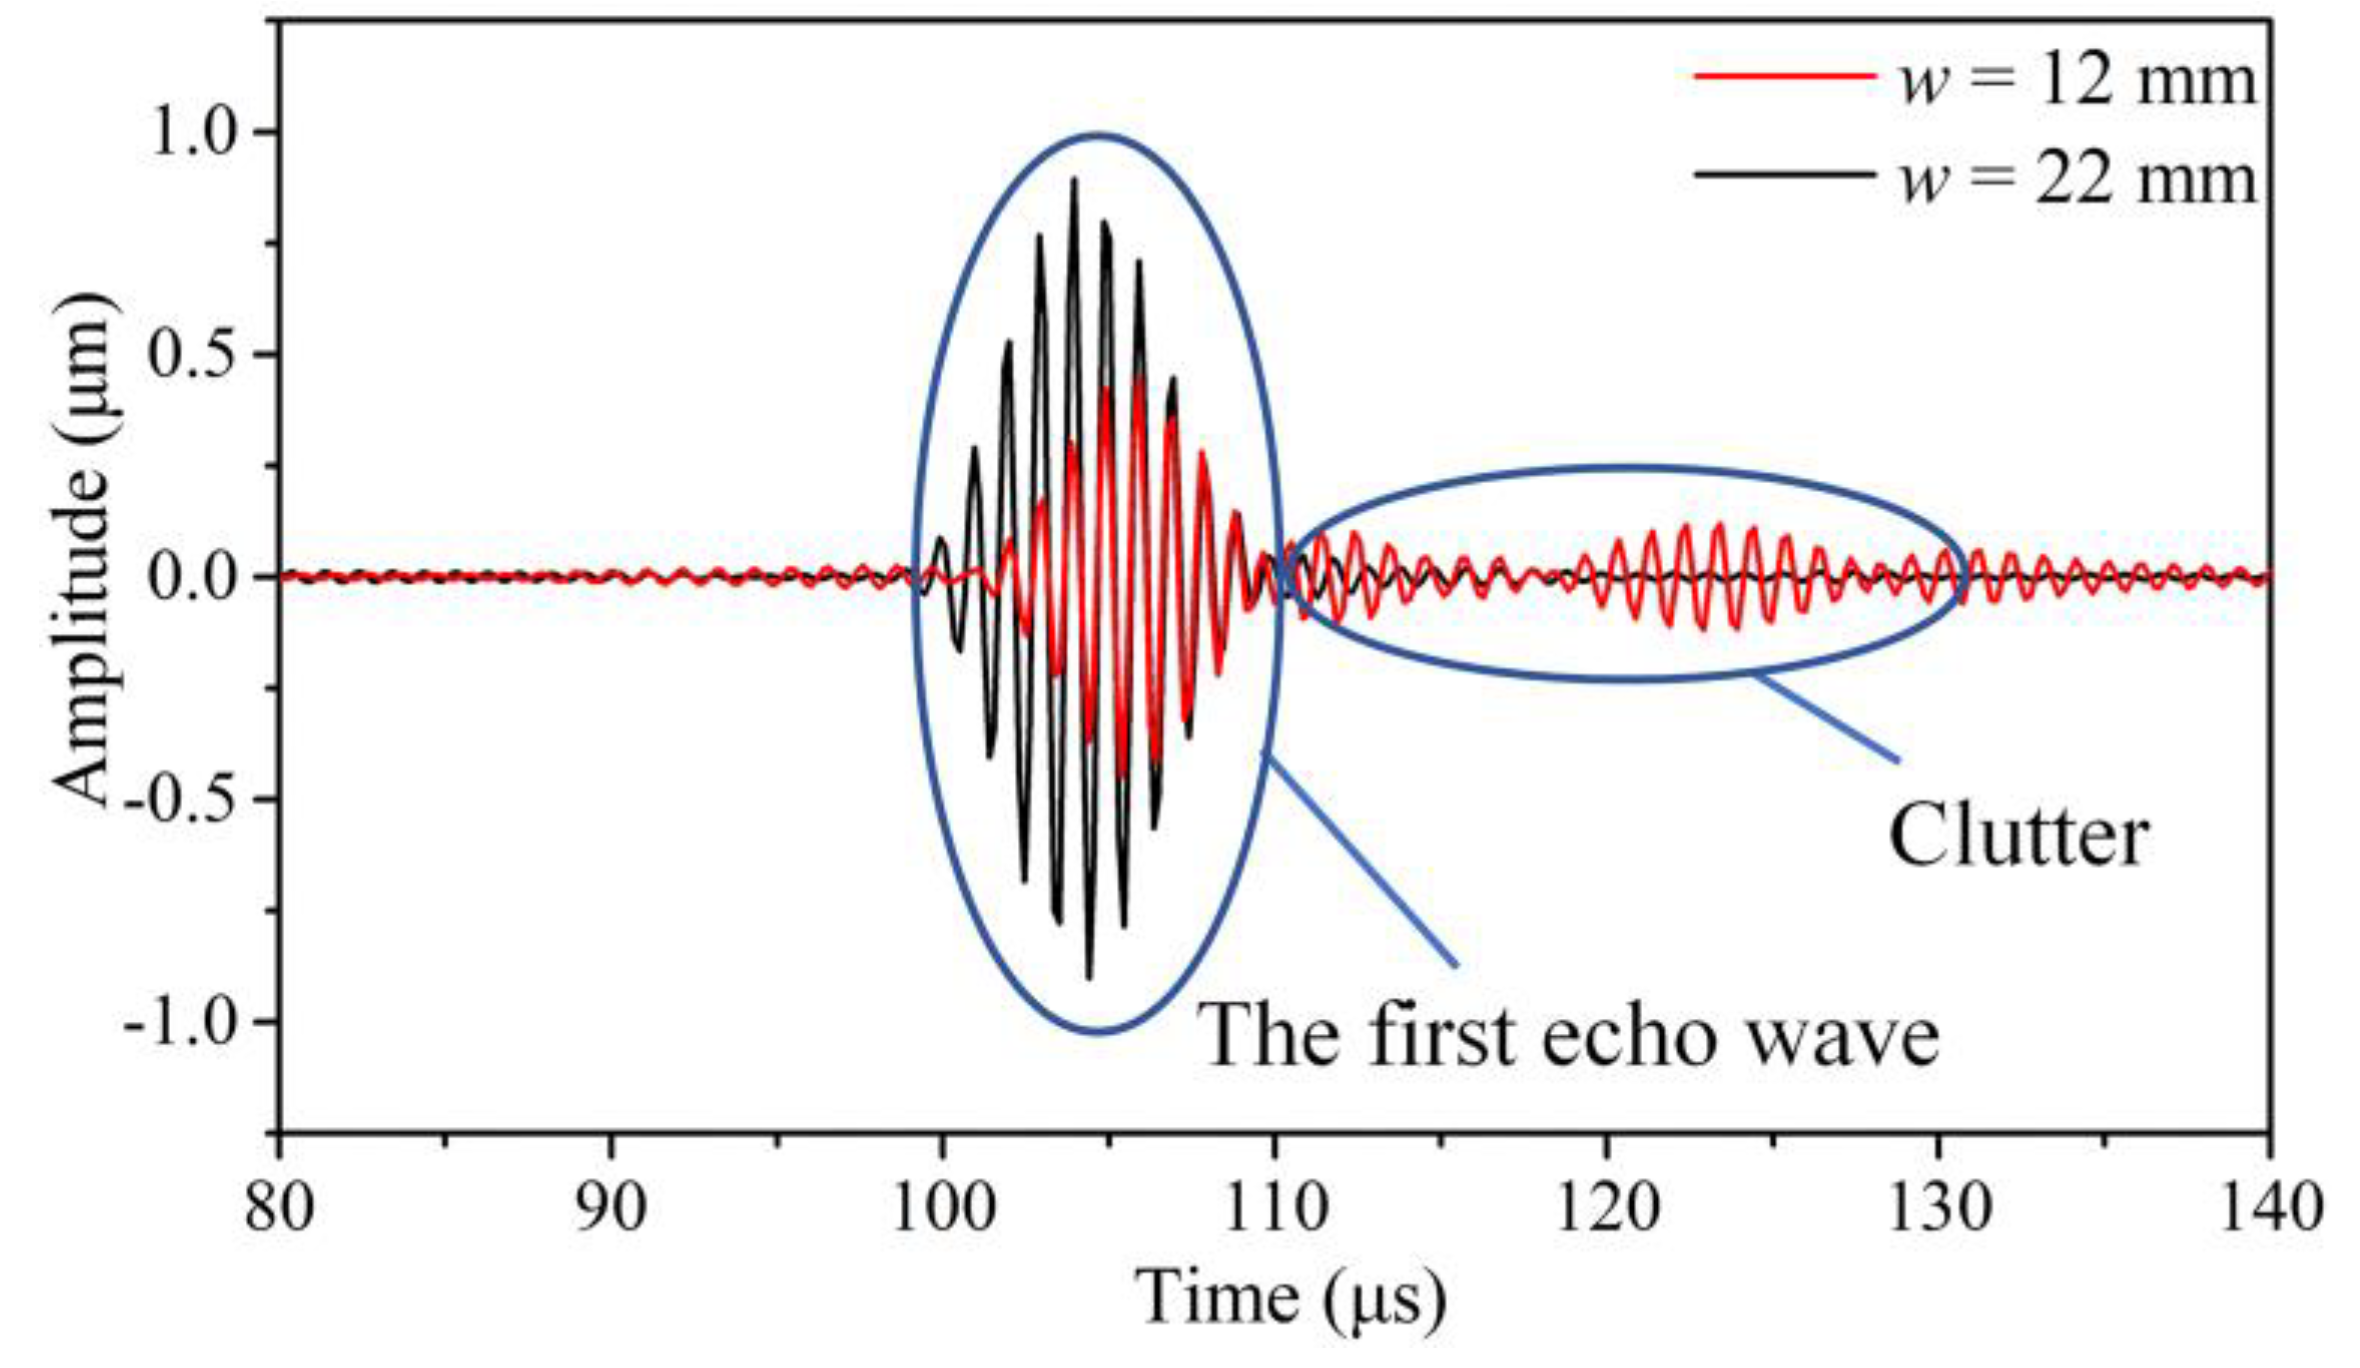
3. Experimental Verification of SH0* Wave Propagation in Tapered Waveguide Units
4. High Temperature Experimental Validation of Tapered Waveguide Transducers
5. Conclusions
Author Contributions
Funding
Conflicts of Interest
References
- Oh, S.B.; Cheong, Y.M.; Kim, D.J.; Kim, K.M. On-Line Monitoring of Pipe Wall Thinning by a High Temperature Ultrasonic Waveguide System at the Flow Accelerated Corrosion Proof Facility. Sensors 2019, 19, 1762. [Google Scholar] [CrossRef] [PubMed] [Green Version]
- Zhang, H.C.; Jia, J.H.; Wang, N.; Hu, X.Y.; Tu, S.T.; Zhou, S.P.; Wang, Z.D. Development of on-line monitoring systems for high temperature components in power plants. Sensors 2013, 13, 15504–15512. [Google Scholar] [CrossRef] [PubMed] [Green Version]
- Cawley, P. Structural health monitoring: Closing the gap between research and industrial deployment. Struct. Health Monit. 2018, 17, 1225–1244. [Google Scholar] [CrossRef] [Green Version]
- Schulz, M.J.; Sundaresan, M.J.; Mcmichael, J.; Clayton, D.; Sadler, R.; Nagel, B. Piezoelectric materials at elevated temperature. J. Intell. Mater. Syst. 2003, 14, 693–705. [Google Scholar] [CrossRef]
- Amini, M.H.; Sinclair, A.N.; Coyle, T.W. High Temperature Ultrasonic Transducer for Real-time Inspection. Phys. Procedia 2015, 70, 343–347. [Google Scholar] [CrossRef] [Green Version]
- Ahmad, R.; Banerjee, S.; Kundu, T. Pipe Wall Damage Detection in Buried Pipes Using Guided Waves. ASME J. Press. Vessel Technol. 2009, 131, 011501. [Google Scholar] [CrossRef]
- Zhao, G.Q.; Wang, B.; Wang, T.; Hao, W.F.; Luo, Y. Detection and monitoring of delamination in composite laminates using ultrasonic guided wave. Compos. Struct. 2019, 225, 111161. [Google Scholar] [CrossRef]
- Jen, C.K.; Legoux, J.G. Clad Ultrasonic Waveguides with Reduced Trailing Echoes. U.S. Patent 19960654973, 1998. [Google Scholar]
- Jen, C.K.; Legoux, J.G.; Parent, L. Experimental evaluation of clad metallic buffer rods for high temperature ultrasonic measurements. NDT E Int. 2000, 33, 145–153. [Google Scholar] [CrossRef]
- Ono, Y.; Zhang, Y.B.; Cheng, K.J.; Moisan, J.F.; Su, C.Y. Aluminum buffer rods for ultrasonic monitoring at elevated temperatures. IEEE Trans. Ultason. Ferrroelect. Freq. Contr. 2005, 52, 1044–1049. [Google Scholar] [CrossRef]
- Lynnworth, L.C.; Yi, L. Ultrasonic Path Bundle and Systems. U.S. Patent JP2006249919, 2002. [Google Scholar]
- Lynnworth, L.C.; Yi, L.; Umina, J.A. Extensional bundle waveguide techniques for measuring flow of hot fluids. IEEE Trans. Ultrason. Ferroelectr. 2005, 52, 538–544. [Google Scholar] [CrossRef] [PubMed]
- Heijnsdijk, A.M.; Klooster, J.M. Ultrasonic Waveguide. U.S. Patent 6400648B1, 2002. [Google Scholar]
- Cawley, P.; Cegla, F.B. Ultrasonic Non-Destructive Testing. U.S. Patent 14980477, 2016. [Google Scholar]
- Wang, Y.; Zou, F.X.; Cegla, F.B. Acoustic waveguides: An attractive alternative for accurate and robust contact thermometry. Sens. Actuat. A Phys. 2018, 270, 84–88. [Google Scholar] [CrossRef]
- Cegla, F.B.; Cawley, P.; Allin, J.; Davies, J. High-temperature (>500 °C) wall thickness monitoring using dry-coupled ultrasonic waveguide transducers. IEEE Trans. Ultason. Ferrroelect. Freq. Contr. 2011, 58, 156–167. [Google Scholar] [CrossRef] [PubMed]
- Cheong, Y.M.; Kim, K.M.; Kim, D.J. High-temperature ultrasonic thickness monitoring for pipe thinning in a flow-accelerated corrosion proof test facility. Nucl. Eng. Technol. 2017, 49, 1463–1471. [Google Scholar] [CrossRef]
- Joo, Y.S.; Park, C.G.; Lee, J.H.; Kim, J.B.; Lim, S.H. Development of ultrasonic waveguide sensor for under-sodium inspection in a sodium-cooled fast reactor. NDT E Int. 2011, 44, 239–246. [Google Scholar] [CrossRef]
- Kwon, Y.E.; Jeon, H.J.; Kim, H.W.; Kim, Y.Y. Waveguide tapering for beam-width control in a waveguide transducer. Ultrasonics 2014, 54, 953–960. [Google Scholar] [CrossRef]
- Jia, J.H.; Liao, Z.Y.; Cai, X.T.; Tu, Y.; Tu, S.T. Critical Excitation of the Fundamental Quasi-Shear Mode Wave in Waveguide Units for Elevated Temperature Applications. Sensors 2019, 19, 793. [Google Scholar] [CrossRef] [Green Version]
- Ditri, J.J. Some results on the scattering of guided elastic SH waves from material and geometric waveguide discontinuities. J. Acoust. Soc. Am. 1996, 100, 3078–3087. [Google Scholar] [CrossRef]
- Valier Brasier, T.; Potel, C.; Bruneau, M. Shear acoustic waves polarized along the ridged surface of anisotropic solid plate: Mode coupling effects due to the shape profile. J. Appl. Phys. 2010, 108, 074910. [Google Scholar] [CrossRef] [Green Version]
- Nakamura, N.; Ogi, H.; Hirao, M.; Nakahata, K. Mode conversion behavior of SH guided wave in a tapered plate. NDT E Int. 2012, 45, 156–161. [Google Scholar]
- Jia, J.H.; Wang, Q.Y.; Liao, Z.Y.; Tu, Y.; Tu, S.T. Design of Waveguide Bars for Transmitting a Pure Shear Horizontal Wave to Monitor High Temperature Components. Materials 2017, 10, 1027. [Google Scholar]


| Number | t1/mm | t2/mm | w/mm | l/mm |
|---|---|---|---|---|
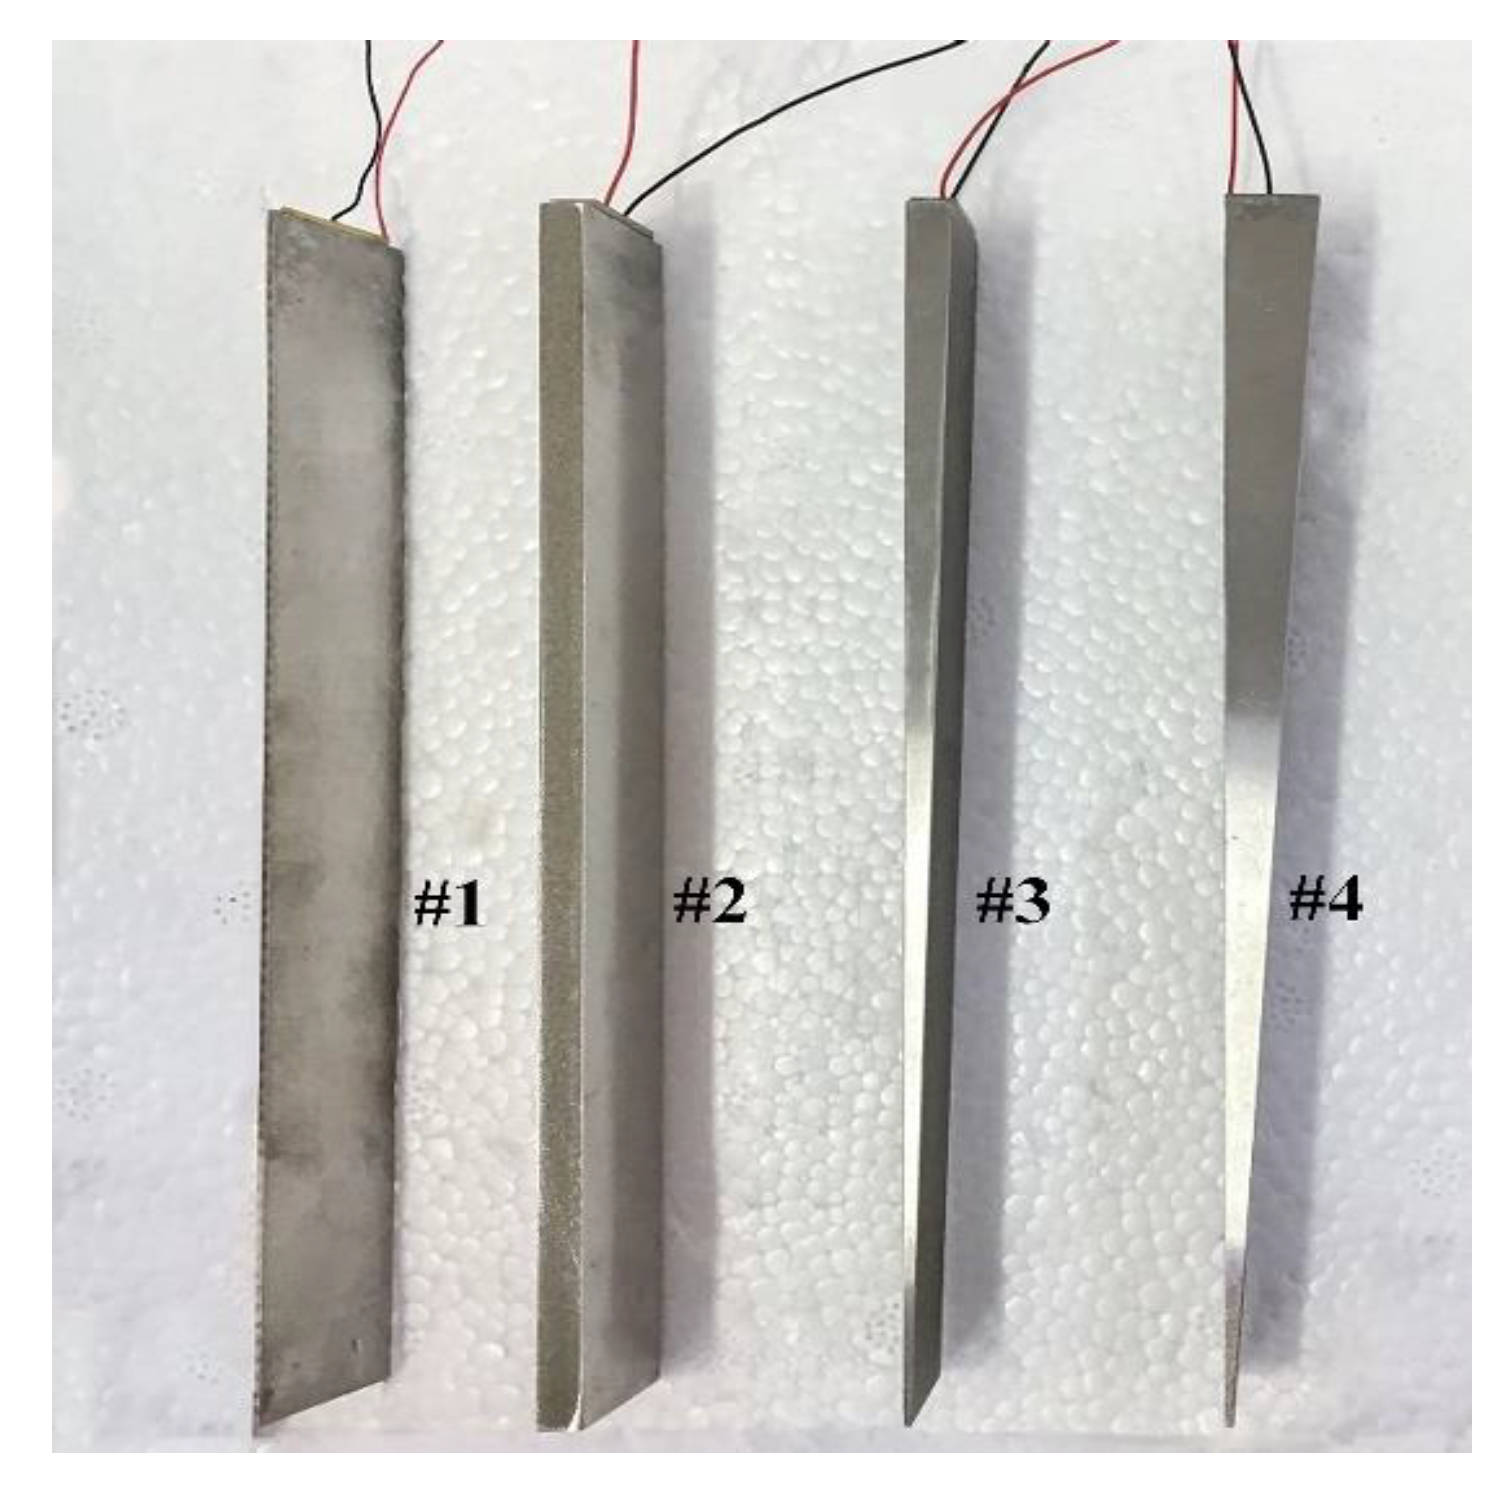
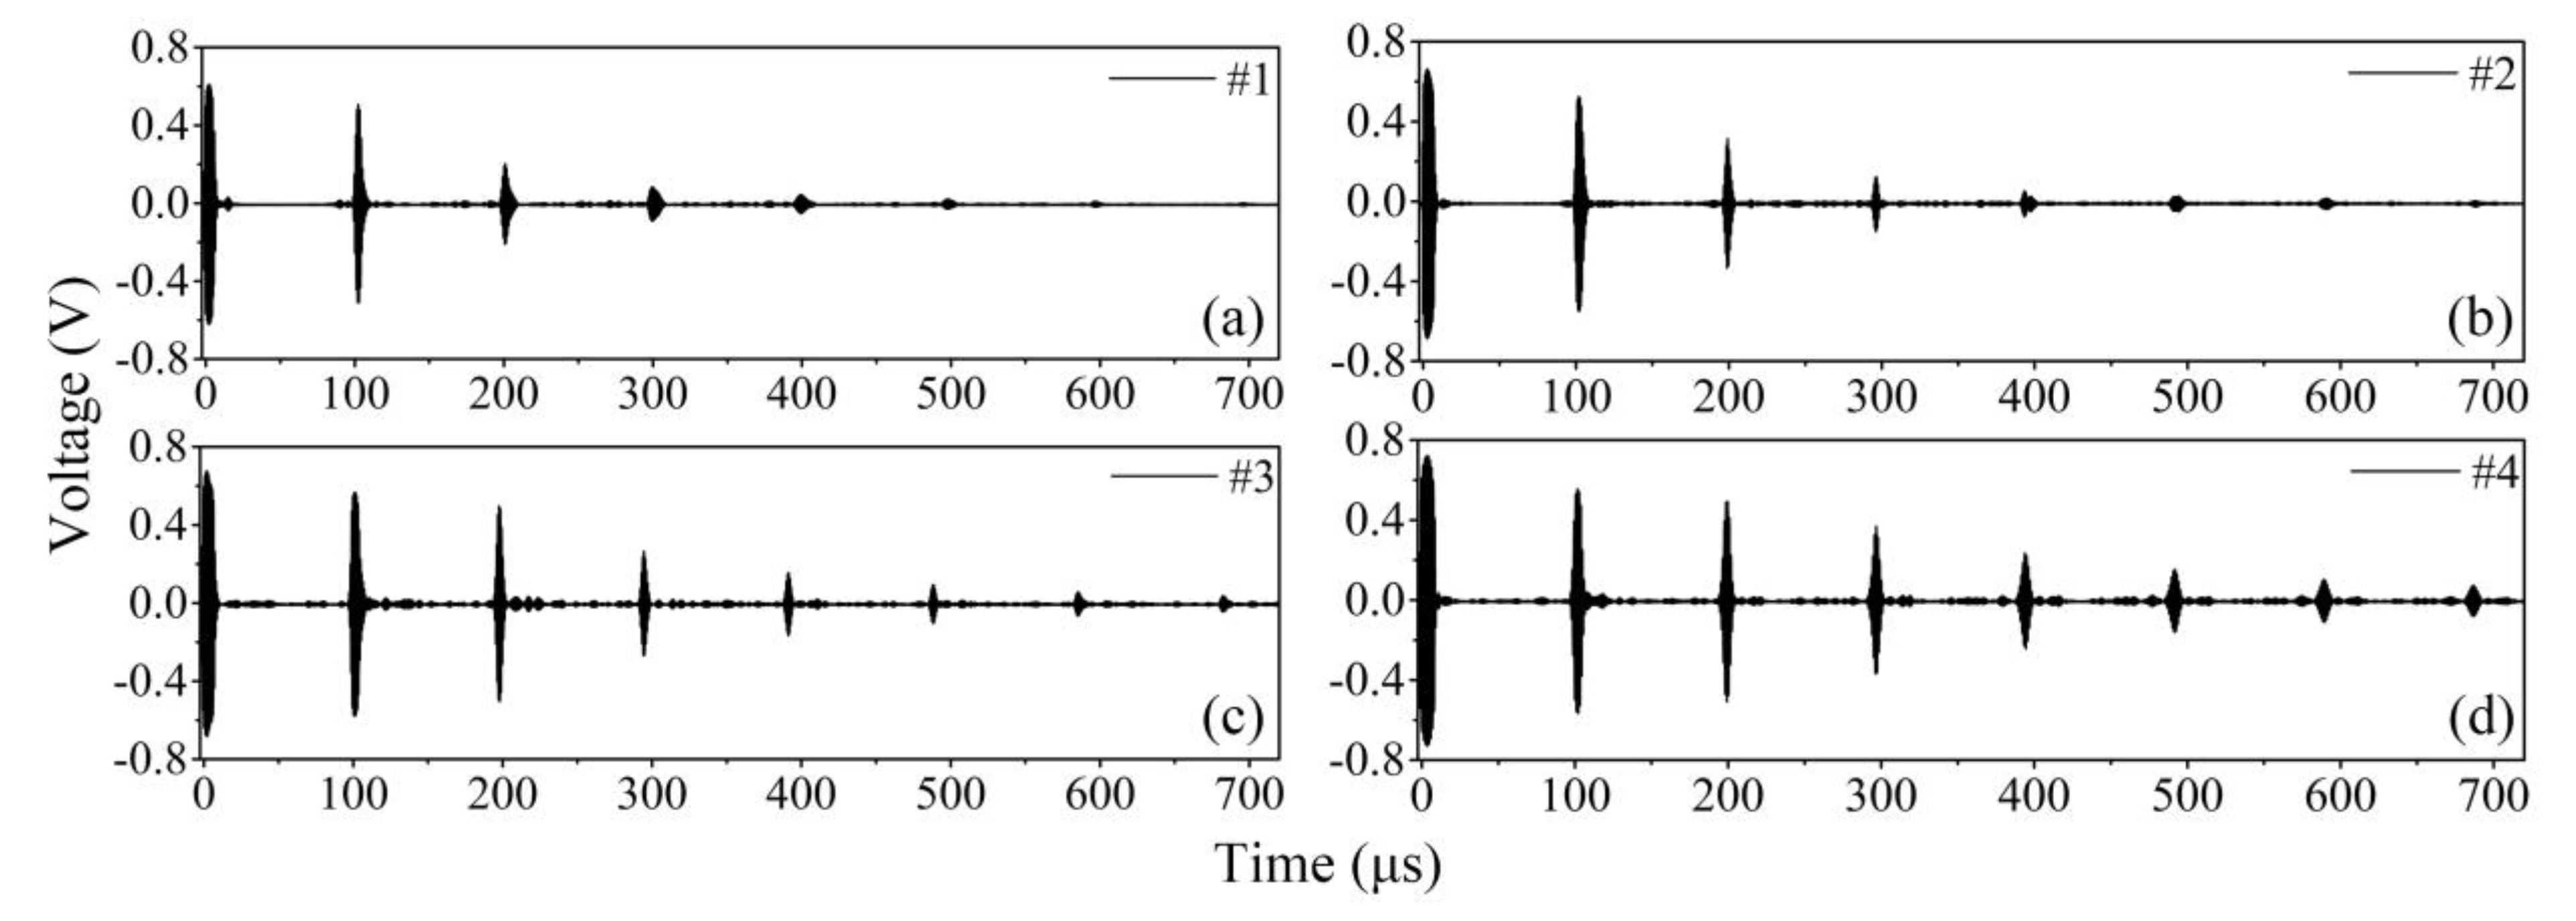
| #1 | 1 | 1 | 20 | 150 |
| #2 | 5 | 5 | 20 | 150 |
| #3 | 5 | 1 | 20 | 150 |
| #4 | 10 | 1 | 20 | 150 |
| Number | The Tapered Waveguide Bar | The Piezoelectric Wafer | |||||
|---|---|---|---|---|---|---|---|
| l/mm | w/mm | t1/mm | t2/mm | l0/mm | w0/mm | t0/mm | |
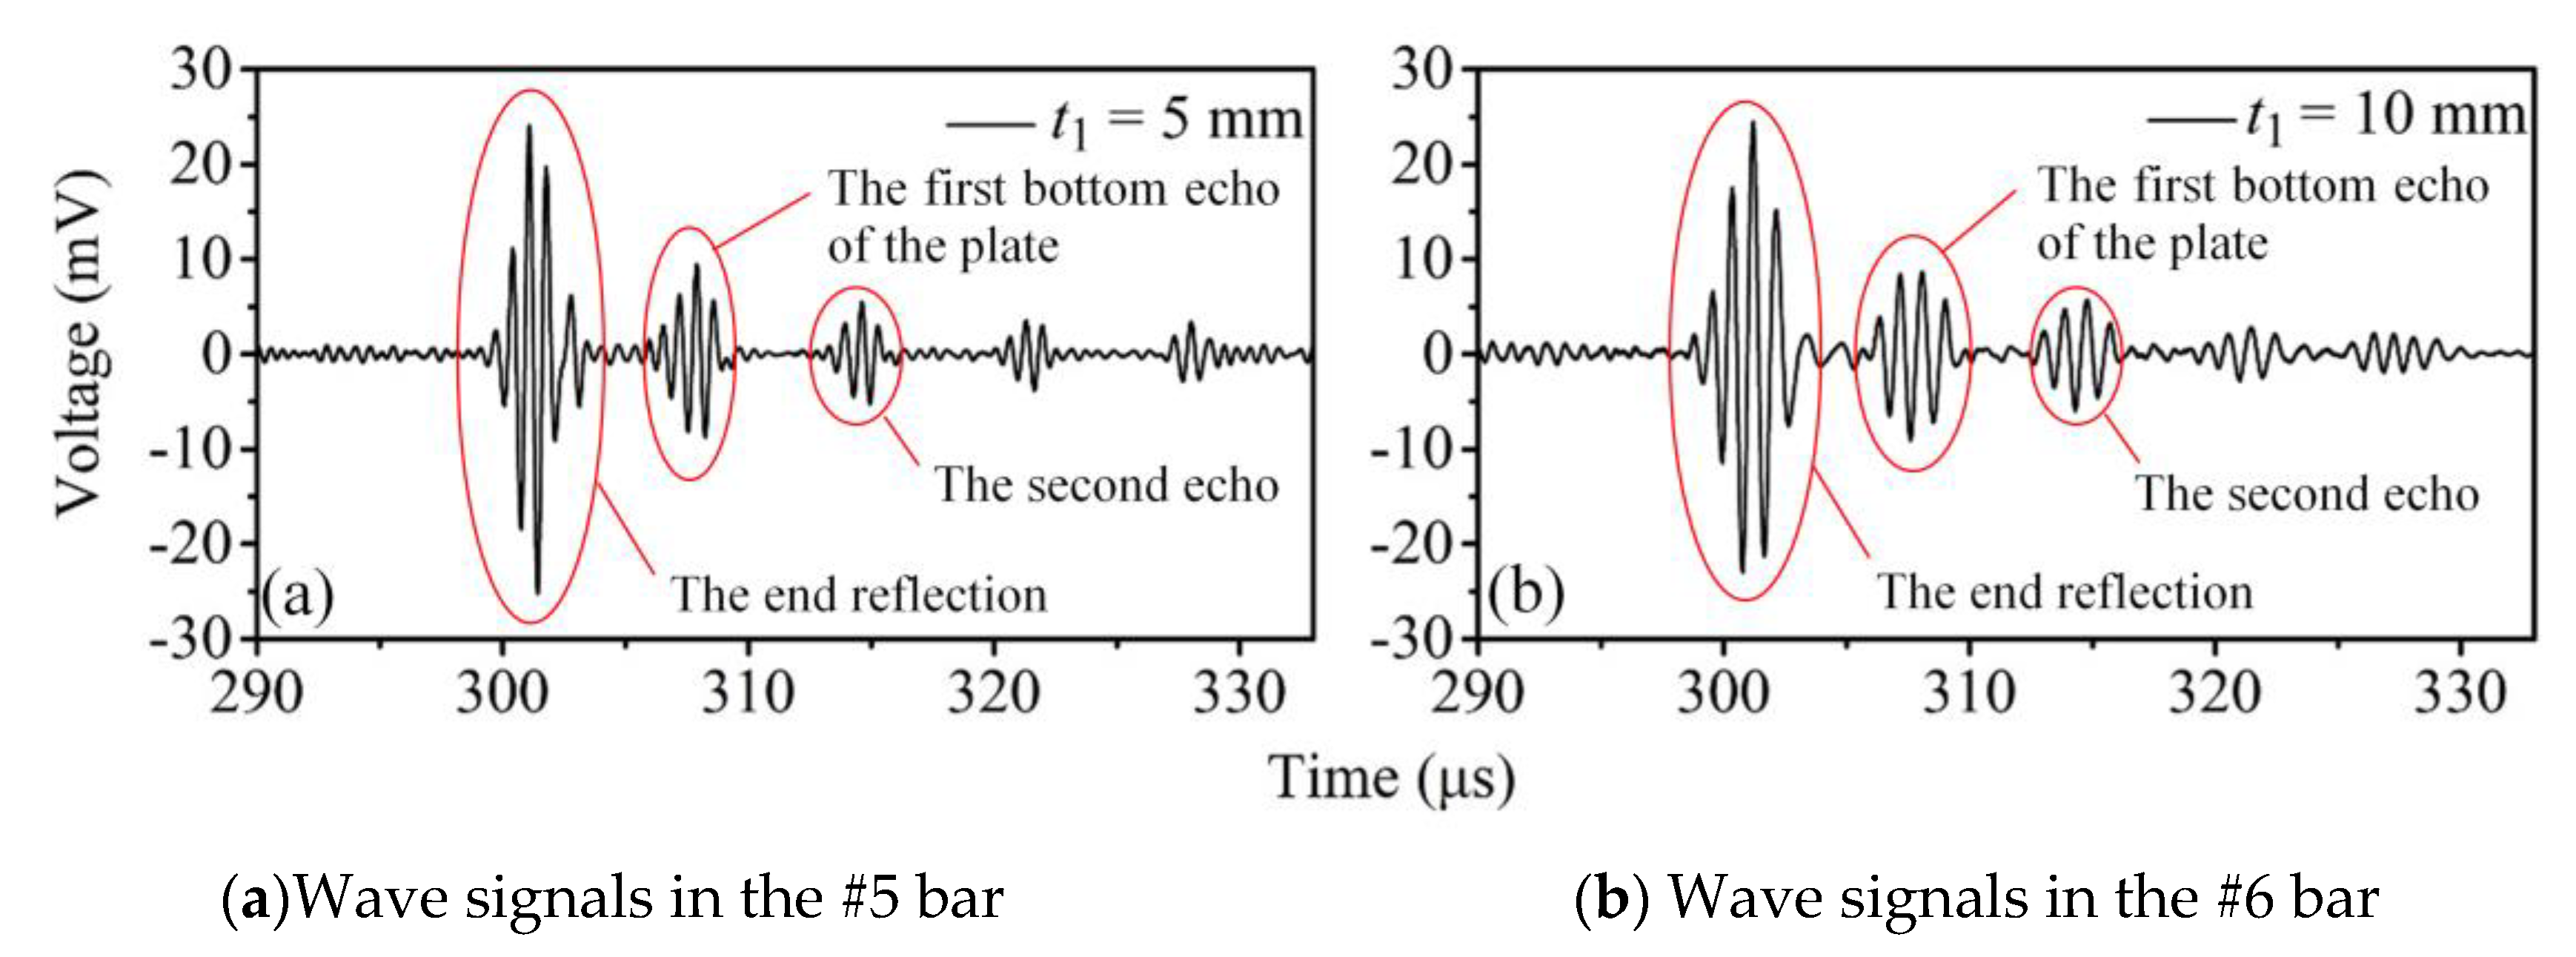
| #5 | 450 | 20 | 5 | 1 | 18 | 5 | 0.5 |
| #6 | 450 | 20 | 10 | 1 | 18 | 10 | 0.5 |
© 2020 by the authors. Licensee MDPI, Basel, Switzerland. This article is an open access article distributed under the terms and conditions of the Creative Commons Attribution (CC BY) license (http://creativecommons.org/licenses/by/4.0/).
Share and Cite
Jia, J.; Ren, Y.; Wang, W.; Liao, Z.; Zhang, X.; Tu, S.-T. Optimal Design Methodology of Tapered Waveguide Transducers for Thickness Monitoring. Sensors 2020, 20, 1892. https://doi.org/10.3390/s20071892
Jia J, Ren Y, Wang W, Liao Z, Zhang X, Tu S-T. Optimal Design Methodology of Tapered Waveguide Transducers for Thickness Monitoring. Sensors. 2020; 20(7):1892. https://doi.org/10.3390/s20071892
Chicago/Turabian StyleJia, Jiuhong, Yue Ren, Weiming Wang, Zuoyu Liao, Xiancheng Zhang, and Shan-Tung Tu. 2020. "Optimal Design Methodology of Tapered Waveguide Transducers for Thickness Monitoring" Sensors 20, no. 7: 1892. https://doi.org/10.3390/s20071892