GRAFT: A Model for Evaluating Actuator Systems in Terms of Force Production
Abstract
1. Introduction
2. State of the Art of Evaluation Methodologies in IoT Systems
3. Foundations of the GRAFT Model
- Several tasks need to be performed by an actuator each day, in different times (named sessions), through the day.
- Each task has to be performed within its predefined session through the day.
- A session has a beginning time and an ending time. Between the beginning and the ending time of a session, the task (with all its cycles), has to be performed.
- Each task performed by an actuator has several working cycles. The number of working cycles in a task might be similar to, or different from, the number of cycles performed in other tasks. However, a cycle in a task is similar to all other cycles in the same or other tasks. A working cycle has a predefined known amount of produced force.
- The cycles of a task may be performed in any time within the session.
- The number of tasks, the order of the tasks, and the number of cycles performed in each task, is a daily routine that will consume/produce the same amount of energy, hence the same amount of daily force.
- The GRAFT model computes the total net produced force, in a day, by this actuator, performing the predefined tasks in the predefined sessions.
- The nodes of the graph represent the sessions where tasks are performed by an actuator, producing similar type of force.
- One extra central node is added to the graph and an edge is defined between this extra node and all other nodes. This should always produce a graph with the following properties:
- simple;
- two-leveled acyclic tree;
- complete bipartite;
- planar; and
- has one face.
- The weight of each edge equals the ratio value of cycles performed in the adjacent node, to the total number of cycles performed in a day.
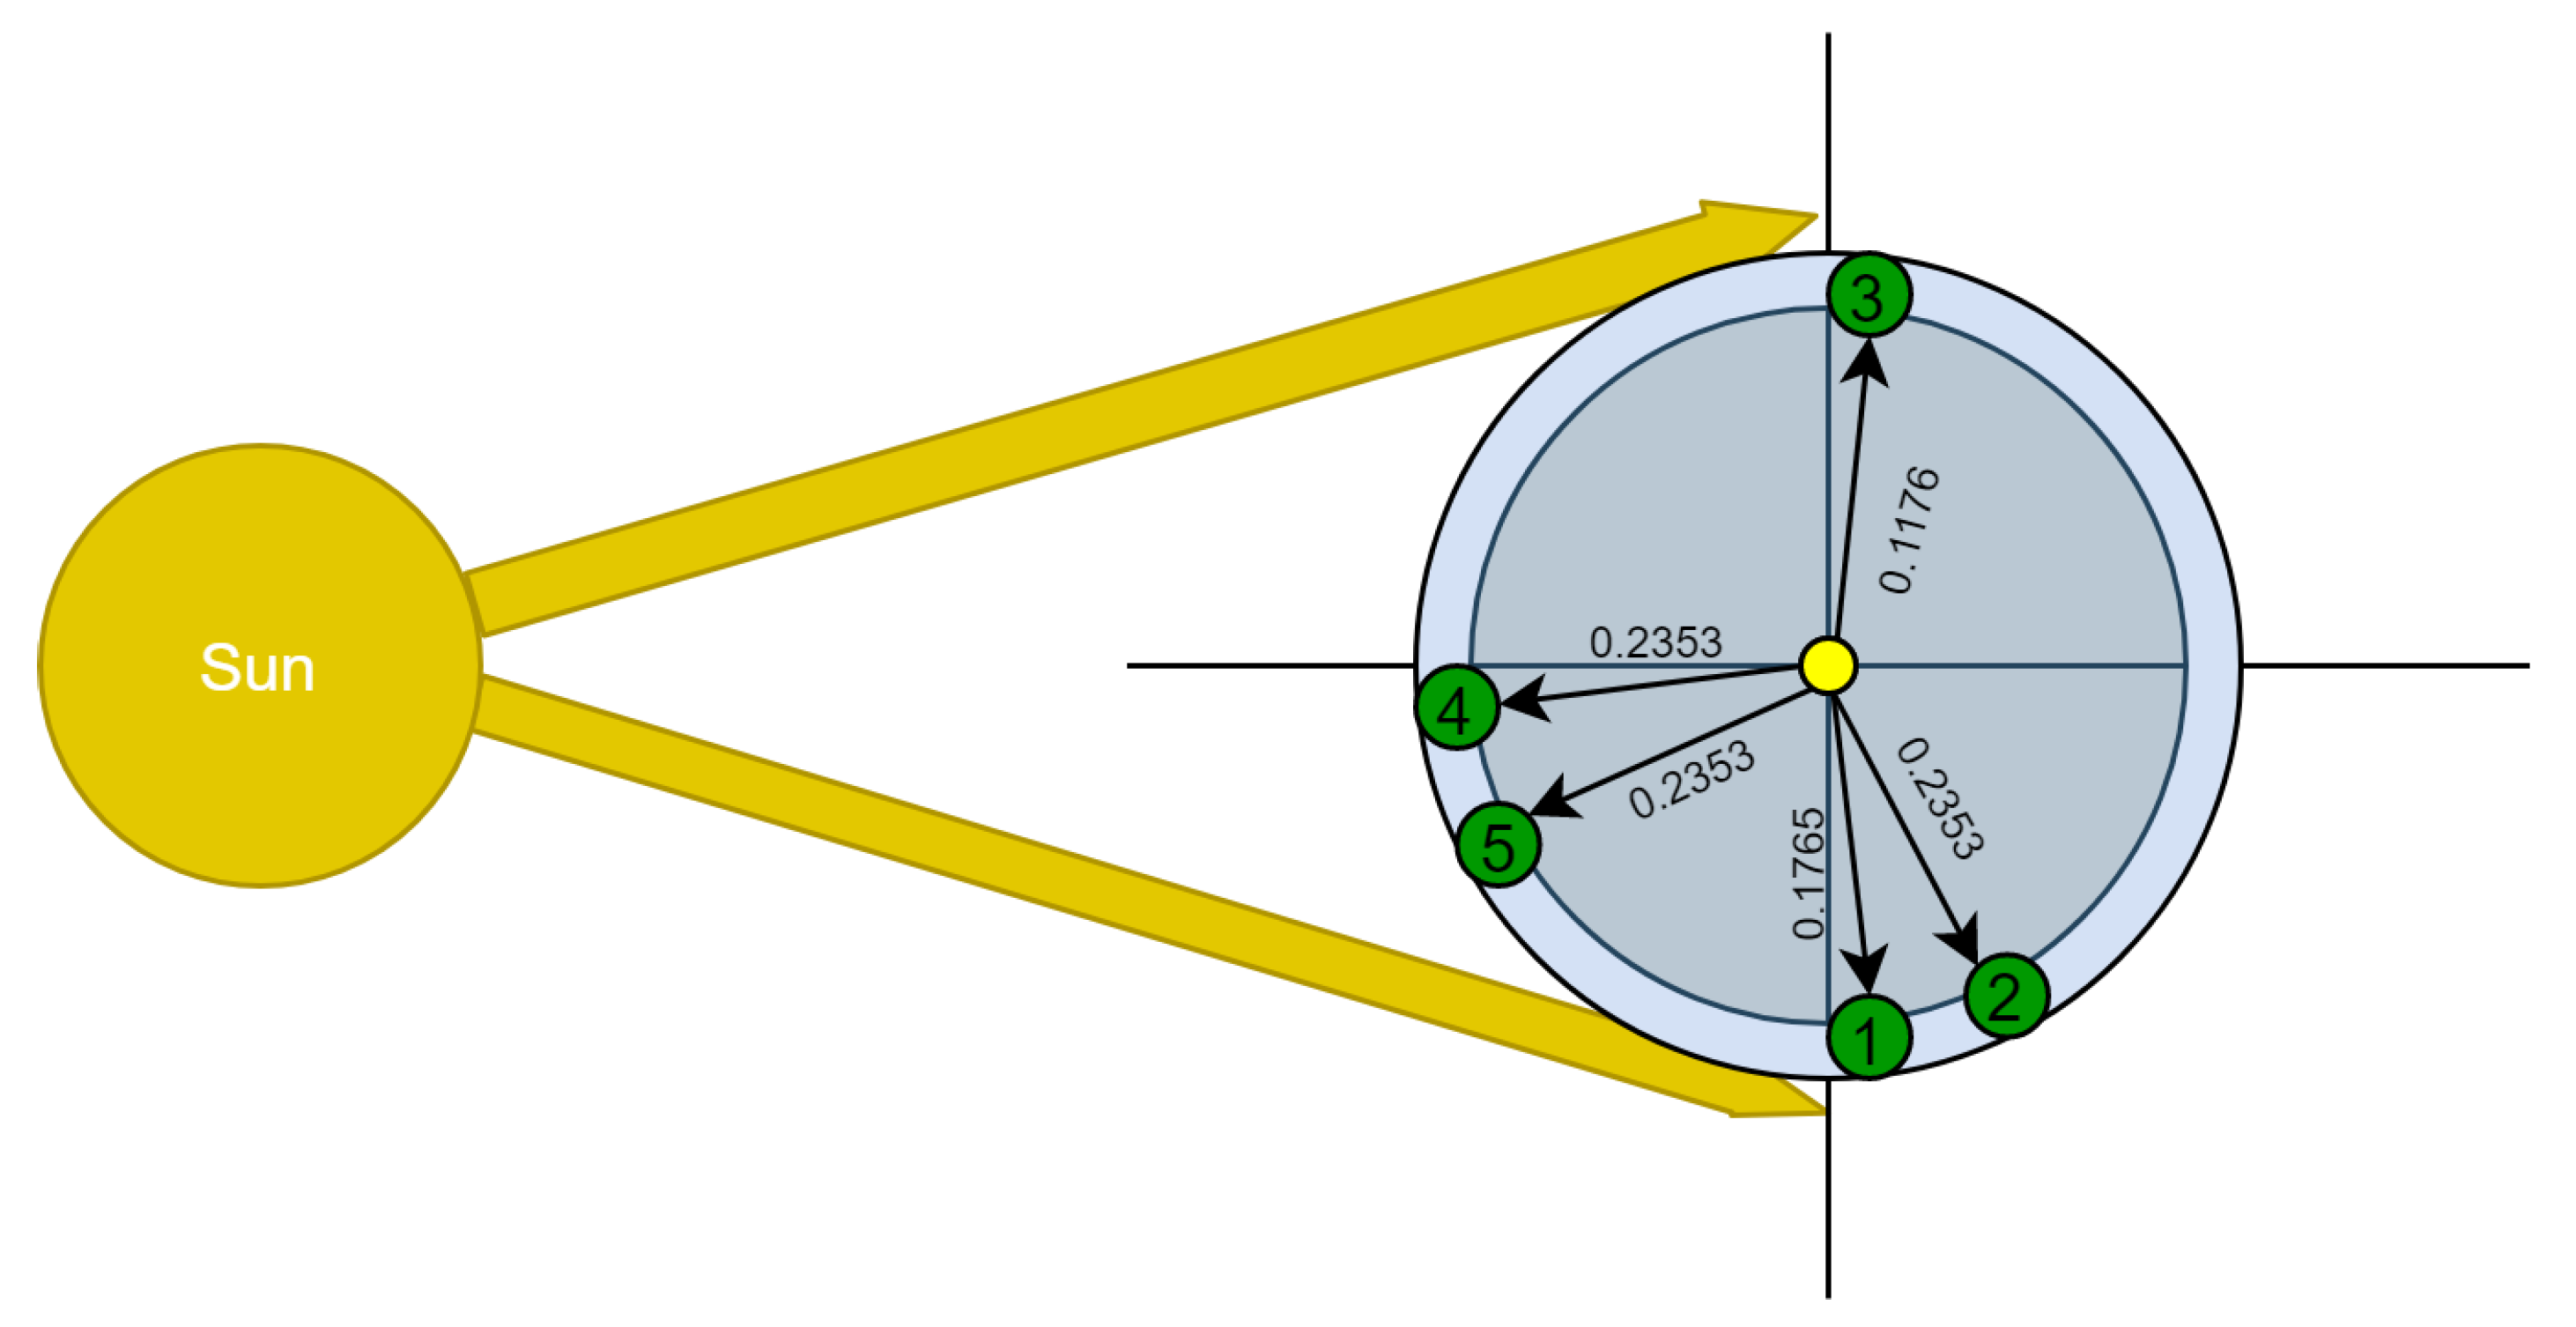
- The positioning of each node is then determined according to the starting time of the session and the session duration. The position of each session is stable relative to Sun position in the sky and not affected by Earth rotation about its axis, because the position of the sun for an observer standing on Earth defines the time for that person. For example, if an actuator is supposed to perform a task during the time 12:00–13:00, it means that this actuator will enter the session/node at 12:00, and will have 60 min to perform the task. That is, the movement of Earth for this static actuator is causing it to enter/exit the session.
3.1. Definitions
- A node represents a session. A session is a vertical sector that lies between two lines drawn on the surface of Earth. A sector has two endings at north and south, where the two lines meet. The first line represents the starting time of a session, while the second line represents the ending time of the session.
- A task is all the predefined number of working cycles that should be performed in a named session.
- A cycle is a predefined unit of tasks. A task is at least one cycle.
- Session time is the number of minutes during which the actuator has to perform the task.
- Travelled distance is the distance the actuator travels from the entering point in a session, until the exiting point out of a session.
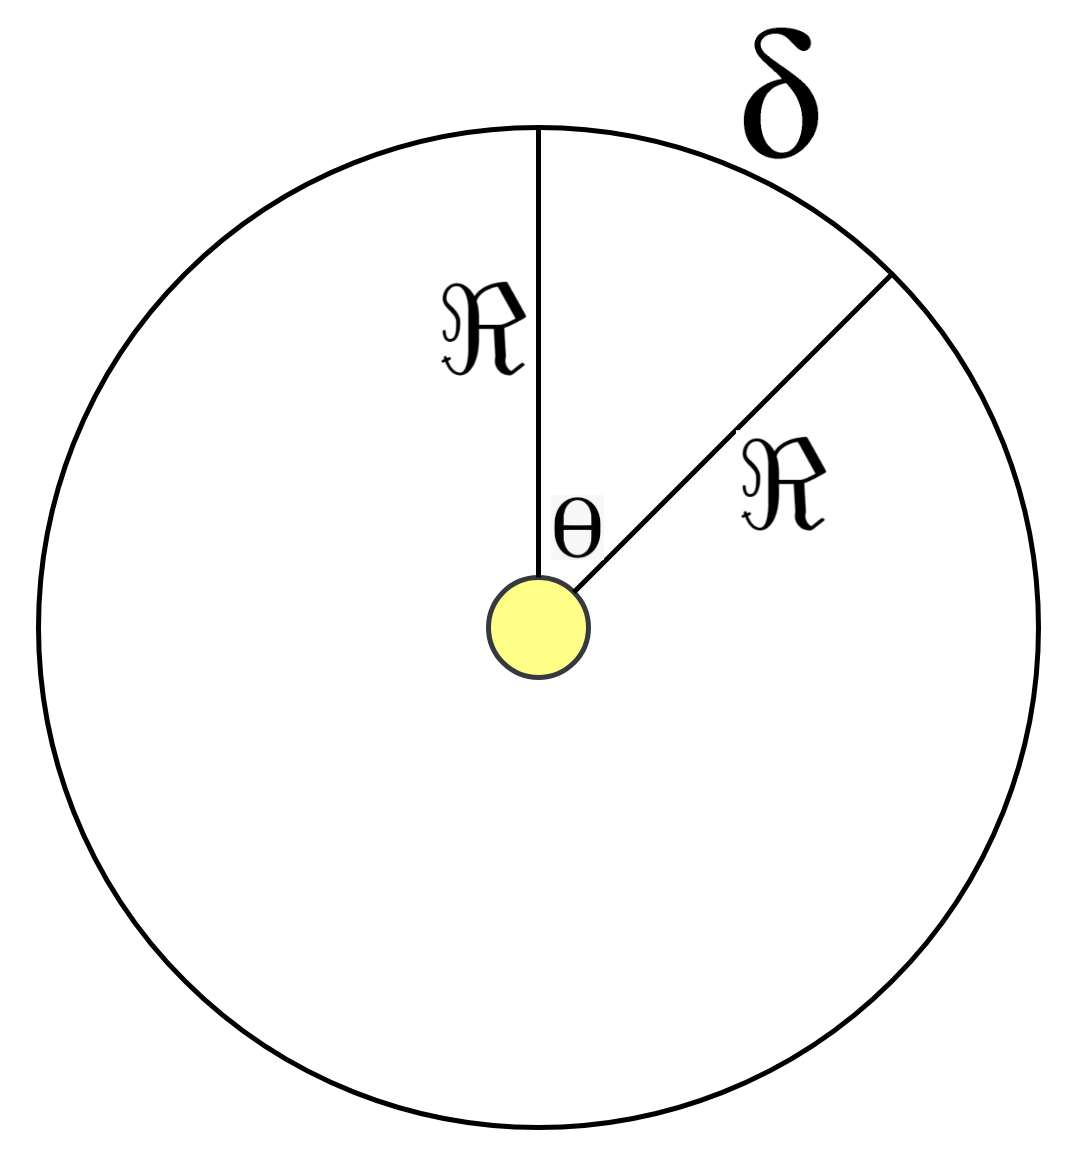
- Angle of the session is the angle between two lines: the first is the line connecting the central node to the entering point of a session, and the second line is the one connecting the central node to the exiting point of a session.
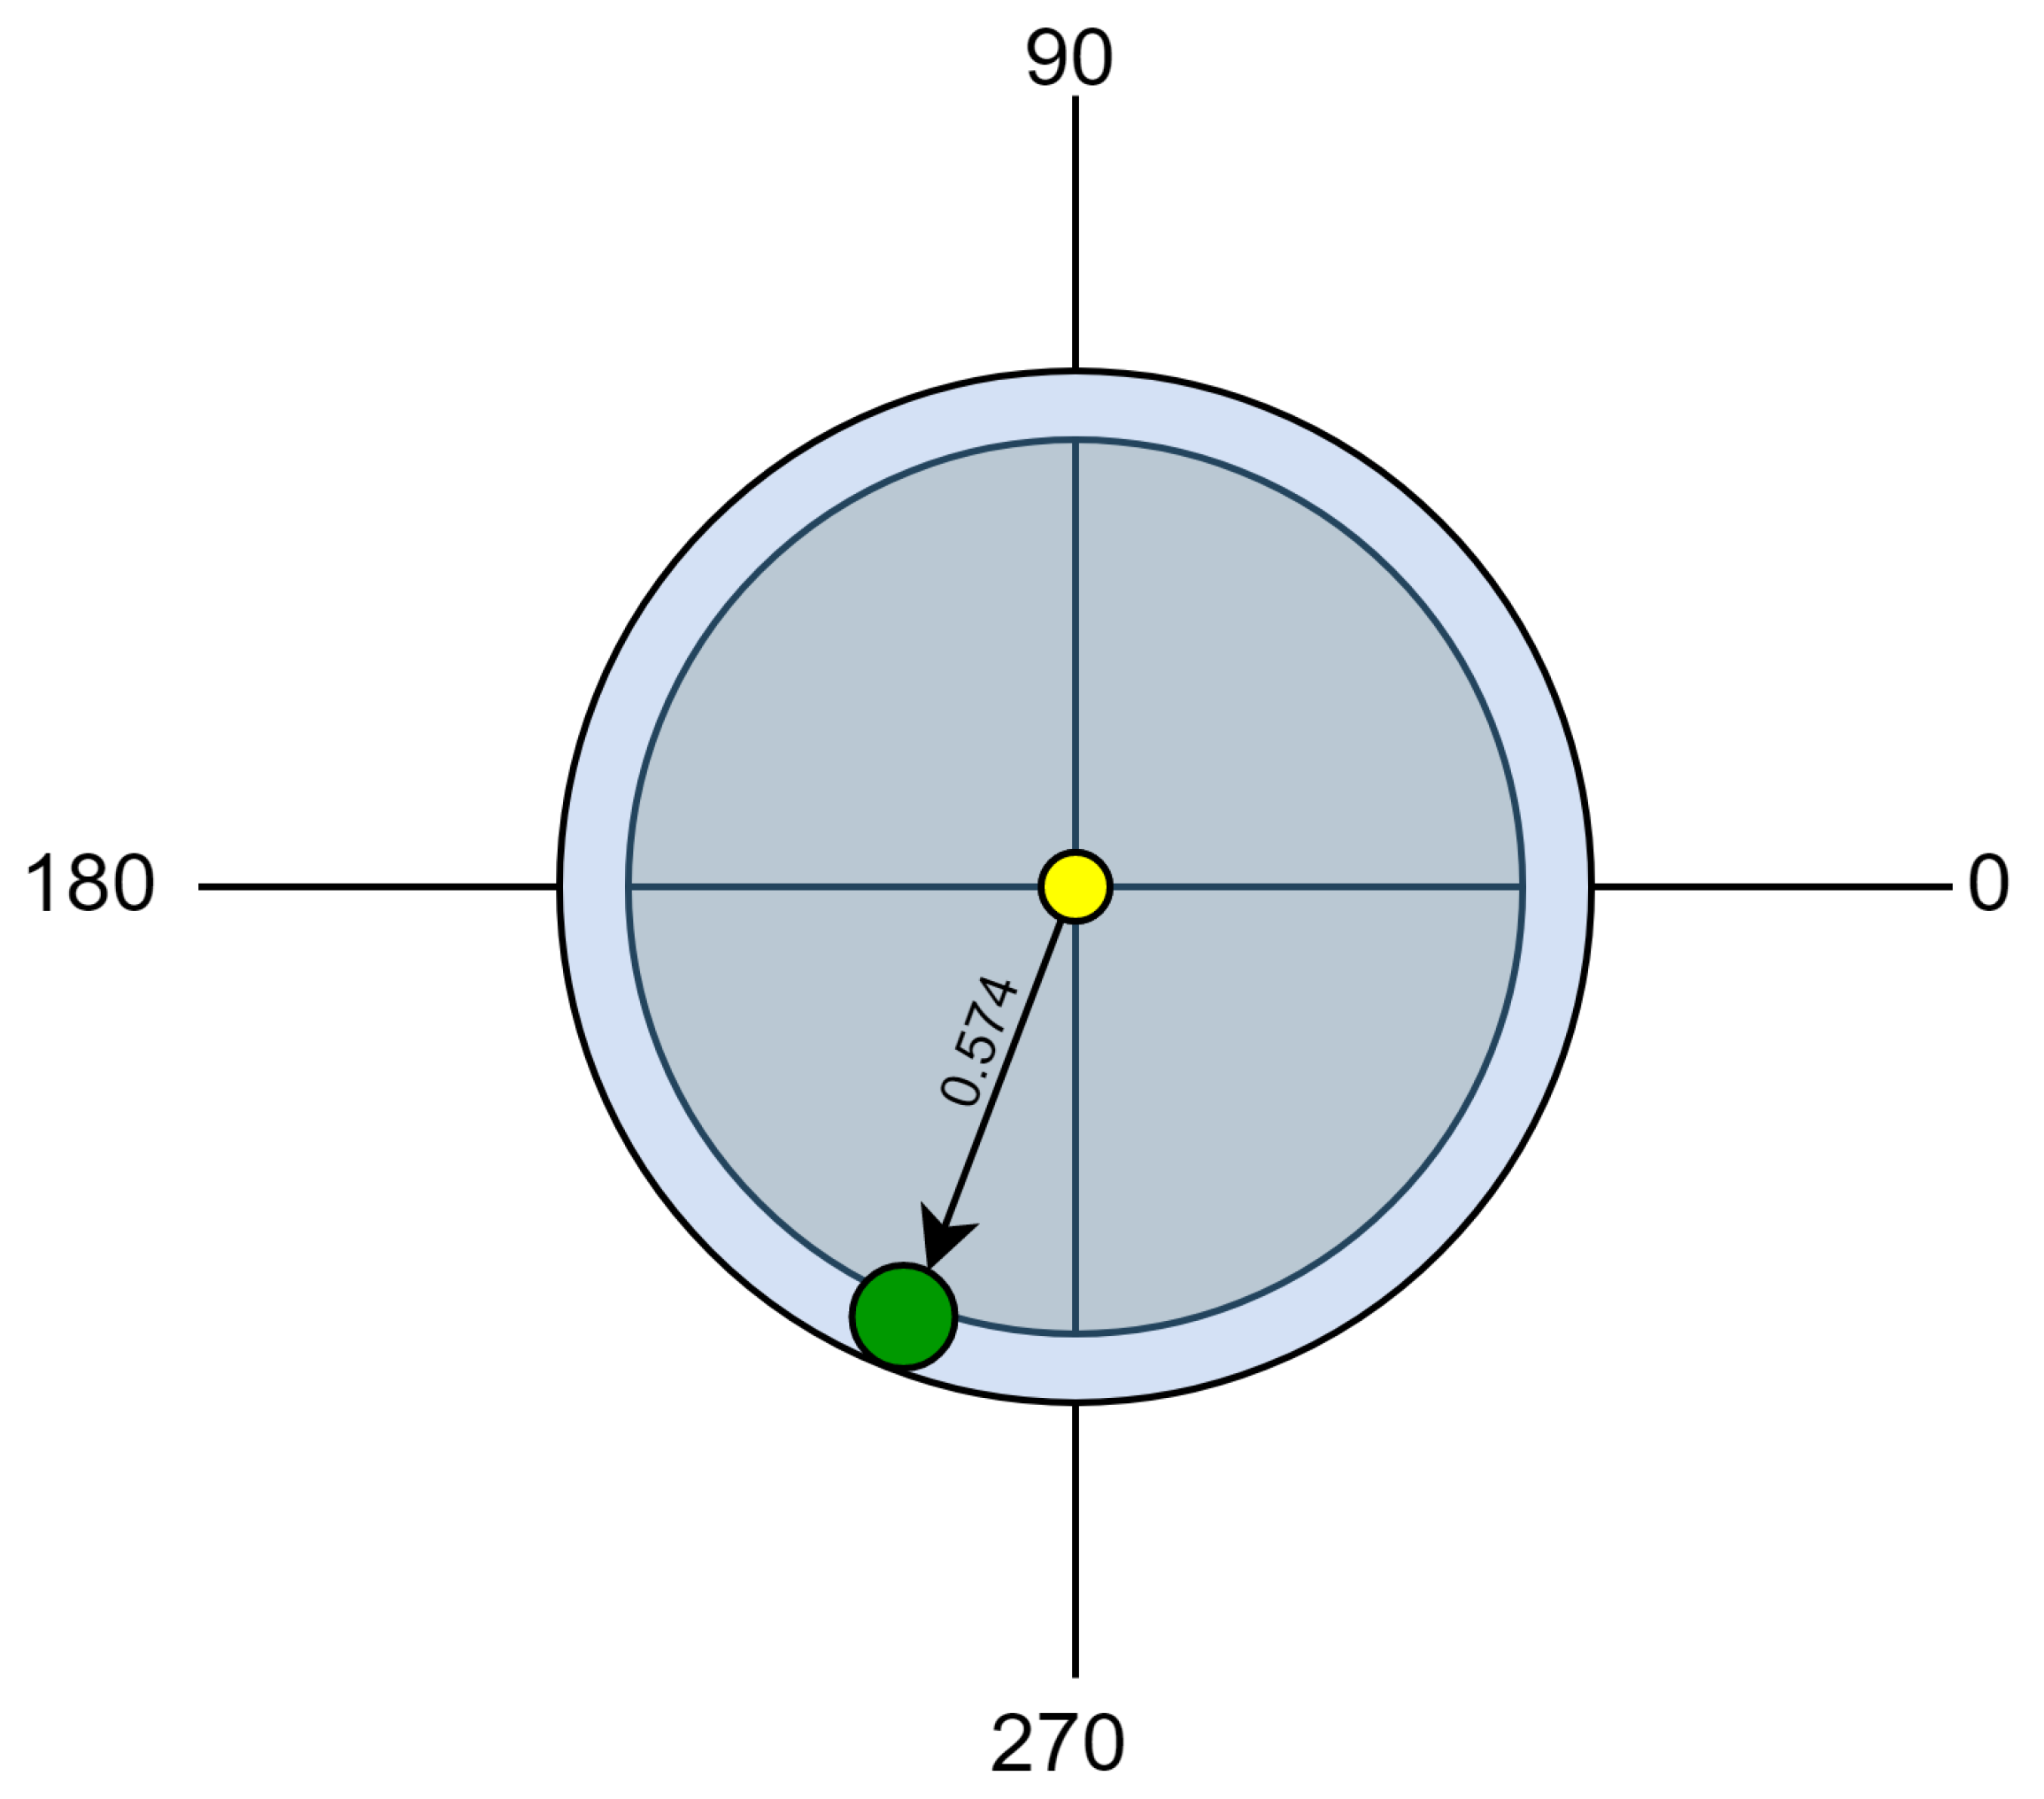
- Direction of the session is the estimate bearing of the line connecting the central node to a point between the entering point and exit point, relative to the x-axis.
- The central node represents the point in the center of Earth where the speed of rotation equals to zero.
3.2. Conditions
- The proposed model is based on the true solar day concept.
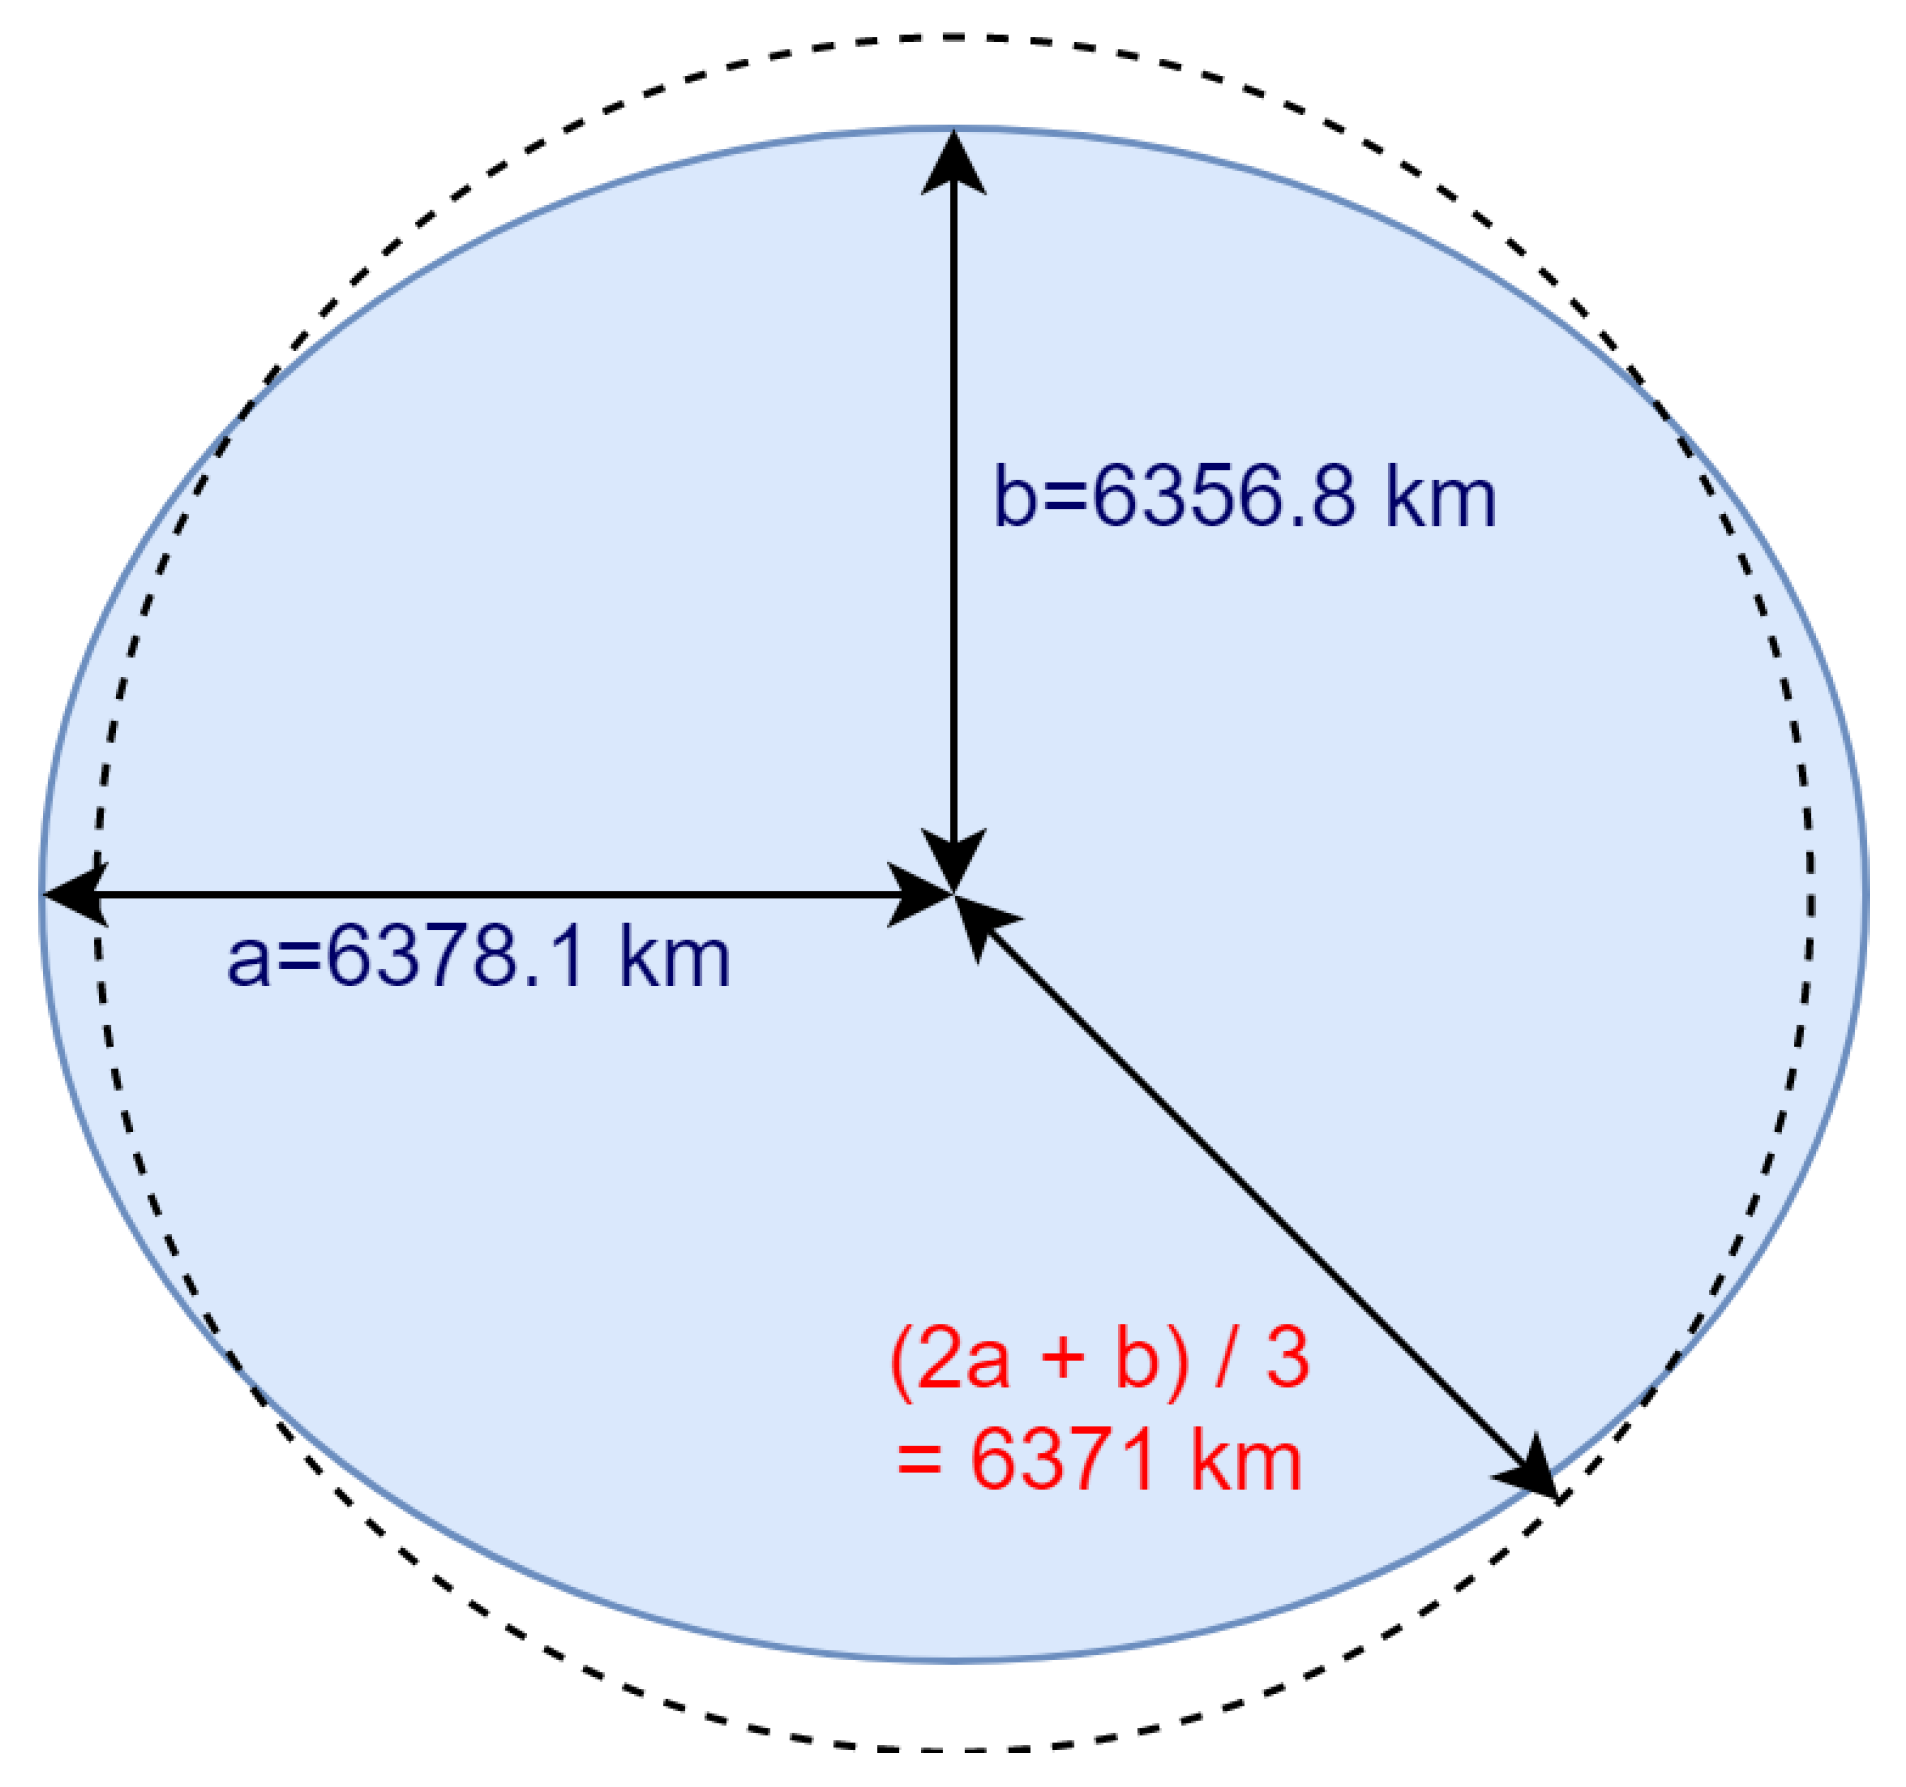
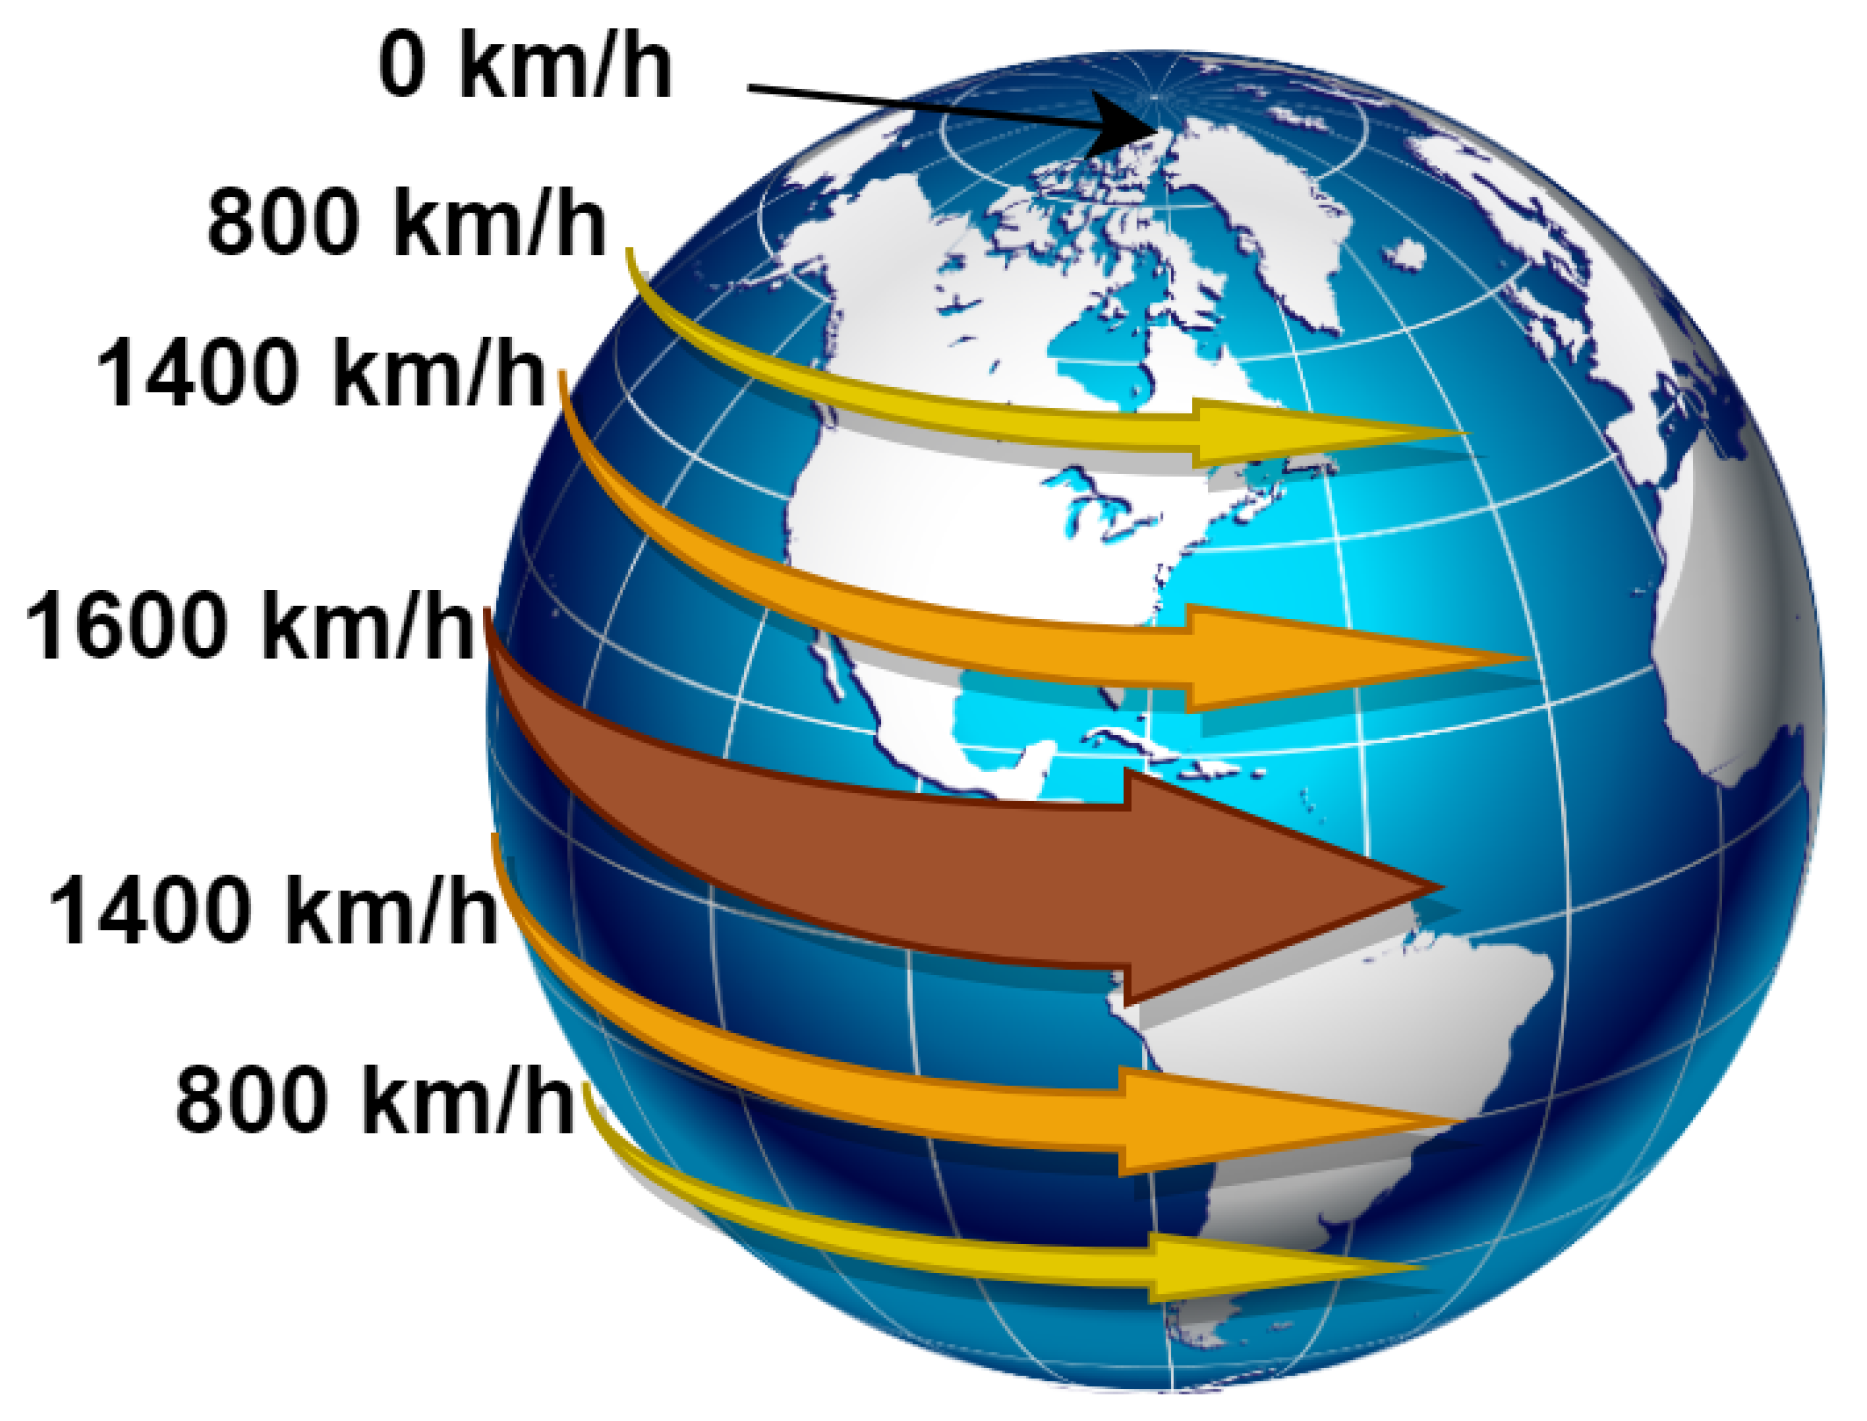
- The average rotation speed of the surface of Earth and the average radius of Earth are used in the proposed algorithm.
- As there are various different parameters used in the GRAFT model and algorithm, it is more suitable to present them in a tabular form. Table 1 presents those parameters.
3.3. Assumptions
- If all tasks were performed with all their cycles at the same session, then this would produce 100% force, because the direction of force produced by all performed cycles is the same, and the weight of the edge representing the session equals exactly 1 (i.e., the degree of force weakening is zero).
- Actuator ‘M’ that performs ‘c’ working cycles a day is better than actuator ‘N’ that performs the same number of cycles if M’s total net daily produced force is higher than N’s (for example, = 80% while = 75%). The reasons for the difference are locations of actuators, session times, or both.
- Edges of the graph indicate the direction of nodes from the center. This is done to make it easier to picture the idea of the mathematical trigonometric calculations of the net produced force. However, it is not important to consider whether the edges’ direction goes out of the source node to the termination nodes or in the opposite direction, because the net force will remain the same in both cases.
- The source node in GRAFT lies in the center of Earth and not on the North Pole. In fact, if the source node were thought of as located on the surface of the Earth, then its position would differ every second as Earth rotates about its axis.
4. The GRAFT Algorithm and a Case Study Application
- We introduce the suggested case study.
- We apply the GRAFT algorithm on the suggested case study, and explain each step of the proposed algorithm.
- We calculate the resultant daily net force produced.
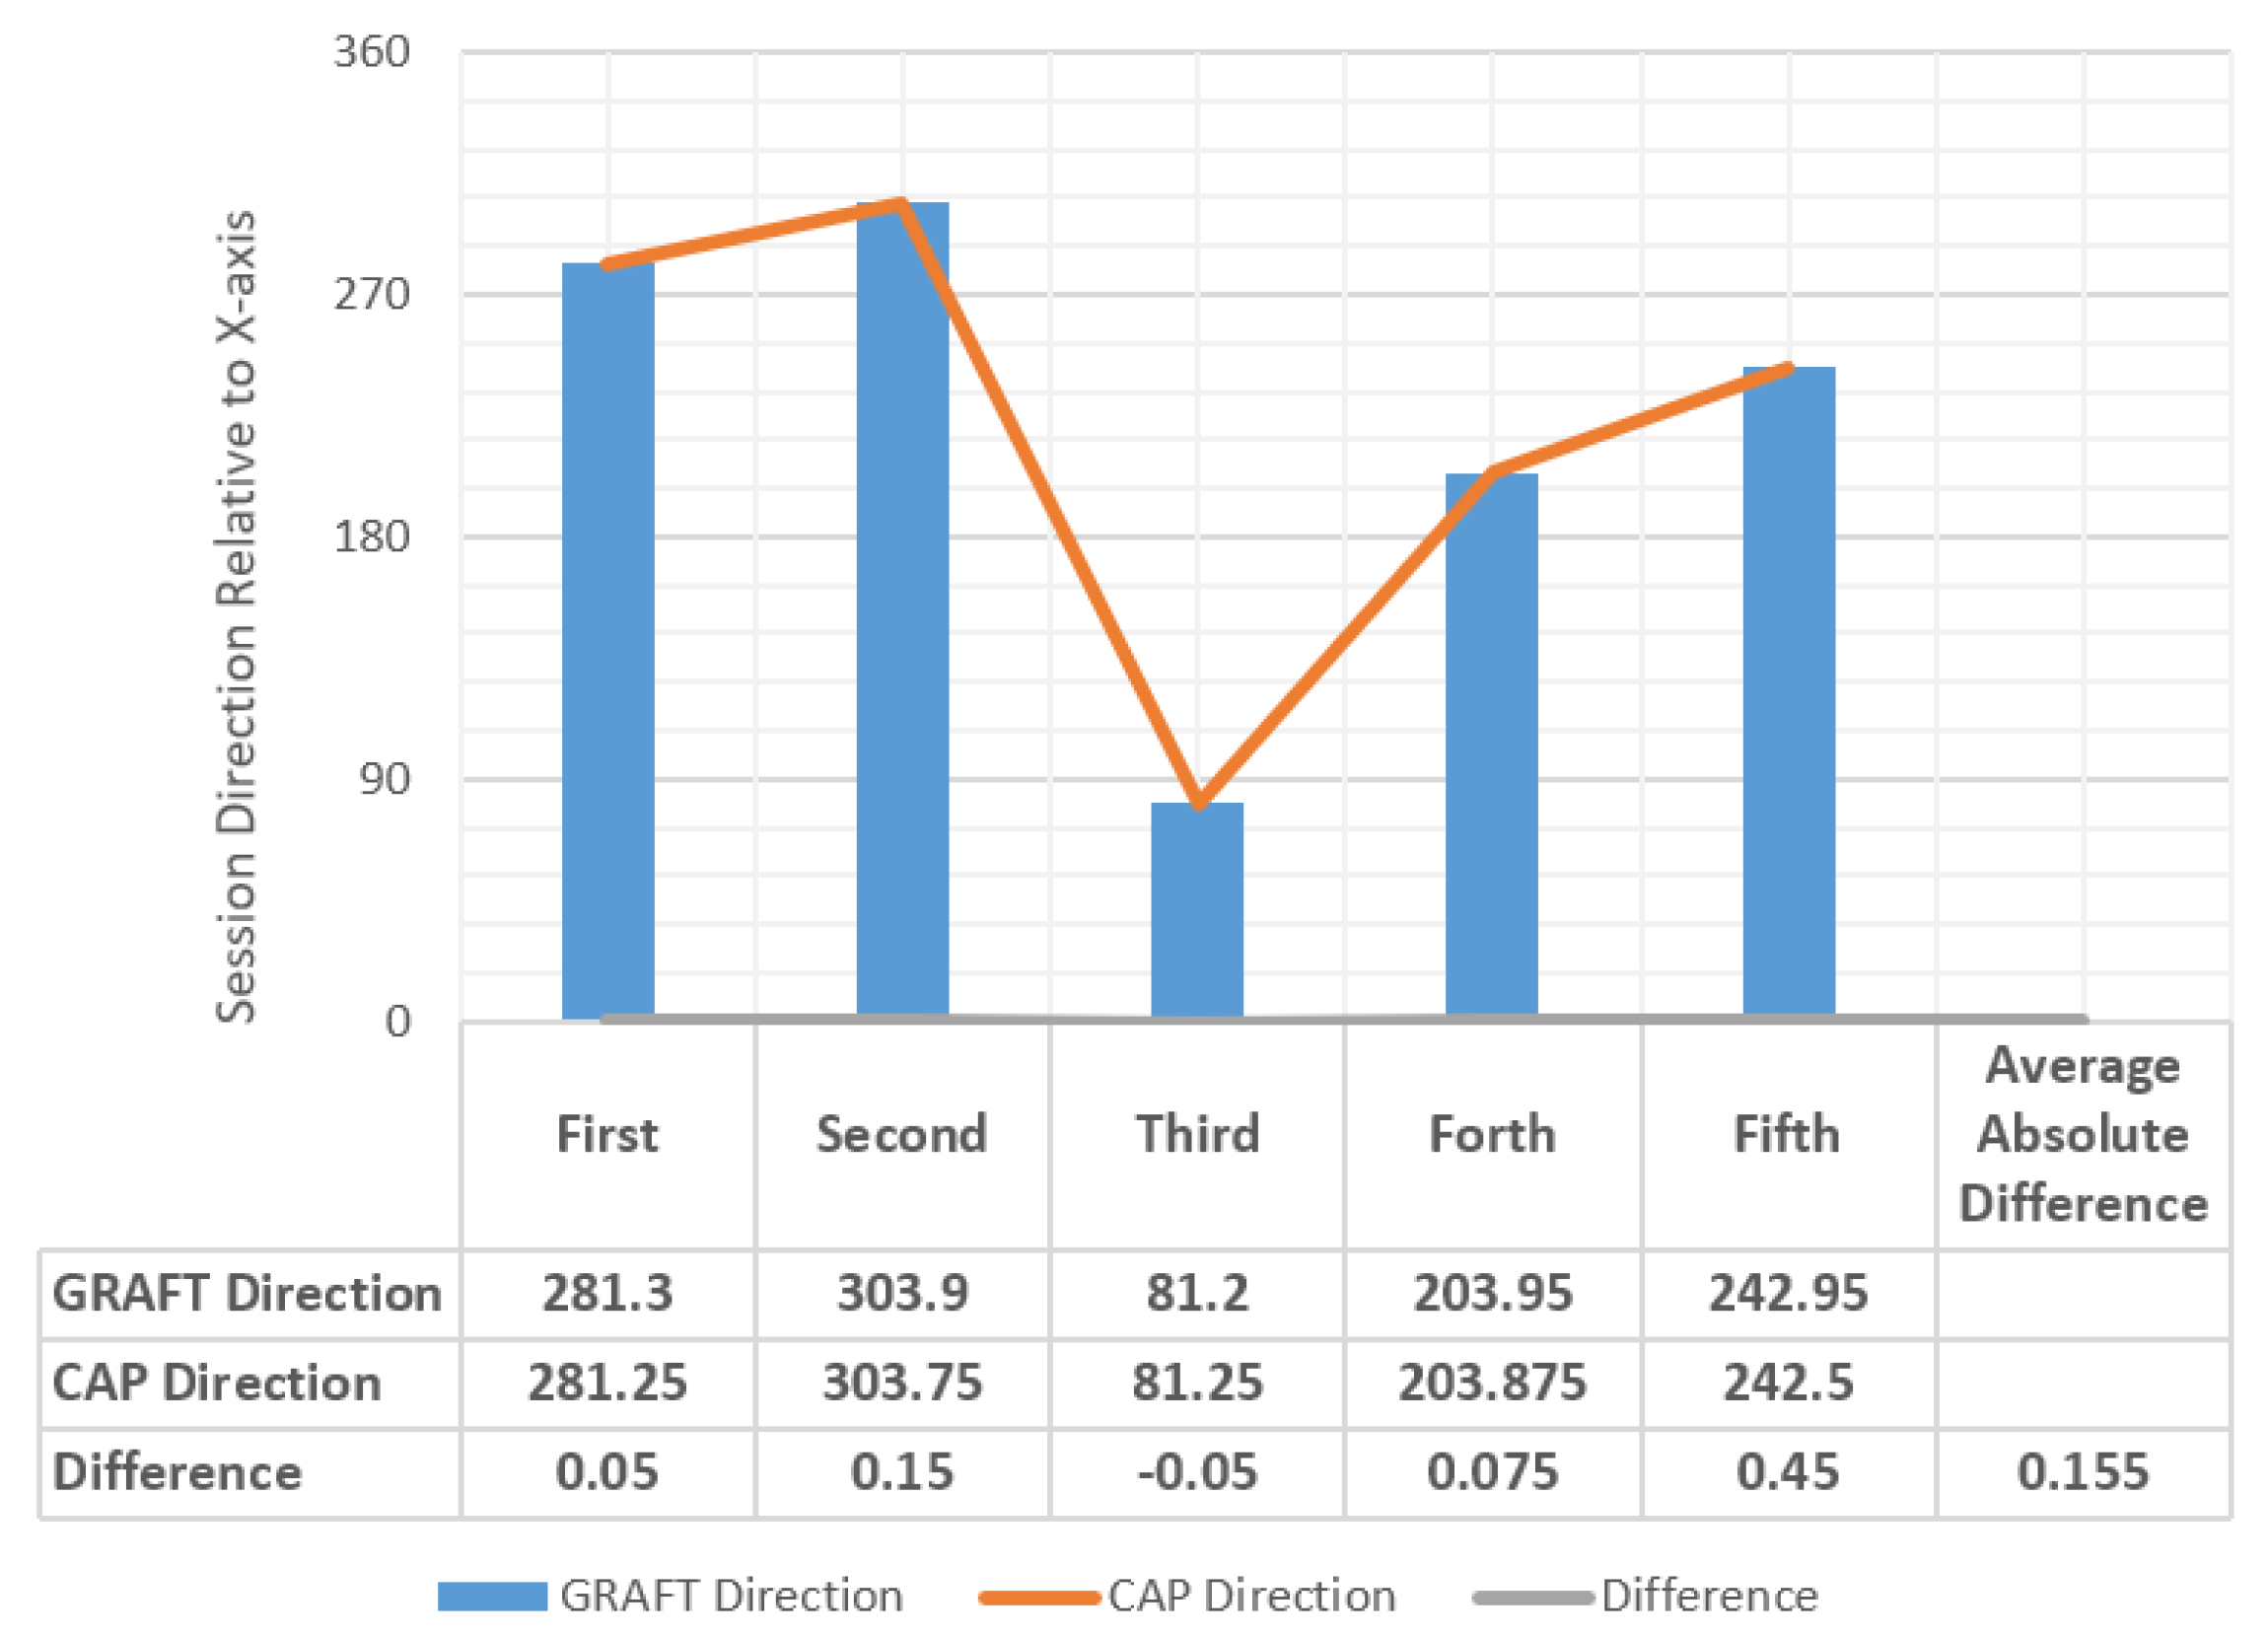
- We validate our method by comparing its results with the results obtained using the Clock-Angle-Problem formula.
4.1. The Suggested Case
4.2. Application
| Algorithm 1: The GRAFT algorithm. |
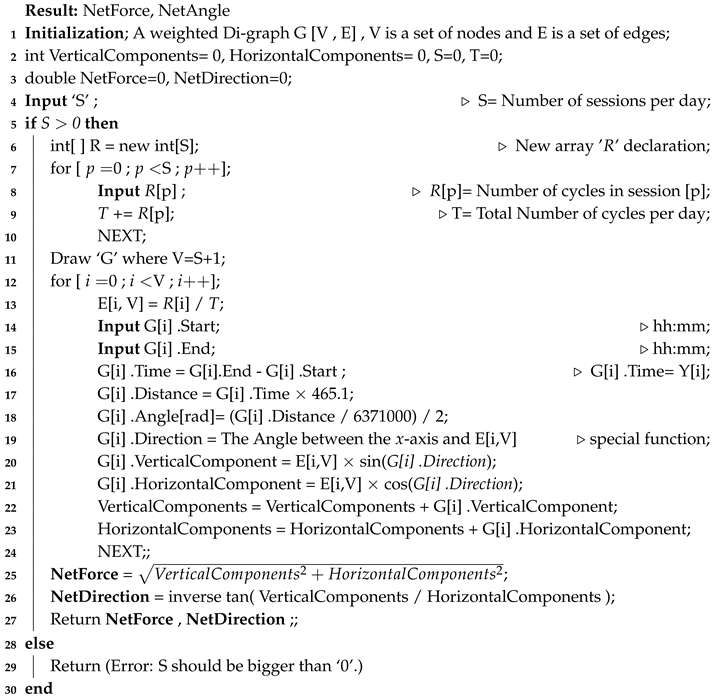 |
- (1)–(3): Initialize the variables of the algorithm.
- (4): User inputs the number of sessions in a day ‘S’.
- (5): The algorithm checks if the number of sessions ‘S’ equals one or more, otherwise the calculations will be meaningless.
- (6): Declare an array that will hold the values of cycles per session.
- (7)–(10): Start a for loop in which the user inputs the number of cycles per session, and consequently the algorithm computes the total number of cycles per day.
- (11): Draw the graph according to the number of sessions.
- (12)–(21): Start a for loop in which each session’s weight, vertical component, and horizontal component are calculated.
- –
- (13): Compute the weight of the session using Equation (1).
- –
- (14) and (15): User inputs the start and end times of the session.
- –
- (16): The algorithm computes the total time of the session accordingly.
- –
- (17): The algorithm computes the session’s distance. If both the rotational speed at a given point on the surface of Earth and the movement time between two points are known (computed in Step (16)), then the distance ‘’ traveled can be calculated from the relation of speed–distance–time. This relation defines the distance as the speed of movement multiplied by the time [43], as given in Equation (3). This means that an observed object that moves with speed ‘’ will pass the distance ‘’ in time of travel ‘’.The algorithm calculates each session’s distance ‘’. Session’s distance represents the traveling distance for an entity located on the surface of Earth, from the starting point of a session (west) to the ending point of the session (east). For the current example, the results of this step are shown in Column 4 of Table 3.
- –
- (18): Use the result of Step (17) to calculate the angle ‘’ in radians measured between two lines. The starting line of is the one connecting the central node to the starting point of session, and the ending line of is the one connecting the central node to the ending point of the same session. Angle is calculated according to Equation (4), which is clarified in Figure 6.The results of this step are provided in Column 6 of Table 3. The dividing-by-2 part in this step is done for partitioning the angle in half. That is, the direction typically appears between two lines; hence, one line is needed to represent the direction of the session (node) relative to the x-axis. The results of this are provided in Column 7 of Table 3.
- –
- (19): In this step, compute the direction ‘’ of the found edge in Step (18) relative to the x-axis. To do so, perform the following:
- *
- For the first session, the starting time is 18:00, hence the direction of the starting time relative to the x-axis is 270°. Consequently, the direction of the session equals 270 plus ().
- *
- For the second session, the direction equals the ending time direction of the first session (which is 270 + ) plus ().
- *
- For the third session, the ending time is 06:00, whose direction relative to the x-axis is 90°. Hence, the direction of the third session equals the direction of the ending time minus ().
- *
- For the fourth session, the starting time is 12:00, hence the direction of the starting time equals 180°. Consequently, the direction of the session relative to the x-axis equals 180 + ().
- *
- For the fifth session, the direction of the session equals the direction of the ending time of the fourth session (which is 180 + ) plus ().
- –
- (22)–(24): The algorithm in this step updates the values of the public variables “VerticalComponents” and “HorizontalComponents”, respectively, and moves to the next session.
- (25)–(27): Once the FOR sentence terminates, all needed values to find the total net produced force for all sessions become available. Using those values, the Pythagorean theorem, and classical trigonometric calculations, the algorithm computes the net force and its direction. Finally, the algorithm returns the public values NetForce and NetAngle in Step (27).
4.3. Results
4.4. Validation
| Algorithm 2: Clock-Angle-Problem. |
 |
4.5. Discussion
- The CAP formula and the GRAFT algorithm provide exactly the same results if and only if the system is deployed on a perfectly spherical planet.
- If the planet deviates from spherical symmetry, GRAFT gives more accurate and slightly different results compared with the results of CAP formula. Accordingly, we can draw conclusions regarding how spherical the planet is by comparing the results of GRAFT and CAP models.
- In the case of a planet that has a random shape, and not close enough to spherical symmetry, the CAP formula is not applicable. In such case, only GRAFT algorithm can provide the desired results. This is because we can simply use different radius measurement for each session.
5. Conclusions
Author Contributions
Funding
Conflicts of Interest
References
- United Nations. Report of the Conference of the Parties on its twenty-first session. In Proceedings of the UNFCC, Paris, French, 30 November–13 December 2015. [Google Scholar]
- IPCC. IPCC, 2018: Summary for Policymakers. In Global Warming of 1.5 °C. An IPCC Special Report on the Impacts of Global Warming of 1.5 °C Above Pre-Industrial Levels and Related Global Greenhouse Gas Emission Pathways, in the Context of Strengthening the Global Response to the Threat of Climate Change, Sustainable Development, and Efforts to Eradicate Poverty; World Meteorological Organization: Geneva, Switzerland, 2018; 32p. [Google Scholar]
- United Nations. Emissions Gap Report 2019; Technical Report; UN Environment Programme: Nairobi, Kenya, 2019. [Google Scholar]
- European Commission. Proposal for a Regulation of the European Parliament and of The Council Establishing the Framework for Achieving Climate Neutrality and Amending Regulation (EU) 2018/1999 (European Climate Law); Publications Office of the EU: Brussels, Belgium, 2020. [Google Scholar]
- European Comission. A Clean Planet for all A European Strategic Long-Term Vision for a Prosperous, Modern, Competitive and Climate Neutral Economy; Publications Office of the EU: Brussels, Belgium, 2018. [Google Scholar]
- Díaz, M.; Martín, C.; Rubio, B. State-of-the-art, challenges, and open issues in the integration of Internet of things and cloud computing. J. Netw. Comput. Appl. 2016, 67, 99–117. [Google Scholar] [CrossRef]
- Perera, C.; Bouguettaya, A.; Kanhere, S.; Liu, C.H. Guest Editorial: Introduction to the Special Section on Sensor Data Computing as a Service in Internet of Things. IEEE Trans. Emerg. Top. Comput. 2019, 7, 311–313. [Google Scholar] [CrossRef]
- Malik, S.; Ahmad, S.; Kim, D. A Novel Approach of IoT Services Orchestration Based on Multiple Sensor and Actuator Platforms Using Virtual Objects in Online IoT App-Store. Sustainability 2019, 11, 5859. [Google Scholar] [CrossRef]
- Lee, J.; Zhang, Y.; Dong, Q.; Lim, W.; Saligane, M.; Kim, Y.; Jeong, S.; Lim, J.; Yasuda, M.; Miyoshi, S.; et al. A Self-Tuning IoT Processor Using Leakage-Ratio Measurement for Energy-Optimal Operation. IEEE J. -Solid-State Circuits 2019, 55, 87–97. [Google Scholar] [CrossRef]
- Harper, R. Inside the Smart Home; Springer Science & Business Media: Berlin/Heidelberg, Germany, 2006. [Google Scholar]
- Su, K.; Li, J.; Fu, H. Smart city and the applications. In Proceedings of the 2011 International Conference on Electronics, Communications and Control (ICECC), Ningbo, China, 9–11 September 2011; pp. 1028–1031. [Google Scholar] [CrossRef]
- Liu, S.; Zhang, Y.; Liu, Y.; Wang, L.; Wang, X.V. An ‘Internet of Things’ enabled dynamic optimization method for smart vehicles and logistics tasks. J. Clean. Prod. 2019, 215, 806–820. [Google Scholar] [CrossRef]
- Abdellatif, A.A.; Mohamed, A.; Chiasserini, C.F.; Tlili, M.; Erbad, A. Edge computing for smart health: Context-aware approaches, opportunities, and challenges. IEEE Netw. 2019, 33, 196–203. [Google Scholar] [CrossRef]
- Guth, J.; Breitenbücher, U.; Falkenthal, M.; Leymann, F.; Reinfurt, L. Comparison of IoT Platform Architectures: A Field Study based on a Reference Architecture. In Proceedings of the 2016 Cloudification of the Internet of Things (CIoT), Paris, France, 23–25 November 2016; pp. 1–6. [Google Scholar] [CrossRef]
- Xia, F. QoS challenges and opportunities in wireless sensor/actuator networks. Sensors 2008, 8, 1099–1110. [Google Scholar] [CrossRef] [PubMed]
- Van de Panne, M.; Fiume, E. Sensor-actuator networks. In Proceedings of the 20th Annual Conference on Computer Graphics and Interactive Techniques, Anaheim, CA, USA, 2–6 August 1993; pp. 335–342. [Google Scholar]
- Mei, G.; Xu, N.; Qin, J.; Wang, B.; Qi, P. A Survey of Internet of Things (IoT) for Geo-hazards Prevention: Applications, Technologies, and Challenges. IEEE Internet Things J. 2019. [Google Scholar] [CrossRef]
- Cox, A.N. Allen’s Astrophysical Quantities; Springer: New York, NY, USA, 2015. [Google Scholar]
- Stephenson, F.R. Historical Eclipses and Earth’s Rotation; Cambridge University Press: Cambridge, UK, 2008. [Google Scholar]
- Moritz, H. Geodetic reference system 1980. J. Geod. 1980, 54, 395–405. [Google Scholar] [CrossRef]
- Green, B. The Fabric of the Cosmos: Space, Time, and the Texture of Reality; Alfred A. Knopf, Inc.: New York, NY, USA, 2004. [Google Scholar]
- Meeus, J.H. Astronomical Algorithms; Willmann-Bell, Incorporated: Richmond, VA, USA, 1991. [Google Scholar]
- Spohn, T.; Breuer, D.; Johnson, T. Encyclopedia of the Solar System; Elsevier: Iowa City, IA, USA, 2014. [Google Scholar]
- Hawking, S.; Hawking, S.W. The Universe in a Nutshell; Odile Jacob: Paris, France, 2001. [Google Scholar]
- Bondy, J.A.; Murty, U.S.R. Graph Theory With Applications; Macmillan: London, UK, 1976. [Google Scholar]
- Barabási, A.L. Network Science; Cambridge University Press: Cambridge, UK, 2016. [Google Scholar]
- Newman, M. Networks; Oxford University Press: Oxford, UK, 2018. [Google Scholar]
- Jansen, A.; Stevels, A. Human power: An environmental myth? In Proceedings of the TMCE, Lausanne, Switzerland, 12–14 April 2004; pp. 13–17. [Google Scholar]
- Planck, M. Treatise on Thermodynamics, 3rd ed.; Translated by A. Ogg from the Seventh German Edition Longmans; Green & Co: London, UK, 1927. [Google Scholar]
- Lehrman, R.L. Energy is not the ability to do work. Phys. Teach. 1973, 11, 15–18. [Google Scholar] [CrossRef]
- Chandrasekhar, S. Conservation laws in general relativity and in the post-Newtonian approximations. Astrophys. J. 1969, 158, 45. [Google Scholar] [CrossRef]
- Zimba, J. Force and Motion: An Illustrated Guide to Newton’s Laws; JHU Press: Baltimore, MD, USA, 2009. [Google Scholar]
- Badihi, B.; Del Carpio, L.F.; Amin, P.; Larmo, A.; Lopez, M.; Denteneer, D. Performance evaluation of IEEE 802.11 ah actuators. In Proceedings of the 2016 IEEE 83rd Vehicular Technology Conference (VTC Spring), Nanjing, China, 15–18 May 2016; pp. 1–5. [Google Scholar]
- Evangelatos, O.; Samarasinghe, K.; Rolim, J. Evaluating design approaches for smart building systems. In Proceedings of the 9th International Conference on Mobile Ad-Hoc and Sensor Systems (MASS 2012), Las Vegas, NV, USA, 8–11 October 2012; pp. 1–7. [Google Scholar]
- Jazayeri, M.; Liang, S.; Huang, C.Y. Implementation and evaluation of four interoperable open standards for the Internet of things. Sensors 2015, 15, 24343–24373. [Google Scholar] [CrossRef] [PubMed]
- Wark, T.; Crossman, C.; Hu, W.; Guo, Y.; Valencia, P.; Sikka, P.; Corke, P.; Lee, C.; Henshall, J.; Prayaga, K.; et al. The design and evaluation of a mobile sensor/actuator network for autonomous animal control. In Proceedings of the 6th International Symposium on Information Processing in Sensor Networks (IPSN), Cambridge, MA, USA, 25–27 April 2007; pp. 206–215. [Google Scholar]
- Palacios, P.; Córdova, A. Approximation and Temperature Control System via an Actuator and a Cloud: An Application Based on the IoT for Smart Houses. In Proceedings of the 2018 International Conference on eDemocracy & eGovernment (ICEDEG), Ambato, Ecuador, 4–7 April 2018; pp. 241–245. [Google Scholar]
- Bellot, T.D.P.M.P.; Mozzati, C. SAFE-Sensor & Actuator for Contextual Services and Predictive Maintenance A Low Cost Industrial IoT Implementation for Industry 4.0. In Proceedings of the International Conference on Software Engineering and their Applications (ICSSEA), Paris, France, 25–27 May 2016. [Google Scholar]
- Frank, A.; Kleidon, A.; Alberti, M. Earth as a hybrid planet: The Anthropocene in an evolutionary astrobiological context. Anthropocene 2017, 19, 13–21. [Google Scholar] [CrossRef]
- Xu, C.; Chao, B.F. Coseismic changes of gravitational potential energy induced by global earthquakes based on spherical-Earth elastic dislocation theory. J. Geophys. Res. Solid Earth 2017, 122, 4053–4063. [Google Scholar] [CrossRef]
- Kabir, E.; Kumar, P.; Kumar, S.; Adelodun, A.A.; Kim, K.H. Solar energy: Potential and future prospects. Renew. Sustain. Energy Rev. 2018, 82, 894–900. [Google Scholar] [CrossRef]
- Ferrándiz, J.M.; Navarro, J.F.; Escapa, A.; Getino, J. Earth’s Rotation: A Challenging Problem in Mathematics and Physics. Pure Appl. Geophys. 2015, 172, 57–74. [Google Scholar] [CrossRef]
- Elert, G. The Physics Hypertextbook. Found July 1998, 9, 2008. [Google Scholar]



| Parameter | Value | Notation |
|---|---|---|
| Rotational speed of Earth | Given | |
| Radius of Earth | Given | ℜ |
| Number of Sessions per day | Input by user | S |
| Number of Cycles in session ‘p’ | Input by user | R[p] |
| Start and End time of a session | Input by user | - |
| Session Time | Calculated by GRAFT Algorithm | |
| Weight of the Edge | Calculated by GRAFT Algorithm | W |
| Total number of cycles in a day | Calculated by GRAFT Algorithm | T |
| Force Produced by ‘R’ | Calculated by GRAFT Algorithm | A(R) |
| Force Produced by ‘T’ | Calculated by GRAFT Algorithm | A(T) |
| Traveled Distance | Calculated by GRAFT Algorithm | |
| Angle of The Session | Calculated by GRAFT Algorithm | |
| Direction of The Session | Calculated by GRAFT Algorithm |
| Session ‘p’ | R:T | |||
|---|---|---|---|---|
| First | 3 | 3:17 | 90 m | 0.1765 |
| Second | 4 | 4:17 | 90 m | 0.2353 |
| Third | 2 | 2:17 | 70 m | 0.1176 |
| Fourth | 4 | 4:17 | 191 m | 0.2353 |
| Fifth | 4 | 4:17 | 120 m | 0.2353 |
| Total | 17 | 17:17 | 561 m | 1.0000 |
| Session ‘p’ | ‘’ (m/s) | ‘’ (min. and sec.) | ‘’ (m) | ‘ℜ’(m) | ‘’ ° | (/2) | ‘’ ° |
|---|---|---|---|---|---|---|---|
| First | 465.1 | 90 m = 5400 s | 2,511,540 m | 6,371,000 | 22.6 | 11.3 | 281.3 |
| Second | 465.1 | 90 m = 5400 s | 2,511,540 m | 6,371,000 | 22.6 | 11.3 | 303.9 |
| Third | 465.1 | 70 m = 4200 s | 1,953,420 m | 6,371,000 | 17.6 | 8.8 | 81.2 |
| Fourth | 465.1 | 191 m = 11460 s | 5,330,046 m | 6,371,000 | 47.9 | 23.95 | 203.95 |
| Fifth | 465.1 | 120 m = 7200 s | 3,348,720 m | 6,371,000 | 30.1 | 15.05 | 242.95 |
| Task Number | Direction () | Weight (W) | Vertical Component | Horizontal Component |
|---|---|---|---|---|
| First | 281.3 | 0.1765 | 0.0346 | |
| Second | 303.9 | 0.2353 | 0.1312 | |
| Third | 81.2 | 0.1176 | 0.1162 | 0.018 |
| Fourth | 203.95 | 0.2353 | ||
| Fifth | 242.95 | 0.2353 | ||
| Total | - | 1.0000 |
© 2020 by the authors. Licensee MDPI, Basel, Switzerland. This article is an open access article distributed under the terms and conditions of the Creative Commons Attribution (CC BY) license (http://creativecommons.org/licenses/by/4.0/).
Share and Cite
Baniata, H.; Sharieh, A.; Mahmood, S.; Kertesz, A. GRAFT: A Model for Evaluating Actuator Systems in Terms of Force Production. Sensors 2020, 20, 1894. https://doi.org/10.3390/s20071894
Baniata H, Sharieh A, Mahmood S, Kertesz A. GRAFT: A Model for Evaluating Actuator Systems in Terms of Force Production. Sensors. 2020; 20(7):1894. https://doi.org/10.3390/s20071894
Chicago/Turabian StyleBaniata, Hamza, Ahmad Sharieh, Sami Mahmood, and Attila Kertesz. 2020. "GRAFT: A Model for Evaluating Actuator Systems in Terms of Force Production" Sensors 20, no. 7: 1894. https://doi.org/10.3390/s20071894
APA StyleBaniata, H., Sharieh, A., Mahmood, S., & Kertesz, A. (2020). GRAFT: A Model for Evaluating Actuator Systems in Terms of Force Production. Sensors, 20(7), 1894. https://doi.org/10.3390/s20071894


