Article

A Low-Cost Surge Current Detection Sensor with Predictive Lifetime Display Function for Maintenance of Surge Protective Devices

1
Department of Electrical Engineering, 100 Inha-ro, Michuhol-gu, Inha University, Incheon 22212, Korea
2
Sungjin Techwin Co., Ltd., 62, Yuseong-daero 877 beon-gil, Yuseong-gu, Daejeon 34127, Korea
*
Author to whom correspondence should be addressed.
Sensors 2020, 20(8), 2310; https://doi.org/10.3390/s20082310
Submission received: 3 March 2020 / Revised: 15 April 2020 / Accepted: 16 April 2020 / Published: 18 April 2020
(This article belongs to the Section Electronic Sensors)

Abstract

:
In this study, a low-cost surge current detection sensor (SCDS) that can measure high current surges using a low-current toroidal coil is proposed for maintenance of a surge protective device (SPD). The proposed SCDS is designed to display the predicted lifetime of the SPD based on the magnitude of surge current and number of surges. In addition, a method for measuring high surge current using a toroidal coil that can usually measure only low current is proposed. A lightning strike counter consists of a microcontroller with a low-power liquid crystal display (LCD) driver, 3 VDC lithium battery, and signal conditioning circuit that converts amplitude information of the surge current into duration information of a negative pulse to facilitate processing in the microcontroller. In this paper, we propose a software algorithm that can calculate the remaining lifetime of SPD based on the amplitude and number of surge currents. There is also an option to select the capacity of the surge protective device and the number of phase lines, allowing it to assess the predicted lifetime for various types of Class II SPDs. The proposed SCDS is measured as 7.2 μA from the battery power consumption test, and the service life is calculated to be 11.1 years. It meets the International Standard IEC62561-6 test conditions of the lightning strike counter and is expected to be useful in the maintenance of SPDs and lightning protection systems.

1. Introduction

Surge protective devices (SPDs) for low-voltage power distribution systems are essential for the operation of electrical systems. SPDs installed in building power distribution systems and industrial applications are generally used to ensure continuous operation [1]. SPDs eliminate electrical surges or impulses by acting as a low impedance path that turns the transient voltage into a current and shunts it along the return path, usually ground. By design, an SPD often acts as a ‘self-sacrifice’ device. In other words, the primary purpose of an SPD is to remove harmful voltage spikes from an electrical system even in conditions potentially harmful to the SPD. SPDs should not stop operating even if the circuit breaker is activated, the nearby system is damaged, or if there is smoke that causes a physical hazard to humans [2]. A metal oxide varistor (MOV) is widely used in low-voltage power systems as a core component in surge protectors because of its technical advantages and low cost. However, an MOV carries the risk of thermal runaway at the end of its lifetime. Thermal runaway tends to result in electrical hazards, such as short circuits or explosions. Thus, the MOV is designed with a thermal fuse spring or thermal fuse to prevent thermal runaway [3,4,5,6,7,8,9,10].
In the test list of the International Standard IEC61643-11 for surge protective devices, the thermal stability test is important for investigating the potential combustion and explosion of SPDs at the end of the MOV lifetime. The lifetime of the MOV is assessed by the amplitude of the surge current, the amount of energy, and the number of surges. The transient surge current flowing into the SPD is usually measured using a current transformer (CT) or Rogowski coil. CTs require a high current detection range and high frequency characteristics to measure transient surge currents, and they can cost thousands of dollars. The Rogowski coil is significantly less expensive, costing several hundred dollars, but is still relatively expensive compared to an SPD. Typical single-phase and three-phase Class II I n 20-kA SPDs cost less than one hundred dollars [11,12,13,14,15,16,17,18]. For this reason, SPDs are rarely used with devices that can estimate lifetime. For maintenance, SPDs are typically replaced by electrical facility managers when they are thought to be at the end of their lifetime based on verification through a status indicator. A remote-control method can identify the signal output from the remote terminals of the SPD, but it is rarely used as the installation of additional communication modules presents a cost issue. Another option is a surge counter can be installed in the SPD [19,20]. If lightning current above the critical current level flows in, the count of the surge counter increases. However, this does not indicate the remaining lifetime of the SPD. At the end of the lifetime of the SPD, it can no longer protect electrical devices from surges because it is separated from the electrical distribution system. Therefore, a device that can measure the predicted lifetime of an SPD at a market-acceptable cost is necessary. In this study, a surge current detection sensor (SCDS) with a reasonable cost is proposed that can estimate the remaining lifetime of an SPD. The proposed SCDS consists of a low-cost current sensor using small wound toroidal cores composed of iron powder, a signal conditioning circuit for converting the amplitude of a surge to duration width of a negative pulse for easy processing in a low-voltage microcontroller, a 3 V coin-cell battery, and a low-cost liquid crystal display (LCD) to predict the lifetime of the SPD based on the magnitude of surge currents and number of surges. In this study, we propose a low-cost SCDS and a predictive lifetime software algorithm for estimating the SPD predictive lifetime for the maintenance of the SPD.

2. Materials and Methods

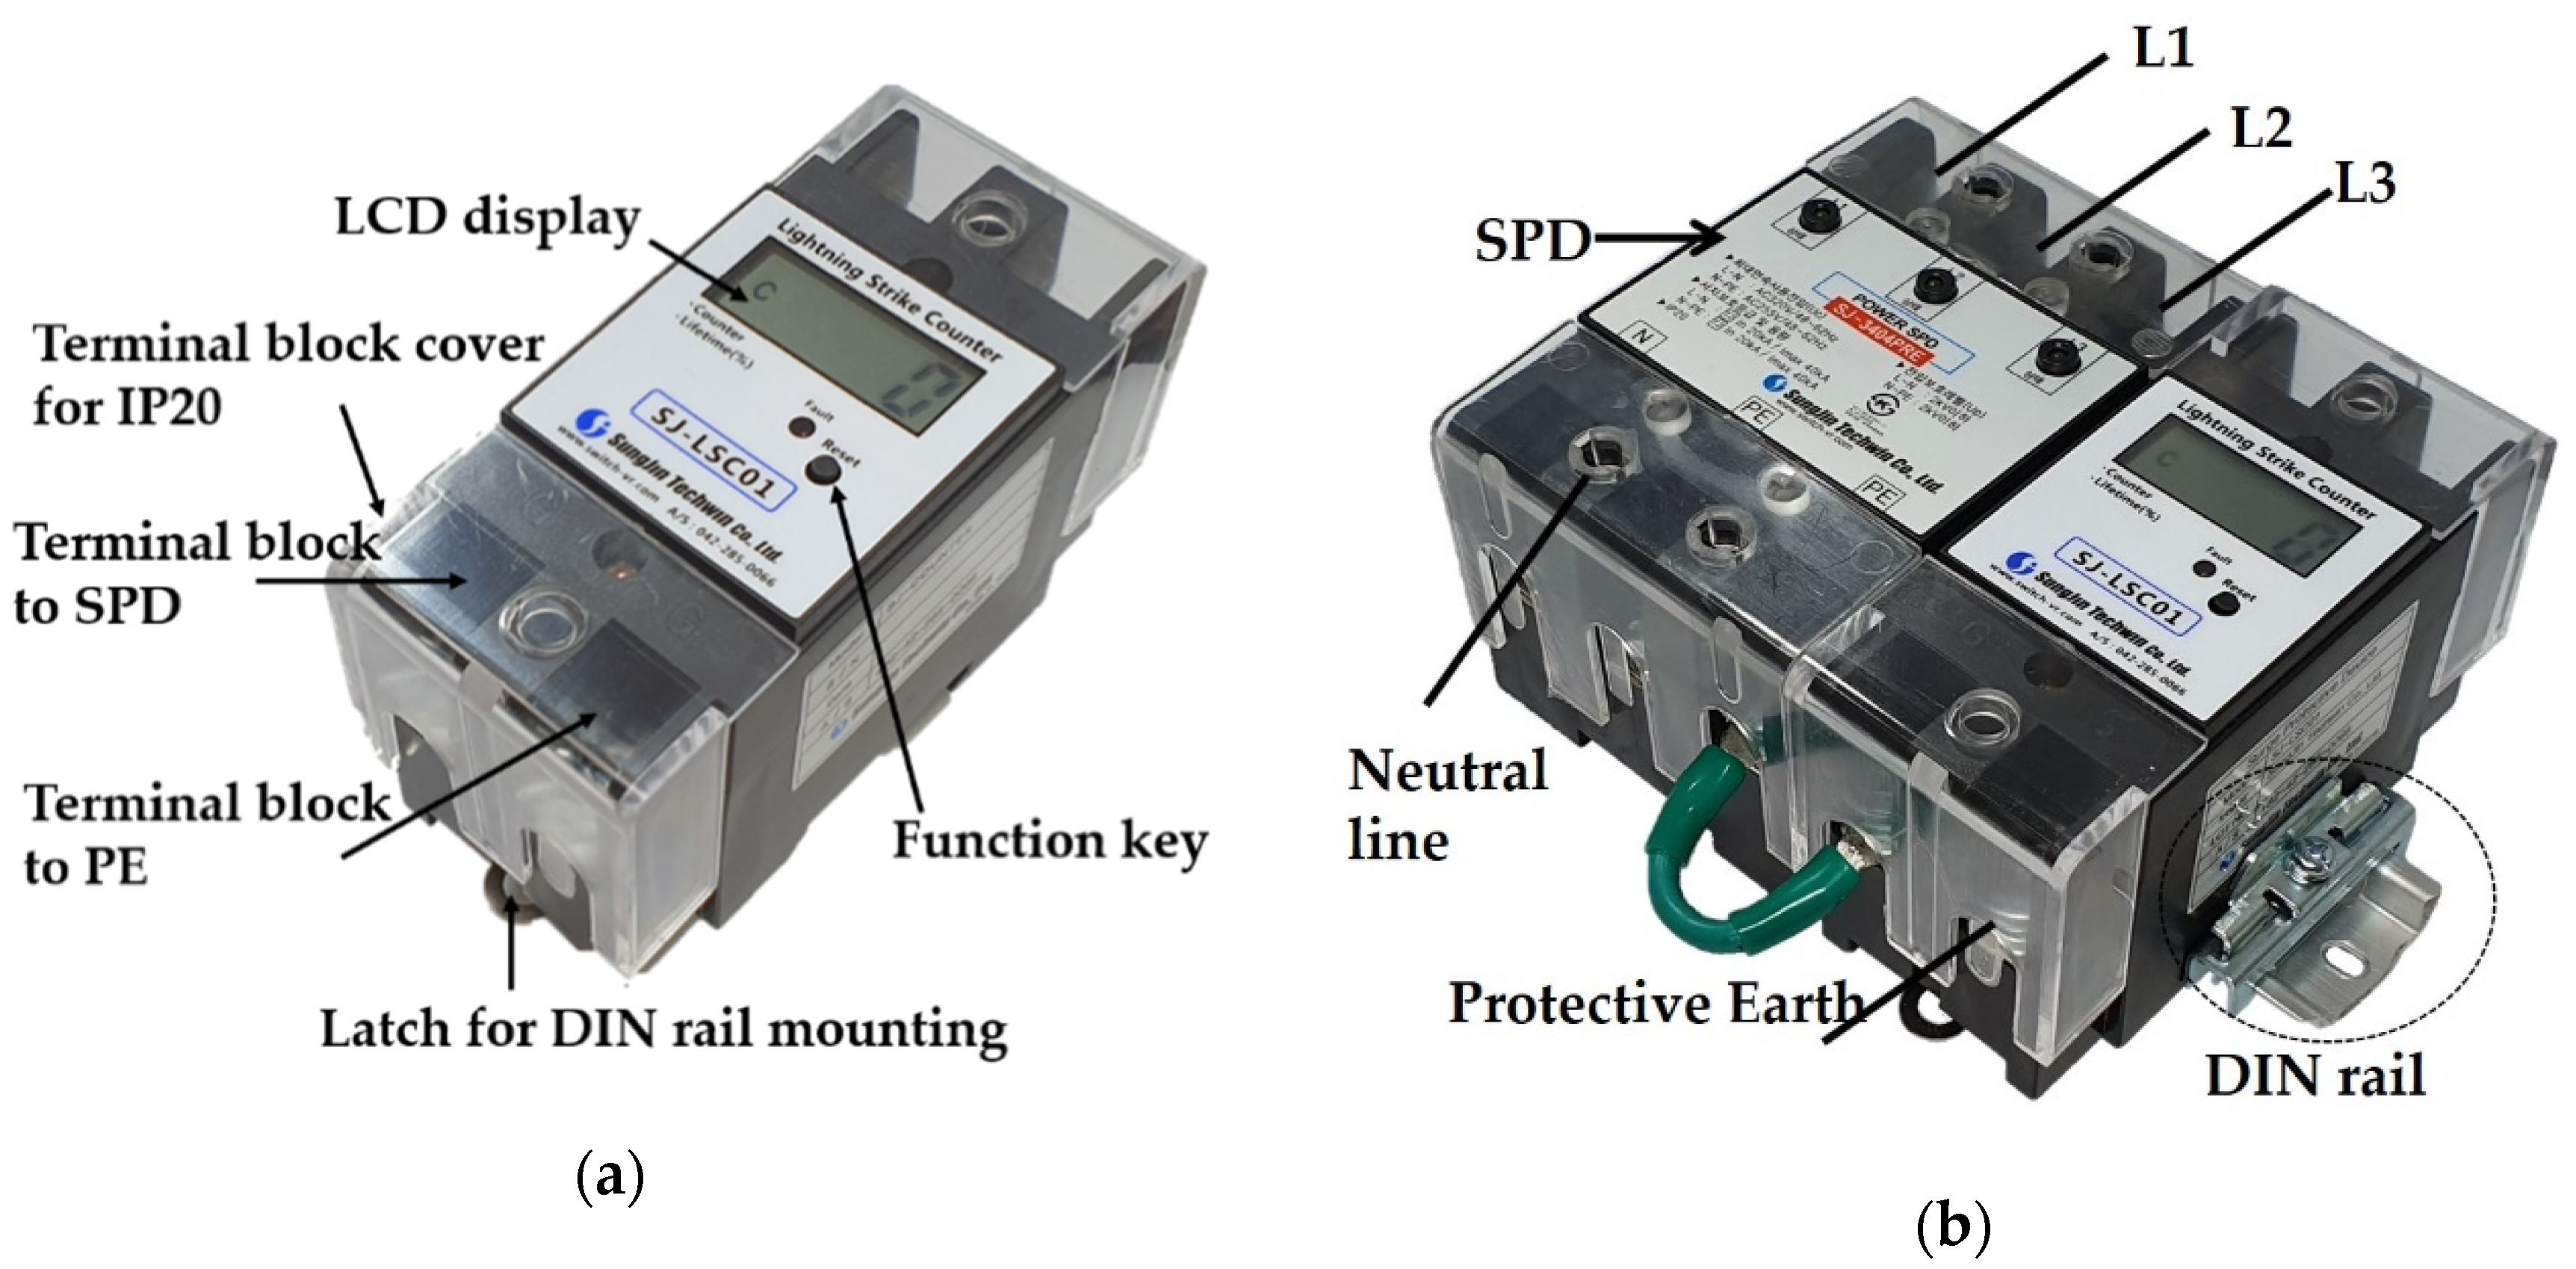
2.1. Mechanical Design

The proposed SCDS is relatively small, with a size of 50.0 mm × 106.0 mm × 68.4 mm. The enclosure is composed of flame-retardant plastic and has a Protective Earth (PE) terminal connected to ground and a PE connection terminal connected to the SPD. For protection from electrical shock, the SCDS has a terminal block cover that meets the IP20 waterproof and dustproof rating. IP20 requires that the conductors of the SCDS are protected from human contact. The SCDS also has an LCD window and a function key on the top. For installation, it can be mounted on an EN 60715 DIN rail, which is the widely used mounting standard for electric devices such as circuit breakers. Figure 1a presents an external image of the SCDS; an image of the SCDS installed with the SPD is shown in Figure 1b.

2.2. Block Diagram

Lightning causes transient surge voltage to the phase and neutral line of the SPD. The metal oxide varistor (MOV) and gas discharge tube (GDT) of the SPD limit the transient surge voltage and divert the surge current to PE. The surge current flows from the PE terminal of the SPD into PE through a low-cost current sensor using toroidal cores. The SCDS consists of the current sensor using toroidal cores with windings and a signal conditioning circuit for converting the amplitude of surge current to duration width of a negative pulse for microcontroller processing with a low operation voltage of 3 V. In addition, it uses a 3 V/1000 mAH coin-cell type battery for operation without an external power supply, and a low-cost liquid crystal display (LCD) to show the predictive lifetime of the SPD based on the amplitude of surge currents and the number of surges. Figure 2 shows the block diagram of the SCDS.
The interior consists of a current sensor PCB and a main PCB. The installed PCB is shown in Figure 3.

2.3. Lightning Surge

2.3.1. Classification of Surges

Surge transient voltages are caused by the switching operation (on/off) of electrical loads used in a building, and sometimes by magnetic and inductive coupling due to the formation of magnetic fields as large currents flow. Surges are also caused by static electricity and lightning strikes, which are classified as direct and induced lightning strikes. Direct lighting strikes travel directly through lightning rods or antennas and can damage electronic devices through high energy impulse-induced strike currents. When a direct lightning strike hits a line, the surge current is divided into two parts by the flow direction. The surge voltage is determined by the surge impedance of the line and the surge current [12].
V = Z × I 2
where V is the surge voltage, Z is the surge impedance of the line, and I is the surge current. Assuming a surge current of 10 kA and a surge impedance of 400 Ω, the surge voltage is calculated to be 2000 kV by Equation (1). Owing to changes in the electromagnetic field that occur during lightning strikes, surges can also occur on power lines that are far from the lightning strike. The surge voltage of the induced lightning can be obtained from [12]
V = 30 × k × ( h d ) × I
where V is the prospective surge voltage, I is the lightning current, h is the height above the ground of the conductors, k is a factor depending on the velocity of the return stroke of the lightning strike path, and d is the distance away from the lightning strike. The value of k generally lies in the range of 1.0–1.3. For example, the surge voltage caused by a lightning strike at a distance of 1 km under a surge current of 10 kA and a line height of 5 m is calculated to be 1.5 kV. High surge voltage is also generated by an induced lightning strike. A direct lightning current may amount to hundreds of kA, which can cause damage from induced lightning strikes at a distance of tens of km. Damage to electronic devices caused by lightning strikes is usually from induced lightning. Therefore, to prevent damage caused by lightning strikes, an SPD is used as indoor lightning protection in buildings [12]. The international standard waveforms of lightning surge current for direct and induced lightning strikes are depicted in Figure 4, and associated parameters are presented in Table 1 [11,12].
Here, O 1 is the virtual origin, I is the peak current, T 1 is the front time, and T 2 is the time to half value. I i m p is the impulse discharge current, the SPD capacity of Class I that can withstand a 10/350 μs surge current flowing through the SPD. I n is the nominal discharge current, which is the SPD capacity of Class II that can withstand an 8/20 μs surge current flowing through the SPD.

2.3.2. Lifetime of MOV

The derating curves of the I n 20 kA MOV (manufactured by TDK Electronics) used as a core component in Class II SPDs are presented in Figure 5 [21], where I n is an 8/20 μs current that flows through the SPD and is the nominal discharge current for a Class II SPD. Figure 5 shows that the number of endurable surges is determined by the amplitude of the surges and their duration time. For a duration time of 20 μs, the rated number of surges exponentially increases as the amplitude of the surge current decreases. The lifetime of the MOV can be calculated based on the amplitude and number of surge currents.

2.4. Toroidal Coil Type Current Sensor and Signal Conditioning Circuit Design

2.4.1. Toroidal Coil Type Current Sensor

Generally, surge current is detected using a current transformer (CT). To measure high surge current, a Rogowski coil or a large current transformer (CT) with good frequency characteristics is used. However, CTs are costly and not economical. Thus, three inexpensive toroidal cores (Part No. C27-B11) from Core Electronics composed of ordinary iron powder are used [22]. The toroidal current sensor with a 1.2 winding of 11 turns around the toroidal core is shown in Figure 6. The material and dimensions of the toroidal core are presented in Table 2.

2.4.2. Signal Conditioning Circuit

The signal conditioning circuit used for the detection of the surge current prevents magnetic saturation of the toroidal core and converts the amplitude of the surge current to the duration width of a negative pulse. The signal conditioning circuit diagram is shown in Figure 7.
The voltage V 1 induced on the secondary side by the surge current I to the PE on the primary side of the toroidal coil is proportional to the time derivative of the magnetic flux.
V 1 = n A × B t
where n is the number of secondary windings, A is the area of the core’s cross section, and B is the magnetic flux, which is proportional to surge current I. Generally, iron toroidal coils are not used to measure high-surge current due to magnetic saturation. However, in Figure 7, the PE terminals are directly connected as shown by the thick line (American Wire Gauge, AWG9), and the thin line (AWG21) is connected through the center of the toroidal coil to prevent magnetic saturation. Magnetic saturation is prevented because the direct connection depicted by the thick line carries high current, and the connection depicted by the thin line through the toroidal coil carries low current. The resistance value of AWG21 is approximately 16 times higher than that of AWG9. Moreover, the cable length of AWG21 is twice the length of AWG9. The resistance can be calculated as [23]
R = ρ l A ,
where R is the resistance, ρ is the resistivity, A is the area of the cross section, and l is the length.
The current flowing in the wire is governed by Kirchhoff’s Current Law [24]. Thus, magnetic saturation of the toroidal core with high current surges is prevented. The area of the cross section, resistance, and current distribution rate according to cable length are shown in Table 3. The proposed method can withstand current up to 30 times the maximum current that can be measured by the toroidal core.
In the International Standard IEC61643-11, the maximum surge currents allowed in lines of the SPD in Class I and Class II are I i m p 25 kA and I n 20 kA, respectively. The currents of I and i divided from the total surge current flowing through the path of PE are presented in Table 4, and examples of the current distribution according to single-phase and three-phase power are illustrated in Figure 8 [11,12].
The magnetic saturation threshold of the surge current (8/20 μs) flowing through the toroidal coil is 3.3 kA, as measured by an experiment. Thus, a current of up to 100 kA can be measured by the SCDS. Because the output voltage may be high proportional to the current, the V 2 voltage is reduced by connecting R 1 (100 Ω) in series with the output of the toroidal coil. The bridge diode ( B D 1 ) is used to detect both positive and negative surge voltages using the R3000 from RECTRON Semiconductor. Considering the high surge voltage input, a component with the maximum repetitive peak reverse voltage is chosen. The peak voltage of the surge is charged through C 1 and discharged through R 2 and R 3 —there is no other discharge path. The output of the signal conditioning circuit is a negative pulse whose duration width is proportional to the amplitude of the surge current. T V S 1 is used to protect the Q 1 2N2222 NPN transistor. The collector of Q 1 yields 3 V, recognized as logic high in normal conditions. The voltage of V 3 is logic low when it is above the threshold voltage of Q 1 (typically 0.7 V). R 4 is a pull up resistor, and C 2 is used to reduce noise and chattering. Let V 3 , p e a k be the peak value of V 3 . Then, we have the following relationship for the collector output of Q 1 :
T = R 2 R 3 R 2 + R 3 C 1 × ln ( V 3 , p e a k V t h )
where T is duration width (surge detection interrupt time) of the logic low state of a negative pulse used as an input to the microcontroller, R 2 is 1 MΩ, R 3 is 100 kΩ, C 1 is 0.1 μF, V 3 , p e a k is the peak voltage charged to C 1 , and V t h is the cut-off voltage between the base and the emitter of the Q 1 2N2222 NPN transistor and is approximately 0.2 V. V 1 , p e a k and V 3 , p e a k of the current transformer (toroidal coil) according to the amplitude of the surge current, and the time duration T were measured through an experiment and are shown in Table 5. Figure 9 illustrates the output characteristics of the signal conditioning circuit.
The output of the current transformer (toroidal coil) due to the surge current is proportional to the time derivative of the surge current, as shown in Equation (3). The test setup is shown in Figure 10.
The output waveforms measured using three cores and distribution of current using the AWG9 and AWG24 cables showed no magnetic saturation at 100 A and 1.6 kA, as shown in Figure 11a,b. The output waveform measured using one core and without current distribution does not show magnetic saturation at 100 A, as shown in Figure 11c, but magnetic saturation was observed at 1.6 kA, as shown in Figure 11d.
The test equipment used in this experiment is shown in Table 6. As the secondary side of the toroidal coil has a different reference point from the ground of the signal conditioning circuit, it was measured using a high-voltage differential probe [25,26].
Figure 12 illustrates the manner by which the amplitude information of the surge current is translated to the duration width of a negative pulse generated by the signal conditioning circuit. The amplitude of voltage V 3 is converted to T. As the V 3 voltage amplitude increases, the converted T increases, as shown in Equation (4), making processing easier in the microcontroller.

2.5. Calculation Principle of the Predictive Lifetime and Software Algorithm for the Expected Lifetime of the SPD

2.5.1. Calculation Principle of the Predictive Lifetime of the SPD

The predictive lifetime of the SPD using the SCDS proposed in this study can be calculated based on the lifetime of the MOV. The lifetime in the derating curves of the MOV decreases in proportion to the square of the current, as shown in Table 7. It can be expressed as a trend line, as shown in Figure 13.
The equation of the trend line of the MOV lifetime can be represented as
N = α x β
where x is the inverse of the square of current applied to the MOV, and N is the endurable number of surges. The constants α and β were found to be 5,012,836,137 and 2, respectively. Therefore, Equation (6) can be rewritten as
N = α ( 1 i m o v 2 ) β
The calculation principle for the predictive lifetime of the SPD in the proposed SCDS can be expressed as
L n + 1 = L n 1 N
where L n + 1 is the estimated value of the SPD lifetime after the surge input, L n is the SPD lifetime value before the surge input, and the initial value of L n is 1 ( L 0 = 1 ) . Furthermore, 1 N is the decrease in the lifetime of the MOV according to the surge input, where N is determined from Equation (7). By substituting Equation (7) into Equation (8), the equation can be written as
L n + 1 = L n 1 α ( 1 i m o v 2 ) β
i m o v can be expressed as Equation (10), depending on the number of phase lines.
i m o v = I t o t a l P n
where I t o t a l is the total surge current flowing from all phase lines to the PE path, and P n is the total number of phase lines.
The final equation for the predictive lifetime can be expressed as
L n + 1 = L n 1 α ( P n 2 I t o t a l 2 ) β

2.5.2. Software Algorithm for the Predictive Lifetime of the SPD

As power is applied to the SCDS, the microcontroller’s timer, interrupt, and embedded electrically erasable programmable read-only memory (EEPROM) are initialized. The surge count data of the EEPROM is read and displayed on the LCD, and sleep mode is activated to minimize battery power consumption. When the function key is pressed, the microcontroller exits sleep mode and displays the predictive lifetime of the SPD for five seconds. The surge count is displayed again, and the microcontroller returns to sleep mode. If surge interrupt is detected as ‘low (0 V)’ from the signal conditioning circuit in the main loop, the ‘low (0 V)’ holding time is measured by the internal 61-μs timer (2/clock: 32.768 kHz) and translated to the amplitude of the surge current. If the surge amplitude is below 500 A, it will be ignored, according to Table 8. If the surge current is above 500 A, the predictive lifetime of the SPD will be recalculated using the surge current amplitude. The number of surges and predictive lifetime are stored on the internal EEPROM. The increased surge count is displayed on the LCD. The software algorithm for the predictive lifetime of the SPD is shown in Figure 14.
The proposed SCDS displays the surge count on the LCD in normal conditions. If a surge current is detected or the function button is pressed briefly, the lifetime is displayed for five seconds and the surge count is displayed. The display windows are designed as shown in Figure 15.
Figure 15a shows the surge count mode; ‘C’ on the left side indicates count mode. Figure 15b shows the lifetime mode; ‘L’ on the left side indicates lifetime mode. If the lifetime is less than 10%, ‘F’ in the upper left corner will be displayed, indicating the end of lifetime, as shown in Figure 15c.
The proposed SCDS is designed to be used with various types of SPD. When the function key of the SCDS is pressed for more than ten seconds, it activates the SPD selection mode. A short press of the function key changes the SPD mode and pressing for more than three seconds selects it. The SPD selection mode is shown in Figure 16. The four numbers shown on the LCD are SPD model names. The first two numbers indicate single-phase (22) or three-phase (34) operation. The last two numbers indicate the capacity of the SPD; 04 indicates 20-kA capacity, and 08 indicates 40-kA capacity.

3. Results

3.1. Expected Lifetime of the SPD

IEC62561-6 Test Results

The IEC62561-6 international standard specifies requirements and tests for devices that count surges. Surge counters can be installed and used on the conductor of the LPS (lightning protection system) or the SPD. According to this standard, the operating threshold current I t c of the surge counter is defined as 500 A when used with the SPD and 1 kA when used with the LPS. The surge counter should not operate at half value of I t c . I m c w is the maximum surge current that the surge counter can withstand. Typical values are shown in Table 8 [27].
In the proposed SCDS, the value of I t c was designed to be 500 A, according to Table 8. LSS-15AX (15 kV, 7.5 kA) by Noiseken was used for generation of surges. The results of the experiment meet the requirements of IEC62561-6, as shown in Table 9 [27].
I m c w was also tested by the National Accredited Certification Body and the SSG Series from HAEFELY was used for generation of the impulse current. Operation was normal with no damage when the tests were performed by applying 8/20 μs 100 kA surge current to the SCDS. Surge currents of both polarities were tested.

3.2. Results of the Predictive Lifetime Test of the SPD

To test the predictive lifetime of the SPD, the SCDS, configured as a three-phase four-wire system, was connected, and the lifetime reduction test was performed by an authorized institution using an impulse current generator (SSG Series) to vary the current amplitude. The test results are shown in Table 10, with error tolerances within 10%.

3.3. Battery Power Consumption Test Results

The proposed SCDS is powered by a built-in 3 V coin-cell type battery without an external power supply, so it can be operated at ultra-low power for a long period of time. For the power consumption test, a PAS40-18 (40 V/18 A) from KIKUSHI Electronics Corp (Kanagawa County, Japan). was used as a power supply, and a GDM-8261A by GWINSTEK (Xinbei, Taiwan) was used as an ampere-meter. Figure 17 shows the test setup.
After applying 3 VDC from the power supply, the measured current in sleep mode was approximately 7.2 μA and the measured current in wakeup mode was approximately 100 μA. The wakeup mode period is 75 ms at 20 kA. Assuming that the SCDS is detected 100 times at 20 kA, it is 7.5 s, so it can be regarded as not affecting the power consumption of the battery. And the battery life was calculated to be 11.1 years, as shown in Equation (12) [28]. Thus, the target lifetime of seven years (typically the maximum lifetime of an SPD) is guaranteed.
B a t t e r y   L i f e = B a t t e r y   C a p a c i t y   ( m A H ) C u r r e n t   C o n s u m p t i o n   ( m A ) × 0.7 ÷ ( 24   ( h o u r ) × 365 ( d a y ) ) 11.10   y e a r s
In Equation (12), a constant of 0.7 is used as a margin factor to consider environmental conditions of humidity and temperature.

4. Discussion

It has been confirmed that the proposed SCDS operates according to the amplitude of lightning surge currents and has a current detection error tolerance of approximately 10%. In practical applications, tolerances near 10% are not particularly critical. Currently, lifetime indicators are rarely used owing to relatively high cost compared to the SPD, and low-cost surge counters are used instead. The surge counters count detections of current above the threshold surge current, but do not indicate the lifetime of the SPD. Table 11 shows a comparison of performance, cost, and market applicability for the proposed SCDS with commonly used lightning counters and other SCDSs.

5. Conclusions

In this study, we proposed a low-cost surge current detection sensor, which can predict lifetime for maintaining surge protective devices by detecting the amplitude of surge currents and number of surges. The proposed SCDS improves on conventional surge counters that display only the number of surges. The proposed SCDS uses a low-cost toroidal coil to measure the surge current, and a new measurement method to solve the problem of magnetic saturation caused by high surge current. In addition, we proposed both a method and a software algorithm for calculating the predictive lifetime of an SPD in a microcontroller through a signal conditioning circuit that converts the amplitude of the surge current into the duration width of a negative pulse. The proposed SCDS is expected to greatly improve the maintenance efficiency of SPDs. In future research, we plan to study the predictive lifetime of a communication SPD.

Author Contributions

Conceptualization, Y.L. and Y.S.L.; methodology, Y.L.; software, Y.L.; validation, Y.L.; formal analysis, Y.L.; investigation, Y.L.; writing—original draft preparation, Y.L.; writing—review and editing, Y.L. and Y.S.L; supervision, Y.S.L.; project administration, Y.L.; funding acquisition, Y.S.L. and Y.L. All authors have read and agreed to the published version of the manuscript.

Funding

This work was supported by Inha University Research Grant.

Acknowledgments

The authors would like to thank Ki Won Choi and Kyu Hong Shim for helping with the test and data collection.

Conflicts of Interest

The authors declare no conflict of interest.

References

  1. Wetter, M.; Finis, G.; Sander, C.; Joerres, S. Smart IoT monitoring system for surge protective devices (SPDs). In Proceedings of the IEEE 11th Asia-Pacific International Conference on Lightning (APL), Hong Kong, China, 12–14 June 2019. [Google Scholar]
  2. Chiste, A.; Kladar, D. Electronic systems protection via advanced surge protective devices. In Proceedings of the 2002 IEEE Industry Applications Conference, 37th IAS Annual Meeting (Cat. No. 02CH37344), Pittsburgh, PA, USA, 13–18 October 2002; Volume 3, pp. 2244–2247. [Google Scholar]
  3. Jeoung, T.H.; Kim, Y.S.; Nam, S.P.; Lee, S.H.; Kang, J.W.; Kim, J.C.; Lee, S.G. Development of thermal runaway preventing ZnO varistor for surge protective device. J. Nanosci. Nanotechnol. 2014, 14, 8957–8960. [Google Scholar] [CrossRef] [PubMed]
  4. Khanmiri, D.T.; Ball, R.; Lehman, B. Degradation Effects on Energy Absorption Capability and Time to Failure of Low Voltage Metal Oxide Varistors. IEEE Trans. Power Deliv. 2016, 32, 2272–2280. [Google Scholar] [CrossRef]
  5. Lee, B.H.; Li, F. Effect of the injected number and amplitude of 8/20 [us] impulse current on the life of ZnO varistors. J. Korean Inst. Illum. Electr. Install. Eng. 2007, 21, 118–124. [Google Scholar]
  6. Tsukamoto, N.; Ishii, M. Repetitive Impulse Withstand Performance of Metal-Oxide Varistors. IEEE Trans. Power Deliv. 2016, 32, 1674–1681. [Google Scholar] [CrossRef]
  7. De Salles, C.; Martinez, M.L.; de Queiroz, Á.A. Ageing of metal oxide varistors due to surges. In Proceedings of the 2011 International Symposium on Lightning Protection, Fortaleza, Brazil, 3–7 October 2011; pp. 171–176. [Google Scholar]
  8. Amicucci, G.L.; D’Elia, B. Reliability of surge protective devices stressed by lightning. J. Electrostat. 2004, 60, 247–256. [Google Scholar] [CrossRef]
  9. Eilers, K.W.; Wingate, M.; Pham, E. Application and safety issues for transient voltage surge suppressors. IEEE Trans. Ind. Appl. 2000, 36, 1734–1740. [Google Scholar]
  10. The International Electrotechnical Commission. IEC 61643-331, Components For-Low-Voltage Surge Protective Devices—Part 331: Performance Requirements and Test Method for Metal Oxide Varistors (MOV); IEC: Geneva, Switzerland, 2007. [Google Scholar]
  11. The International Electrotechnical Commission. IEC 61643-11, Low-Voltage Surge Protective Devices—Part 11: Surge Protective Devices Connected to Low-Voltage Power Systems—Requirements and Tests; IEC: Geneva, Switzerland, 2011. [Google Scholar]
  12. The International Electrotechnical Commission. IEC 61643-12, Low-Voltage Surge Protective Devices—Part 12: Surge Protective Devices Connected to Low-Voltage Power Systems—Selection and Application Principles; IEC: Geneva, Switzerland, 2008. [Google Scholar]
  13. Kawabata, T.; Yanagawa, S.; Takahashi, H.; Yamamoto, K. A development of a shunt lightning current measuring system using a Rogowski coil. In Proceedings of the 2013 International Symposium on Lightning Protection (XII SIPDA), Belo Horizonte, Brazil, 7–11 October 2013; pp. 283–286. [Google Scholar]
  14. Araújo, L.; Visacro, S. Low-cost Systems for Measurement of Lightning-Currents Provided with Remote Access. In Proceedings of the 34th International Conference on Lightning Protection (ICLP), Rzeszow, Poland, 2–7 September 2018; pp. 1–6. [Google Scholar]
  15. Hussein, A.M.; Janischewskyj, W.; Milewski, M.; Shostak, V.; Chisholm, W.; Chang, J.S. Current waveform parameters of CN tower lightning return strokes. J. Electr. 2004, 60, 149–162. [Google Scholar] [CrossRef]
  16. Ward, D.A.; Exon, J.L.T. Using Rogowski coils for transient current measurements. Eng. Sci. Educ. J. 1993, 2, 105–113. [Google Scholar] [CrossRef]
  17. Li, Y.; Guo, Y.; Long, Y.; Yao, C.; Mi, Y.; Wu, J. Novel lightning current sensor based on Printed Circuit Board Rogowski coil. In Proceedings of the 2012 International Conference on High Voltage Engineering and Application, Shanghai, China, 17–20 September 2012; pp. 334–338. [Google Scholar]
  18. Alibaba. Available online: https://korean.alibaba.com/trade/search?fsb=y&IndexArea=product_en&CatId=&SearchText=surge+protective+device (accessed on 2 November 2019).
  19. Sungjin Techwin Co., Ltd. Available online: http://www.switch-vr.com/eng/sub/prodcut_protection.php?checkfi=73 (accessed on 15 April 2020).
  20. Otowa Electric Co., Ltd. Available online: https://www.otowadenki.co.jp/eng/products/spd3/ (accessed on 15 April 2020).
  21. Datasheet of Metal Oxide Varistor. Available online: https://www.tdk-electronics.tdk.com/en/1321012/products/product-catalog/protection-devices/voltage-protection/strap-varistors--epcos- (accessed on 8 November 2019).
  22. Core Electronics Co., Ltd. Available online: http://www.emicore.co.kr/EN/index.php?mm_code=78&sm_code=89&board_no=1 (accessed on 2 November 2019).
  23. Electrical Resistivity and Conductivity. Available online: https://en.wikipedia.org/wiki/Electrical_resistivity_and_conductivity (accessed on 2 November 2019).
  24. Kirchhoff’s Current Law. Available online: https://en.wikipedia.org/wiki/Kirchhoff%27s_circuit_laws (accessed on 2 November 2019).
  25. Lightning Surge Simulator LSS-15AX. Available online: http://www.noiseken.com/modules/products/index.php?content_id=194 (accessed on 2 November 2019).
  26. Impulse Current Generator SSG Series. Available online: http://www.haefely.com/2133781.html (accessed on 2 November 2019).
  27. The International Electrotechnical Commission. IEC 62561-6, Lightning Protection System Components (LPSC)—Part 6: Requirements for Lightning Strike Counters (LSC); IEC: Geneva, Switzerland, 2018. [Google Scholar]
  28. Battery Life Calculator. Available online: https://www.digikey.kr/en/resources/conversion-calculators/conversion-calculator-battery-life (accessed on 2 November 2019).
Figure 1. (a) Surge current detection sensor (b) Example of surge current detection sensor installed with a surge protective device (SPD).
Sensors 20 02310 g001
Figure 2. Block diagram of the proposed surge current detection sensor (SCDS).
Sensors 20 02310 g002
Figure 3. PCBs of the SCDS.
Sensors 20 02310 g003
Figure 4. (a) Direct lightning surge current waveform (b) Induced lightning surge current waveform.
Sensors 20 02310 g004
Figure 5. Derating curves of I n 20 kA metal oxide varistor (MOV).
Sensors 20 02310 g005
Figure 6. (a) Shape of toroidal core (b) Toroidal current sensor.
Sensors 20 02310 g006
Figure 7. Signal conditioning circuit for detecting the surge current.
Sensors 20 02310 g007
Figure 8. Example circuit for maximum surge current that flows through the PE path.
Sensors 20 02310 g008
Figure 9. Output characteristics of signal conditioning circuit.
Sensors 20 02310 g009
Figure 10. Experimental test setup for secondary output of toroidal coil type current transformer of SCDS.
Sensors 20 02310 g010
Figure 11. (a) Secondary output characteristics of a toroidal coil type current sensor with three cores and current distribution using AWG9 and AWG24 wires when the surge current was 100 A. No magnetic saturation was observed; (b) Secondary output characteristics of a toroidal coil type current sensor with three cores and current distribution using AWG9 and AWG24 wires when the surge current was 1.6 kA. No magnetic saturation was observed; (c) Secondary output characteristics of a toroidal coil type current sensor that used one core and did not distribute current when the surge current was 100 A. No magnetic saturation was observed; (d) Secondary output characteristics of a toroidal coil type current sensor that used one core and did not distribute current when the surge current is 1.6 kA. Magnetic saturation was observed.
Sensors 20 02310 g011
Figure 12. Amplitude of surge current and duration width of negative pulse generated by signal conditioning circuit.
Sensors 20 02310 g012
Figure 13. Trend line of MOV lifetime according to surge current and number of surges.
Sensors 20 02310 g013
Figure 14. Software algorithm for the predictive lifetime of the SPD.
Sensors 20 02310 g014
Figure 15. (a) Surge count mode (b) Lifetime mode (c) End of lifetime mode.
Sensors 20 02310 g015
Figure 16. (a) I n 20-kA single-phase SPD selection mode (b) I n 20-kA three-phase SPD selection mode (c) I n 40-kA single-phase SPD selection mode (d) I n 40-kA three-phase SPD selection mode.
Sensors 20 02310 g016
Figure 17. (a) Battery consumption test setup (b) Battery consumption test configuration.
Sensors 20 02310 g017
Table 1. Parameters of lightning surge current waveforms.
Lightning Surge CurrentT1 [μs]T2 [μs]SPD ClassSPD Capacity
Direct10350class I I i m p
Induced820class II I n
Table 2. Dimensions and material characteristics of three toroidal cores.
Part No.Inner Diameter Outer DiameterHeightMaterialFrequency Range
C27-B1114.48 mm26.92 mm11.1 × 3 mmIron powder and small other mixtures500 kHz
Table 3. American Wire Gauge (AWG) 9 and AWG24 characteristics.
AWGCross-Sectional Area (mm2)Resistance (Ω/m)Cable Length (mm)Connection Resistance (Ω)Current Distribution Rate (%)
96.630.0026300.001≅97
240.2050.0842600.029≅3
Table 4. Maximum Surge current values according to single-phase and three-phase power that flow through the Protective Earth (PE) path.
DescriptionNumber of Power LinesMaximum Surge Current
(Induced, 8/20 μs, In 20 kA)
Maximum Surge Current
(Direct, 10/350 μs, Iimp 25 kA)
Single-phase2 (line, neutral): i3Total 40 kATotal 50 kA
I38.67 kA48.34 kA
i1.33 kA1.66 kA
Three-phase4 (R, S, T, neutral): i5Total 80 kATotal 100 kA
I77.34 kA96.67 kA
i2.66 kA3.33 kA
Table 5. Experimental data of V 1 , p e a k , V 3 , p e a k , and T for different amplitudes of surge current.
Lightning Surge Current (kA)T (ms) V 1 , p e a k   ( V ) V 3 , p e a k   ( V )
0.255.29 5.40.3
0.518.00 11.10.85
132.00 222.24
239.00 42.25.24
347.50 66.27.7
450.00 9010.6
552.00 13013.7
653.50 15116.2
756.00 17519.6
1062.00 23528.6
2074.09 43558.6
3079.48 63588.6
4083.29 835118.6
5086.23 1035148.6
6088.63 1235178.6
7090.65 1435208.6
8092.40 1635238.6
9093.95 1835268.6
10095.46 2035301.6
Table 6. Test equipment to measure toroidal coil output and signal conditioning circuit of SCDS.
Test EquipmentMakerModelSpecification
Lightning surge simulatorNoisekenLSS-15AXVoc (1.2/50 μs): 15 kV
Isc (8/20 μs): 7.5 kA
Impulse current generatorHAEFELYSSG seriesIsc (8/20 μs): 120 kA
High voltage differential probeSapphire InstrumentsSI-9010±7000 V
OscilloscopeYokogawaDLM20542.5 Gs, 500 MHz
Scope probeYokogawa701939600 V, 600 MHz
Table 7. I n 20 kA MOV lifetime characteristics according to the surge current and number of surges.
i m o v Surge Current (A) 1 ( Surge Current ) 2 Endurable Number of Surges
901.235 × 10−41,000,000
2002.500 × 10−5100,000
5004.000 × 10−610,000
20002.500 × 10−71000
70002.041 × 10−8100
20,0002.500 × 10−910
40,0006.250 × 10−101
Table 8. Typical values of I t c and I m c w for IEC62561-6.
Application I t c Value I m c w Value
LPS conductor-1 kA
8/20 μs
----100 kA
10/350 μs
SPD conductor500 A
8/20 μs
-20 kA
8/20 μs
40 kA
8/20 μs
60 kA
8/20 μs
80 kA
8/20 μs
100 kA
8/20 μs
LPS and SPD conductors-1 kA
8/20 μs
----100 kA
10/350 μs
Table 9. Test results of I t c .
Surge Current 8/20 μsNumber of Surge TestsCount ResultsTest Results
250 A (positive)10X (no count)Pass
250 A (negative)10X (no count)Pass
400 A (positive)10X (no count)Pass
400 A (negative)10X (no count)Pass
500 A (positive)10O (10 times)Pass
500 A (negative)10O (10 times)Pass
Table 10. Test results of the predictive lifetime of the SPD due to lightning surge currents.
Surge Current 8/20 μsSurge Current Per Path Decreased Predictive Lifetime (%)Sample #1 (%)Sample #2 (%)Sample #3 (%)Sample #4 (%)
1 kA 250 A0.000000
5 kA1.25 kA0.030.030.030.030.03
10 kA2.5 kA0.120.110.120.130.12
20 kA5 kA0.500.460.490.530.51
30 kA7.5 kA1.151.061.111.221.19
40 kA10 kA2.081.952.012.242.15
50 kA12.5 kA3.323.063.143.523.44
60 kA15 kA4.934.524.675.355.20
70 kA17.5 kA6.966.356.507.537.23
80 kA20 kA9.498.789.1910.239.79
90 kA22.5 kA12.6611.6612.0513.6912.98
100 kA25 kA16.6115.3015.8717.5917.20
Table 11. Performance and cost comparison of SCDSs.
SCDSSurge CountCurrent MeasurementPolaritySPD Predictive LifetimeCostGeneral Market
Proposed SCDSOOXOVery low (tens of USD)Applicable
Surge counterOXXXVery low (tens of USD)Applicable
SCDS with Rogowski coilOOOOHigh (hundreds of USD)Not applicable
SCDS with expensive CTOOOOVery high(thousands of USD)Not applicable

