Mobile Robot Self-Localization with 2D Push-Broom LIDAR in a 2D Map


Abstract
1. Introduction
2. Materials and Methods
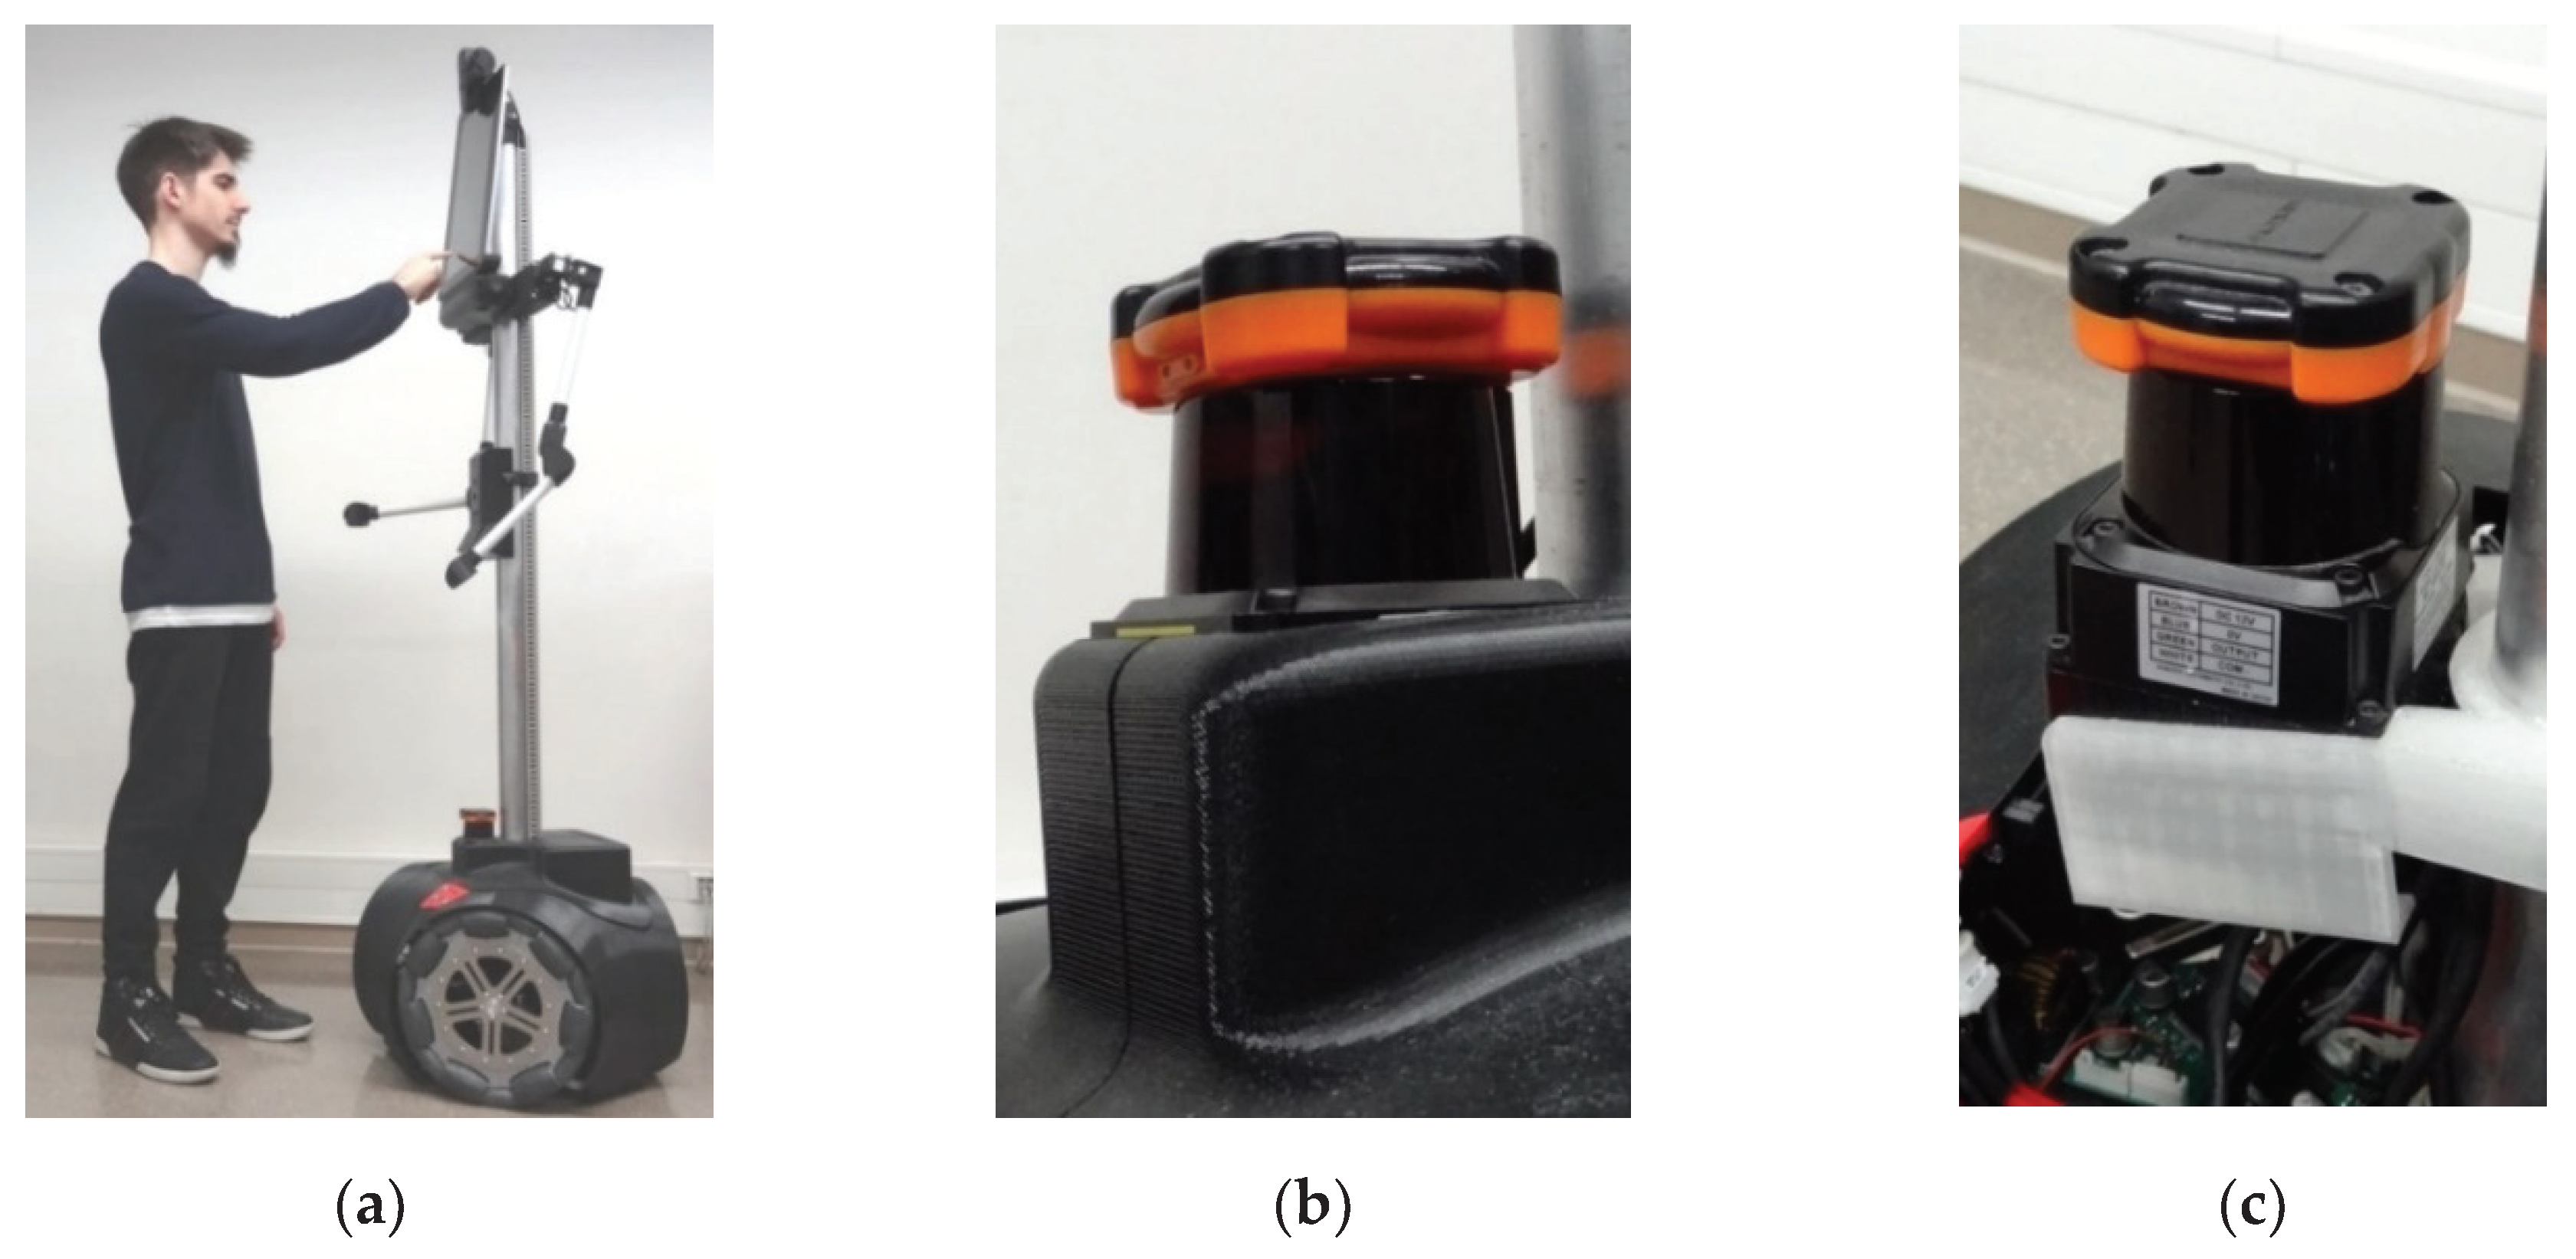
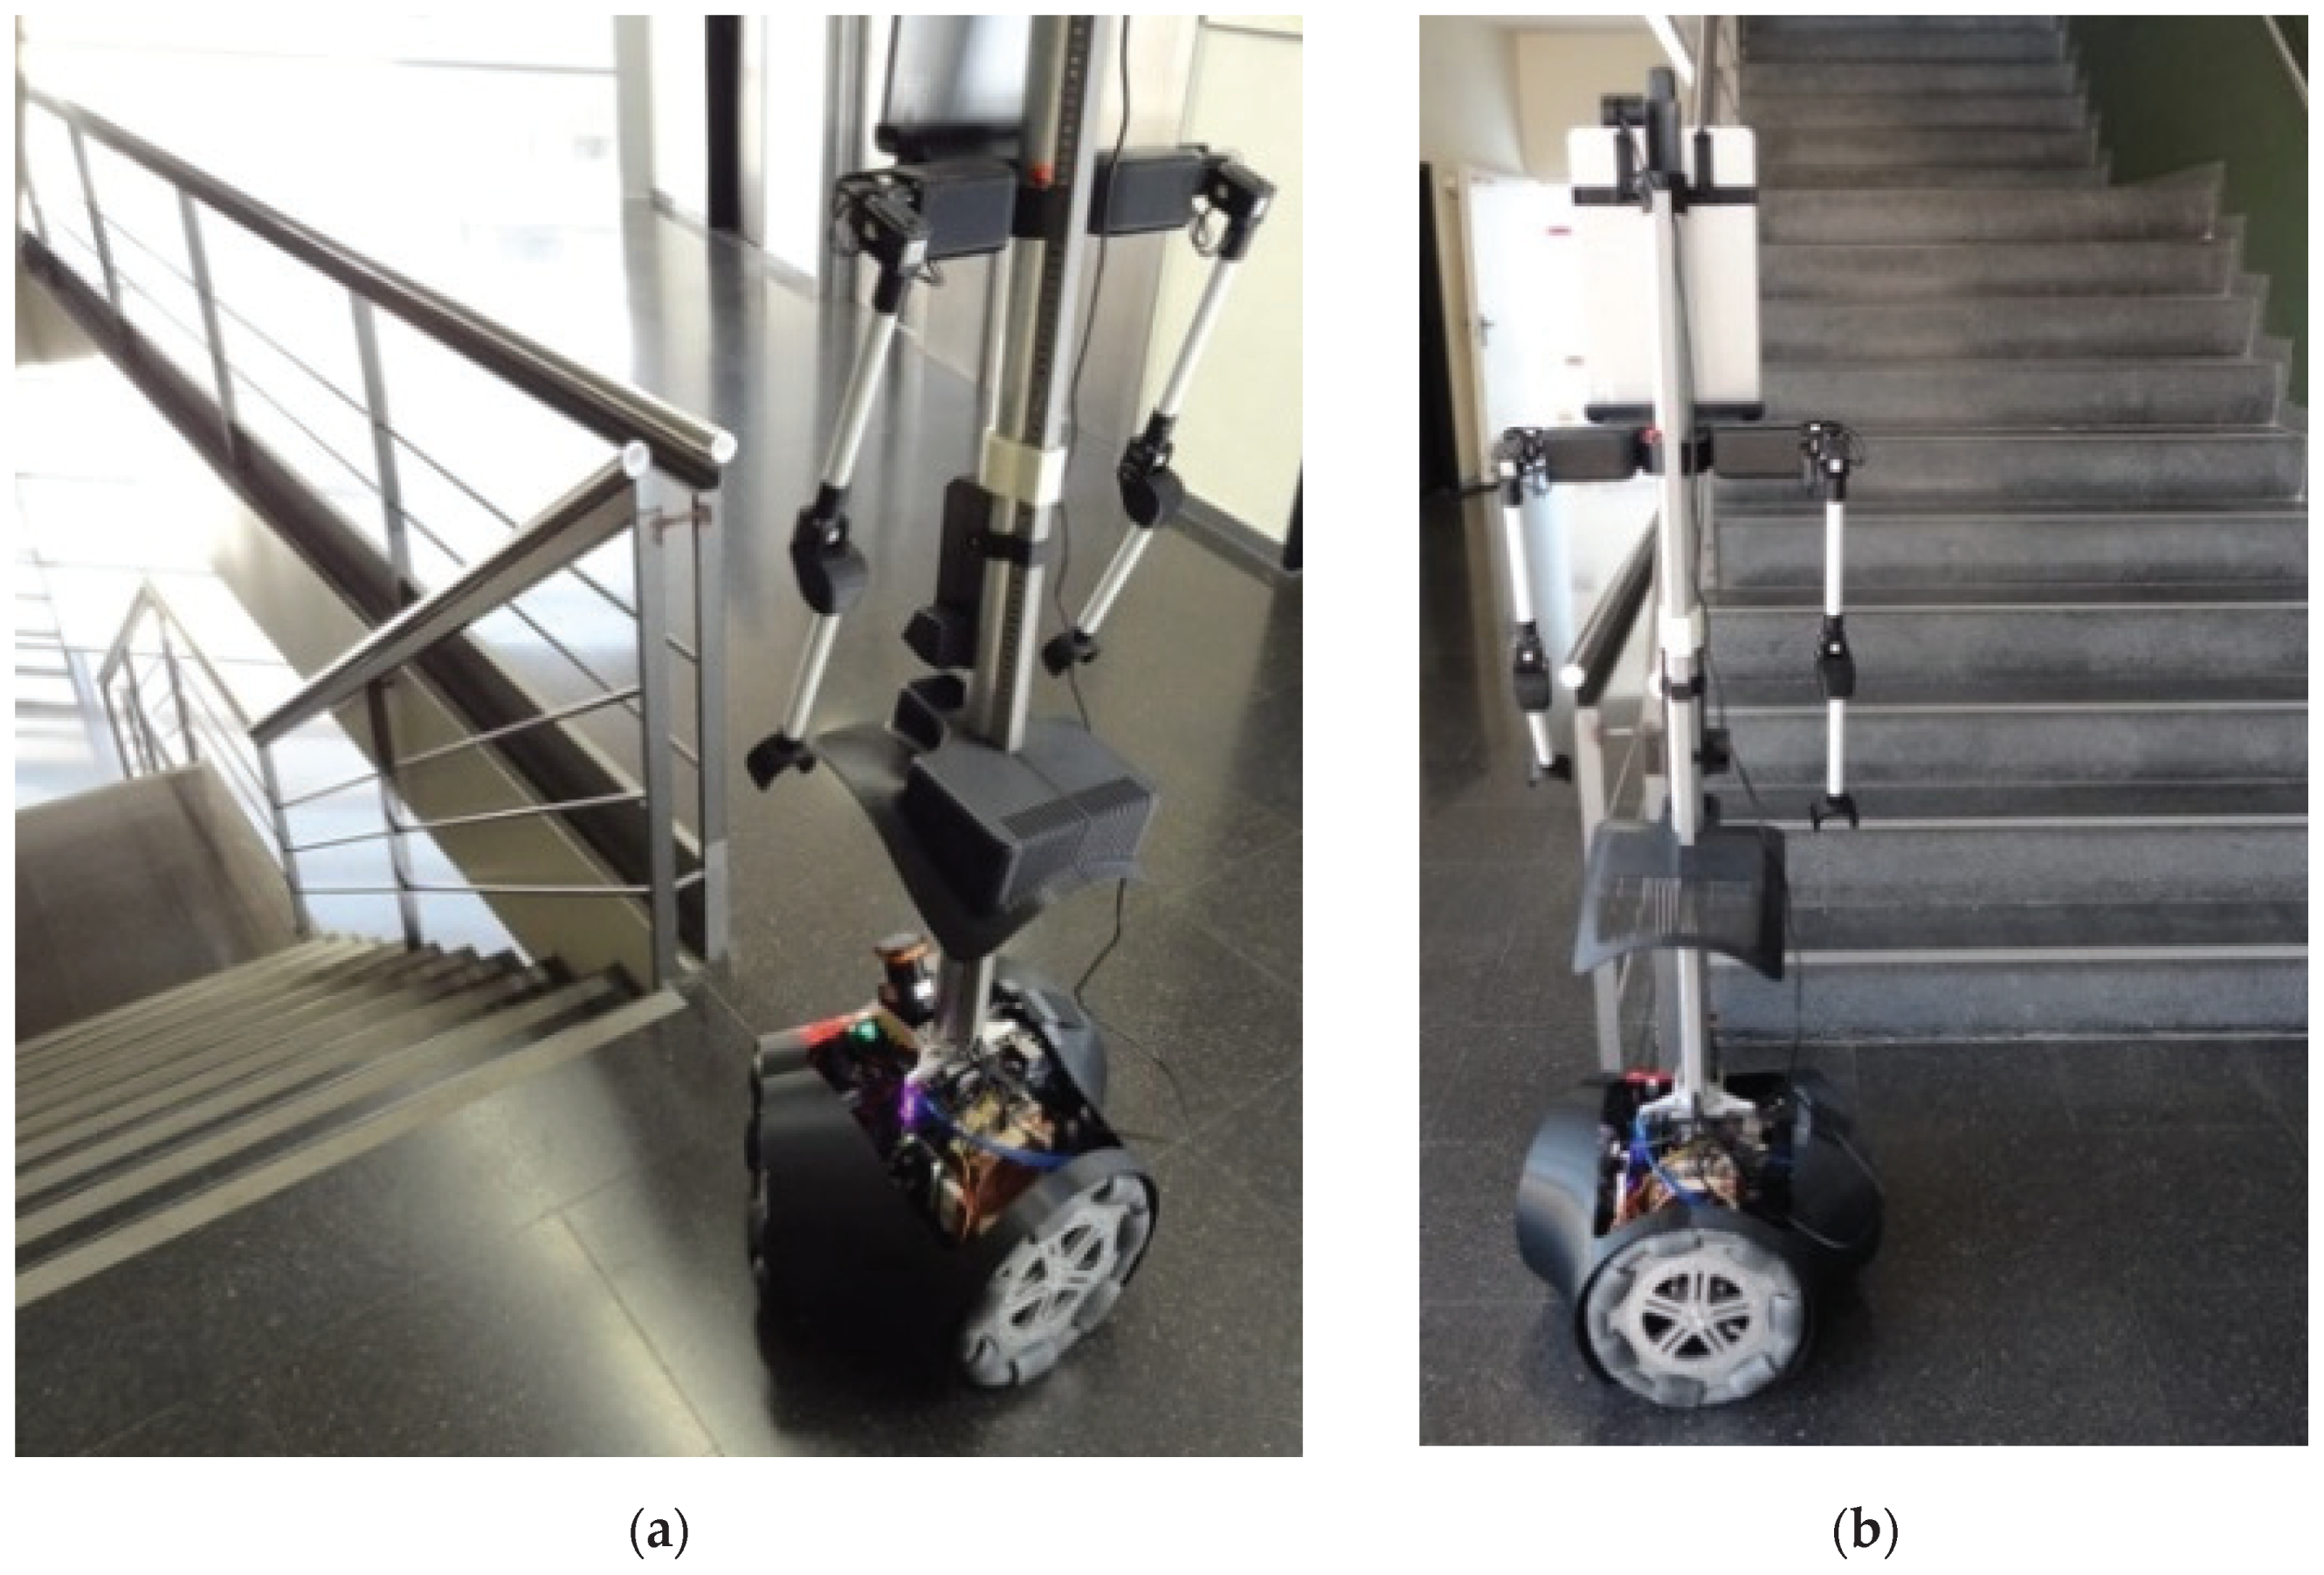
2.1. Mobile Robot APR
2.2. 2D LIDAR: UTM-30LX Model
2.3. 2D Reference MAP
2.4. ICP Self-Location Algorithm
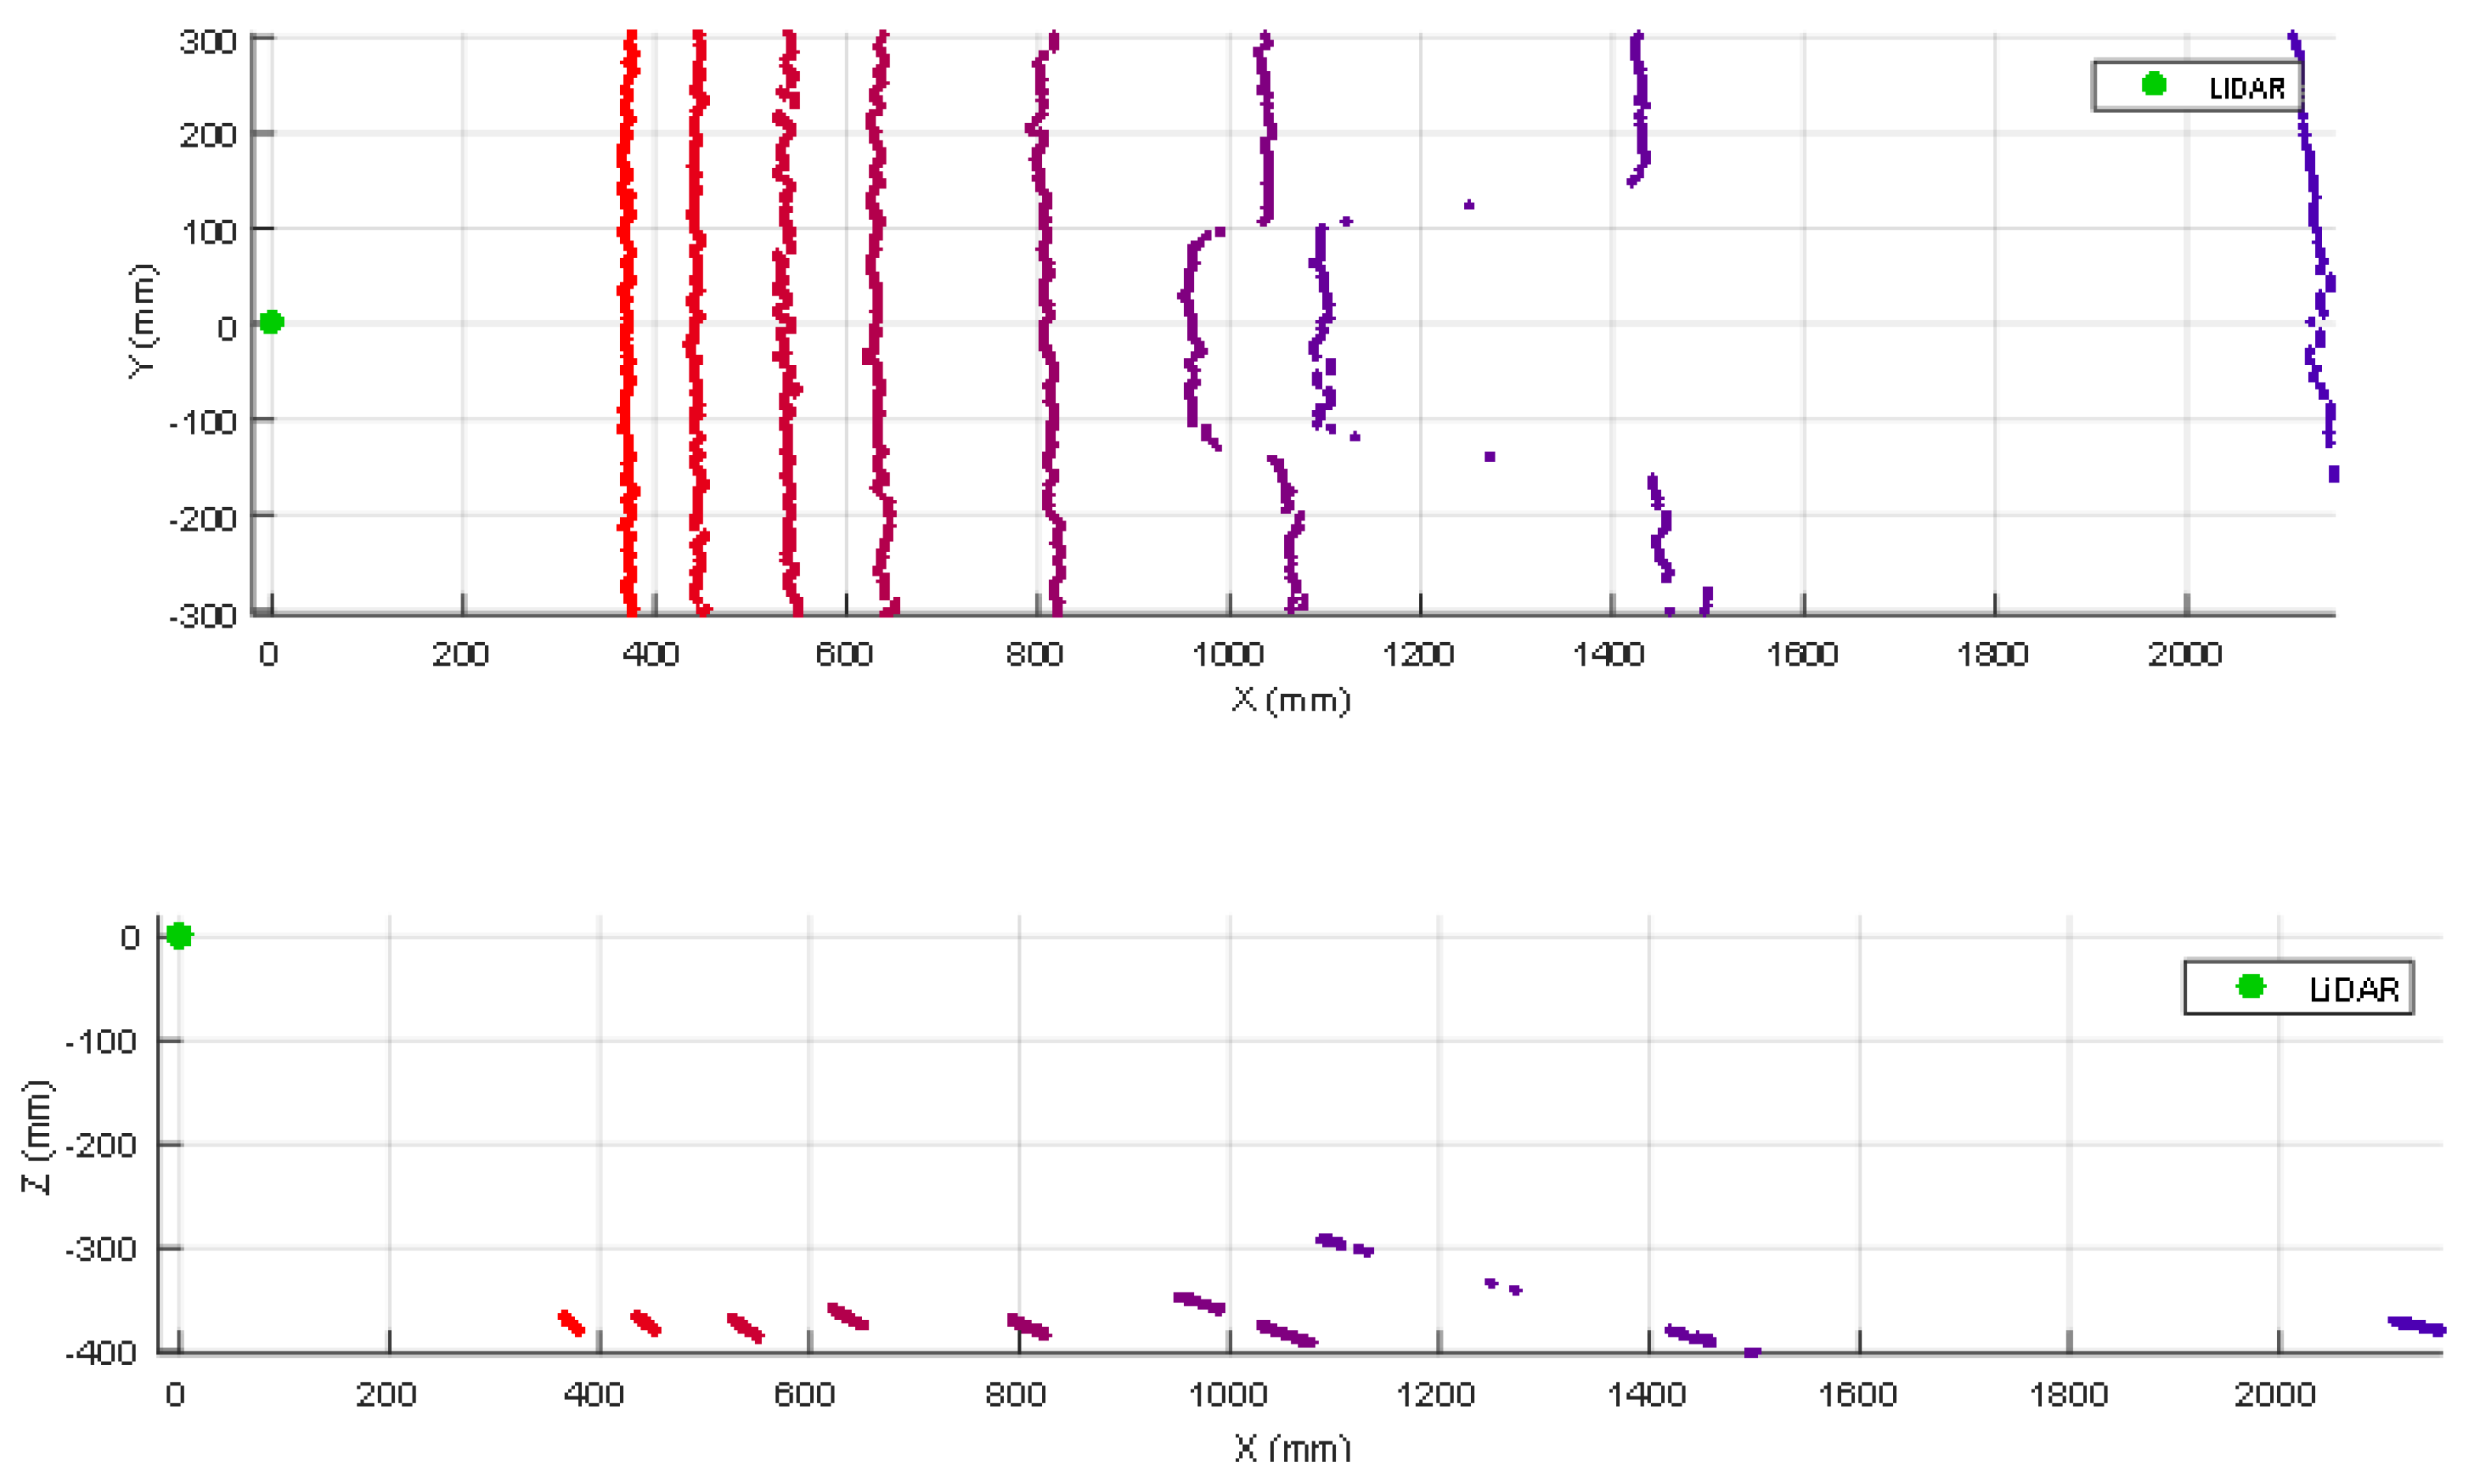
3. 2D Push-Broom LIDAR: Verification of the Detection Performances
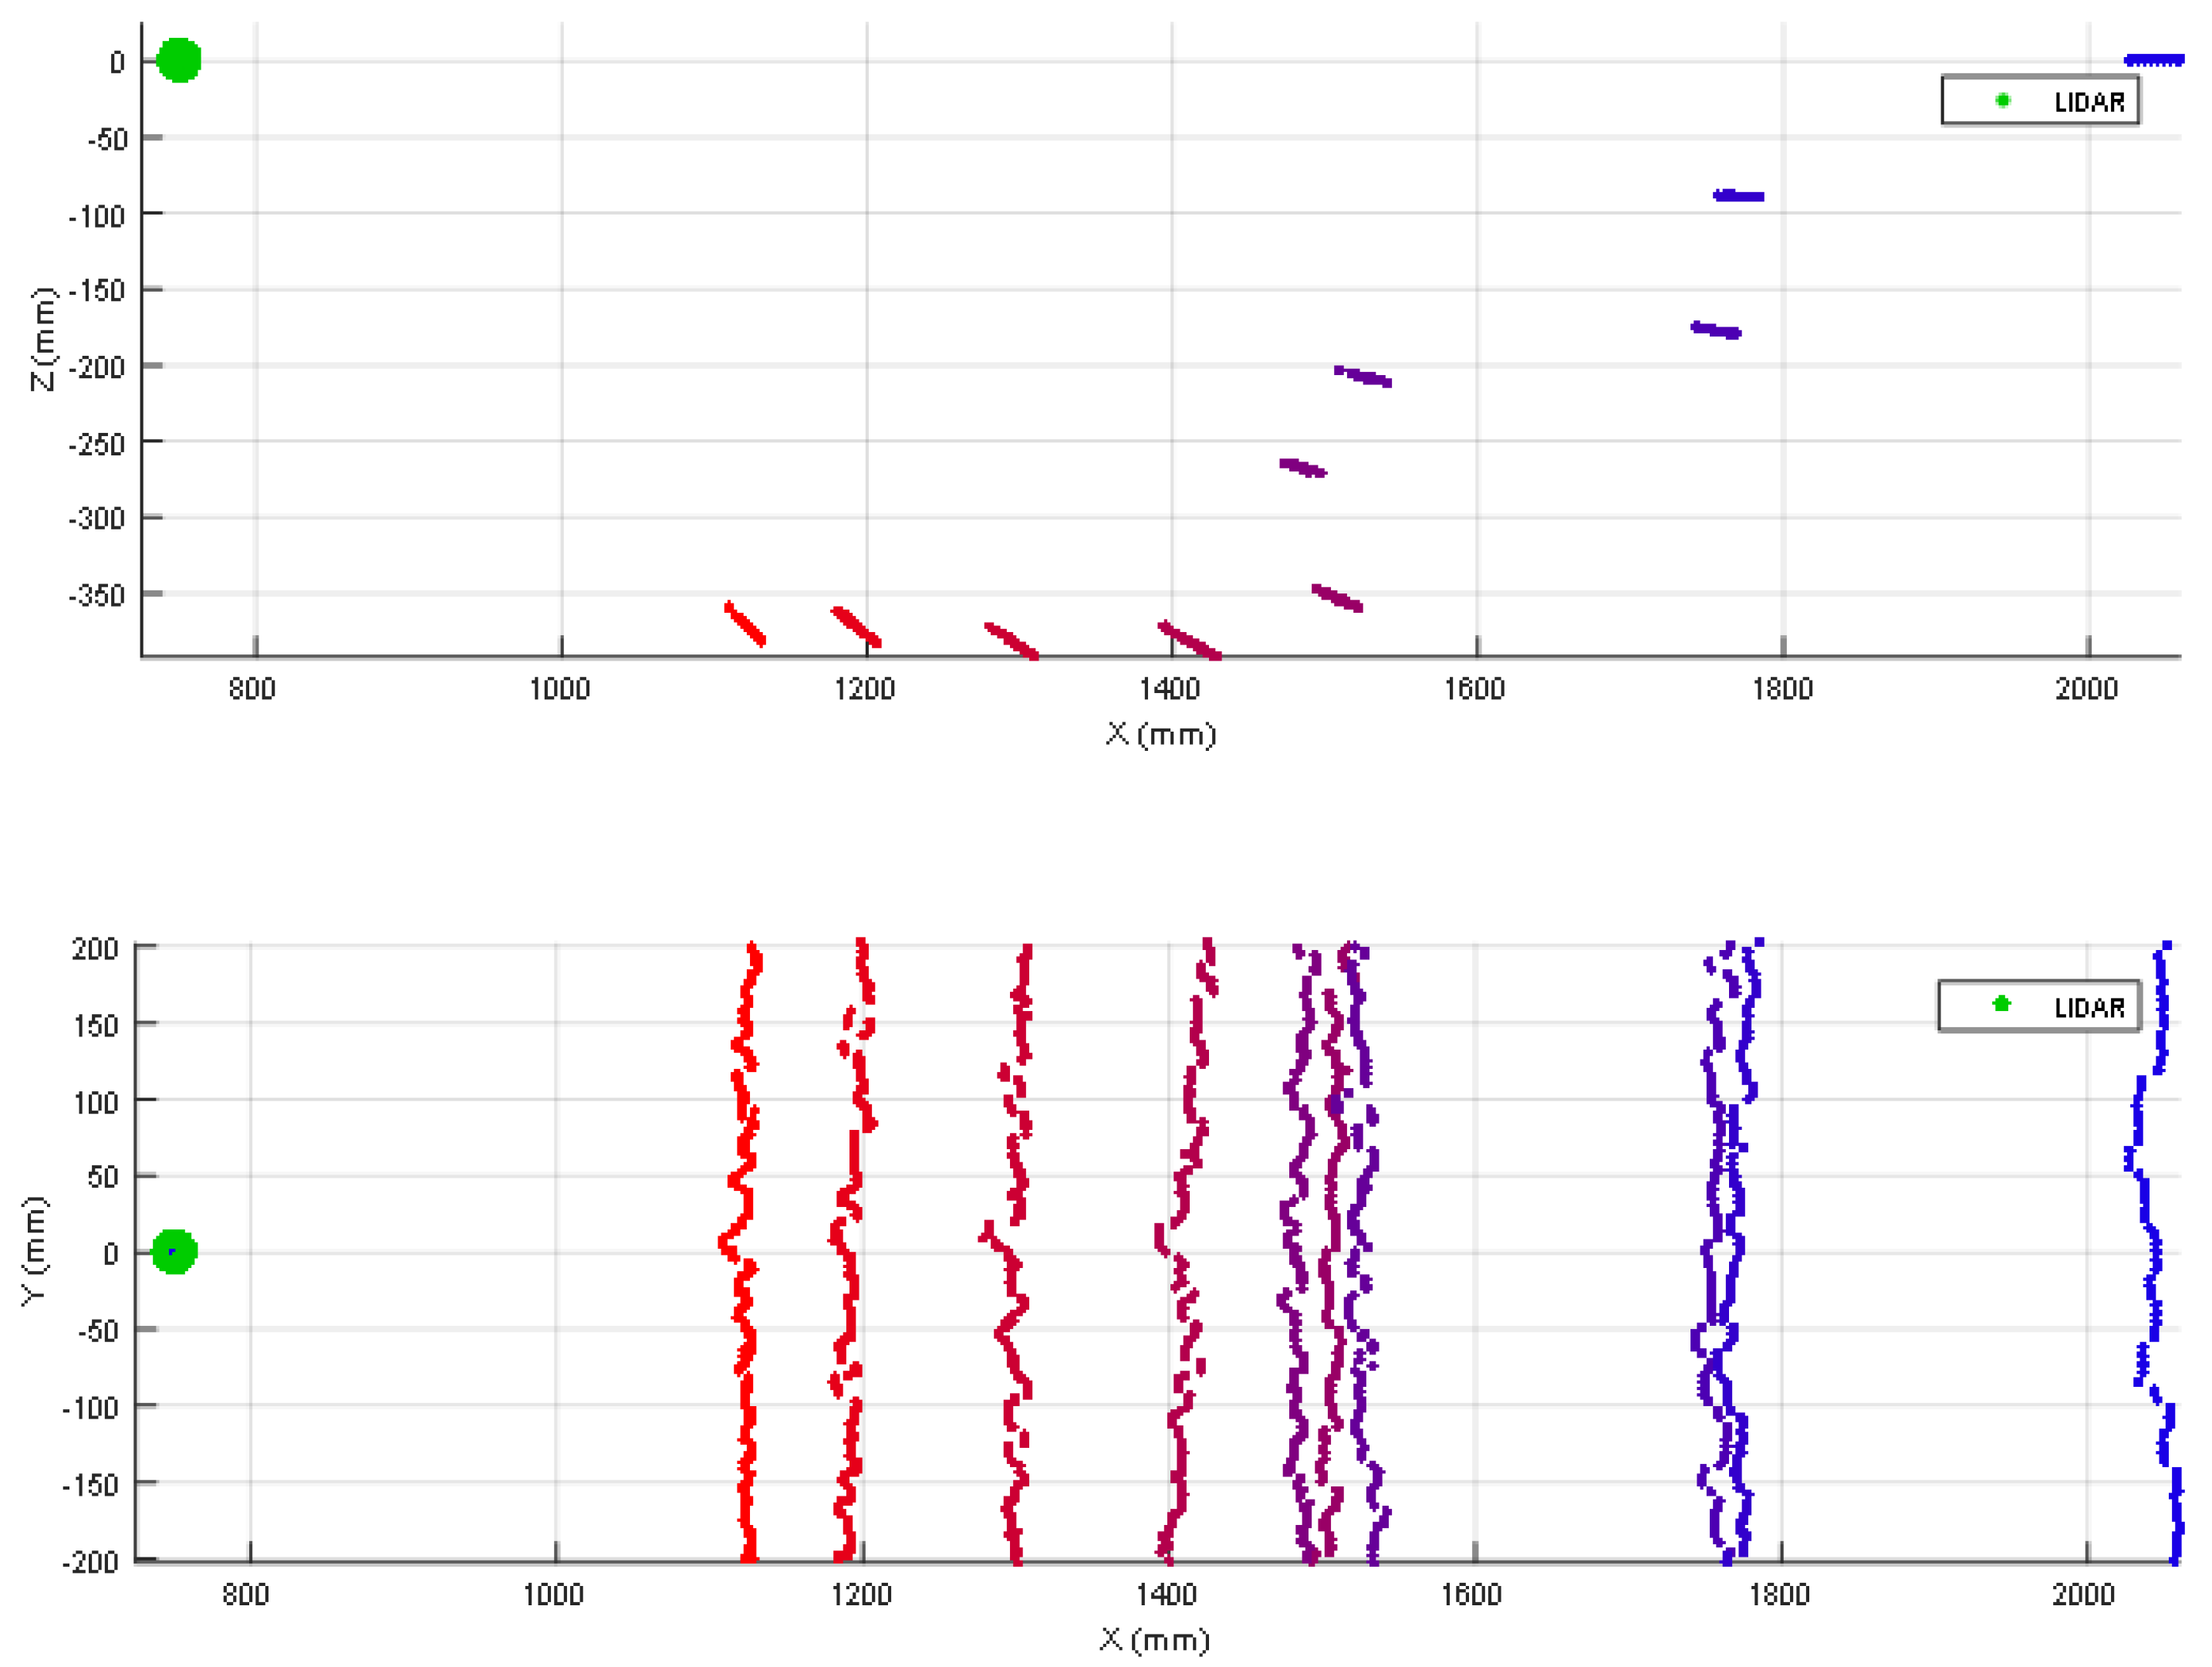
3.1. Detection of a Small Box
3.2. Detection of One Shoe/Leg
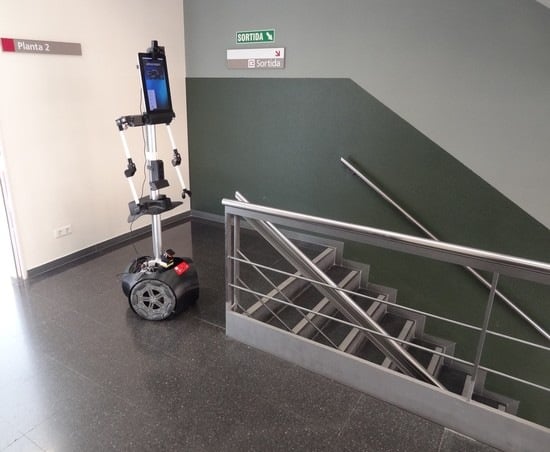
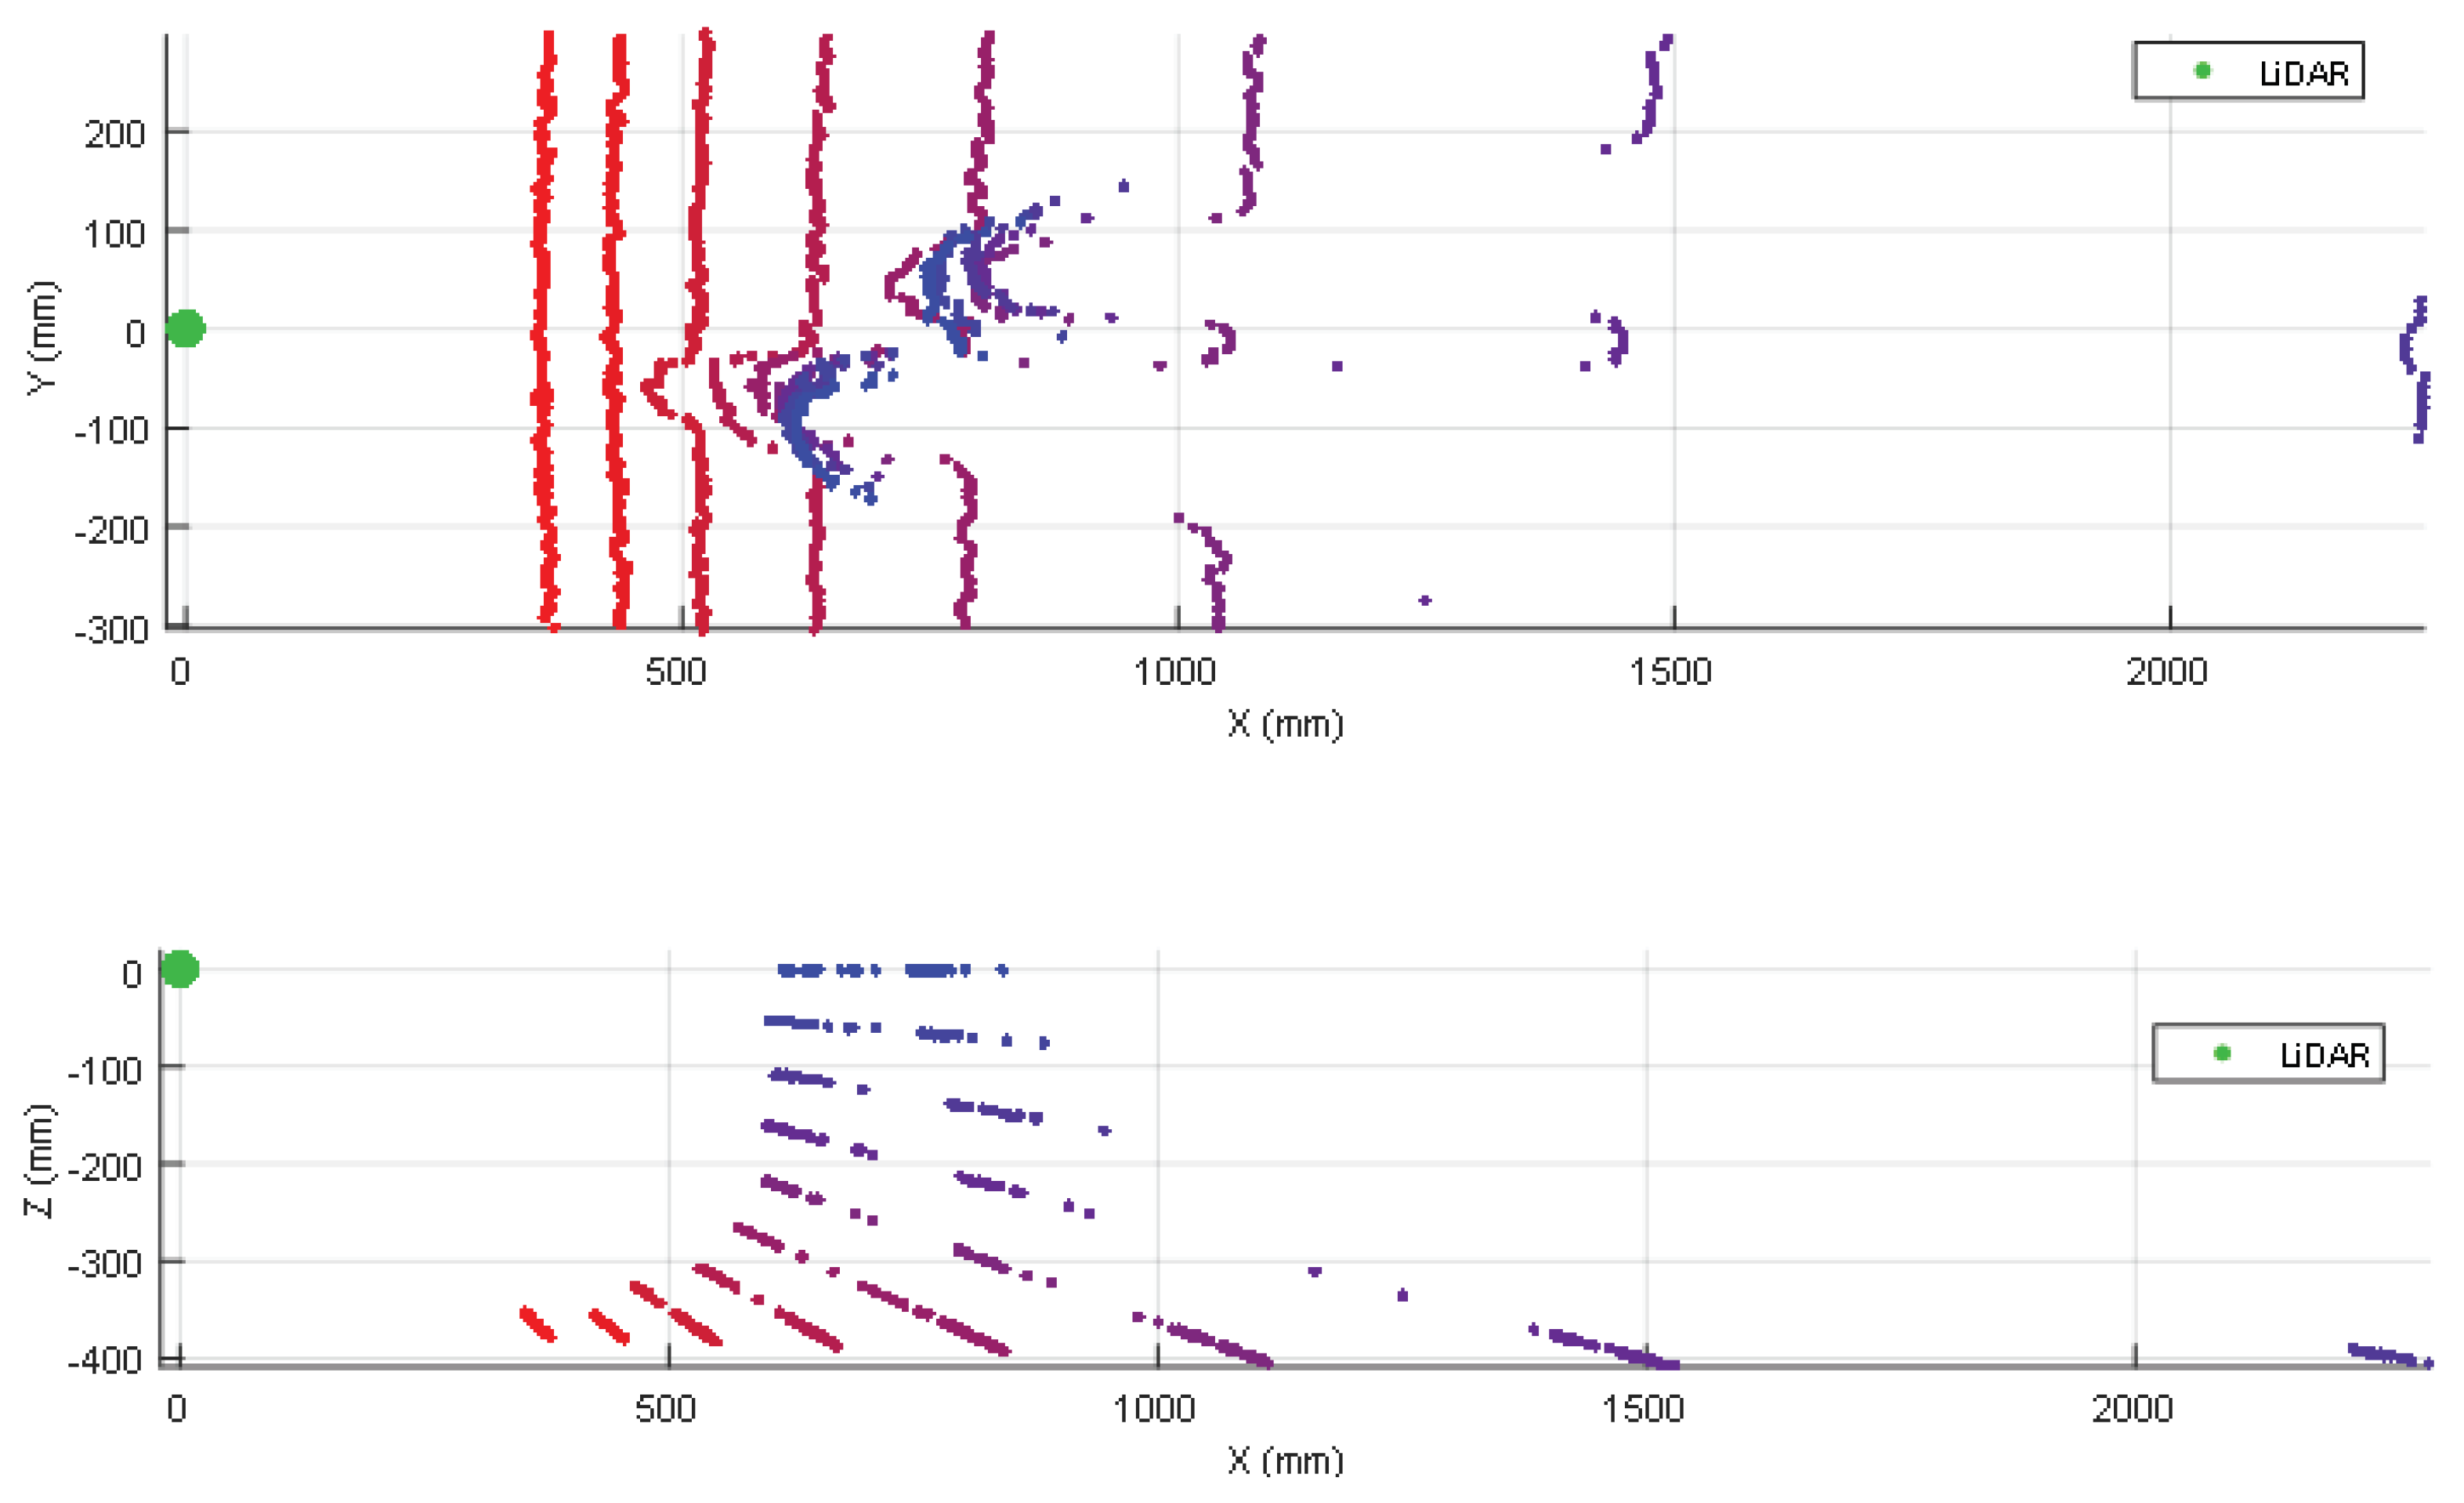
3.3. Detection of Stairs Going Down
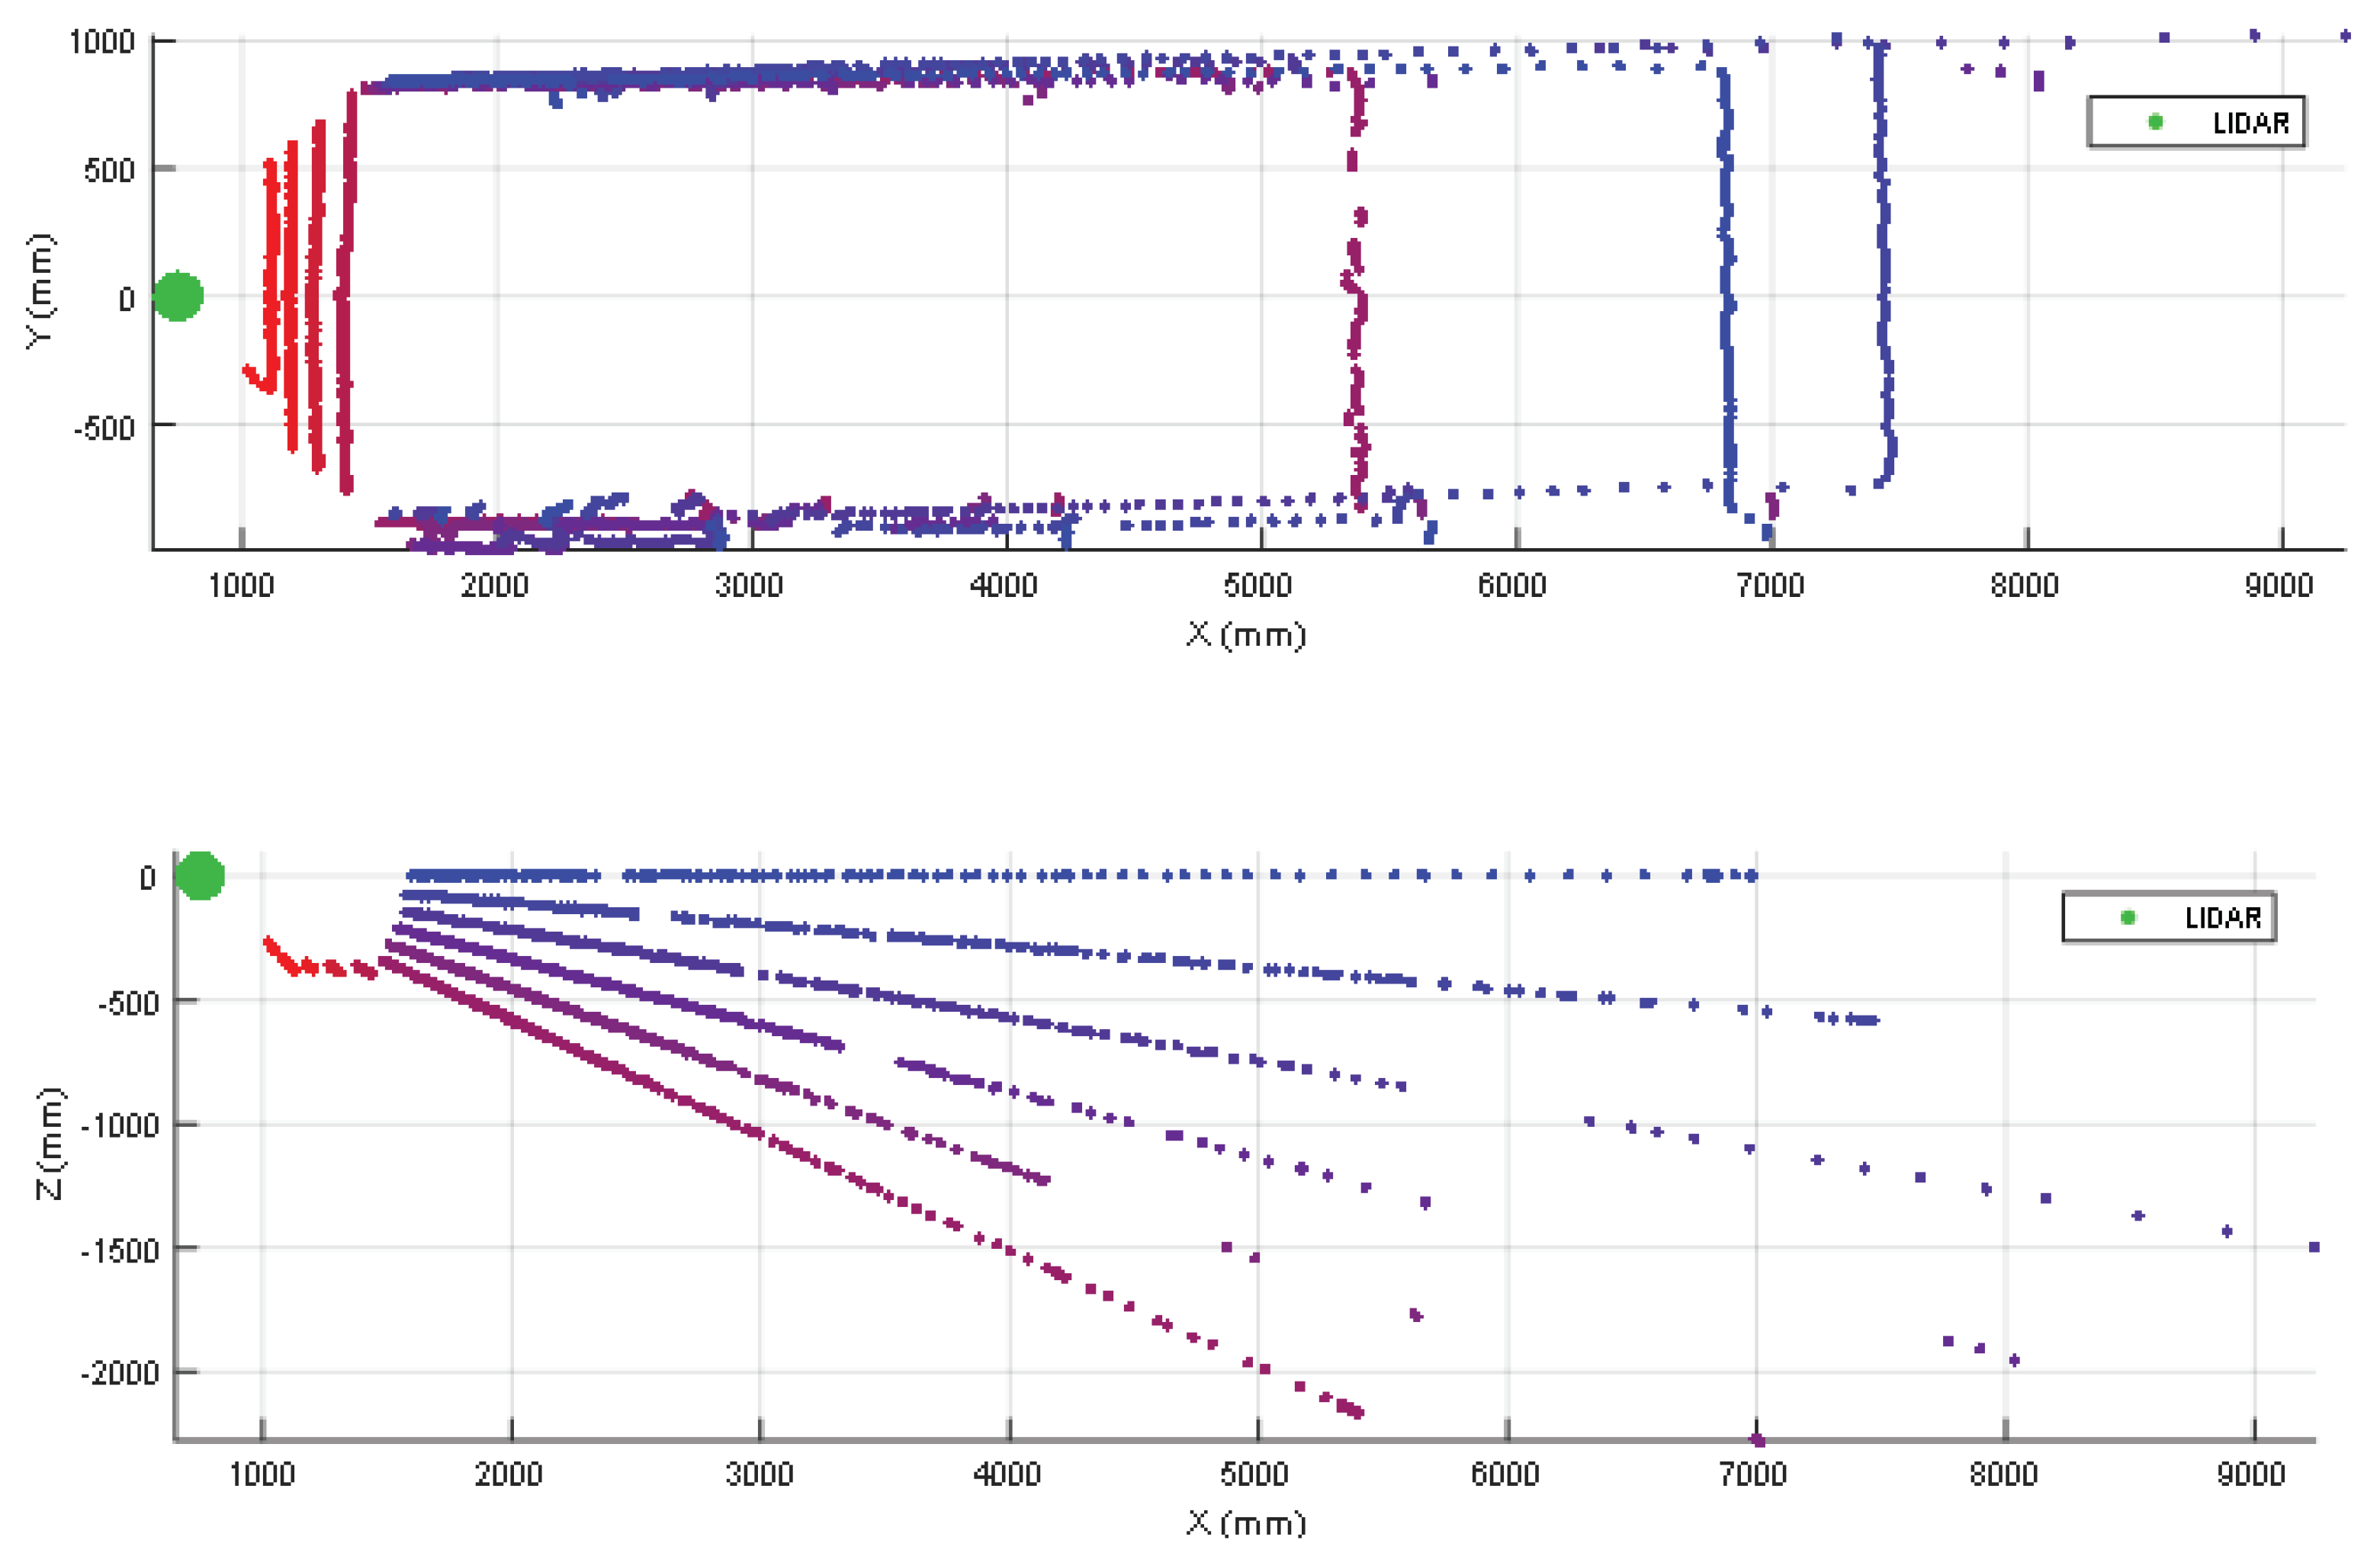
3.4. Detection of Stairs Going Up
3.5. Optimal Fixed 2D LIDAR Tilt Angle
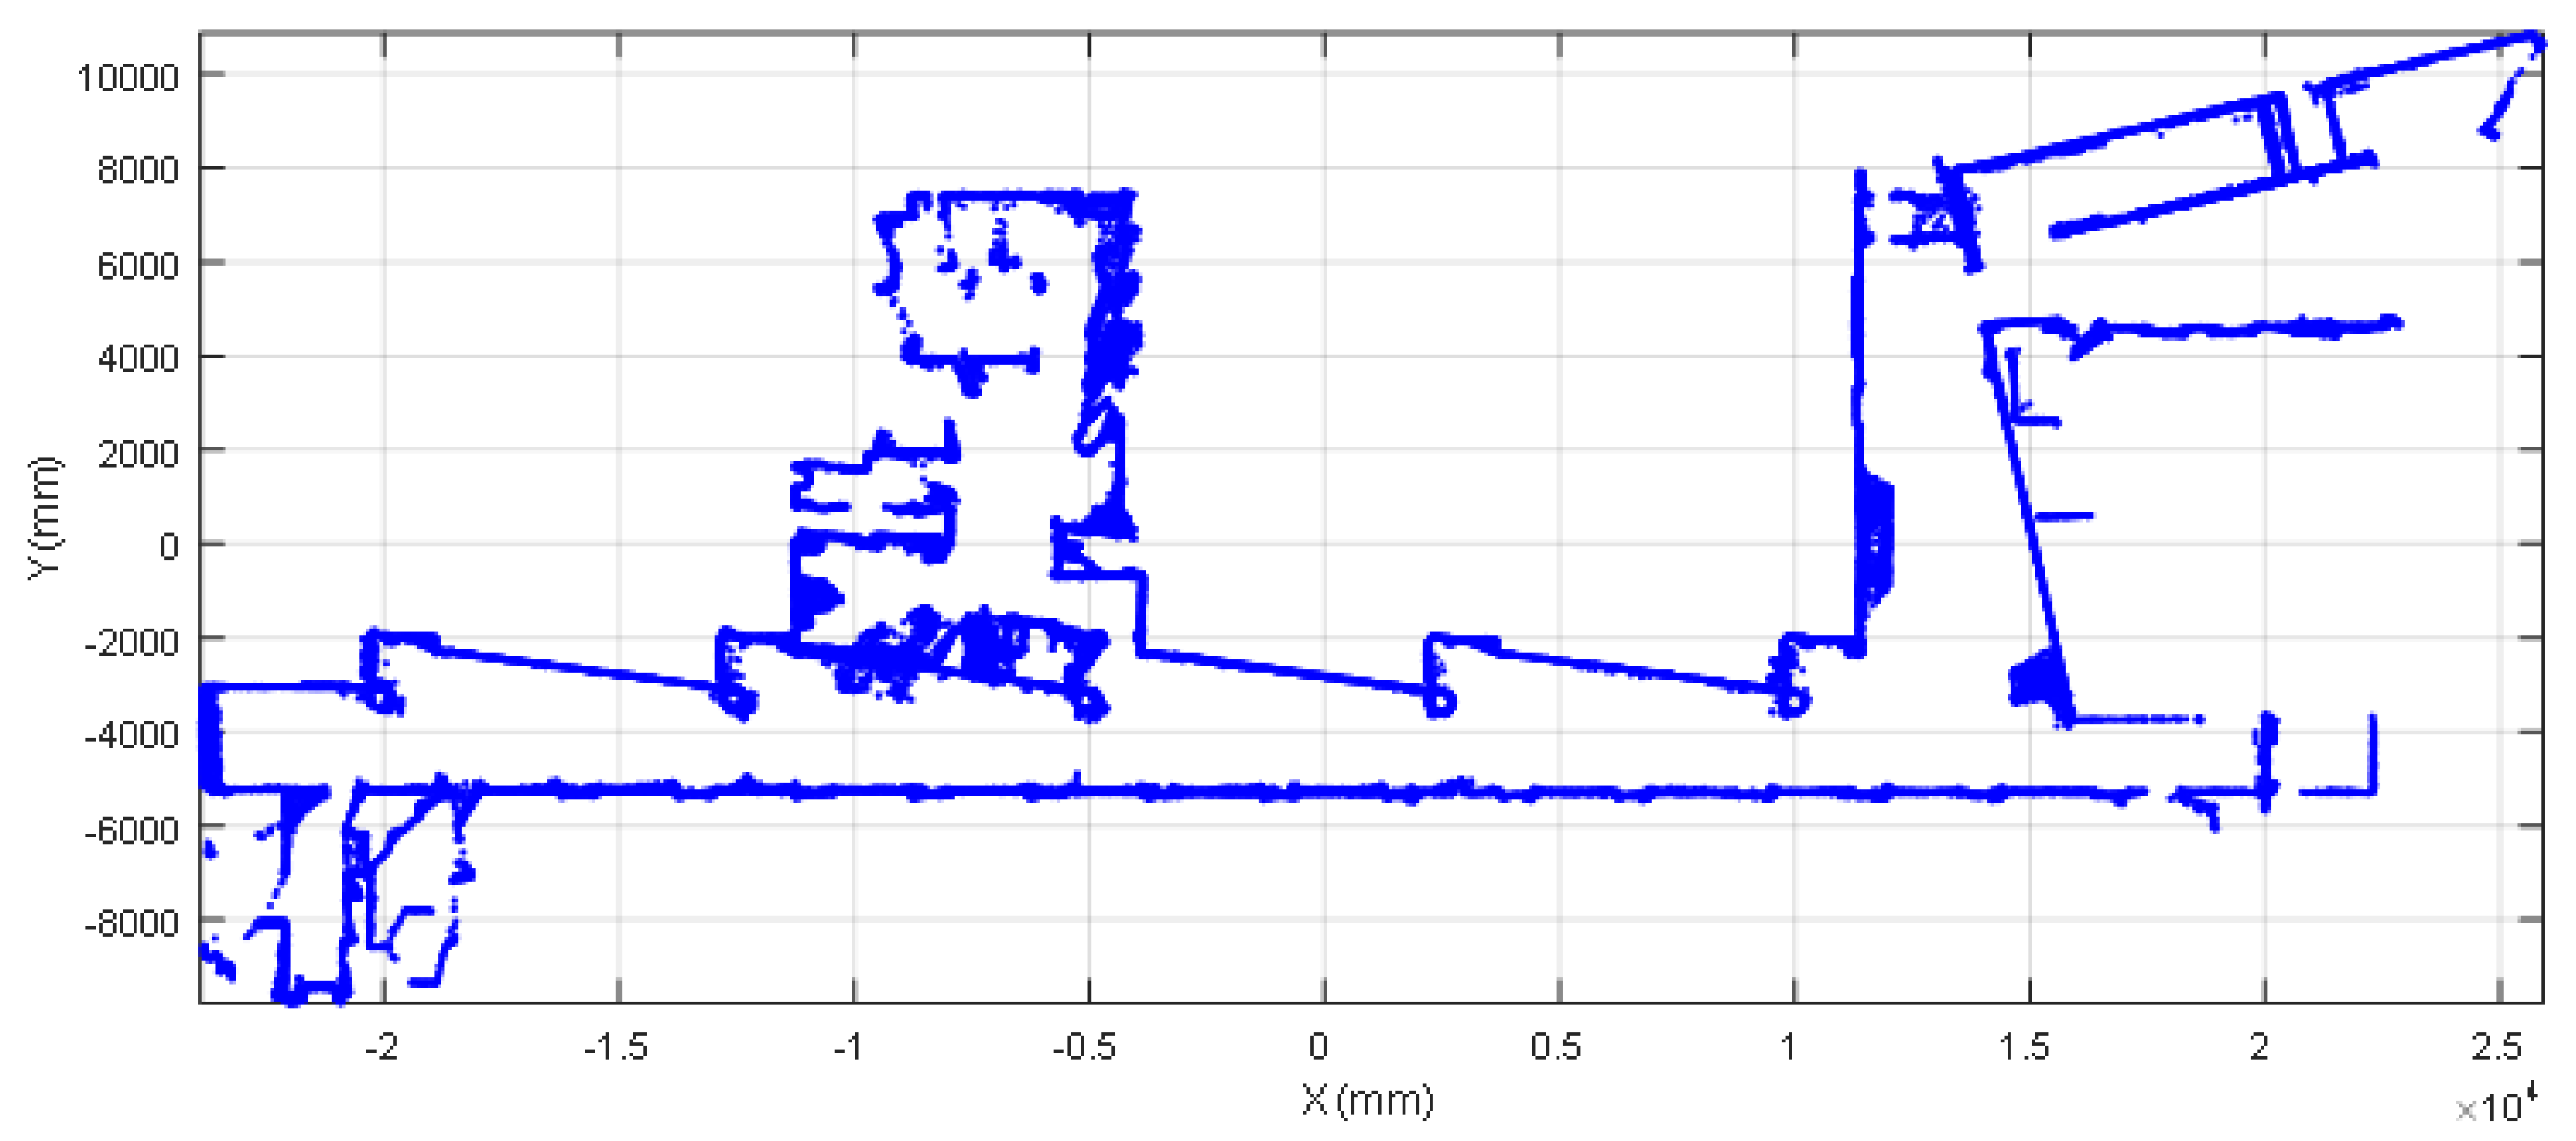
4. Self-Location Results
5. Discussion
6. Conclusions
Supplementary Materials
Author Contributions
Funding
Conflicts of Interest
Abbreviations
| APR | Assistant Personal Robot |
| ICP | Iterative Closest Point |
| LIDAR | Ligth Detection and Ranging |
| SLAM | Simultaneous Localization and Mapping |
References
- Montemerlo, M.; Thrun, S.; Koller, D.; Webgreit, B. FastSLAM: A factored solution for the simultaneous localization and mapping problem. In Proceedings of the AAAI National Conference on Artificial Intelligence, Edmonton, AB, Canada, 28 July–1 August 2002; pp. 593–598. [Google Scholar]
- Fu, S.; Liu, H.; Gao, L.; Gai, Y. SLAM for mobile robots using laser range finder and monocular vision. In Proceedings of the 14th International Conference on Mechatronics and Machine Vision in Practice, Xiamen, China, 4–6 December 2007; pp. 91–96. [Google Scholar] [CrossRef]
- Santos, J.M.; Portugal, D.; Rocha, R.P. An evaluation of 2D SLAM techniques available in robot operating system. In Proceedings of the IEEE International Symposium on Safety, Security, and Rescue Robotics (SSRR) 2013, Linkoping, Sweden, 21–26 October 2013; pp. 1–6. [Google Scholar] [CrossRef]
- Blanco-Claraco, J.L.; Moreno-Duenas, F.A.; González-Jiménez, J. The Málaga urban dataset: High-rate stereo and LiDAR in a realistic urban scenario. Int. J. Robotics Res. 2014, 33, 207–214. [Google Scholar] [CrossRef]
- Xu, N.; Zhang, W.; Zhu, L.; Li, C.; Wang, S. Object 3D surface reconstruction approach using portable laser scanner. In Proceedings of the IOP Conference Series: Earth and Environmental Science, Chengdu, China, 26–28 May 2017. [Google Scholar] [CrossRef]
- Yin, J.; Apuroop, K.G.S.; Tamilselvam, Y.K.; Mohan, R.E.; Ramalingam, B.; Le, A.V. Table Cleaning Task by Human Support Robot Using Deep Learning Technique. Sensors 2020, 20, 1698. [Google Scholar] [CrossRef] [PubMed]
- Cooney, M.; Leister, W. Using the Engagement Profile to Design an Engaging Robotic Teaching Assistant for Students. Robotics 2019, 8, 21. [Google Scholar] [CrossRef]
- Lin, C.; Liao, Y.; Luo, W. Calibration method for extending single-layer LIDAR to multi-layer LIDAR. In Proceedings of the IEEE/SICE International Symposium on System Integration, Kobe, Japan, 15–17 December 2013; pp. 677–681. [Google Scholar] [CrossRef]
- Ohno, K.; Kawahara, T.; Tadokoro, S. Development of 3D laser scanner for measuring uniform and dense 3D shapes of static objects in dynamic environment. In Proceedings of the IEEE International Conference on Robotics and Biomimetics, Bangkok, Thailand, 22–25 February 2009; pp. 2161–2167. [Google Scholar] [CrossRef]
- Kang, J.; Doh, N.L. Full-DOF Calibration of a Rotating 2-D LIDAR with a Simple Plane Measurement. IEEE Trans. Robotics 2016, 32, 1245–1263. [Google Scholar] [CrossRef]
- Zeng, Y.; Yu, H.; Dai, H.; Song, S.; Lin, M.; Sun, B.; Jiang, W.; Meng, M.Q.-H. An Improved Calibration Method for a Rotating 2D LIDAR System. Sensors 2018, 18, 497. [Google Scholar] [CrossRef]
- Alismail, H.; Browning, B. Automatic Calibration of Spinning Actuated Lidar Internal Parameters. J. Field Robotics 2015, 32, 723–747. [Google Scholar] [CrossRef]
- Yamao, S.; Hidaka, H.; Odashima, S.; Jiang, S.; Murase, Y. Calibration of a rotating 2D LRF in Unprepared Environments by Minimizing Redundant Measurement Errors. In Proceedings of the IEEE International Conference on Advanced Intelligent Mechatronics, Munich, Germany, 3–7 July 2017; pp. 172–177. [Google Scholar] [CrossRef]
- Zhu, F.; Huang, Y.; Tian, Z.; Ma, Y. Extrinsic Calibration of Multiple Two-Dimensional Laser Rangefinders Based on a Trihedron. Sensors 2020, 20, 1837. [Google Scholar] [CrossRef]
- Morales, J.; Martínez, J.L.; Mandow, A.; Pequeño-Boter, A.; Garcia-Cerezo, A. Design and Development of a Fast and Precise Low-Cost 3D Laser Rangefinder. In Proceedings of the IEEE International Conference on Mechatronics, Istanbul, Turkey, 13–15 April 2011; pp. 621–626. [Google Scholar] [CrossRef]
- Takahashi, M.; Kobayashi, K.; Watanabe, K.; Kinoshita, T. Development of prediction based emergency obstacle avoidance module by using LIDAR for mobile robot. In Proceedings of the Joint 7th International Conference on Soft Computing and Intelligent Systems and 15th International Symposium on Advanced Intelligent Systems, Kitakyushu, Japan, 3–6 December 2014; pp. 561–564. [Google Scholar] [CrossRef]
- Hämmerle, M.; Höfle, B. Effects of reduced terrestrial LiDAR point density on high-resolution grain crop surface models in precision agriculture. Sensors 2014, 14, 24212–24230. [Google Scholar] [CrossRef]
- Bietresato, M.; Carabin, G.; D’Auria, D.; Gallo, R.; Ristorto, G.; Mazzetto, F.; Vidoni, R.; Gasparetto, A.; Scalera, L. A tracked mobile robotic lab for monitoring the plants volume and health. In Proceedings of the IEEE/ASME International Conference on Mechatronic and Embedded Systems and Applications (MESA), Auckland, New Zealand, 29–31 August 2016; pp. 1–6. [Google Scholar]
- Moreno, H.; Valero, C.; Bengochea-Guevara, J.M.; Ribeiro, Á.; Garrido-Izard, M.; Andújar, D. On-Ground Vineyard Reconstruction Using a LiDAR-Based Automated System. Sensors 2020, 20, 1102. [Google Scholar] [CrossRef]
- Clotet, E.; Martínez, D.; Moreno, J.; Tresanchez, M.; Palacín, J. Assistant Personal Robot (APR): Conception and Application of a Tele-Operated Assisted Living Robot. Sensors 2016, 16, 610. [Google Scholar] [CrossRef]
- Moreno, J.; Clotet, E.; Lupiañez, R.; Tresanchez, M.; Martínez, D.; Pallejà, T.; Casanovas, J.; Palacín, J. Design, Implementation and Validation of the Three-Wheel Holonomic Motion System of the Assistant Personal Robot (APR). Sensors 2016, 16, 1658. [Google Scholar] [CrossRef] [PubMed]
- Moreno, J.; Clotet, E.; Tresanchez, M.; Martínez, D.; Casanovas, J.; Palacín, J. Measurement of Vibrations in Two Tower-Typed Assistant Personal Robot Implementations with and without a Passive Suspension System. Sensors 2017, 17, 1122. [Google Scholar] [CrossRef] [PubMed]
- Martinez, D.; Teixidó, M.; Font, D.; Moreno, J.; Tresanchez, M.; Marco, S.; Palacín, J. Ambient Intelligence Application Based on Environmental Measurements Performed with an Assistant Mobile Robot. Sensors 2014, 14, 6045–6055. [Google Scholar] [CrossRef] [PubMed]
- Palacín, J.; Clotet, E.; Martínez, D.; Moreno, J.; Tresanchez, M. Automatic Supervision of Temperature, Humidity, and Luminance with an Assistant Personal Robot. J. Sens. 2017. [Google Scholar] [CrossRef]
- Palacín, J.; Martínez, D.; Clotet, E.; Pallejà, T.; Burgués, J.; Fonollosa, J.; Pardo, A.; Marco, S. Application of an Array of Metal-Oxide Semiconductor Gas Sensors in an Assistant Personal Robot for Early Gas Leak Detection. Sensors 2019, 19, 1957. [Google Scholar] [CrossRef]
- Palacín, J.; Clotet, E.; Martínez, D.; Martínez, D.; Moreno, J. Extending the Application of an Assistant Personal Robot as a Walk-Helper Tool. Robotics 2019, 8, 27. [Google Scholar] [CrossRef]
- Velasquez, A.E.B.; Higuti, V.A.H.; Guerrero, H.B.; Gasparino, M.V.; Magalhães, D.V.; Aroca, R.V.; Becker, M. Reactive navigation system based on H∞ control system and LiDAR readings on corn crops. Precis. Agric. 2020, 21, 349–368. [Google Scholar] [CrossRef]
- Chen, J.; Xiaojun, W.; Yu, M.; Li, X. 3D shape modeling using a self-developed hand-held 3D laser scanner and an efficient HT-ICP point cloud registration algorithm. Optics Laser Technol. 2013, 45, 414–423. [Google Scholar] [CrossRef]
- Li, X.; Du, S.; Li, G.; Li, H. Integrate Point-Cloud Segmentation with 3D LiDAR Scan-Matching for Mobile Robot Localization and Mapping. Sensors 2020, 20, 237. [Google Scholar] [CrossRef]
- Donso, F.A.; Austin, K.J.; McAree, P.R. How do ICP variants perform when used for scan matching terrain point clouds? Robotics Auton. Syst. 2017, 87, 147–161. [Google Scholar] [CrossRef]
- Bedkowski, J.; Maslowski, A. GPGPU computation in mobile robot applications. Int. J. Electr. Eng. Inf. 2012, 4, 15–26. [Google Scholar] [CrossRef]
- Alshamaa, D.; Mourad-Chehade, F.; Honeine, P.; Chkeir, A. An Evidential Framework for Localization of Sensors in Indoor Environments. Sensors 2020, 20, 318. [Google Scholar] [CrossRef] [PubMed]
- Guesgen, H.W. Using Rough Sets to Improve Activity Recognition Based on Sensor Data. Sensors 2020, 20, 1779. [Google Scholar] [CrossRef] [PubMed]


| Obstacle | Illustrative Image |
|---|---|
| Small box on the floor |  |
| One shoe/leg |  |
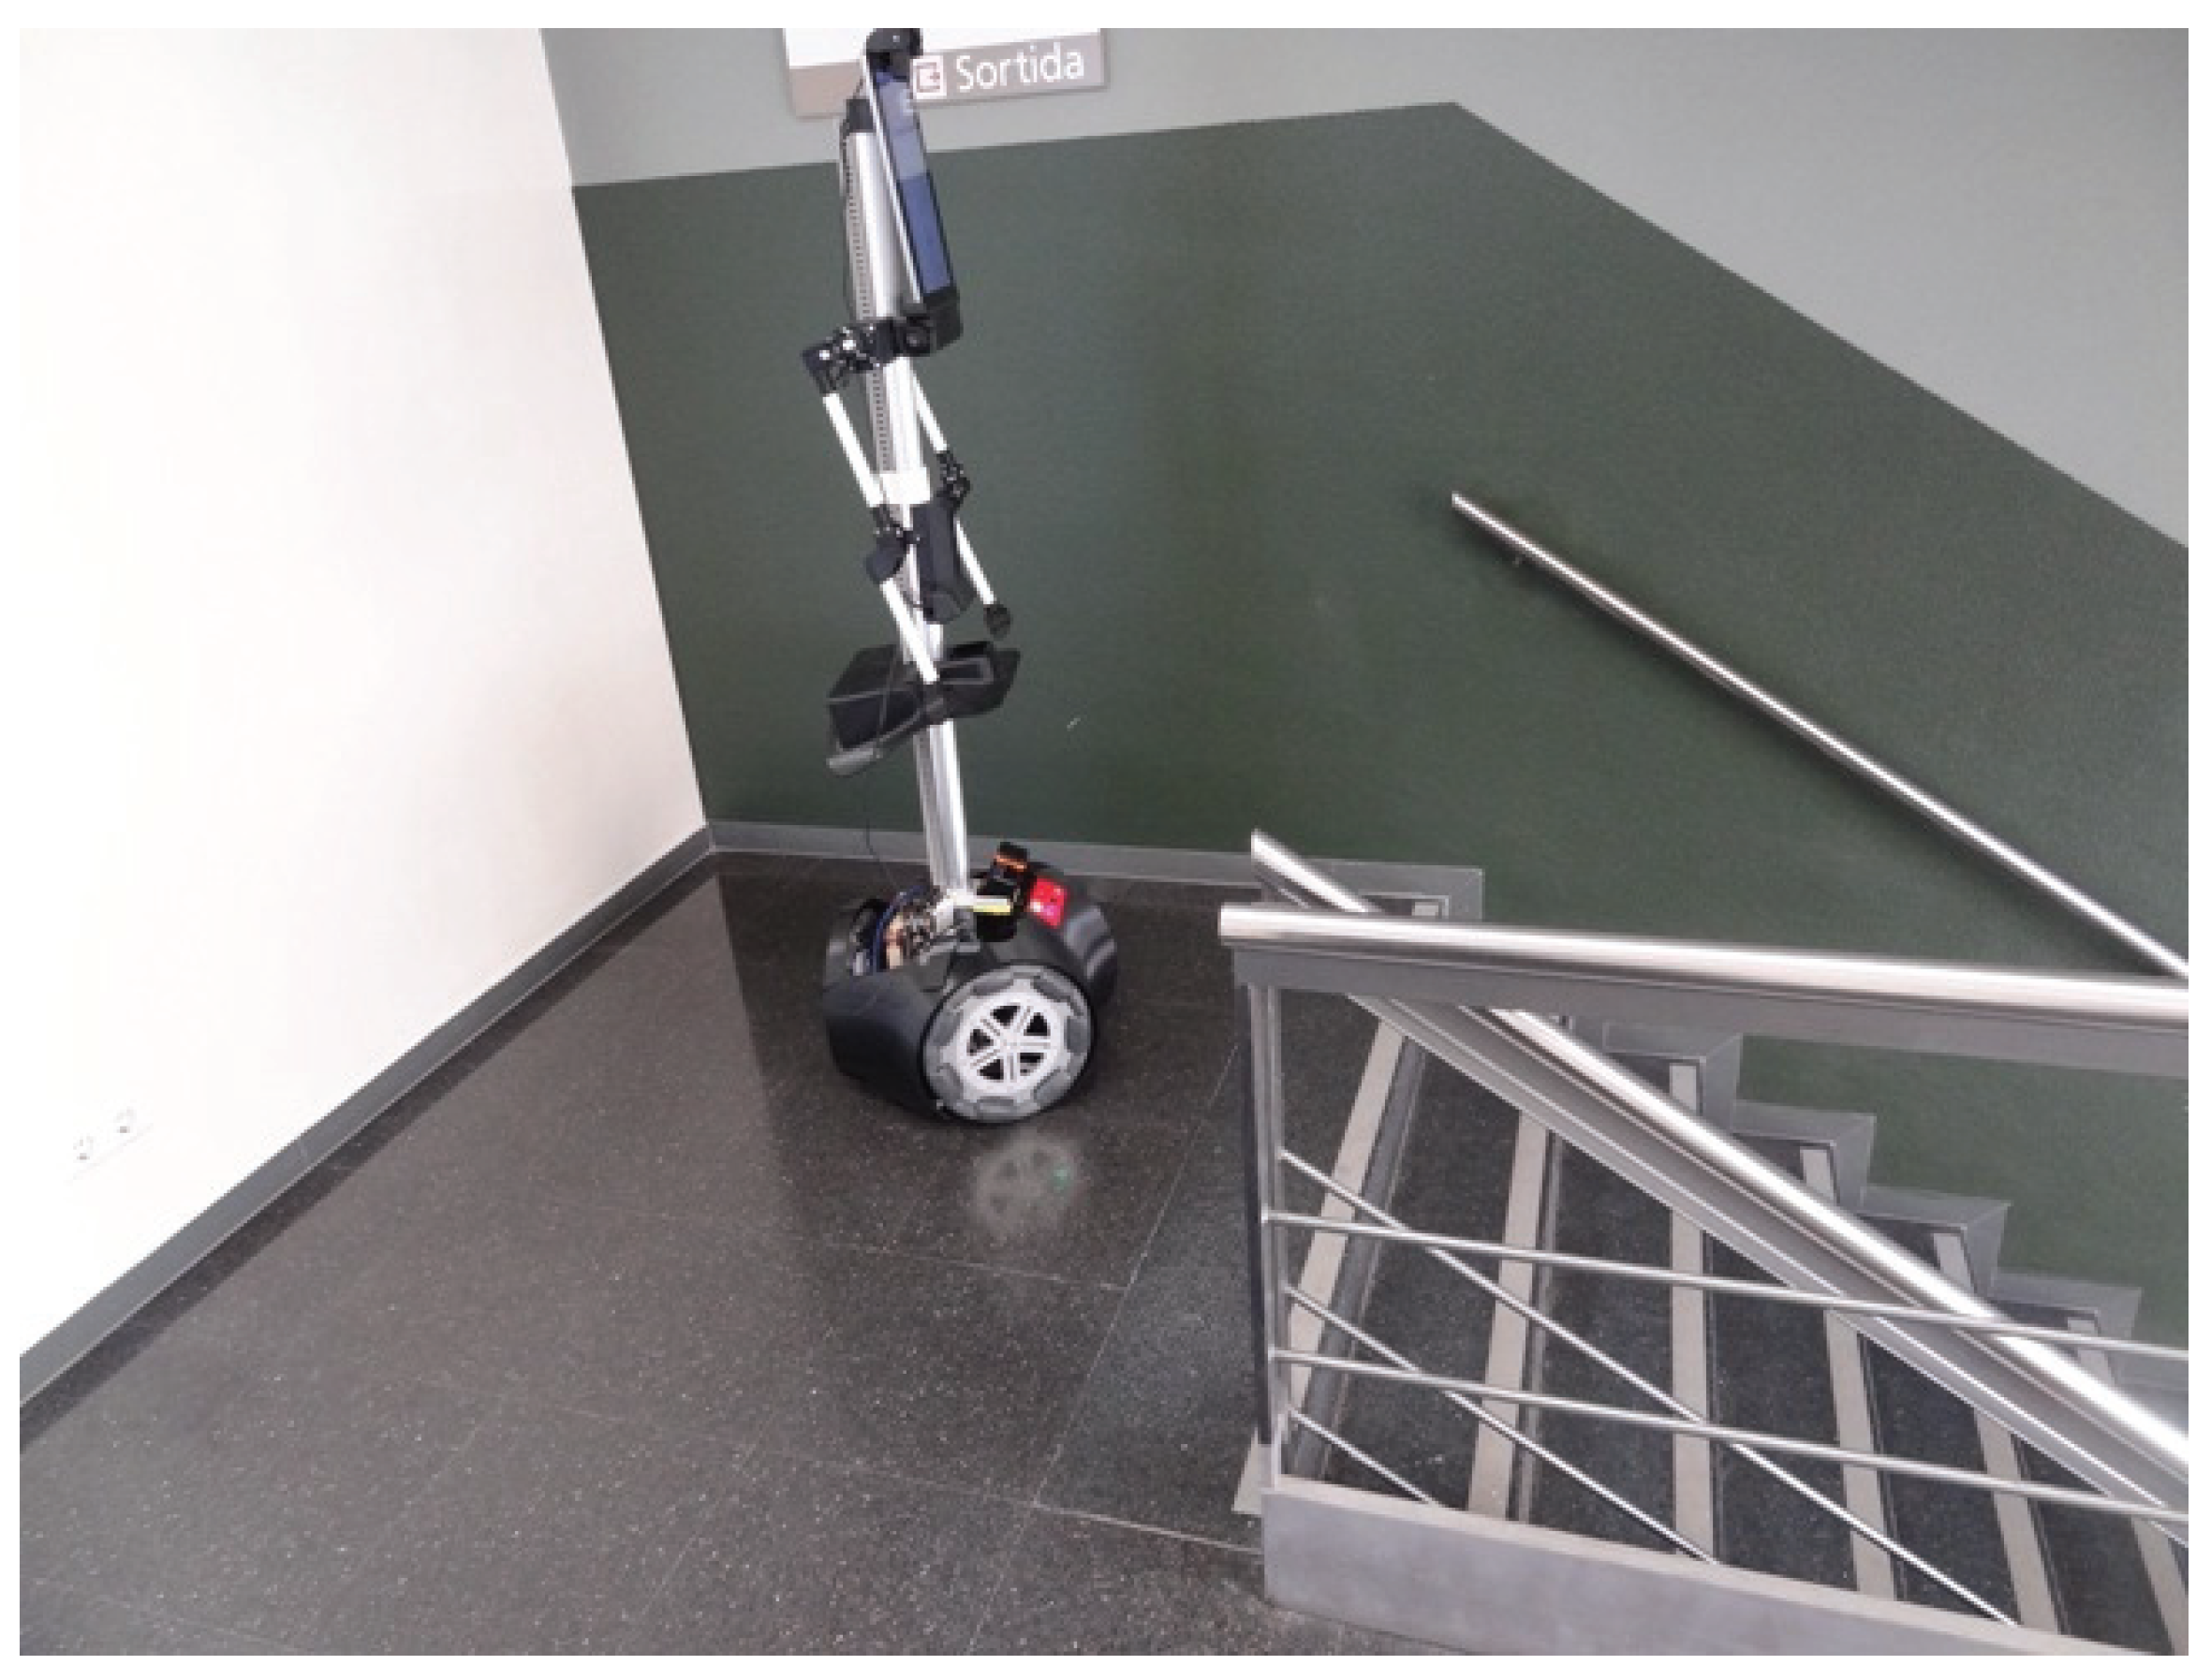
| Stairs going down |  |
| Stairs going up |  |
| Tilt | ||||||||||
|---|---|---|---|---|---|---|---|---|---|---|
| Distance | 0° | 5° | 10° | 15° | 20° | 25° | 30° | 35° | 40° | 45° |
| 250 mm | - | - | - | - | - | - | - | - | √ | √ |
| 500 mm | - | - | - | - | - | √ | √ | √ | - | - |
| 750 mm | - | - | - | - | √ | √ | - | - | - | - |
| 1000 mm | - | - | - | √ | √ | - | - | - | - | - |
| 1250 mm | - | - | - | √ | - | - | - | - | - | - |
| 1500 mm | - | - | √ | √ | - | - | - | - | - | - |
| 1750 mm | - | - | √ | - | - | - | - | - | - | - |
| 2000 mm | - | - | √ | - | - | - | - | - | - | - |
| 2250 mm | - | - | R | - | - | - | - | - | - | - |
| 2500 mm | - | - | R | - | - | - | - | - | - | - |
| 2750 mm | - | - | - | - | - | - | - | - | - | - |
| 3000 mm | - | √ | - | - | - | - | - | - | - | - |
| 3250 mm | - | √ | - | - | - | - | - | - | - | - |
| 3500 mm | - | √ | - | - | - | - | - | - | - | - |
| 3750 mm | - | √ | - | - | - | - | - | - | - | - |
| 4000 mm | - | √ | - | - | - | - | - | - | - | - |
| Tilt | ||||||||||
|---|---|---|---|---|---|---|---|---|---|---|
| Distance | 0° | 5° | 10° | 15° | 20° | 25° | 30° | 35° | 40° | 45° |
| 250 mm | √ | √ | √ | √ | √ | √ | √ | √ | √ | √ |
| 500 mm | √ | √ | √ | √ | √ | √ | √ | √ | - | - |
| 750 mm | √ | √ | √ | √ | √ | √ | - | - | - | - |
| 1000 mm | √ | √ | √ | √ | √ | - | - | - | - | - |
| 1250 mm | √ | √ | √ | √ | - | - | - | - | - | - |
| 1500 mm | √ | √ | √ | - | - | - | - | - | - | - |
| 1750 mm | √ | √ | √ | - | - | - | - | - | - | - |
| 2000 mm | √ | √ | √ | - | - | - | - | - | - | - |
| 2250 mm | √ | √ | R | - | - | - | - | - | - | - |
| 2500 mm | √ | √ | R | - | - | - | - | - | - | - |
| 2750 mm | √ | √ | R | - | - | - | - | - | - | - |
| 3000 mm | √ | √ | R | - | - | - | - | - | - | - |
| 3250 mm | √ | √ | R | - | - | - | - | - | - | - |
| 3500 mm | √ | √ | R | - | - | - | - | - | - | - |
| 3750 mm | √ | √ | - | - | - | - | - | - | - | - |
| 4000 mm | √ | √ | - | - | - | - | - | - | - | - |
| Down Stairs Distance | Tilt | |||||||||
|---|---|---|---|---|---|---|---|---|---|---|
| 0° | 5° | 10° | 15° | 20° | 25° | 30° | 35° | 40° | 45° | |
| 250 mm | 5632 mm | S | S | S | S | S | S | S | S | S |
| 500 mm | 5856 mm | S | S | S | S | S | S | S | G | G |
| 750 mm | 6071 mm | S | S | S | S | S | G | G | G | G |
| 1000 mm | 6340 mm | S | S | S | S | G | G | G | G | G |
| 1250 mm | 6642 mm | S | S | S | G | G | G | G | G | G |
| 1500 mm | 6907 mm | S | S | G | G | G | G | G | G | G |
| Up Stairs Distance | Tilt | |||||||||
|---|---|---|---|---|---|---|---|---|---|---|
| 0° | 5° | 10° | 15° | 20° | 25° | 30° | 35° | 40° | 45° | |
| 250 mm | 780 | 492 | 510 | 499 | 515 | 430 | 350 | 270 | 265 | 251 |
| 500 mm | 1012 | 729 | 764 | 759 | 575 | 500 | 479 | 500 | G | G |
| 750 mm | 1305 | 1036 | 1010 | 787 | 739 | 765 | G | G | G | G |
| 1000 mm | 1596 | 1291 | 1254 | 984 | 1001 | G | G | G | G | G |
| 1250 mm | 1812 | 1513 | 1267 | 1239 | G | G | G | G | G | G |
| 1500 mm | 2042 | 1746 | 1151 | G | G | G | G | G | G | G |
© 2020 by the authors. Licensee MDPI, Basel, Switzerland. This article is an open access article distributed under the terms and conditions of the Creative Commons Attribution (CC BY) license (http://creativecommons.org/licenses/by/4.0/).
Share and Cite
Palacín, J.; Martínez, D.; Rubies, E.; Clotet, E. Mobile Robot Self-Localization with 2D Push-Broom LIDAR in a 2D Map. Sensors 2020, 20, 2500. https://doi.org/10.3390/s20092500
Palacín J, Martínez D, Rubies E, Clotet E. Mobile Robot Self-Localization with 2D Push-Broom LIDAR in a 2D Map. Sensors. 2020; 20(9):2500. https://doi.org/10.3390/s20092500
Chicago/Turabian StylePalacín, Jordi, David Martínez, Elena Rubies, and Eduard Clotet. 2020. "Mobile Robot Self-Localization with 2D Push-Broom LIDAR in a 2D Map" Sensors 20, no. 9: 2500. https://doi.org/10.3390/s20092500
APA StylePalacín, J., Martínez, D., Rubies, E., & Clotet, E. (2020). Mobile Robot Self-Localization with 2D Push-Broom LIDAR in a 2D Map. Sensors, 20(9), 2500. https://doi.org/10.3390/s20092500