Communication

Load Measurement of the Cervical Vertebra C7 and the Head of Passengers of a Car While Driving across Uneven Terrain

1
Faculty of Mechanical Engineering, Jan Evangelista Purkyně University, 400 96 Ústí nad Labem, Czech Republic
2
Faculty of Military Technology, University of Defence, 662 10 Brno, Czech Republic
3
Faculty of Physical Education and Sport, Charles University, José Mártího 31, 162 52 Praha 6, Czech Republic
4
Faculty of Mechanical Engineering, University of Žilina, 010 26 Žilina, Slovakia
5
Faculty of Mechanical Engineering, Poznan University of Technology, 60-965 Poznan, Poland
*
Author to whom correspondence should be addressed.
Sensors 2021, 21(11), 3849; https://doi.org/10.3390/s21113849
Submission received: 2 April 2021 / Revised: 27 May 2021 / Accepted: 27 May 2021 / Published: 2 June 2021
(This article belongs to the Section Vehicular Sensing)

Abstract

:
The article deals with the measurement of dynamic effects that are transmitted to the driver (passenger) when driving in a car over obstacles. The measurements were performed in a real environment on a defined track at different driving speeds and different distributions of obstacles on the road. The reaction of the human organism, respectively the load of the cervical vertebrae and the heads of the driver and passenger, was measured. Experimental measurements were performed for different variants of driving conditions on a 28-year-old and healthy man. The measurement’s main objective was to determine the acceleration values of the seats in the vehicle in the vertical movement of parts of the vehicle cabin and to determine the dynamic effects that are transmitted to the driver and passenger in a car when driving over obstacles. The measurements were performed in a real environment on a defined track at various driving speeds and diverse distributions of obstacles on the road. The acceleration values on the vehicle’s axles and the structure of the driver’s and front passenger’s seats, under the buttocks, at the top of the head (Vertex Parietal Bone) and the C7 cervical vertebra (Vertebra Cervicales), were measured. The result of the experiment was to determine the maximum magnitudes of acceleration in the vertical direction on the body of the driver and the passenger of the vehicle when passing a passenger vehicle over obstacles. The analysis of the experiment’s results is the basis for determining the future direction of the research.

1. Introduction

There is a constant dynamic load of the movement apparatus in a person’s everyday life. The well-being of a person often deteriorates over time, mostly when it comes to prolonged unilateral activities. Because of the excessive load during work activities there are often problems such as backache, degeneration of cervical vertebrae, so-called ‘tennis elbows’ or even the gangrene of fingers or an illness leading to death. Some of the most affected groups are truck drivers and train operators exposed to vibrations while moving in a wheel or rail-based vehicles. Other professionals who often encounter these conditions are sportspeople, construction workers, workers using sledgehammers or jackhammers, sedentary job workers, etc. [1,2].
In the case of cars, the issue of the comfort of the vehicle driver and other passengers is often addressed, and currently solved in line with the driveability of vehicles and especially their driving safety [3,4].
Properly set driving comfort will cause the least possible nerve and muscle fatigue, and it is mainly affected by mechanical shocks, noise, visibility, thermal comfort and a number of other factors. Comfort for the driver and passengers is largely ensured by the car’s interior, which provides them with driving comfort, protects from by unwanted dynamic loads or noise and allows lightness and ease when getting on and off [1].
The degree of overload of the organism can manifest itself in humans in the form of headaches or pain in the cervical or lumbar spine. Many studies deal with the long-term burden on the body of drivers or other workers [5].
At the beginning of 1970, biomechanics had already taken an interest in body damage as a result of external mechanical causes. It mainly dealt with injuries caused by road accidents and sports injuries. There was an effort to increase the prevention of these accidents. The main focus was directed toward the most common causes of serious injuries of the head, chest and spine [6].
Vertebrogenic disorders are a common health problem today. “About 60% of patients coming to the doctor in the Czech Republic report back pain” (Dylevský 2009). There are several reasons for these problems. They can be caused by hypokinesia (lack of exercise) or, conversely, by hyperkinesis (an excessive amount of exercise or excessive exercise). Specific causes include unhealthy lifestyles and associated lack of exercise, obesity, sedentary employment, etc. Conversely, back pain is caused in many cases by employment which by its very nature places disproportionate demands on the spinal system. This applies, for example, to professional drivers and workers with heavy mechanical machines. Last but not least, back pain caused by hyperkinesia can be traced in professional athletes [1,3,4,7].
Many studies (e.g., Rubin et al. 2008, Jandák 2007, Fritz 2000) mention that long-term body exposure to vibrations leads to an unfavorable response in the human body, which can result in irreversible damage. People are exposed to these kinds of vibrations, for instance, while using vehicles and working with mechanical machines in machinery, metallurgical industry, construction or mining industry [3,4,7].
The aim of the study (Bovenzi et al. 2002) was to measure car seat vibrations in 12 taxis in operation under current working conditions. The results were evaluated according to the health norms ISO 2631-1:1997. The relationship between the total traveled distance and whole-body vibrations was reviewed. The whole-body vibrations were measured for over four hours on a route around Fukuoka City, in Japan, under normal conditions. The roads in this region are paved, without significant inequalities. Thus the researchers estimated that the road conditions for taxis would be similar. The study’s outcome was that 83% of taxi drivers fall within ‘the potential risk’ zone [8].
A study (Kumar et al. 1999) examined the effect of whole-body vibrations on the lumbar spine of farmers driving a tractor. There were two test groups: the first one consisted of 50 farmers who regularly use a tractor (they are commonly exposed to the vibrations transmitted to the human body); the other group consisted of 50 farmers who do not use a tractor at all. They were divided by age, gender, economy and everyday labor. Both groups underwent magnetic resonance (MRI) in order to assess the effect of these vibrations on degenerative changes in the back. The researchers also measured the magnitude of vibrations emitted by tractors. The results of the study showed that a backache was more common in the group of tractor drivers (40%) than in the farmers who did not use these vehicles (18%) [9].
The focus of a study by Israeli researchers (Alperowitch-Najenson et al. 2010) was to find out about the prevalence of LBP (low back pain) among Israeli professional bus drivers and to evaluate the association of LBP with psychosocial and ergonomic risk factors. This cross-cutting study was carried out with the help of the bus drivers of the biggest public transport company in the Metropolitan region of Tel Aviv [10]. The result, a 45% LBP prevalence in Israeli drivers, is comparable with other study results (Robb, Mansfield 2007), where a 60% prevalence of LBP was discovered (in a 12-month period) among professional truck drivers. Furthermore, there was a different study on taxi drivers in Taipei, where the discovered LBP prevalence was 51% (also in a 12-month period) [11].
In another work (Netterstrom and Juel 1989), the LBP occurrence among public bus drivers in Denmark was assessed, and a 57% LBP prevalence was discovered. In the following study (Magnusson et al. 1996), a group of American and Swedish bus drivers was tested, and a 60% prevalence of LBP was reported. These problems required 18 days of sick leave on average. When compared, the truck drivers’ group suffers from backache more often than the group of workers with sedentary jobs [12].
A further study (Donnelly et al. 2009) proved that the car seat’s ability to adjust to the driver is associated with the onset and range of the driver’s discomfort. The use of a lumbar support system proved to be effective in keeping the physiological lordotic position of the spine while sitting, which was linked to decreasing discomfort in the lumbar region. This intervention also proved that discomfort is reduced by increasing or maintaining local tissue nutrition [13].
In yet another study (Chen et al. 2005), the researchers took an interest in LBP occurrence among taxi drivers. This cross-cutting study aimed to research the influence of the seat angle, using the lumbar rest, and the prevalence of clinically significant LBP among taxi drivers. With 224 test subjects, the average angle value of the back/thigh was 80.6°. Fifty-five per cent of taxi drivers used the lumbar rest regularly; however, 25% reported significant LBP. LBP prevalence was 23%, 37% and 9% among the drivers who had the back/thigh angle < 86°, 86–91° and > 91° on average, respectively. The drivers who did not use a lumbar rest had an 18% LBP prevalence compared to 34% with adjusted rest. Neither the seat nor the rest alone was prominently linked to LBP [14].
The acceleration values (Ravnik 2002) of some of the vibrations we are exposed to in vehicles are [15]
• car0.20–0.75 m.s−2
• bus0.40–0.80 m.s−2
• tractor0.40–2.80 m.s−2
• forklift0.40–2.00 m.s−2
• locomotive0.30–0.60 m.s−2
• tank1.50–3.50 m.s−2
• ship0.50–0.70 m.s−2
• helicopter0.10–1.55 m.s−2
It is obvious that the dynamic load during the driving of the vehicle results in a load on the crew, which in the long run affects their health. The experiment aimed to determine what vertical acceleration values are transmitted from the vehicle structure to the driver’s and passenger’s body at the highest point of the parietal bone (Vertex Parietal Bone) and the vertebrae of the cervical spine C7 (Vertebrae Cervicales) as the vehicle passes over obstacles at different speeds.
The cervical vertebra C7 was chosen due to the frequency of cervical vertebrae injuries (C0 to C2 = 20%, C3 to C7 = 80%) [1,16,17]. Vertebra C7 is also the most easily palpable.
In the past, researchers have sought to examine the load of the crew when driving in wheeled vehicles in a number of other scientific works that helped in solving this work and writing this article (e.g., Černohlávek 2020, Pelcová et al. 2006; Harrison et al. 2000; Nest 2000; Zhao and Wang 2019; Quoc et al. 2020; Kajiwara et al. 2021; Peng et al. 2020) [18,19,20,21,22,23,24].
As mentioned above, the dynamic loads and response of the vehicle crew are often an issue. This article develops the results of a pilot measurement carried out in 2019 [25]. An earlier pilot measurement proved the suitability of the set measuring chain as well as the suitability of the used acceleration sensors for measuring the dynamic load of the vehicle crew. This article develops the mentioned pilot measurement and gives clearer information about the increase of the dynamic load of the crew when crossing selected inequalities at speeds up to 50 km.h−1. The results of this measurement will continue to be used for the construction and verification of a mathematical model in the MSC ADAMS program, where acceleration values at higher speeds will be determined, and which cannot be investigated experimentally due to the risk of crew injury.

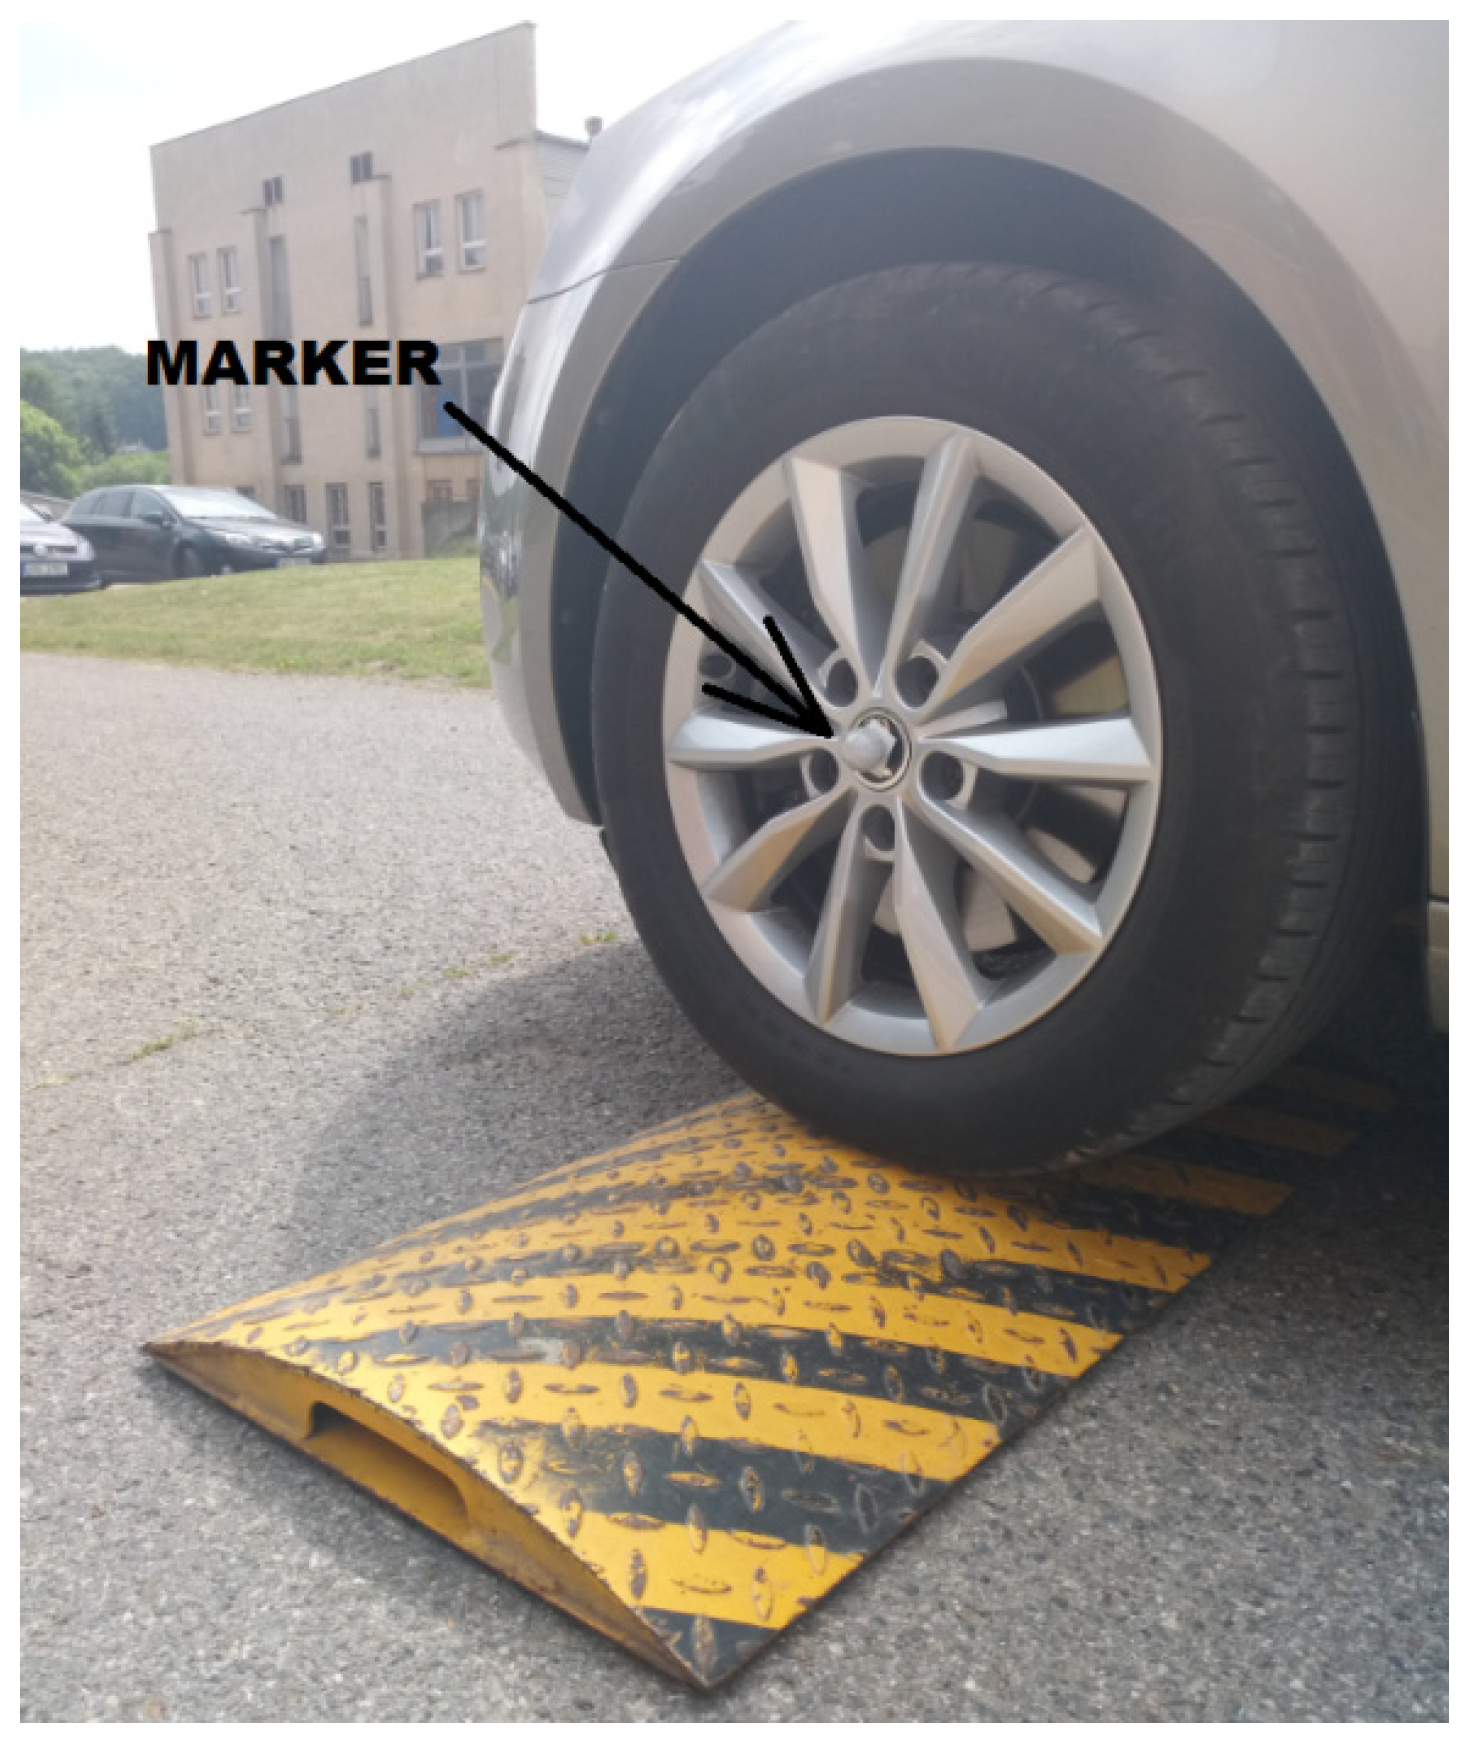
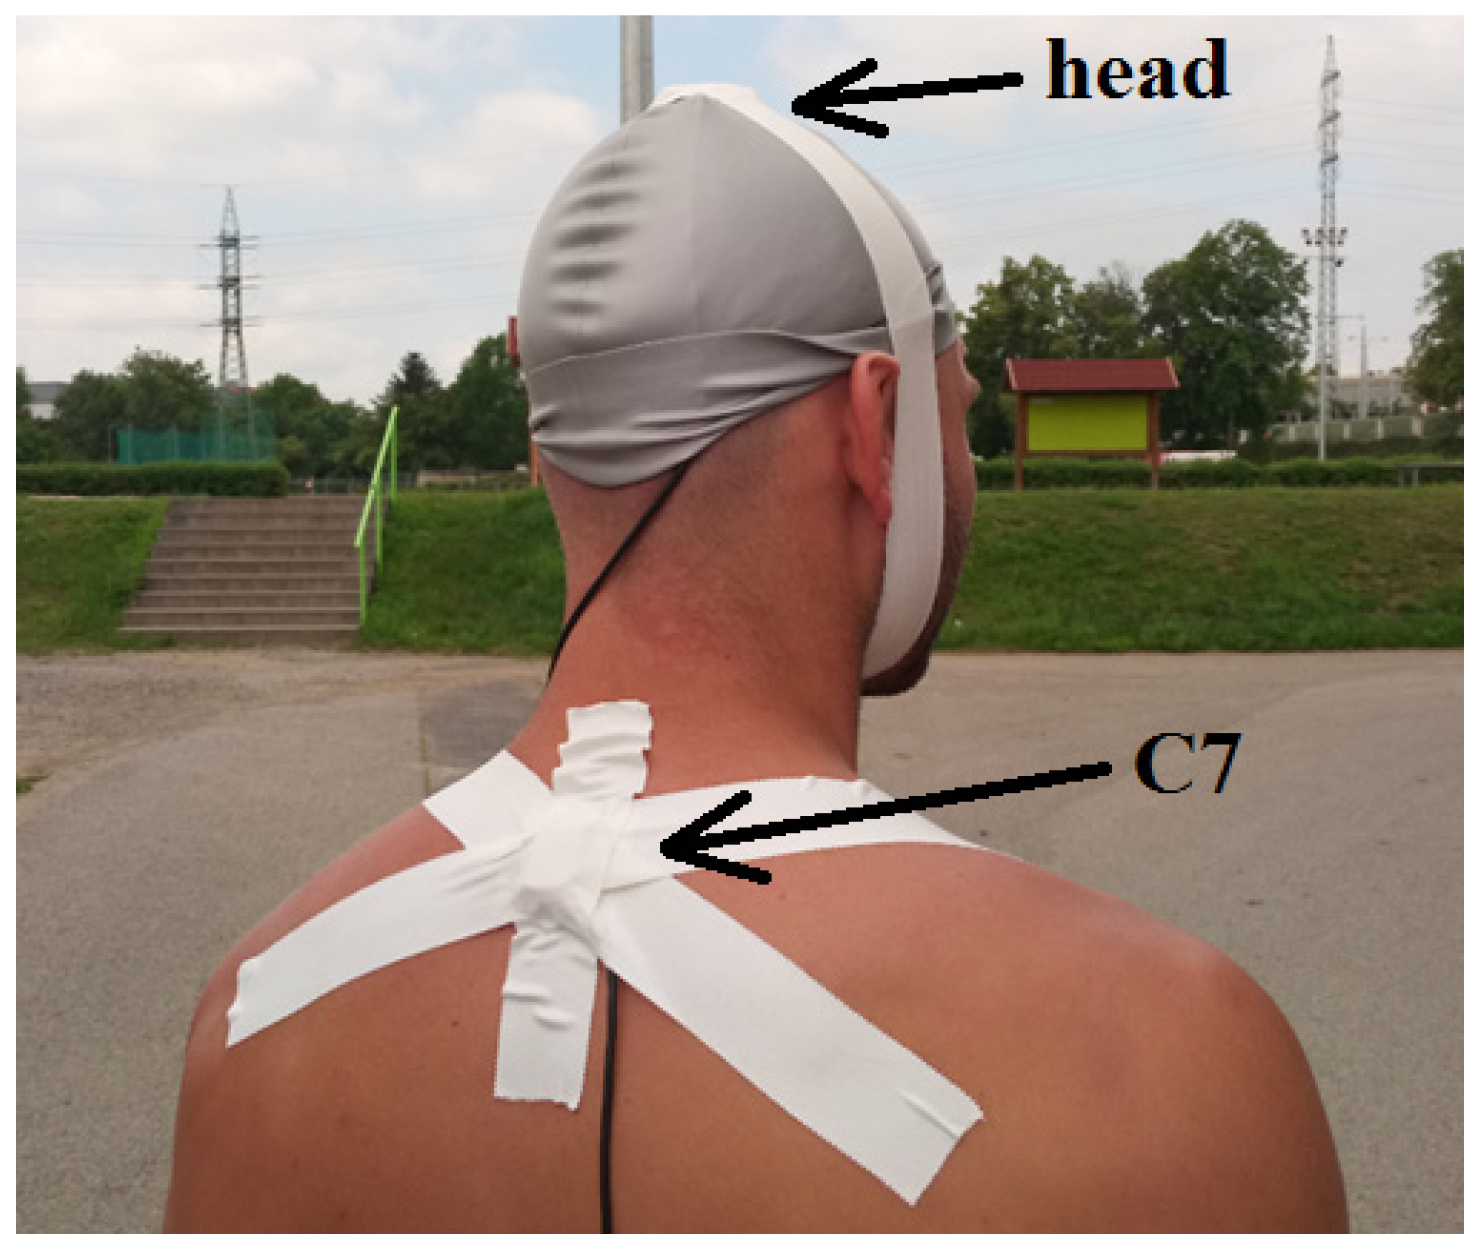
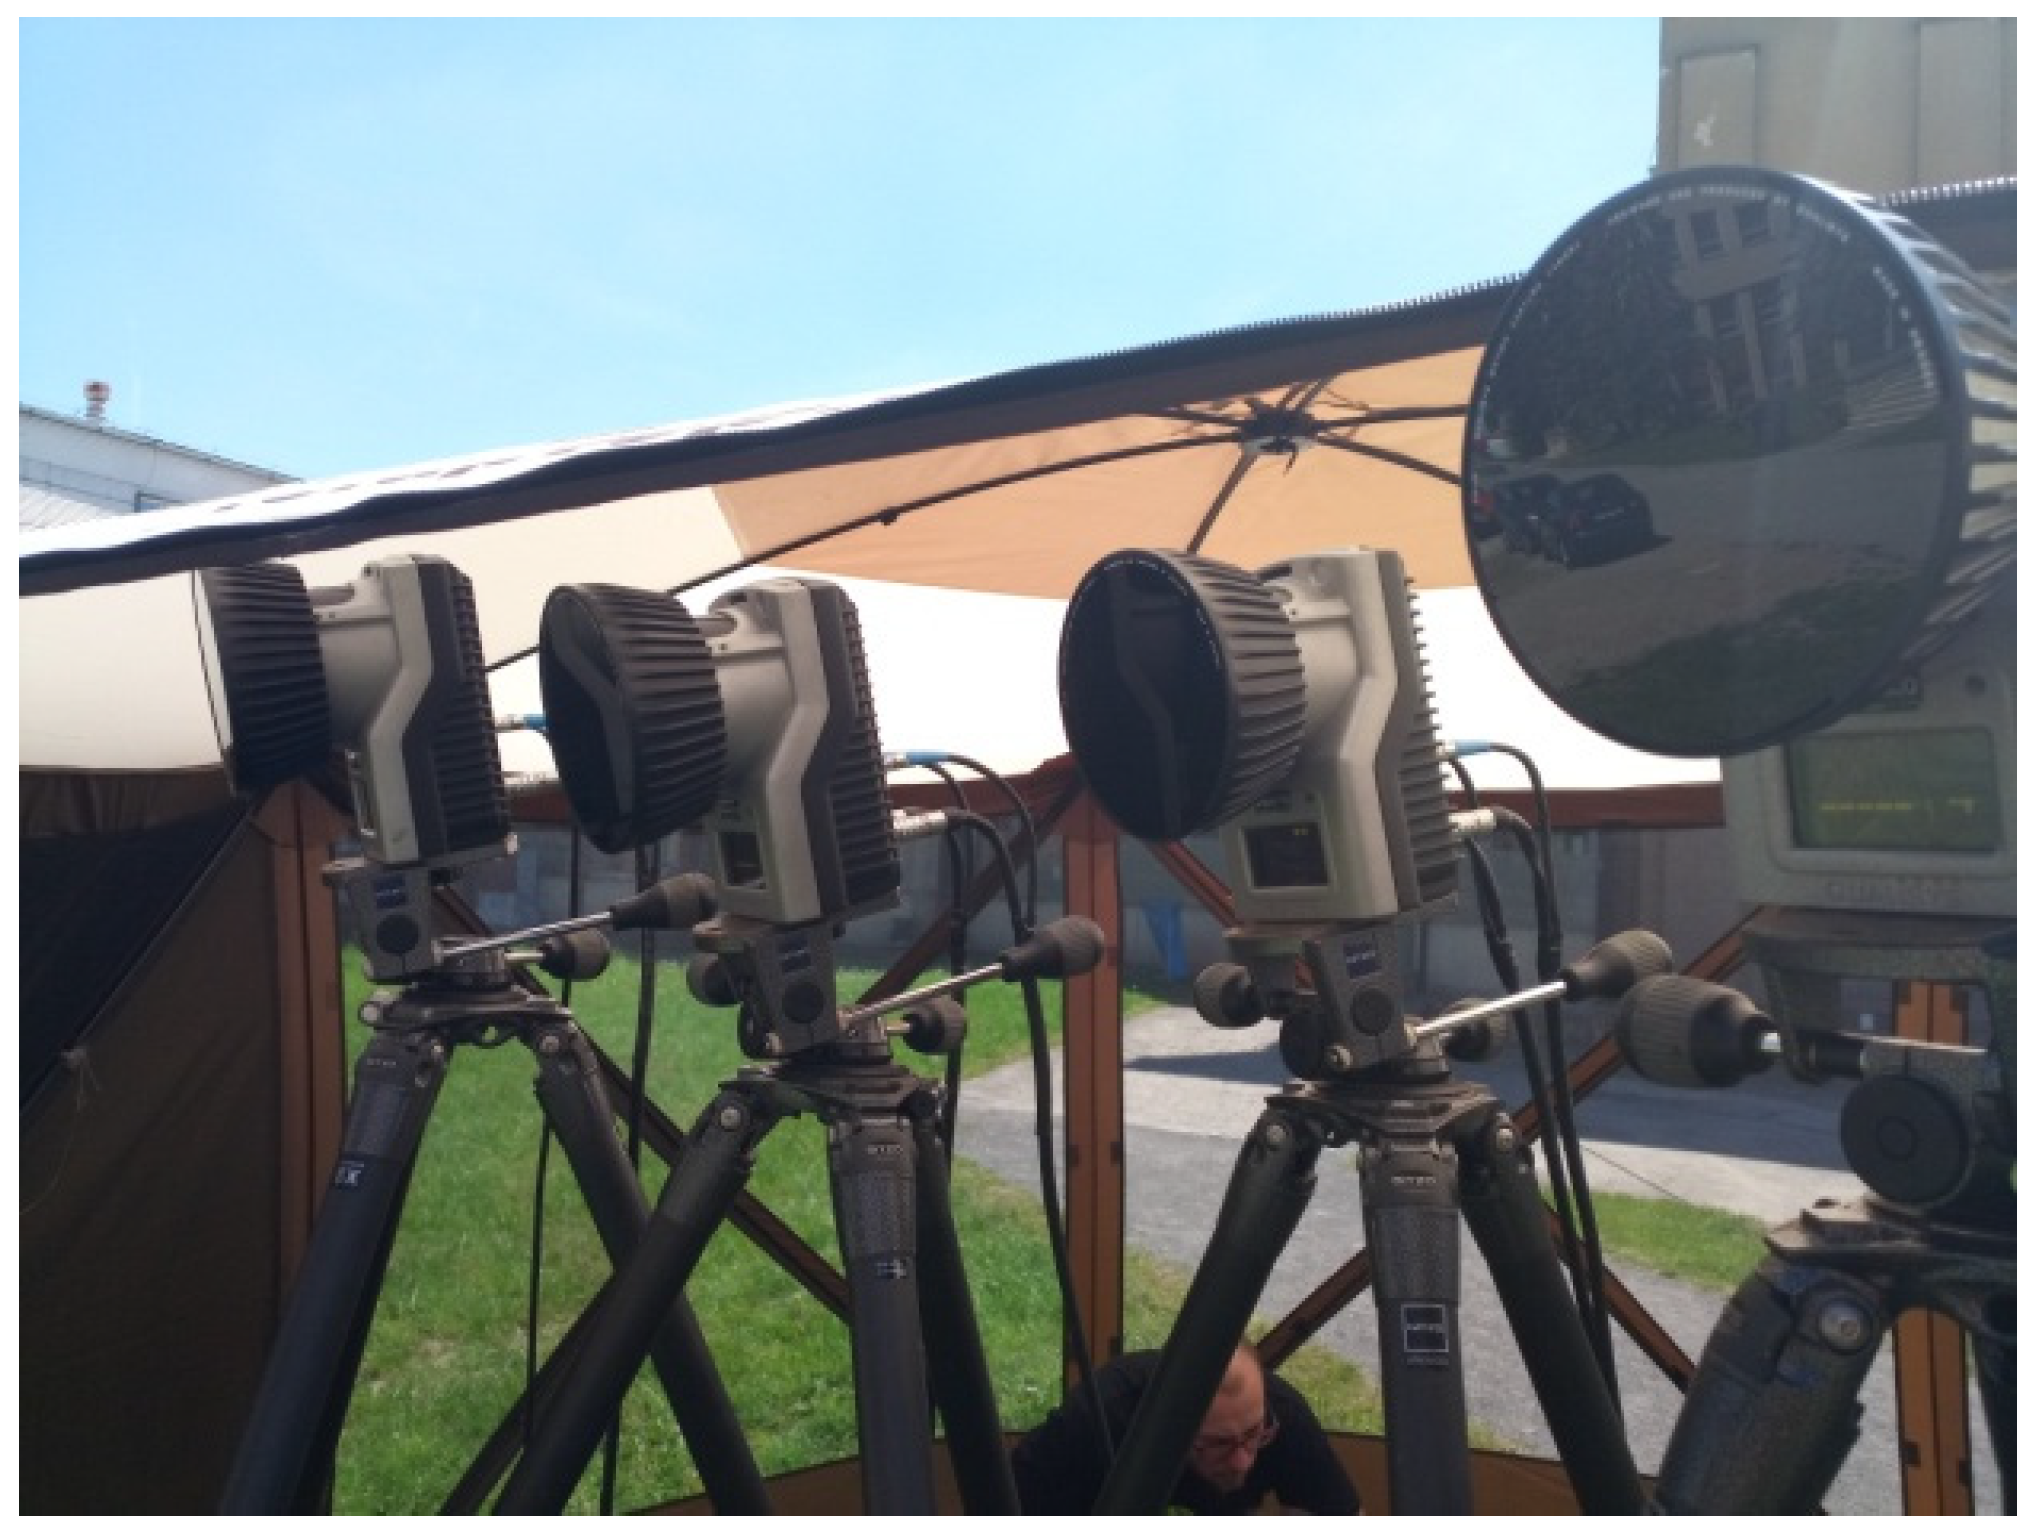
2. Experimental Solution

The measurement was performed experimentally in a Škoda Octavia passenger car (2016). The ride was made on a flat road on which obstacles were placed. The vehicle was excited by passing over 50-mm-high retarders (Figure 1).
Figure 2 shows the distribution of obstacles (cylindrical retarders) on the track. The obstacles were 15 m apart (a sufficient distance to dampen the vehicle’s vibrations). Five obstacle speeds were selected, and the readings were measured in the first five rides on the driver, and then on the passenger (human). The measurement was performed in a total of ten different variants in the number of seven replicates, see Table 1.
The magnitudes of the accelerations generated on the structure of the passenger seat, under the buttocks (Figure 3) at the highest point of the parietal bone of the head (Vertex Parietal Bone) and the cervical vertebra C7 (Vertebra Cervicales), shown in Figure 4, were measured.
The subjects were healthy men (5 men aged from 25 to 30) without injuries. The aim of the work was to determine how much dynamic effects are transmitted from the vehicle structure to the body of the driver/passenger—respectively, to the head and vertebra of the cervical spine C7 (vertebrae cervicales)—when the vehicle is overcoming obstacles. The vehicle speed was also measured by a Qualisys camera system (Figure 5). Using four infrared cameras, the movement of the markers (balls with a diameter of 9 mm) glued to the vehicle (wheels, body) was recorded. A total of nine markers were placed on the vehicle. The marker which was placed on the center of the wheel, can be seen in Figure 1 and Figure 6a,b.
Acceleration and position sensors were connected to MMF preamplifiers: Dewetron MSI-BR-ACC-S1 and SMS: Dewetron MSI-BR-CH-50, on each channel to the Dewesoft STGM + amplifier. The data processing device Dewesoft Siruis Sbox + battery pack was used for signal processing (the device will be placed in a car-scanning frequency of 20,000 Hz, scanned without the use of built-in HW signal filters).
Sensor types:
  • 3x triaxial accelerometer MMF KS 943B.100 (10 mV/m.s−2)—placed on the head and vertebra C7;
  • 1x triaxial accelerometer MMF KS 943B.10 (1 mV/m.s−2)—located on the car seat frame under the seat;
  • 2x uniaxial accelerometer SMS MH 118 (1 pC/m.s−2)—located between the buttocks and the seat and on the wheel suspension.

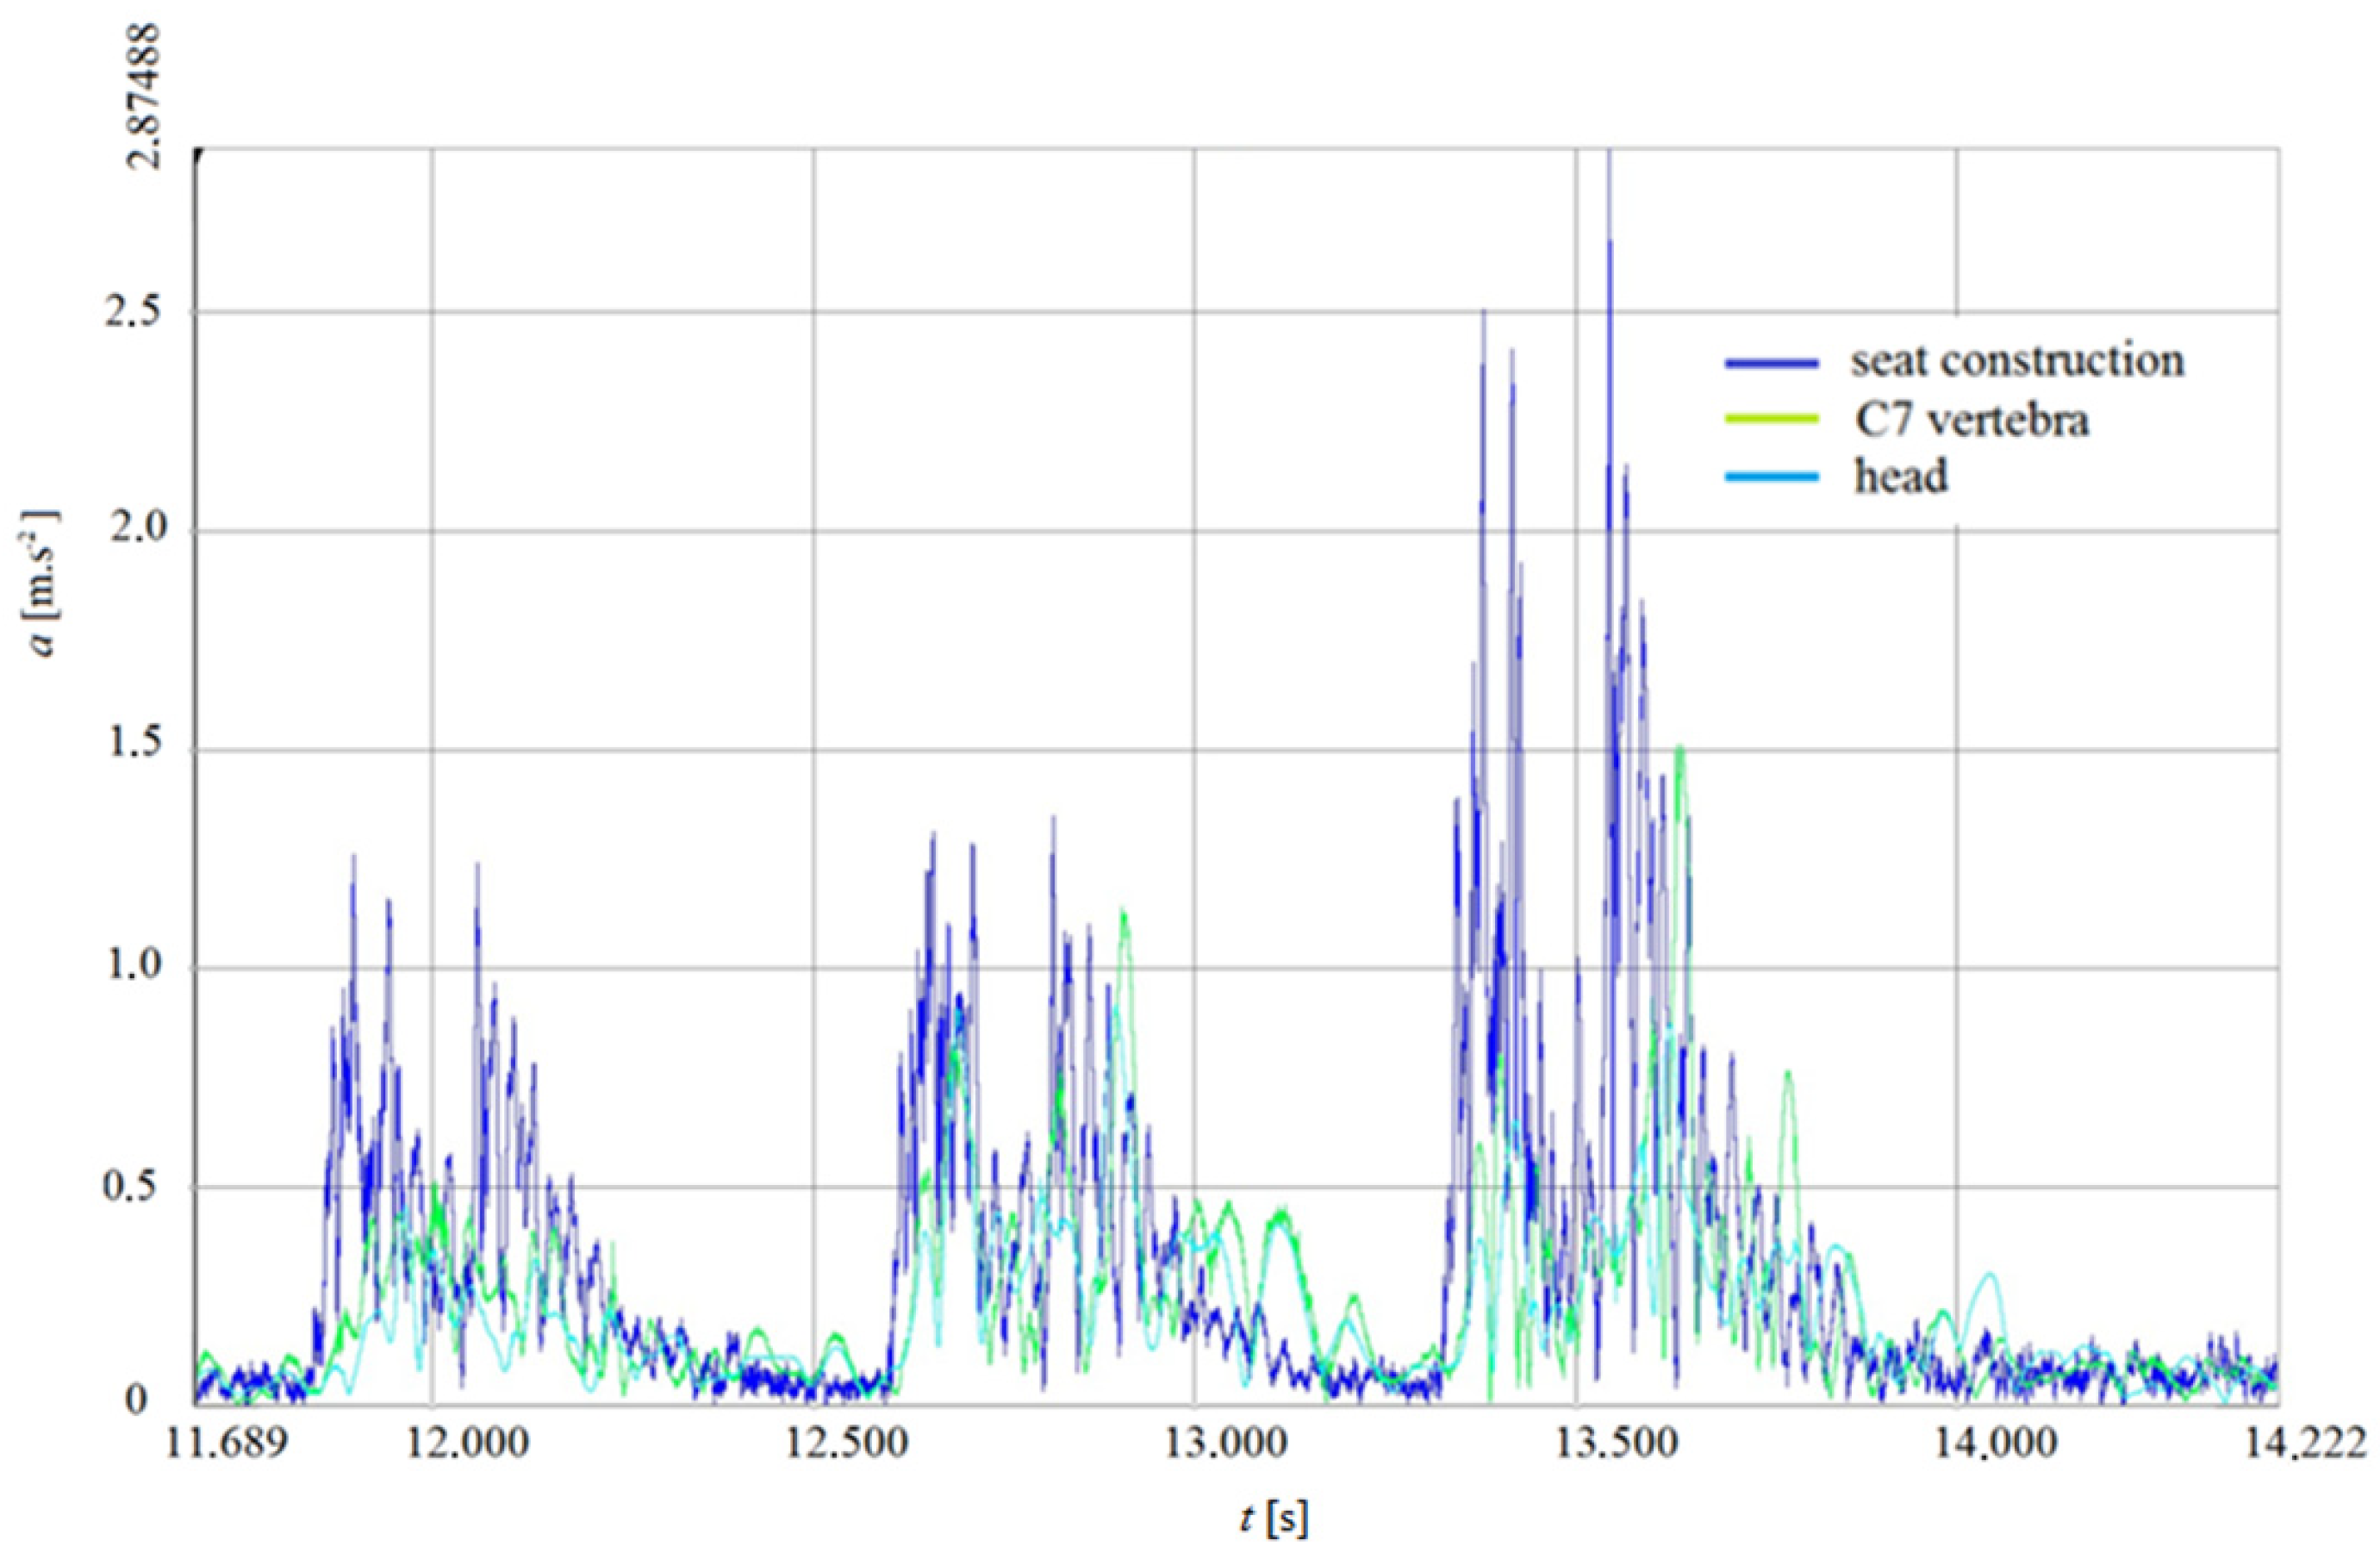
3. Measurements Results

Table 2 shows the average values of the obstacle acceleration measured on the driver (human) of a passenger car vehicle (average acceleration values for measurement variants V1 to V35). Table 3 shows the average values of the obstacle acceleration measured on the passenger (human) of a passenger car (measurement variants V36 to V70).
The sample standard deviation with the acceleration values of the given sensor for the given speed crossing the inequality was calculated according to the formula:
s = s 2 = 1 N i = 1 n ( x i x ¯ ) 2
The variance of Var () values was calculated according to the relation:
V a r ( X ) = 1 N i = 1 n ( x i x ¯ ) 2
Table 4 shows the measured and processed acceleration values for variants V50 to V56.
The results of the performed measurements were graphically processed in the program Dewesoft X3 and MS Excel.
The graphical results are shown in Figure 7 and Figure 8. A set of trends—a polynomial of the second degree—was drawn with a set of measured values to obtain the dependence of the acceleration on the speed at which the obstacles were crossed.
The graph created in the Dewesoft X3 software can be seen in Figure 9 and Figure 10. The graph shows the crossing of all three retarders. The left, the middle and the right part of the graph refer to the right wheel, the left wheel and the acceleration value of both wheels while crossing over the retarders, respectively.

4. Conclusions

From the performed measurements, the magnitudes of the average accelerations that affect the vehicle crew while driving in a passenger car when crossing obstacles while driving directly on the road were determined. When crossing obstacles at the highest speed of the vehicle (50 km.h−1), an acceleration of 1.516 m.s−2 and the highest head peak of 1.316 m.s−2 were measured on a person seated in the driver’s seat on the C7 vertebra.
The passenger (human) was also affected by the greatest acceleration when crossing the vehicle at the highest obstacle course speed (50 km.h−1). The maximum acceleration of the head was measured at 1.153 m.s−2, whereas in the area of the vertebra C7 it was 1.624 m.s−2. The measured maximum values on the driver’s /passenger’s body were determined when crossing an obstacle with both wheels at the same time.
Based on the performed measurements, we can state that the driver and front passenger can be burdened with greater dynamic effects in the vehicle than stated in scientific publications; therefore, it is necessary to further discuss this issue and address increasing driving safety for the vehicle crew.
Structural modifications of the vehicle (e.g., attaching a car seat, shaping a car seat or searching for new materials with a higher damping effect) might be a solution
The results of the experiment showed the magnitudes of the dynamic load of the car crew when crossing uneven surfaces at different crossing speeds. The dynamic effects affecting the car crew were measured at the driver’s and front passenger’s seats. It has been shown that a person is burdened by higher acceleration values when driving a car than stated by Ravnik (2005).
The results of our work confirmed previously performed studies that dealt with the dynamic load of people in vehicles [5,10,19,25,26]. This issue needs to be further addressed. Reducing the dynamic load on a vehicle crew can be achieved by further improving the quality of the suspension system. Another possibility to reduce the dynamic load is the possibility of a design modifying the seat attachment, with the possibility of an additional safe suspension mechanism.

Author Contributions

Conceptualization, M.C. and M.S. (Martin Svoboda); methodology, M.S. (Martin Svoboda), K.J., F.L. and Z.K.; validation, P.K., M.S. (Milan Sapieta) and M.S. (Marcin Suszyński); formal analysis, P.K. and M.S. (Milan Sapieta); supervision, M.C. and K.J.; investigation, M.S. (Martin Svoboda) and P.K.; data curation, P.K. and M.S. (Milan Sapieta); writing—original draft preparation, M.S. (Martin Svoboda); writing—review and editing, M.S. (Martin Svoboda). All authors have read and agreed to the published version of the manuscript.

Funding

This work was supported by the Ministry of Science and Higher Education of Poland (No. 0614/SBAD/1529).

Institutional Review Board Statement

The study was conducted according to the guidelines of the Declaration of Helsinki, and approved by the Institutional Review Board (or Ethics Committee) of Ethics Committee of Faculty of Mechanical Engineering Jan Evangelista Purkyně University in Ústí Nad Labem (10 May 2020).

Informed Consent Statement

Informed consent was obtained from all subjects involved in the study.

Conflicts of Interest

The authors declare no conflict of interest.

References

  1. Dylevský, I. Funkční Anatomie—1. Vyd; Grada: Praha, Czech Republic, 2009; p. 544. ISBN 978-80-247-3240-4. [Google Scholar]
  2. Battaglia, G.; Giustino, V.; Iovane, A.; Bellafiore, M.; Martines, F.; Patti, A.; Palma, A. Influence of occlusal vertical dimension on cervical spine mobility in sports. Acta Med. 2016, 32, 1589. [Google Scholar]
  3. Rubin, C.; Pope, M.; Fritton, J.C.; Magnusson, M.; Hansson, T.; Mcleod, K. Transmissibility of 15-Hertz to 35-Hertz Vibrations to the Human Hip and Lumbar Spine: Determining the Physiologic Feasibility of Delivering Low-Level Anabolic Mechanical Stimuli to Skeletal Regionsat Greatest Risk of Fracture Because of Osteoporosis. Spine 2008, 28. [Google Scholar] [CrossRef] [PubMed] [Green Version]
  4. Jandák, Z. Vibrace Přenášené na Člověka. State Health Institute. 2007. Available online: http://www.szu.cz/tema/pracovni-prostredi/vibrace-prenasene-nacloveka (accessed on 4 January 2021).
  5. Hrubý, J.; Krobot, Z. Hodnocení zraňujícího účinku volně uložených předmětů ve vozidle při dopravní nehodě. Úrazová Chir. 2018, 2018, 116–135. [Google Scholar]
  6. Hnízdil, J. Bolesti Zad Jako Životní Realita: Jejich Příčiny, Diagnostika, Terapie, a Prevence; Triton: Praha, Czech Republic, 2000; p. 167. ISBN 80-7254-098-X. [Google Scholar]
  7. Fritz, M. Description of the Relation between the Forces Acting in the Lumbar Spine and Whole-Body Vibrations by Means of Transfer Functions. Clin. Biomech. 2000, 15, 234–240. [Google Scholar] [CrossRef]
  8. Bovenzi, M.; Pinto, I.; Stacchini, N. Low back pain in port machinerry operators. J. Sound Vib. 2002, 253, 3–20. [Google Scholar] [CrossRef]
  9. Kumar, A.; Varghese, M.; Mohan, D.; Mahajan, P.; Gulati, P.; Kale, S. Effect of whole-body vibration on the low back. A study of tractor-driving farmers in north India. Spine 1999, 24, 2506–2515. [Google Scholar] [CrossRef] [PubMed]
  10. Alperowitch-Najenson, D.; Santo, Y.; Masharawi, Y.; Katz-Leurer, D. Low Back Pain among Professional Bus Drivers: Ergonomic and Occupational-Psychosocial Risk Factors. Israel Med. Assoc. J. 2010, 12, 26–31. [Google Scholar]
  11. Robb, M.J.; Mansfield, N.J. Self-reported musculoskeletal problems amonit professional truck drivers. Ergonomics 2007, 50, 814–827. [Google Scholar] [CrossRef] [PubMed]
  12. Netterstron, B.; Juel, K. Low back trouble among urban bus drivers in Denmark. Scand. J. Soc. Med. 1989, 17, 203–206. [Google Scholar] [CrossRef] [PubMed]
  13. Donnelly, C.J.; Callghan, J.P.; Durkin, J.L. The Effect of an Active Lumbar System on the Seating Comfort of Officers in Police Fleet Vehicles. Int. J. Occup. Saf. Ergon. 2009, 3, 295–307. [Google Scholar] [CrossRef] [PubMed] [Green Version]
  14. Chen, J.-C.; Dennerlein, J.; Chang, C.C.; Chang, W.; Christiani, D.C. Seat inclination, use of lumbar support and low-back pain of taxi drivers. Scand. J. Work Environ. Health 2005, 258–265. [Google Scholar] [CrossRef] [PubMed] [Green Version]
  15. Ravnik, D. Vliv vibrací na lokální hemodynamiku krve. In Komplexita Biomateriálů a Tkáňových Struktur; Univerzita Karlova, Fakulta Tělesné Výchovy a Sportu: Praha, Czech Republic, 2002; ISBN 80-86317-20-X. [Google Scholar]
  16. Krobot, Z.; Hrubý, J.; Neumann, V.; Túró, T. The Injurious Effects of Freely Transported Objects on a Crew in Military Vehicles during Traffic Acidents. In Proceedings of the ICMT 2019—7th International Conference on Military Technologies, Brno, Czech Republic, 30–31 May 2019; University of Defence: Brno, Czech Republic, 2019; p. 8870080, ISBN 978-172814593-8. [Google Scholar]
  17. Kajiwara, Y.; Kimura, H. Predicting the Coping Skills of Older Drivers in the Face of Unexpected Situation. Sensors 2021, 21, 2099. [Google Scholar] [CrossRef] [PubMed]
  18. Černohlávek, V.; Svoboda, M.; Štěrba, J.; Chalupa, M.; Sapieta, M. Analytical and experimental solution of vibrations of a system of bound bodies. Manuf. Technol. 2020, 20, 699–707. [Google Scholar] [CrossRef]
  19. Pelclová, D.; Lebedová, J.; Fenclová, Z.; Lukáš, E. Nemoci z Povolání a Intoxikace; Karolinum: Praha, Czech Republic, 2006; ISBN 80-246-1183-X. [Google Scholar]
  20. Harrison, D.D.; Harrison, S.O.; Arthur, A.; Croft, C. Sitting Biomechanics, Part I1: Optimal Car Driver’s Seat and Optimal Driver’s Spinal Model: Review of the literature. J. Manip. Physiol. Ther. 2000, 23, 37–47. [Google Scholar] [CrossRef]
  21. Zhao, Y.; Wang, X. A Review of Low-Frequency Active Vibration Control of Seat suspension Systems. Appl. Sci. 2019, 9, 3326. [Google Scholar] [CrossRef] [Green Version]
  22. Quoc, M.; Krzikala, D.; Mesicek, J.; Petru, J.; Smiraus, J.; Sliva, A.; Poruba, Z. On Aluminum Honeycomb Impact Attenuator Designs for Formula Student Competitions. Symmetry 2020, 12, 1647. [Google Scholar] [CrossRef]
  23. Peng, Q.; Xu, P.; Yuan, H.; Ma, H.; Xue, J.; He, Z.; Li, S. Analysis of Vibration Monitoring Data of Flexible Suspension Lifting Structure Based on Time-Varying Theory. Sensors 2020, 20, 6586. [Google Scholar] [CrossRef] [PubMed]
  24. Svoboda, M.; Chalupa, M.; Jelen, K.; Kubový, P.; Sapieta, M. Loading of the Musculoskeletal System of a Person While Driving in a Passenger Car. ECS Trans. 2019, 95, 449–456. [Google Scholar] [CrossRef]
  25. Lehnen, N.C.; Haase, R.; Faber, J.; Rüber, T.; Vatter, H.; Radbruch, A.; Schmeel, F.C. Detection of Degenerative Changes on MR Images of the Lumbar Spine with a Convolutional Neural Network: A Feasibility Study. Diagnostics 2021, 11, 902. [Google Scholar] [CrossRef]
  26. Zhang, X.; Xu, X.; Wang, J.; Wang, C.; Yan, Y.; Wu, A.; Ren, Y. Public-Health-Driven Microfluidic Technologies: From Separation to Detection. Micromachines 2021, 12, 391. [Google Scholar] [CrossRef] [PubMed]
Figure 1. Obstacle on the road.
Sensors 21 03849 g001
Figure 2. Schematic distribution of obstacles on the road.
Sensors 21 03849 g002
Figure 3. Acceleration sensor placed on the seat of the vehicle under the driver’s buttock.
Sensors 21 03849 g003
Figure 4. Acceleration sensor placed on the test subject’s head and C7 vertebrae.
Sensors 21 03849 g004
Figure 5. Device for measuring the exact speed of the vehicle—System Qualisys.
Sensors 21 03849 g005
Figure 6. Markers placed on the vehicle: (a) wheel of the vehicle and (b) body of the vehicle.
Sensors 21 03849 g006
Figure 7. DRIVER-dependence of vehicle speed on acceleration—V1 to V35.
Sensors 21 03849 g007
Figure 8. CO-DRIVER-dependence of vehicle speed on acceleration—V36 to V70.
Sensors 21 03849 g008
Figure 9. DRIVER (HUMAN)-dependence of acceleration in time of crossing obstacles—V5.
Sensors 21 03849 g009
Figure 10. CO-DRIVER (HUMAN)-dependence of acceleration in time of crossing obstacles—V10.
Sensors 21 03849 g010
Table 1. Variants of the measurements.
Speed10 km.h−120 km.h−130 km.h−140 km.h−150 km.h−1
Driver-humanV1–V7V8–V14V15–V21V22–V28V29–V35
Co-driver-humanV36–V42V43–V49V50–V56V57–V63V64–V70
Table 2. Average values of accelerations for driver-variants V1 to V35.
Velocity
[km.hod−1]
Measured Acceleration Values
Seat
Construction
[m.s−2]
Under the Buttock [m.s−2]C7
[m.s−2]
Head
[m.s−2]
101.5561.3040.4990.407
201.8051.5140.7750.604
302.3502.1471.3511.109
403.1782.1991.4901.179
502.8752.7551.5161.316
Table 3. Average values of accelerations for co-driver-variants V36 to V70.
Velocity
[km.hod−1]
Measured Acceleration Values
Seat Construction
[m.s−2]
Under the Buttock [m.s−2]C7
[m.s−2]
Head
[m.s−2]
101.1560.8530.7840.671
202.0491.6331.1310.772
302.5421.6951.2550.965
403.6082.4711.4651.245
503.7862.4131.6241.153
Table 4. Statistical processing of acceleration values-variants V50 to V56 (C7 and HEAD).
Velocity
[km.hod−1]
C7HEAD
Max. Acceleration
[m.s−2]
Standard DeviationMax. Acceleration
[m.s−2]
Standard Deviation
301.2010.2321.1990.016
300.7860.1830.8250.150
300.9550.0141.1310.371
300.9220.0470.9530.028
300.8390.0320.7880.262
301.0800.1110.9580.176
301.0010.1300.8990.241
Average value0.9690.0170.9650.020
Publisher’s Note: MDPI stays neutral with regard to jurisdictional claims in published maps and institutional affiliations.

