
Phoswich Detectors in Sensing Applications


Abstract
:
1. Introduction
2. Radiation Measurement Technologies
2.1. Beta Nuclides Measurement Technologies
2.2. Gamma Nuclides Measurement Technologies
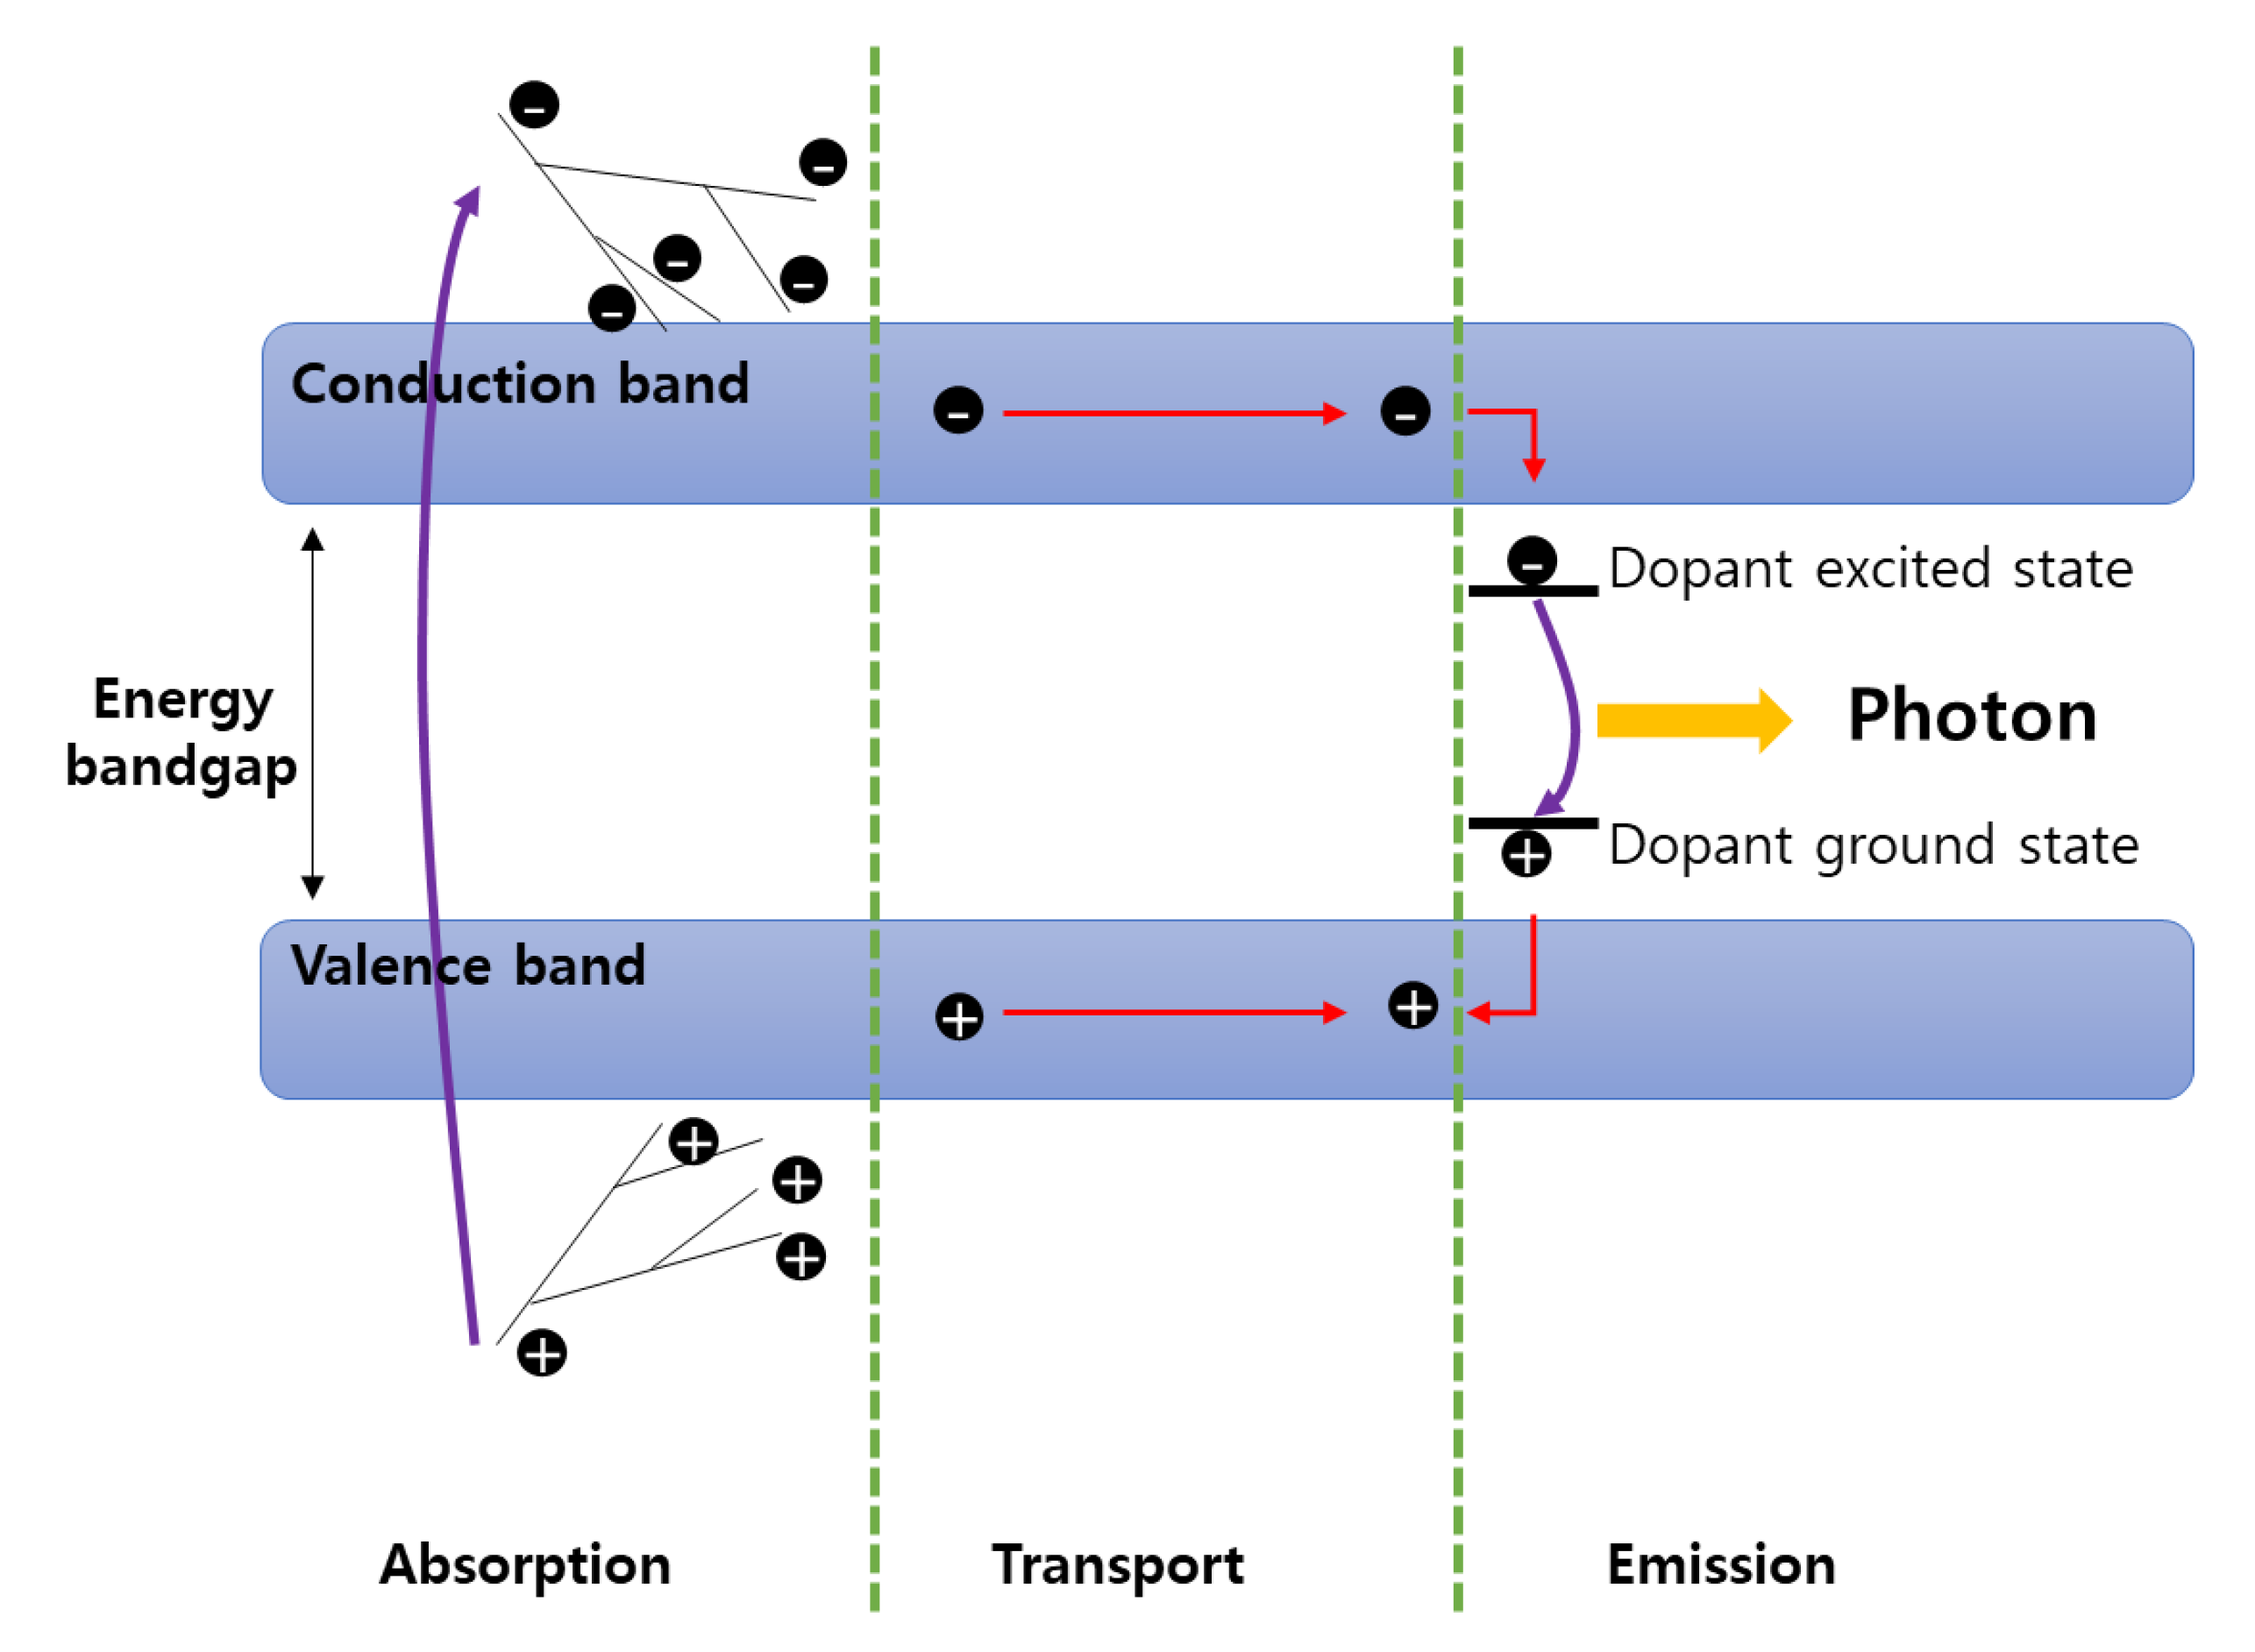
2.3. Optical Sensor
- –
- Emission wavelength, the intensity of the light;
- –
- Signal to noise ratio (SNR);
- –
- Cost, etc.
3. Multi-Signal Processing Methods
3.1. PSD (Pulse Shape Discrimination)
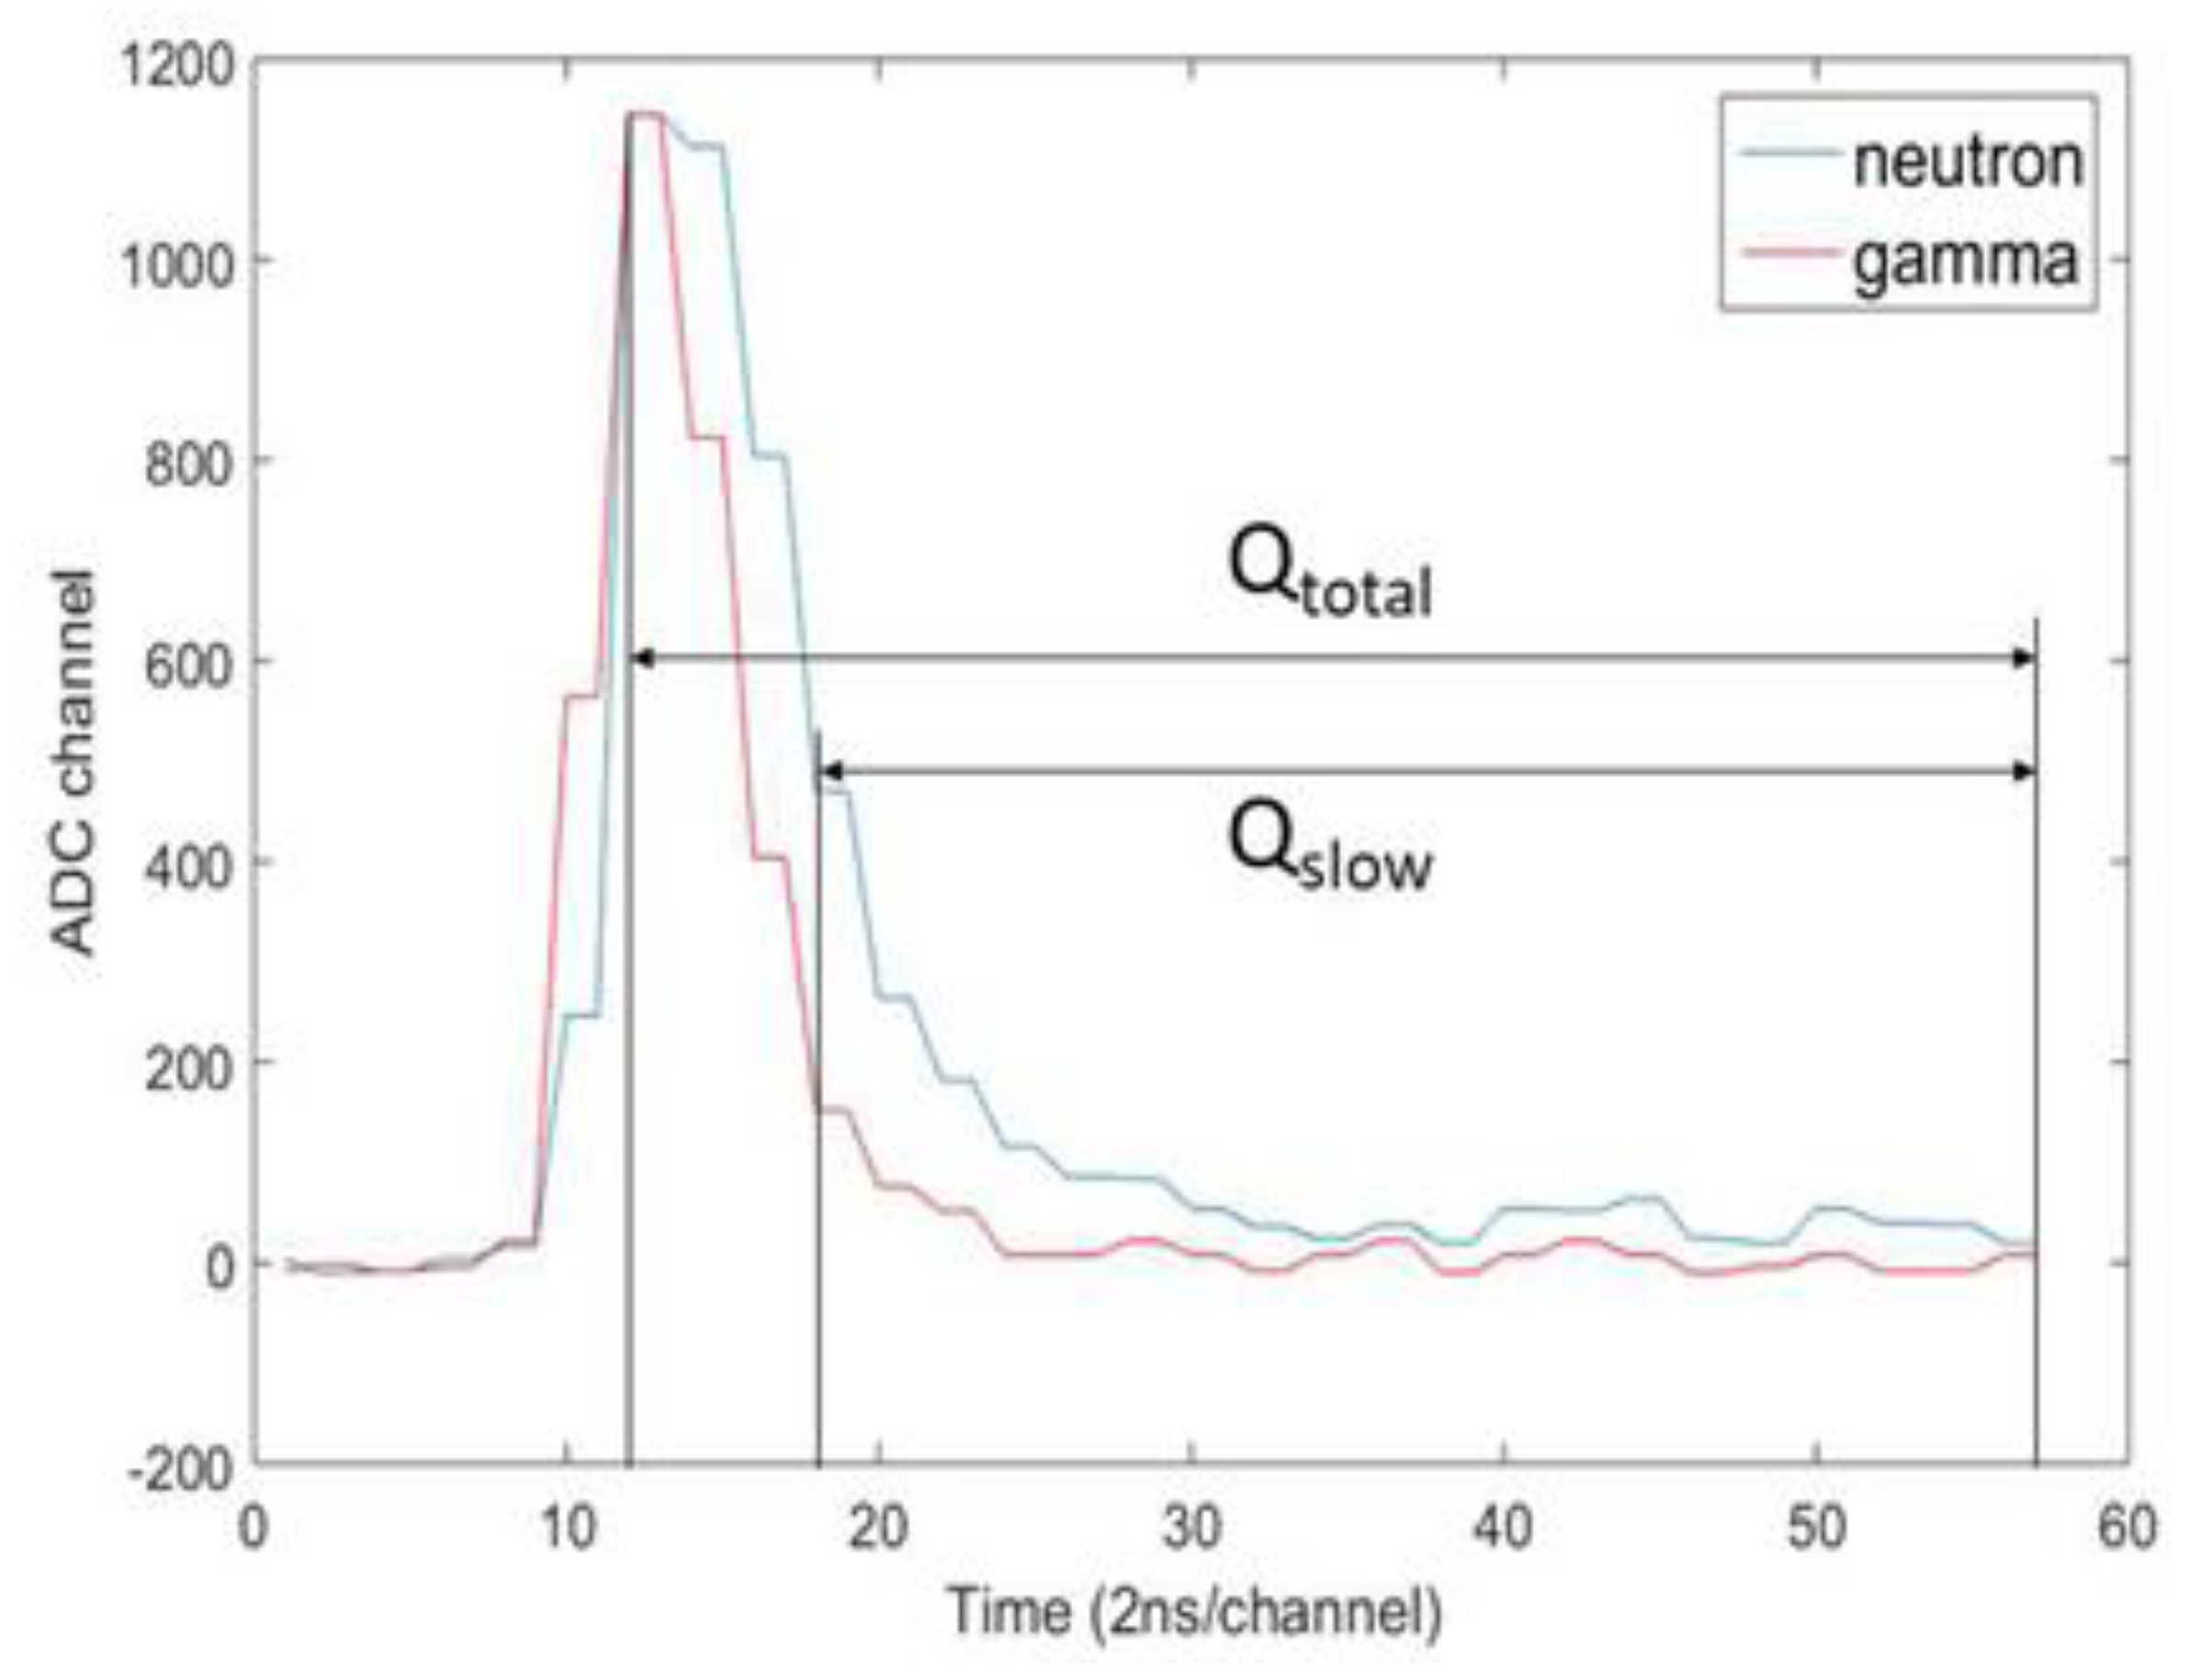
3.1.1. Charge Comparison Method
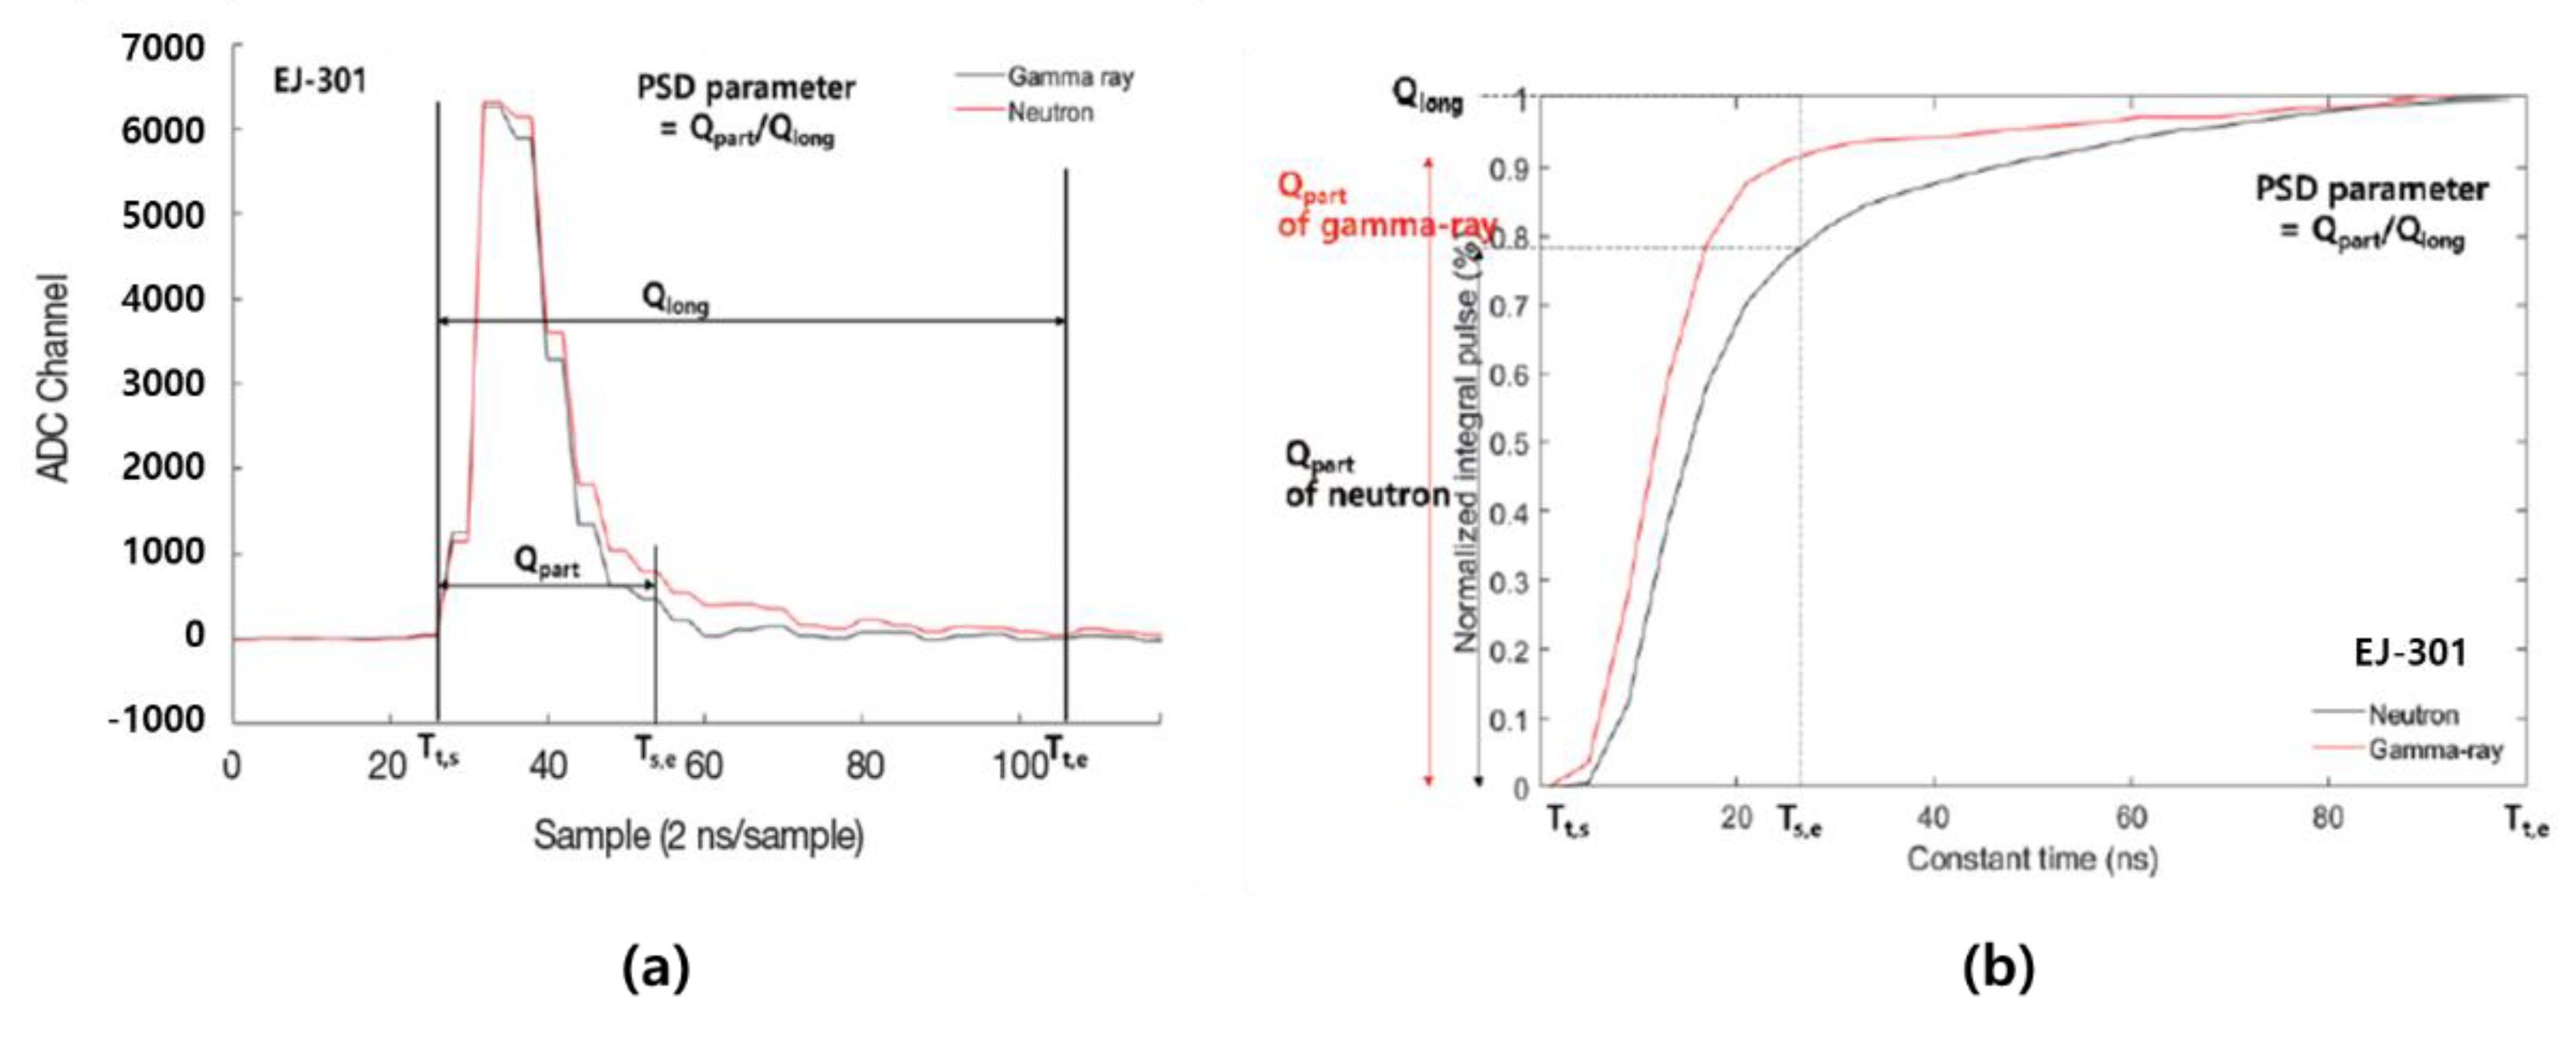
3.1.2. Constant Time Discrimination Method, CTD
3.2. FCR–SCR Method
3.3. Least-Squares Pulse Shape Discrimination Method
3.4. Comparison of Signal-Processing Methods
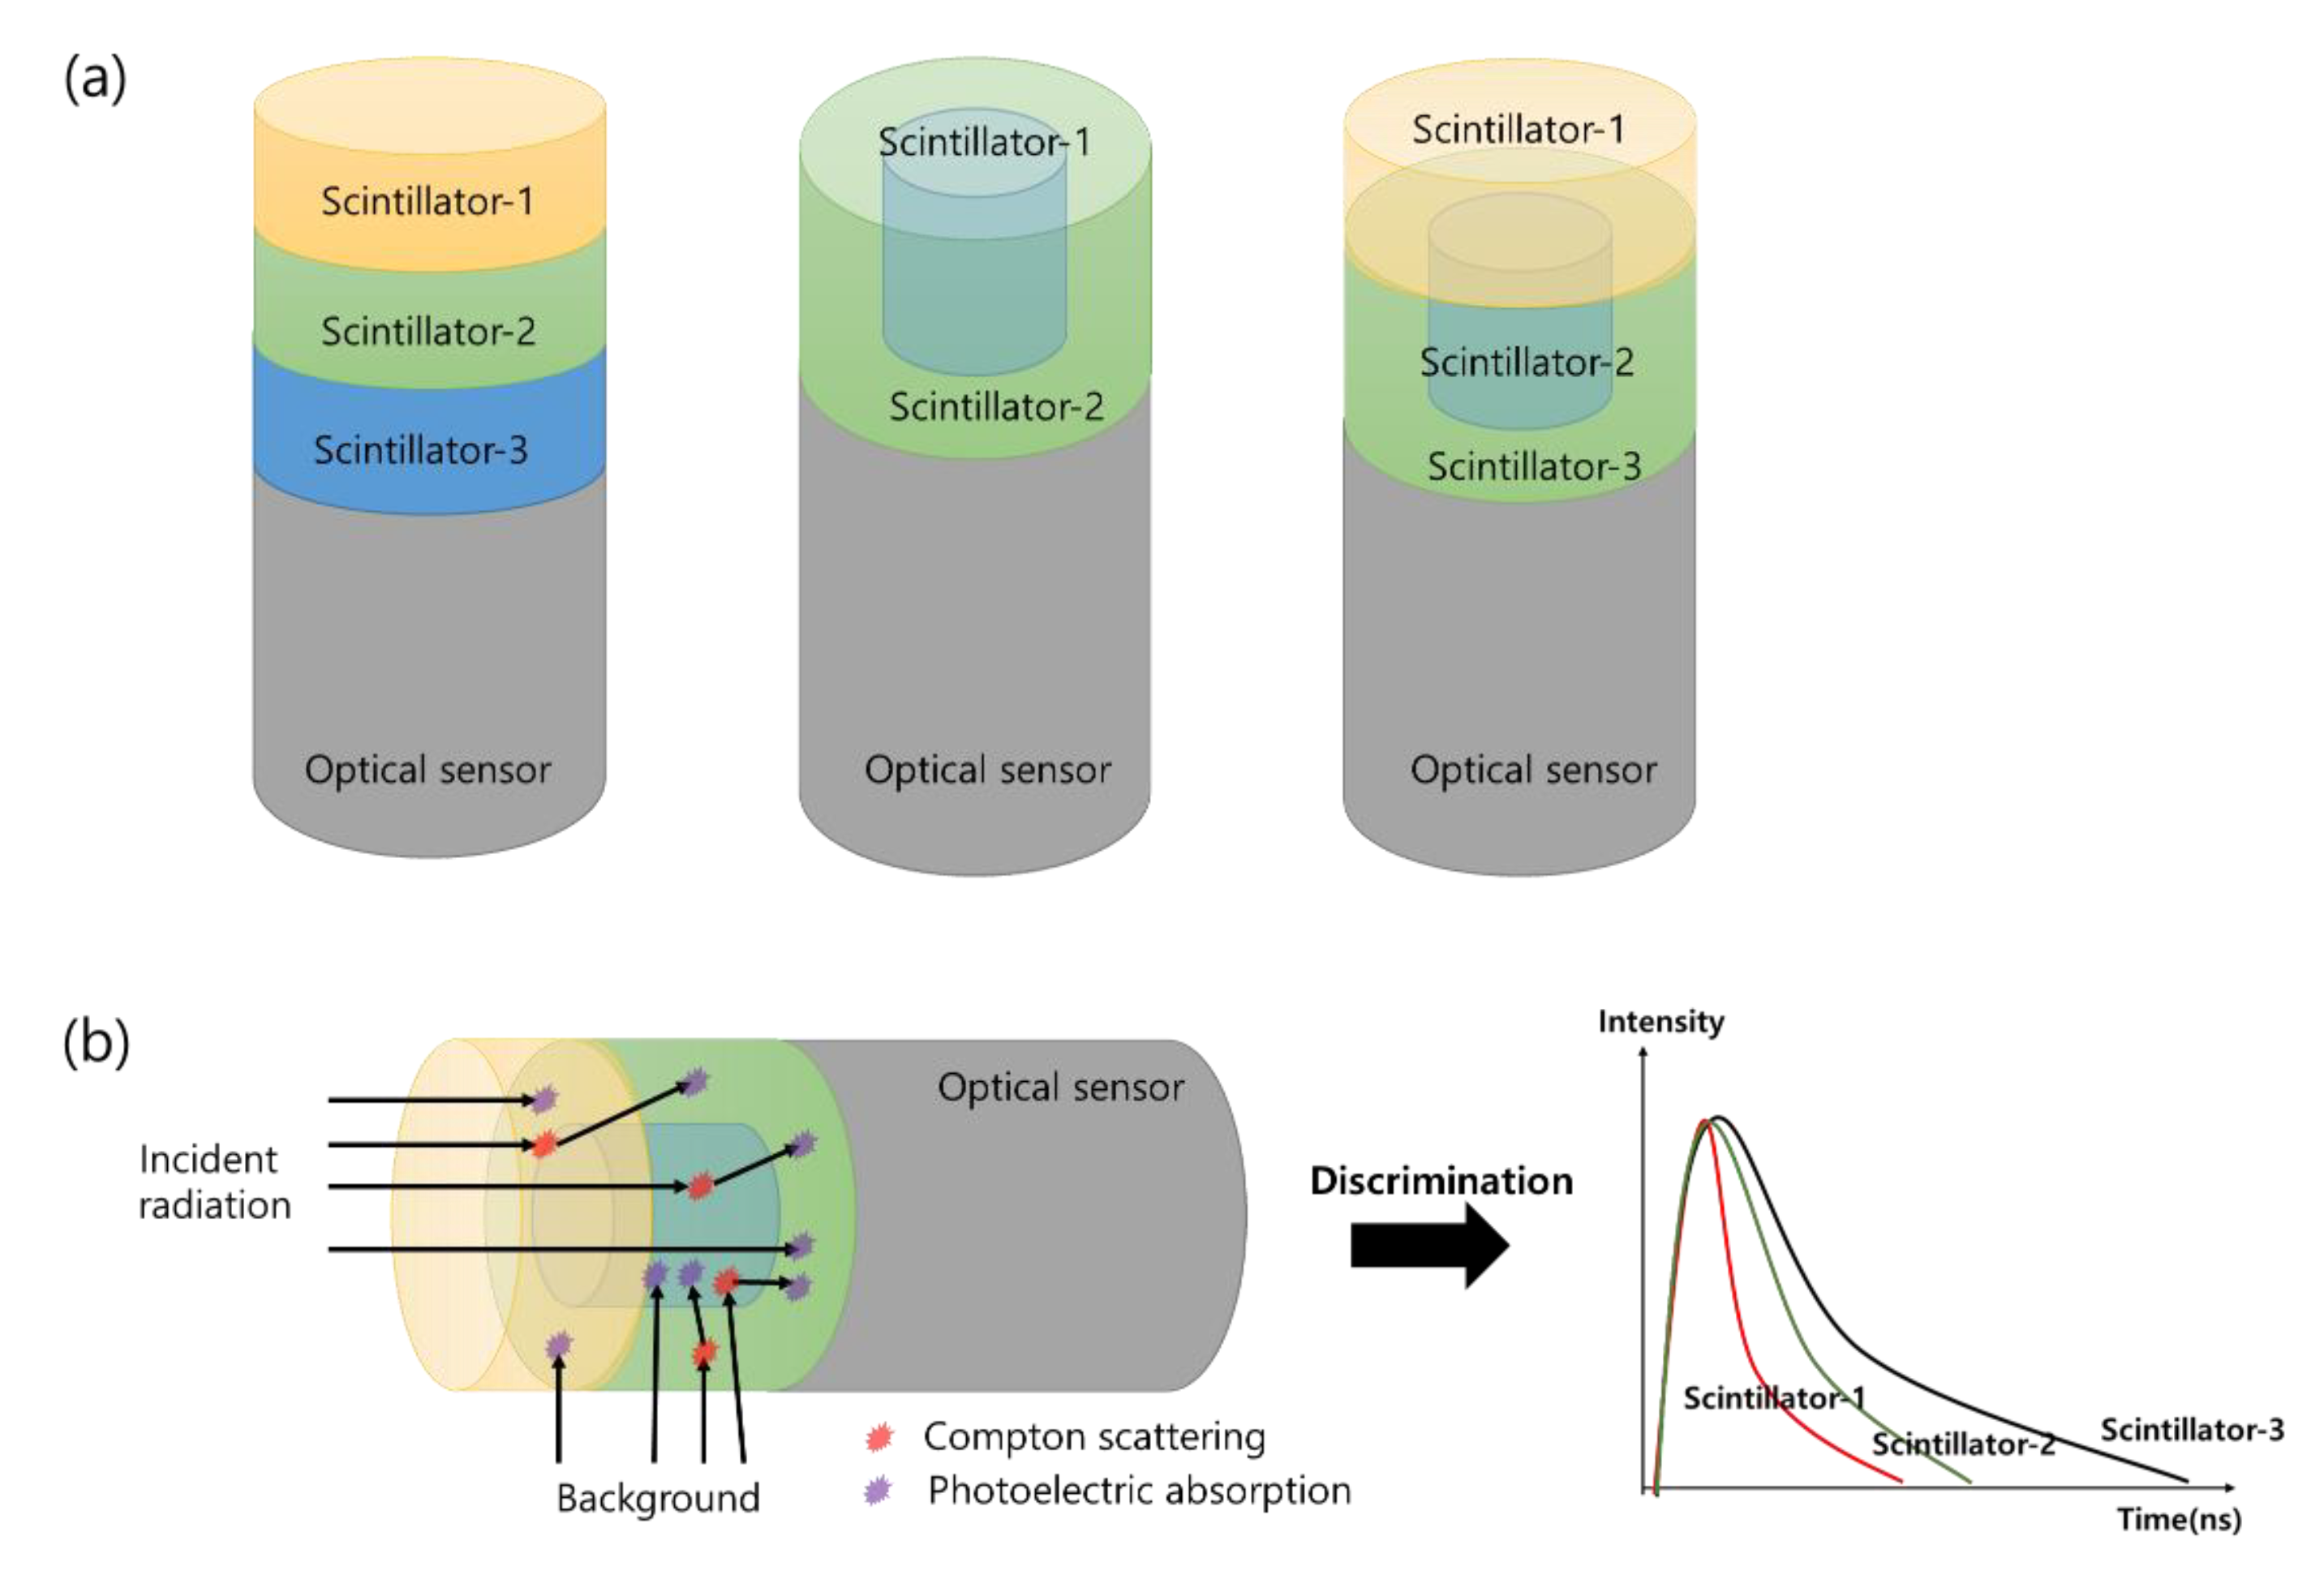
4. Phoswich Detectors for Radiological Detection and Measurement
5. Conclusions and Outlook
Author Contributions
Funding
Institutional Review Board Statement
Informed Consent Statement
Data Availability Statement
Acknowledgments
Conflicts of Interest
References
- Jeong, M.Y.; Lee, K.B.; Kim, K.J.; Lee, M.K. Gamma-ray full spectrum analysis for environmental radioactivity by HPGe detector. J. Astron. Space Sci. 2014, 31, 317–323. [Google Scholar] [CrossRef] [Green Version]
- Kang, H.; Min, S.; Seo, B.; Roh, C.; Hong, S.; Cheong, J.H. Low energy beta emitter measurement: A review. Chemosensors 2020, 8, 106. [Google Scholar] [CrossRef]
- Li, F.; Gu, Z.; Ge, L.; Li, H.; Tang, X.; Lang, X.; Hu, B. Review of recent gamma spectrum unfolding algorithms and their application. Results Phys. 2019, 13, 102211. [Google Scholar] [CrossRef]
- Hossain, I.; Sharlp, N.; Viswanathan, K.K. Efficiency and resolution of HPGe and NaI(Tl) detectors using gamma-ray spectroscopy. Sci. Res. Essays. 2012, 7, 86–89. [Google Scholar] [CrossRef]
- Shen, S.; Wang, F.; Yan, Y.; Shen, J.; Li, Y.; Jiang, H. Gamma spectrum measurement following the nuclear decay. J. Phys. Conf. 2021, 1739, 012035. [Google Scholar] [CrossRef]
- Wallbrink, P.J.; Walling, D.E.; He, Q. Radionuclide measurement using HPGe gamma spectrometry. In Handbook for the Assessment of Soil Erosion and Sedimentation Using Environmental Radionuclides; Zapata, F., Ed.; Springer: Dordrecht, The Netherlands, 2002; pp. 67–96. [Google Scholar]
- Papachristodoulou, C.A.; Assimakopoulos, P.A.; Patronis, N.E.; Loannides, K.G. Use of HPGe γ-ray spectrometry to assess the isotopic compositiion of uranium in soils. J. Environ. Radioact. 2003, 64, 195–203. [Google Scholar] [CrossRef]
- Gehrke, R.J.; Davidson, J.R. Acquisition of quality γ-ray spectra with HPGe spectrometers. Appl. Radiat. Isot. 2005, 62, 479–499. [Google Scholar] [CrossRef]
- Awadallah, M.I.; Imran, M.M.A. Experimental investigation of γ-ray attenuation in Jordanian building materials using HPGe-spectrometer. J. Environ. Radioact. 2007, 94, 129–136. [Google Scholar] [CrossRef]
- Joel, G.S.C.; Penabei, S.; Ndontchueng, M.M.; Chen, G.; Mekontso, E.J.N.; Ebongue, A.N.; Ousmanou, M.; David, S. Precision measurement of radioactivity in gamma-rays spectrometry using two HPGe detectors (BEGe-6530 and GC0818-7600SL models) comparison techniques: Application to the soil measurement. MethodsX 2017, 4, 42–54. [Google Scholar] [CrossRef] [PubMed] [Green Version]
- Kovacik, A.; Sykora, I.; Povinec, P.P. Monte Carlo and experimental efficiency calibration of gamma-spectrometers for non-destructive analysis of large volume samples of irregular shapes. J. Radioanal. Nucl. Chem. 2013, 298, 665–672. [Google Scholar] [CrossRef]
- Kim, Y.K.; Song, M.H.; Park, S.H.; Ha, J.H.; Moon, B.S.; Chung, C.E.; Hong, S.B.; Hwang, I.K.; Lee, W.G.; Han, S.H. Status of Radiation Detector and Neutron Monitor Technology; Korea Atomic Energy Research Institute: Daejeon, Korea, 2002. [Google Scholar]
- Dujardin, C.; Auffray, E.; Bourret-Courchesne, E.; Dorenbos, P.; Lecoq, P.; Nikl, M.; Vasil’ev, A.N.; Yoshikawa, A.; Zhu, R.Y. Needs, trends and advances in inorganic scintillators. IEEE Trans. Nucl. Sci. 2018, 65, 1977–1997. [Google Scholar] [CrossRef] [Green Version]
- Lecoq, P. Scintillation detectors for charged particles and photons. In Particle Physics Reference Library: Detectors for Particles and Radiation; Fabjan, C.W., Schopper, H., Eds.; Springer: Berlin/Heidelberg, Germany, 2020; Volume 2, pp. 61–79. [Google Scholar]
- Bizarri, G. Scintillation mechanisms of inorganic materials: From crystal characteristics to scintillation properties. J. Cryst. Growth. 2010, 312, 1213–1215. [Google Scholar] [CrossRef]
- Gupta, S.K.; Mao, Y. Recent advances, challenges, and opportunities of inorganic nano scintillators. Front. Optoelectron. 2020, 13, 156–187. [Google Scholar] [CrossRef]
- Lowdon, M.; Martin, P.G.; Hubbard, M.W.J.; Taggart, M.P.; Connor, D.T.; Verbelen, Y.; Sellin, P.J.; Scott, T.B. Evaluation of scintillator detection materials for application within airborne environmental radiation monitoring. Sensors 2019, 19, 3828. [Google Scholar] [CrossRef] [Green Version]
- Knoll, G.F. Radiation Detection and Measurement, 3th ed.; John Wiley & Sons, Inc.: New York, NY, USA, 2010; pp. 219–426. [Google Scholar]
- Saint-Gobain: Scintillation Crystal Materials. Available online: https://www.crystals.saint-gobain.com/products/crystal-scintillation-materials (accessed on 15 April 2021).
- Advatech: BGO-Bismuth Germanate Scintillator Crystal. Available online: https://www.advatech-uk.co.uk/bgo.html (accessed on 15 April 2021).
- Sibczynski, P.; Broslawski, A.; Gojska, A.; Kiptily, V.; Korolczuk, S.; Kwiatkowski, R.; Mianowski, S.; Moszynski, M.; Rzadkiewicz, J.; Swiderski, L.; et al. Characterization of some modern scintillators recommended for use on large fusion facilities in g-ray spectroscopy and tomographic measurements of γ-emission profiles. Nukleonika 2017, 62, 223–228. [Google Scholar] [CrossRef] [Green Version]
- Seitz, B.; Campos Rivera, N.; Stewart, A.G. Energy resolution and temperature dependence of Ce:GAGG coupled to 3mn × 3mm silicon photomultipliers. IEEE Trans. Nucl. Sci. 2016, 63, 503–508. [Google Scholar] [CrossRef] [Green Version]
- Epic Crystal: NaI(TI) Scintillator Detectors. Available online: http://www.epic-crystal.com/others/nai-tl-scintillator-detectors.html (accessed on 15 April 2021).
- Kinheng Crystal: CsI(Tl) Scintillation Crystal. Available online: http://www.kinheng-crystal.com/scintillation-crystal/csi-tl-scintillator-csi-tl-scintillation-crystal.html (accessed on 15 April 2021).
- Omega Piezo: BGO AND LYSO Crystals. Available online: https://www.omegapiezo.com/crystal-scintillators (accessed on 15 April 2021).
- Otten, E.W.; Weinheimer, C. Neutrino Mass from Tritium β-Decay. In Dark Matter in Astro- and Particle Physics Physics; Klapdor, H.V., Arnowitt, K.R., Eds.; Springer: Dordrecht, The Netherlands, 2008; Volume 71, pp. 513–519. [Google Scholar]
- Lin, Y.T.; Burritt, T.H.; Claessens, C.; Holman, G.; Kallander, M.; Machado, E.; Minter, L.I.; Ostertag, R.; Parno, D.S.; Pedersen, J.; et al. Beta decay of molecular tritium. J. Phys. Rev. Lett. 2020, 124, 222502. [Google Scholar] [CrossRef] [PubMed]
- Alton, T.L. In-situ Monitoring of Groundwater Radionuclides with Emphasis on Tritium Detection. Ph.D. Thesis, Lancaster University, Lancaster, UK, January 2019. [Google Scholar]
- Miramonti, L. A plastic scintillator detector for beta particles. Radiat. Meas. 2002, 35, 347–354. [Google Scholar] [CrossRef]
- Jang, K.W.; Joe, D.H.; Yu, W.J.; Lee, B.S.; Moon, J.H.; Park, B.G.; Joe, Y.H.; Kim, S. Fabrication and characterization of a fiber-optic radiation sensor for detection of tritium. Korean J. Opt. Photon. 2009, 20, 201–206. [Google Scholar] [CrossRef] [Green Version]
- Furuta, E.; Kawano, T. A plastic scintillation counter prototype. Appl. Radiat. Isot. 2015, 104, 175–180. [Google Scholar] [CrossRef]
- Park, C.H.; Seo, B.K.; Lee, D.G.; Lee, K.W. Development of an organic scintillator sensor for radiation dosimetry using transparent epoxy and optical fiber. J. Korean Radioact. Waste Soc. 2009, 7, 87–92. [Google Scholar]
- Nam, J.S.; Kim, Y.U.; Hong, S.B.; Seo, B.K.; Kim, K.H. Performance evaluation of a plastic scintillator for making a in-situ beta detector. N. Phys. Sae Mulli 2017, 67, 1080–1085. [Google Scholar] [CrossRef]
- Park, H.M. A Study of In Situ Detectors for Radiological Assessment of Strontium-90 in Underwater Environment. Ph.D. Thesis, Myongji University, Seoul, Korea, August 2018. [Google Scholar]
- Kim, J.H. Development of Silicon Photomultiplier based on Radiation Detector for Gamma Ray Contamination in Underwater Environment. Ph.D. Thesis, Myongji University, Seoul, Korea, February 2019. [Google Scholar]
- Schmida, G.J.; Beckedahl, D.; Blair, J.J.; Friensehner, A.; Kammeraad, J.E. HPGe Compton suppression using pulse shape analysis. Nucl. Instrum. Methods A 1999, 422, 368–372. [Google Scholar] [CrossRef] [Green Version]
- BNC (Berkeley Nucleonics Corp) Compton Suppressors Anti Compton Shields. Available online: https://www.berkeleynucleonics.com/compton-suppressors (accessed on 15 April 2021).
- Vismes, A.D.; Gurriaran, R.; Cagnat, X. Anti-compton gamma spectrometry for environmental samples. Radioprotection 2009, 44, 613–618. [Google Scholar] [CrossRef]
- Fan, Y.; Wang, S.; Li, Q.; Zhao, Y.; Zhang, X.; Jia, H. The performance determination of a compton-suppression spectrometer and the measurement of the low level radioactive samples. Appl. Radiat. Isot. 2013, 81, 128–131. [Google Scholar] [CrossRef] [PubMed]
- Seo, B.K.; Kwon, S.W.; Nam, J.S.; Roh, C.H.; Moon, J.K.; An, B.G.; Yang, H.M.; Lee, K.W.; Lee, E.H.; Jeong, G.H.; et al. Development of Site Remediation Technology for Decommissioning and Contaminated Site; Korea Atomic Energy Research Institute: Daejeon, Korea, 2015. [Google Scholar]
- Yu, J.H. A Study on the In-Situ Measurement Method of Low Level Contamination with Depth Distribution. Ph.D. Thesis, Kongju National University, Gongju, Korea, February 2018. [Google Scholar]
- VIVATech SiPM and PMT. Available online: https://www.vivatech.co.kr/photodiode-megagain (accessed on 13 May 2021).
- Spanoudaki, V.C.; Levin, C.S. Photo-detectors for time of flight positron emission tomography (ToF-PET). Sensors 2010, 10, 10484–10505. [Google Scholar] [CrossRef]
- Kim, C.H. Estimation of Gamma-Ray Activity and Pulse Shape Discrimination(PSD) with Organic Scintillator. Master’s Thesis, Korea University, Seoul, Korea, October 2017. [Google Scholar]
- Siddavatam, A.P. Methods of Pulse Shape Discrimination(PSD). In Proceedings of the International Technological Conference 2014, Mumbai, India, 2–4 January 2014. [Google Scholar]
- Kim, C.H.; Yeom, J.Y.; Kim, G.H. Digital n-γ pulse shape discrimination in organic scintillators with a high-speed digitizer. J. Radiat. Prot. Res. 2019, 44, 53–63. [Google Scholar] [CrossRef]
- Alemayehu, B. Real time Radioxenon Measurement Using a Compton Suppressed Well-Type Phoswich Detector for Nuclear Explosion Monitoring. Ph.D. Thesis, Oregon State University, Corvallis, OR, USA, August 2013. [Google Scholar]
- Farsoni, A.T.; Alemayehu, B.; Alhawsawi, A.; Becker, E.M. Real-time pulse-shape discrimination and beta–gamma coincidence detection in field-programmable gate array. Nucl. Instruments Methods Phys. Res. A 2013, 712, 75–82. [Google Scholar] [CrossRef]
- Farsoni, A.T.; Hamby, D.M. Preliminary experiments with a triple-layer phoswich detector for radioxenon detection. In Proceedings of the 30th Seismic Research Review: Ground-Based Nuclear Explosion Monitoring Technologies, Portmouth, VA, USA, 23–25 September 2008; Wetovsky, M.A., Benson, J., Patterson, E.F., Eds.; Los Alamos National Laboratory: Los Alamos, NM, USA, 2008. [Google Scholar]
- Gadey, H.R. Gamma Spectrum Enhancement in a Metal Loaded Plastic Scintillator using PSD. Master’s Thesis, Oregon State University, Corvallis, OR, USA, June 2018. [Google Scholar]
- Xu, J.; Liu, J.; Chen, X. A well typed phoswich detector consisting of CsI and plastic scintillators for low level radi-oactivity measurements. Appl. Radiat. Isot. 2021, 169, 109462. [Google Scholar] [CrossRef] [PubMed]
- Miller, W.H.; Childress, N.L. MCNP analysis and optimization of a triple crystal phoswich detector. Nucl. Instrum. Methods A 2002, 490, 263–270. [Google Scholar]
- Henning, W.; Tan, H.; Warburton, W.K.; Mclntyre, J. Digital pulse shape analysis with phoswich detectors to simplify coincidence measurements of radioactive xenon. In Proceedings of the 27th Seismic Research Review: Ground-Based Nuclear Explosion Monitoring Technologies, Rancho Mirage, CA, USA, 20–25 September 2005; Wetovsky, M.A., Benson, J., Patterson, E.F., Eds.; Los Alamos National Laboratory: Los Alamos, NM, USA, 2005. [Google Scholar]
- Kim, G.H.; Park, C.H.; Jung, C.H.; Lee, K.W.; Seo, B.K. Development of the ZnS(Ag)/BC-408 phoswich detector for monitoring radioactive contamination inside pipes. J. Korean Assoc. Radiat. Prot. 2006, 31, 123–128. [Google Scholar]
- Suzuki, T.; Yamada, Y. Development of beta ray spectrometer for radiation emergency accidents. Nucl. Sci. Tech. 2008, 45, 546–548. [Google Scholar] [CrossRef] [Green Version]
- Farsoni, A.T.; Hamby, D.M. Study of a triple layer phoswich detector for beta and gamma spectroscopy with minimal crosstalk. In Proceedings of the 28th Seismic Research Review: Ground-Based Nuclear Explosion Monitoring Technologies, Orlando, FL, USA, 19–21 September 2006; Wetovsky, M.A., Benson, J., Patterson, E.F., Eds.; Los Alamos National Laboratory: Los Alamos, NM, USA, 2006. [Google Scholar]
- Tengblad, O.; Nilsson, T.; Nacher, E.; Johansson, H.T.; Briz, J.A.; Carmona-Gallardo, M.; Cruz, C.; Gugliermina, V.; Perea, A.; Sanchez del Rio, J.; et al. LaBr3(Ce):LaCl3(Ce) Phoswich with pulse shape analysis for high energy gamma-ray and proton identification. Nucl. Instrum. Methods A 2013, 704, 19–26. [Google Scholar] [CrossRef] [Green Version]
- Yamamoto, S.; Hiroyuki, I. Development of a 3 layer phoswich alpha-beta-gamma imaging detector. Nucl. Instrum. Methods Phys. Res. A 2015, 785, 129–134. [Google Scholar] [CrossRef] [Green Version]
- Park, K.H. Study on the Optimization of Beta/Gamma Dual Detector using MCNP6 Code. Master’s Thesis, Myongji University, Seoul, Korea, August 2018. [Google Scholar]
- Kim, W.; Kim, J.; Ko, K.; Kim, G.; Cho, G. Probe area effect on performance of phoswich detectors for simultaneous alpha and beta detection. J. Instrum. 2019, 14, C10005. [Google Scholar] [CrossRef]
- Zorloni, G.; Cova, F.; Caresana, M.; Di Benedetto, M.; Hostasa, J.; Fasoli, M.; Villa, I.; Veronese, I.; Fazzi, A.; Vedda, A. Neutron/gamma discrimination by an emission-based phoswich approach. Radiat. Meas. 2019, 129, 106203. [Google Scholar] [CrossRef]
- Tyagi, M.; Rawat, S.; Kumar, G.A.; Gadkari, S.C. A novel versatile phoswich detector consisting of single crystal scintillators. Nucl. Inst. Meth. 2020, 951, 162982. [Google Scholar] [CrossRef]


| Material | Peak Emission Wavelength (nm) | Decay Time (ns) | Density (g/cm3) | Light Yield (photon/MeV) | FWHM at 662 keV (%) | Index of Refraction |
|---|---|---|---|---|---|---|
| NaI(Tl) | 415 | 230 | 3.67 | 38,000 | 7.0 | 1.85 |
| BGO | 480 | 300 | 7.13 | 8200 | 9.5 | 2.15 |
| CsI(Tl) | 540 | 800 | 4.51 | 60,000 | 9.0 | 1.8 |
| LaBr3(Ce) | 358 | 35 | 5.3 | 61,000 | 4.0 | - |
| BaF2 | 310 | 630 | 4.9 | 10,000 | 7.7 | 1.49 |
| CdWo4 | 530 | 15,000 | 7.9 | 7000 | - | - |
| Gd2SiO5(Ce) | 440 | 60 | 6.7 | 10,000 | 8.5 | - |
| PMT | APD | SiPM | |
|---|---|---|---|
| Gain | 106 | 50~1000 | ~106 |
| Rise time (ns) | ~1 | ~5 | ~1 |
| Quantum efficiency (% at 420 nm) | ~25 | ~70 | ~25~75 (photon detection efficiency, PDE) |
| Bias (V) | >1000 | 300~1000 | 30~80 |
| Temperature sensitivity (%/°C) | <1 | ~3 | 1~8 |
| Magnetic field sensitivity | yes | no | no |
| Sensitive area | cm2 | mm2 | mm2 |
| Price/channel ($) | >200 | ~100 | ~50 |
| Domain | Contents | Method |
|---|---|---|
| PSD analysis methods applied in the time domain | Zero crossing discrimination technique/constant fraction discriminators | Conventional |
| Rise time discrimination | ||
| Charge comparison method (CCM) | ||
| Constant-fraction timing discriminator | ||
| Pulse gradient analysis (PGA) | Digital | |
| Artificial neural network (circuit of neurons) | ||
| Fuzzy logic (FL) | ||
| Curve fitting technique | ||
| Pattern recognition technique | ||
| PSD analysis methods applied in the frequency and time domains | Frequency gradient analysis (FGA) | Digital |
| Principal component analysis (PCA) | ||
| Cross-correlation anaysis (CCA) | ||
| Wavelet-based analysis (continuous and discrete) |
| Scintillator Size (cm) | Static MDC (dpm/100 cm2) | |||
|---|---|---|---|---|
| 241Am (alpha) | 90Sr/Y (beta) | 99Tc (beta) | 14C (beta) | |
| 10 × 10 | 76 ± 73 | 445 ± 113 | 1584 ± 404 | 13,912 ± 3611 |
| 15 × 15 | 43 ± 32 | 248 ± 60 | 1304 ± 319 | 7836 ± 1938 |
| 20 × 20 | 33 ± 32 | 252 ± 60 | 1324 ± 317 | 8060 ± 2115 |
| Scintillator or Phoswich Material | Radiation | Algorithm | Main Results | Ref. |
|---|---|---|---|---|
| Plastic Scintillator (NE102A) | β | - In order to utilize the principle similar to that of the liquid scintillator, a 3 cm × 2 cm × 1 cm sized sample hole was made in the center of the plastic scintillator to enable omnidirectional measurement | - MDA value of 1.21 Bq/cm2 is obtained - Verification of the performance of the beta detector through MCNP simulation | [29] |
| Gd2O2S(Tb), Y3Al5O12(Ce), CsI(Tl) | β | - A long-distance measurement test using optical fiber was performed - Use of the anti-coincidence method | - Selecting the optimal scintillator by comparing the H-3 measurement results for each inorganic scintillator - Derive the dose equation according to the distance between the detector and source | [32] |
| Plastic scintillator (Polystyrene-based) | β | - Minimization of noise effect by using simultaneous counting circuit - Plastic sheet system to be used as an alternative to LSC | - MDA value of 0.0116 Bq/mL is obtained for the 2 mL sample | [31] |
| Plastic scintillator (Epoxy-based) | β | -The focus is on plastic production -The detection efficiency was calculated using the Sr-90 source -Performance evaluation of plastic scintillator by thickness of plastic scintillator and content of scintillation material was performed | - Optimum scintillation material concentration is (polymer: PPO: POPOP = 0.79 wt%: 0.2 wt%: 0.01 wt%) - Optimum thickness is 4 mm | [33] |
| CaF2(Eu) detector | β | - Focusing on tests to derive optical sensors suitable for CaF2 (Eu) | - The MDA of SiPM-CaF2 (Eu) was 1319 Bq/L, and the MDA of PMT-CaF2 (Eu) was 330 Bq/L - It was analyzed that PMT-CaF2(Eu) is a more suitable system for low-concentration Sr-90 measurement than SiPM-CaF2(Eu) - Efficiency increased by 30% through the removal of Compton at 964 keV - When low background radiation is required, a product using NaI(Tl) as a guard detector is recommended | [34,35] |
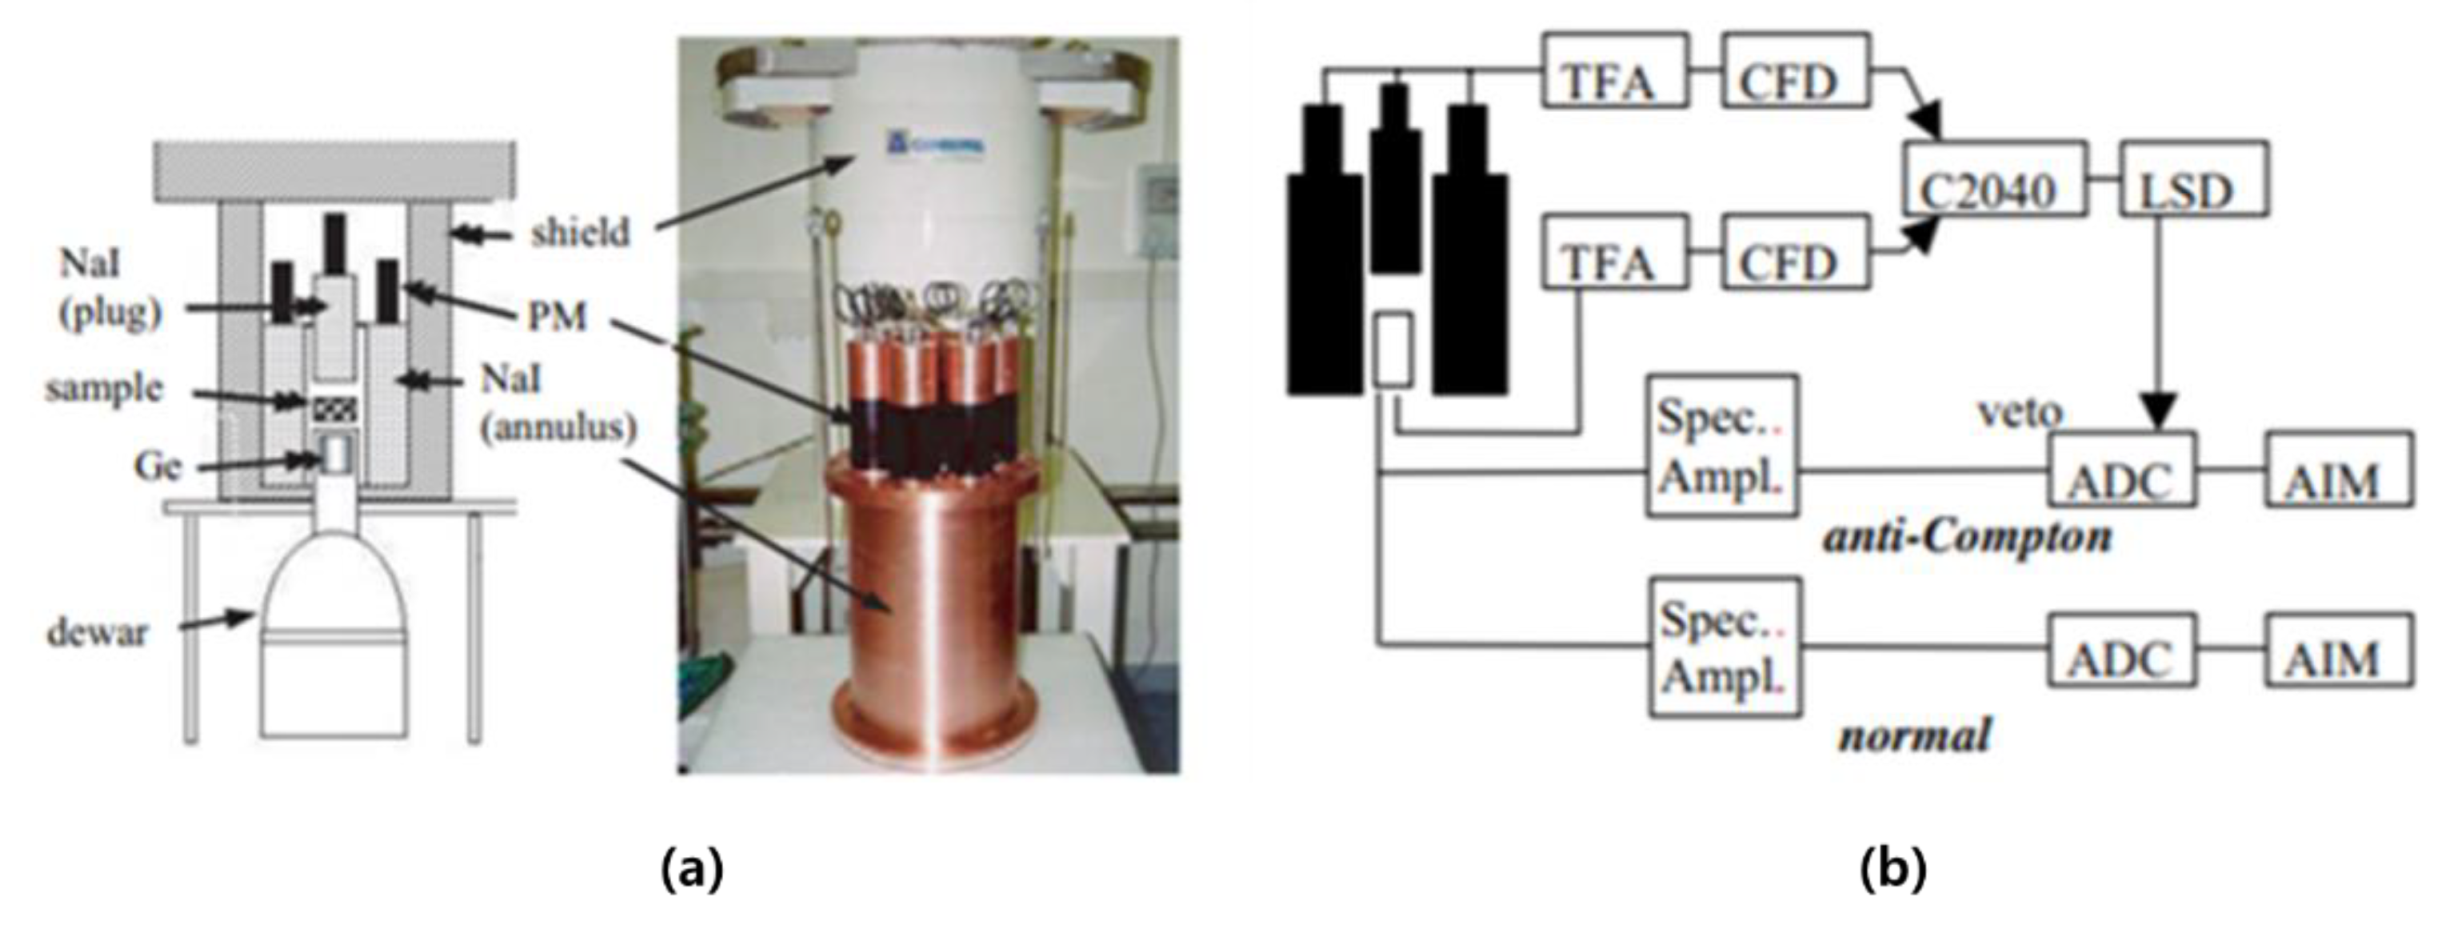
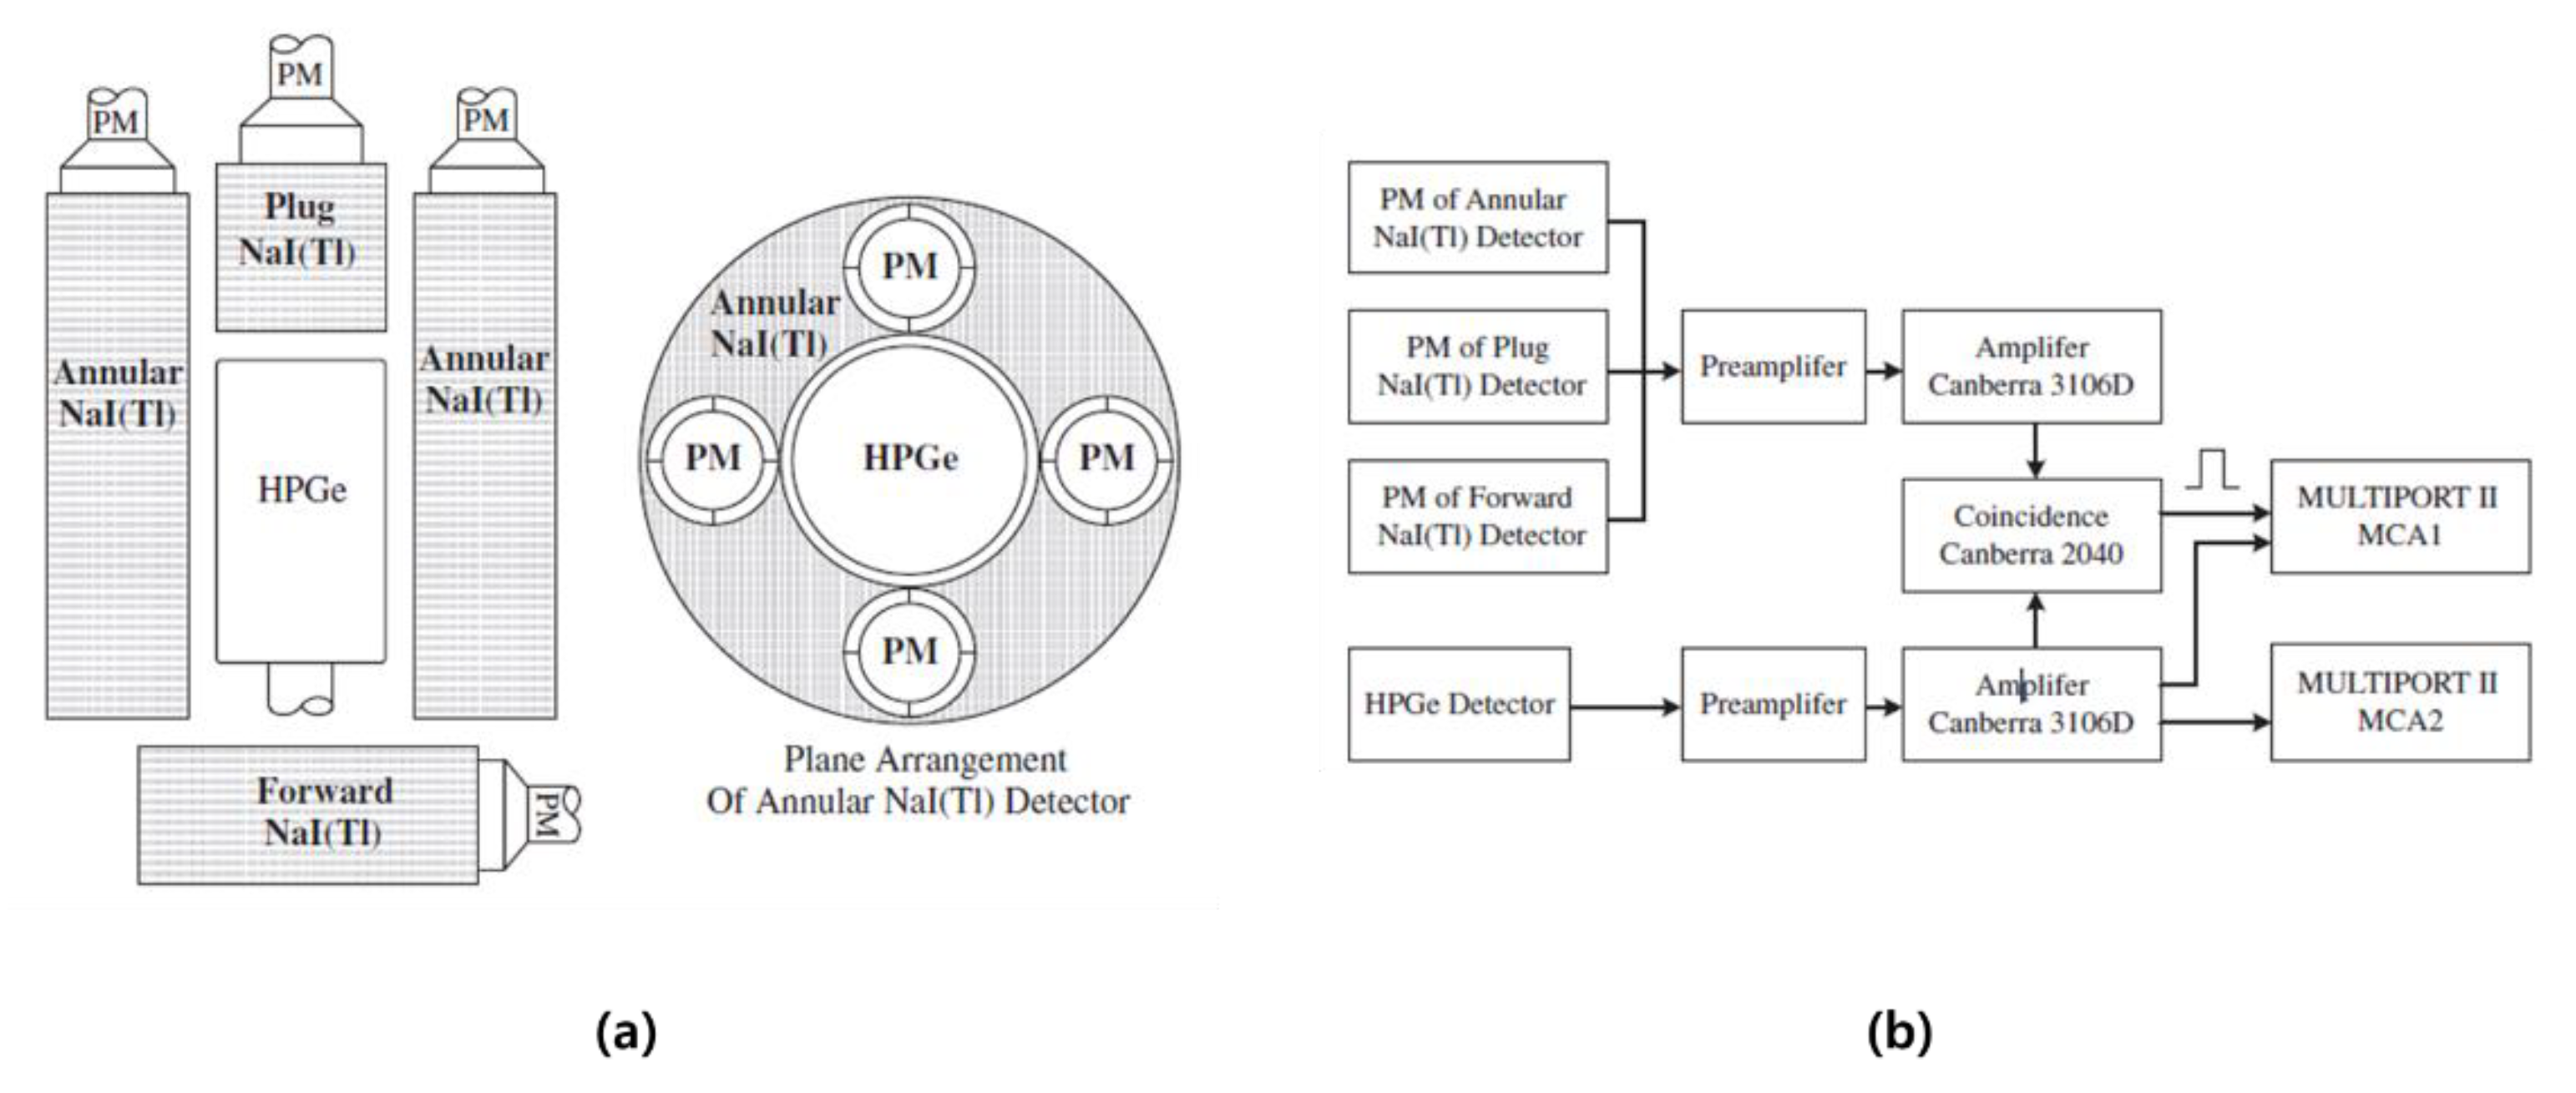
| HPGe, BGO | γ | - Use of anti-coincidence method - Guard detectors to reduce background effects are used | [36] | |
| HPGe, NaI(Tl) | γ | - Use of anti-coincidence method - Guard detectors to reduce background effects are used | [37] | |
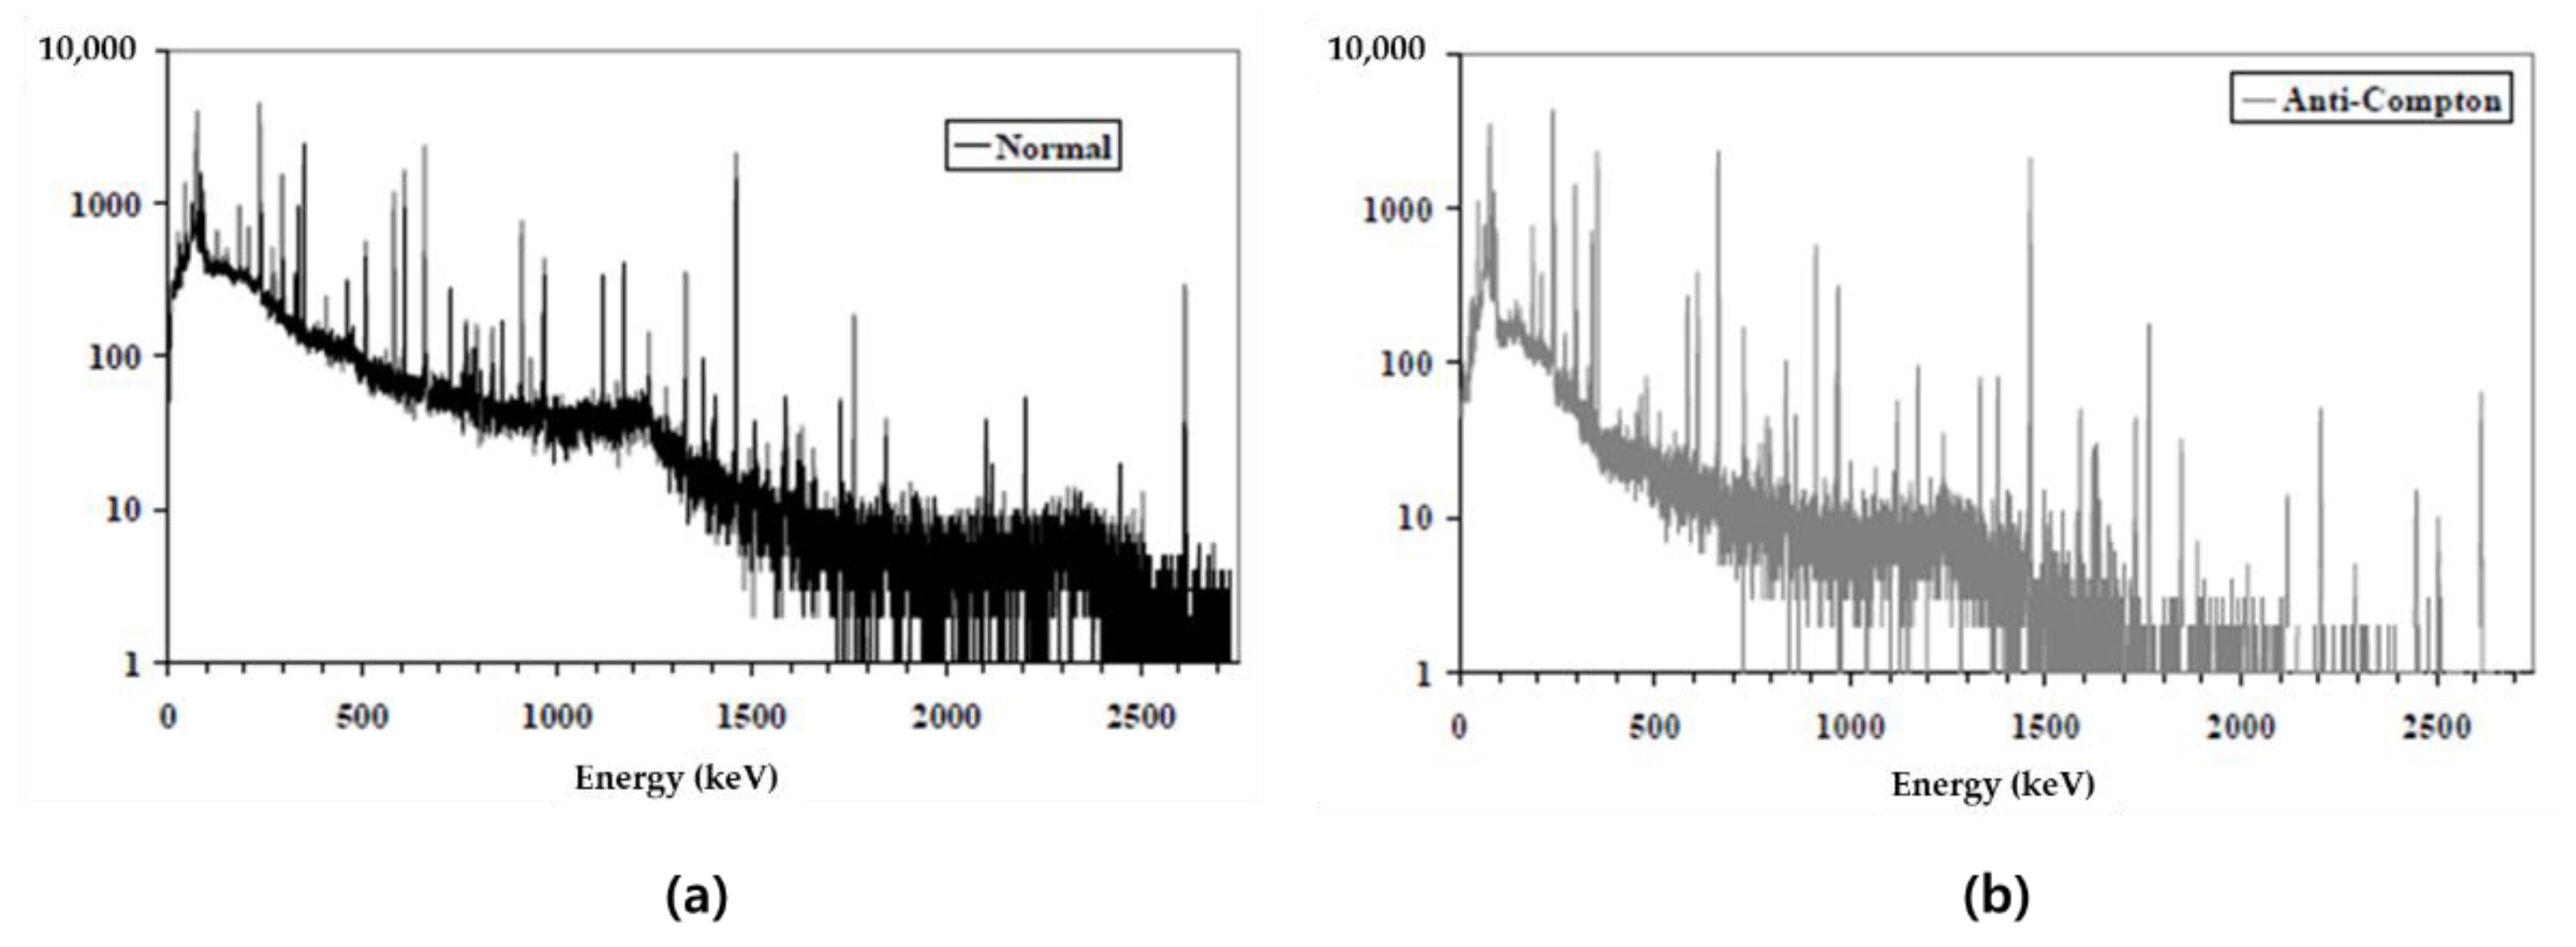
| HPGe, NaI(Tl) | γ | - Use of anti-coincidence method - RF (Reduction Factor) | - MDA decreased from 8.2 ± 0.4 Bq/kg to 1.8 ± 0.2 Bq/kg | [38] |
| HPGe, NaI(Tl) | γ | - The peak of the Compton ratio was calculated in each energy domain using the Compton suppression method and the non-Compton suppression method | - The peak of the Compton ratio in the energy region of cesium nuclides was 0.26 (604.72 keV), 0.20 (795.86 keV), and 0.06 (569.33 keV) - The MDA of Cs-137 was calculated as 1.5 μBq/m3 (Compton non-suppression) and 0.7 μBq/m3 (Compton suppression), respectively | [39] |
| Scintillator or Phoswich Material | Radia-tion | Algorithm | Main Results | Ref. |
|---|---|---|---|---|
| ZnS(Ag), CaF2(Eu), NaI(Tl) | α, β, γ | Correction factor (correction of gamma effect incorrectly counted in the beta detector) | - Analysis that about 26±4% gamma reaction occurred in the beta detector(CaF2(Eu)) - Derivation of a correction factor methodology that removes the gamma response incorrectly counted in the beta detector from the gamma detector(NaI(Tl)) | [52] |
| BC-404, CsI(Tl) | β, γ | Identification based on signal rise time | - Optimization of detection-sensor geometry for xenon detection (β, γ) - Use of signal rise-time analysis method to distinguish whether the signal responding to the sensor is an individual signal or simultaneous signal - Comparison of detection efficiency through MCNP simulation (82~92% match) | [53] |
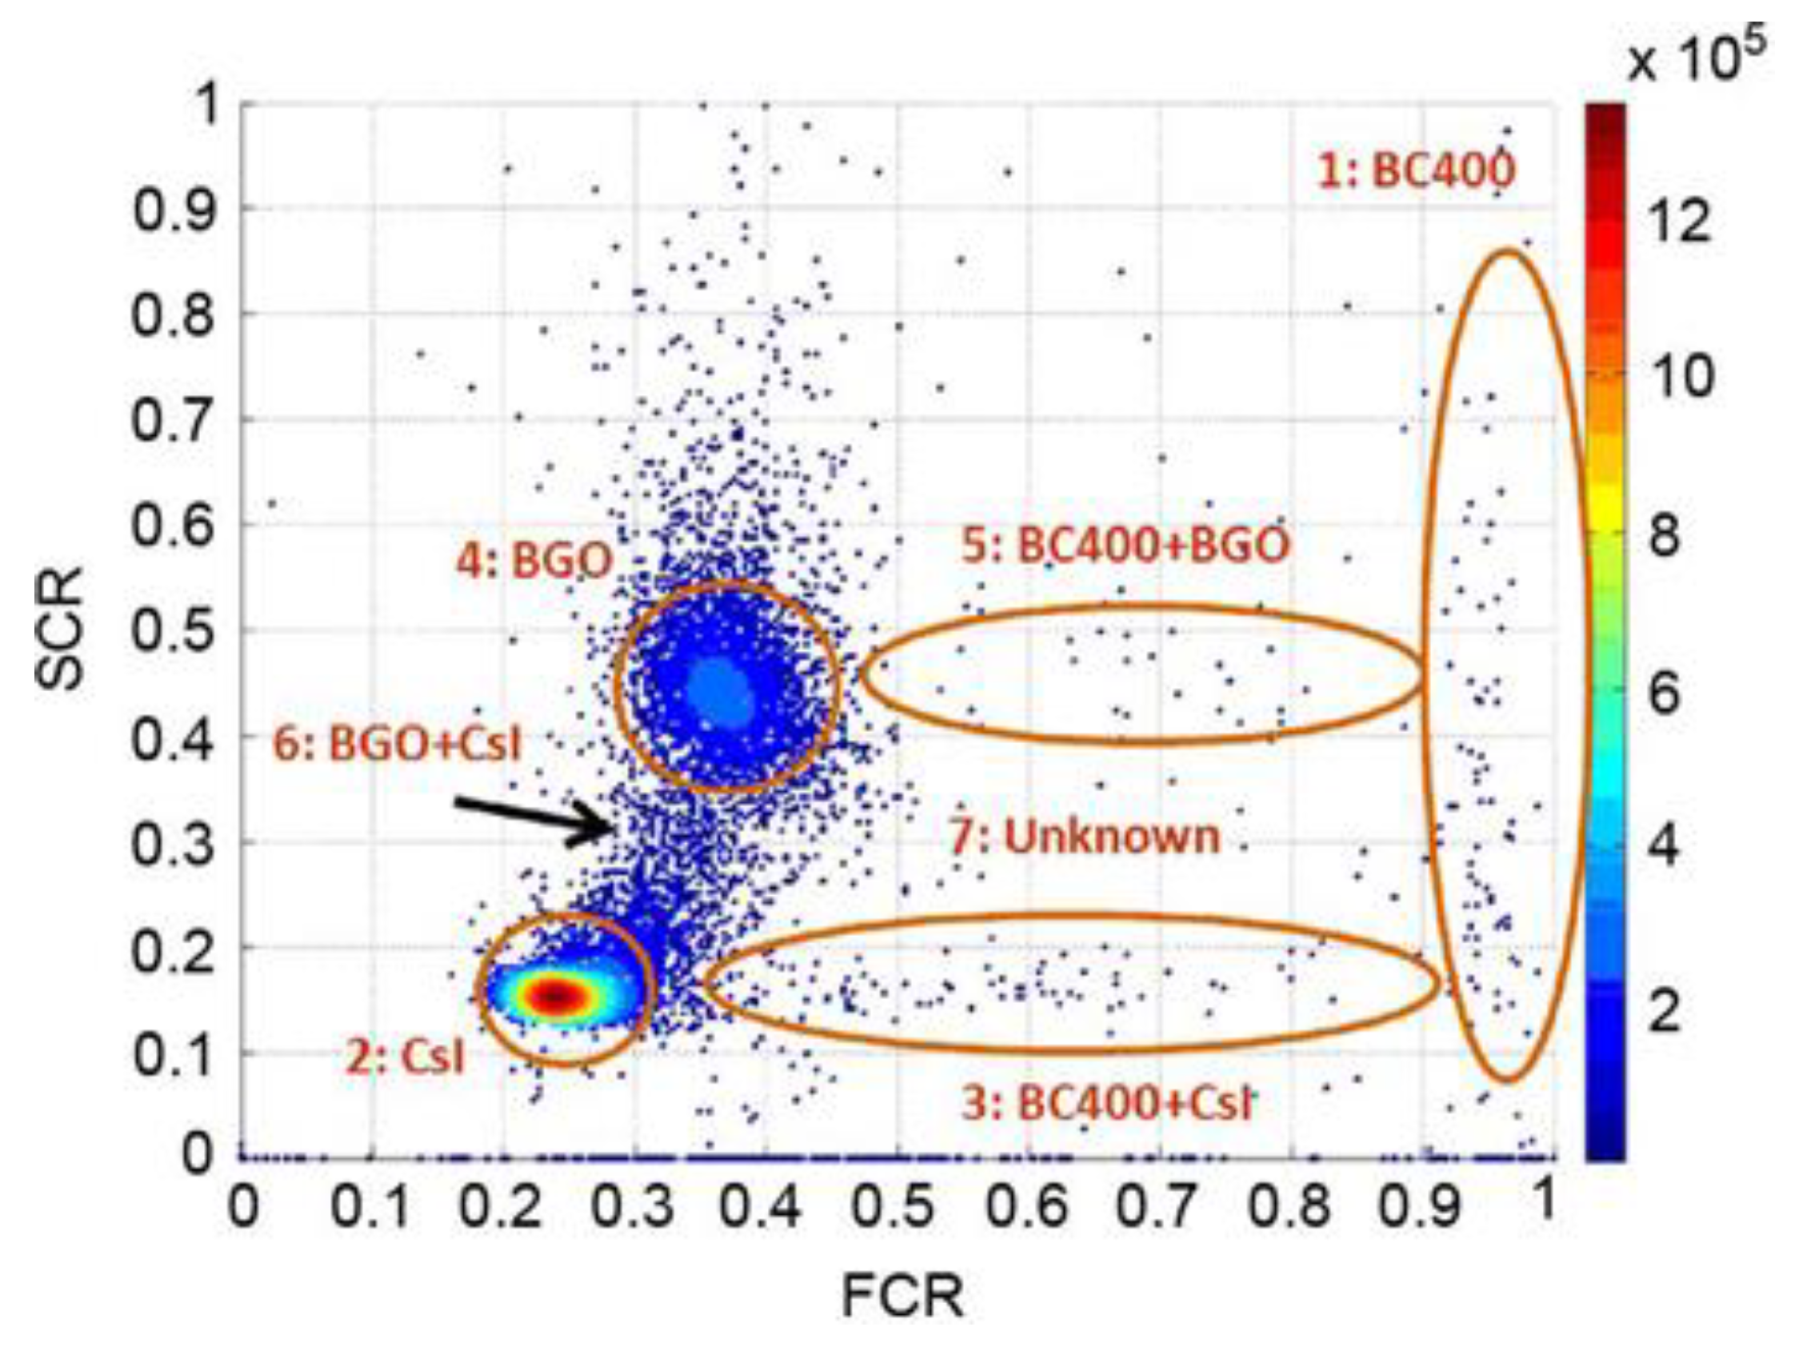
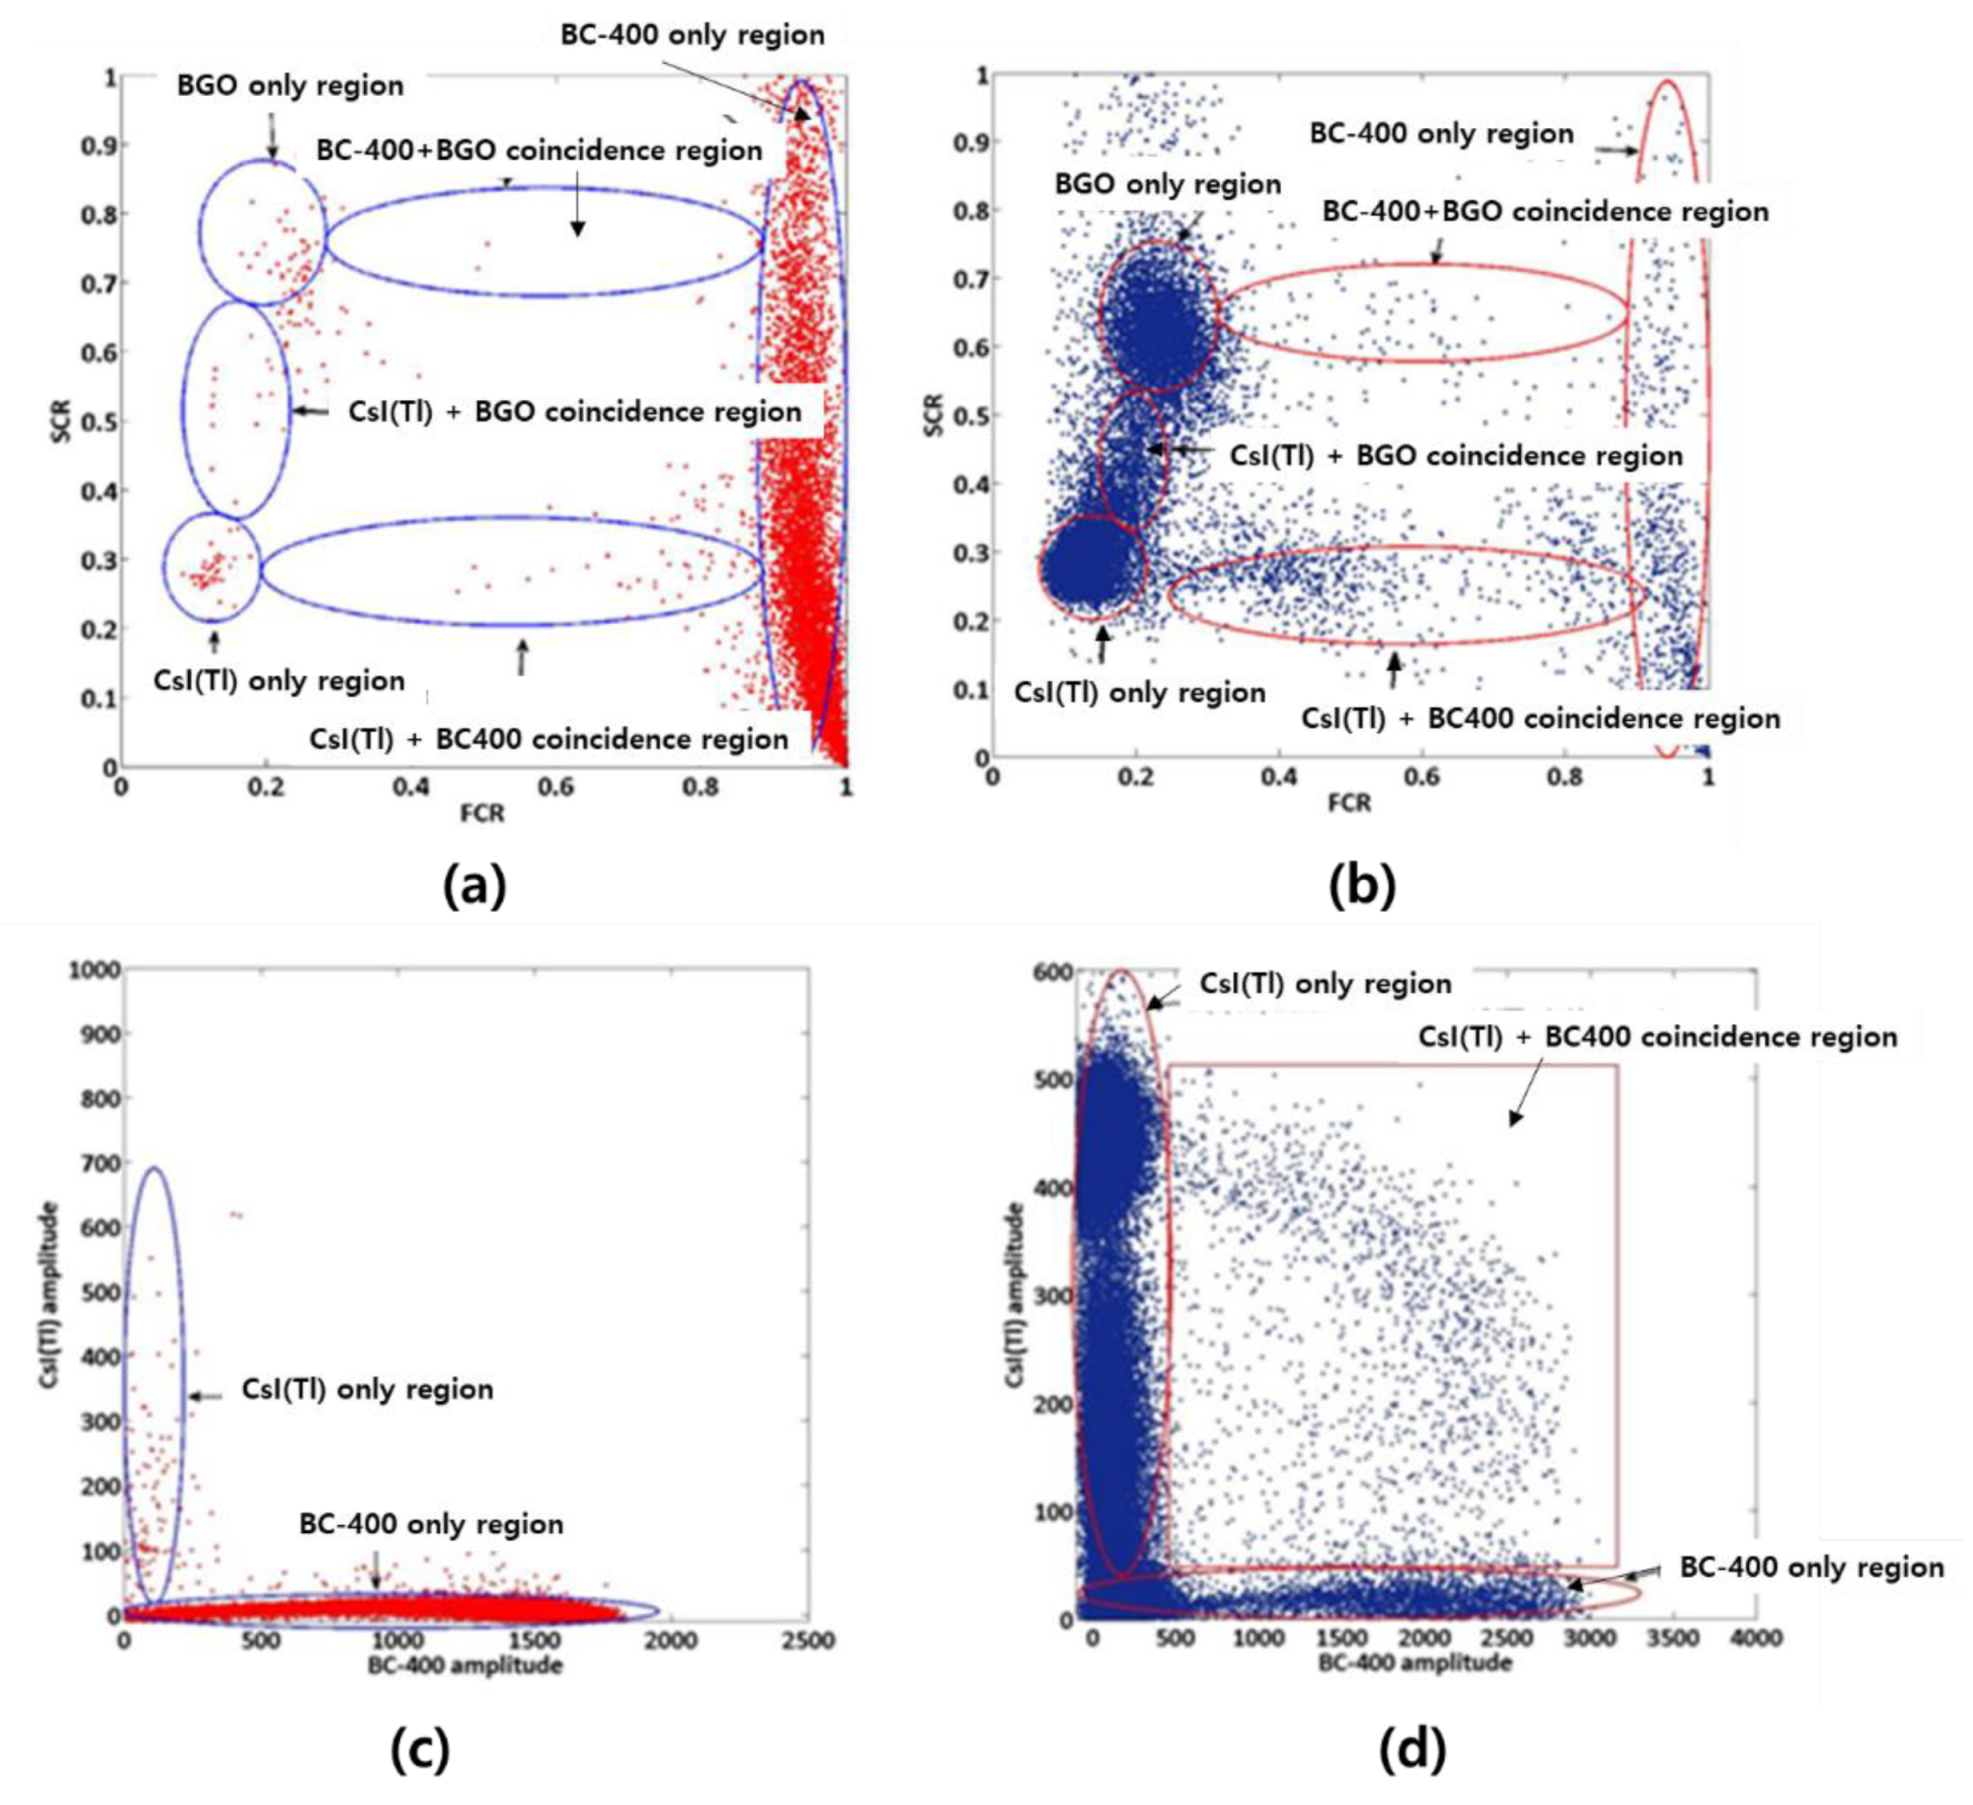
| BC-400, CsI(Tl), BGO | β, γ | - FCR (Fast component ratio) and SCR (Slow component ratio) - Least-squares method | - Detector configuration with well-type Phoswich structure for radioactive Xenon detection - All signals are processed with a self-developed FPGA device to classify beta/gamma signals using filters with different peaking times - Shows MDC of less than 1 mBq/m3 for radioactive Xenon isotopes | [47] |
| Plastic, GSO (1.5 mol% Ce), GSO (0.4 mol% Ce) | α, β, γ | - Identification based on signal decay time - Alpha/beta/gamma detection using triple-layer Phoswich structure - Calculate the response rate for each layer of alpha/beta/gamma | - Gamma rays were detected at 0.6% in the first layer, 60% in the second layer, and 39.4% in the third layer - Alpha particles were detected at 6.1% and 0.4% in the second and third layers, respectively. Beta particles were detected at 0.4% and 11.9% in the first layer and third layer. Gamma rays were detected at 0.6% in the first layer | [54] |
| ZnS(Ag), Plastic scintillator | α, β | - Pulse shape discrimination is a technique for distinguishing among different types of radiation by using the fluorescence decay-time difference of scintillators | - Decay time of ZnS(Ag) is 200 ns and the decay time of plastic scintillator is 2.4 ns - Alpha-to-beta crosstalk was less than 5%, and beta-to-alpha crosstalk was less than 2%. - It was analyzed that the spatial resolution decreases as the scintillator size increases | [60] |
| LuAG(Pr), GGAG(Ce) | n, γ | - Setting the acceptance window of MCA for signal-filter and noise minimization - The two scintillators used are sensitive to gamma rays, but the neutron reacts only to GGAG containing Gd, so the neutron removes the gamma signal measured simultaneously from the GGAG and counts only the neutron signal | - The main point of this study is that electronic devices can be simplified. This is because algorithms and additional elements/electronics for pulse shape analysis are not required. Only the window that receives the signal was adjusted to distinguish the signal - A Phoswich set-up for neutron/gamma discrimination by the introduction of a three-slice Phoswich, i.e., LuAG:Pr-GGAG:Ce-LuAG:Pr including a logic block diagram of the readout circuit | [61] |
Publisher’s Note: MDPI stays neutral with regard to jurisdictional claims in published maps and institutional affiliations. |
© 2021 by the authors. Licensee MDPI, Basel, Switzerland. This article is an open access article distributed under the terms and conditions of the Creative Commons Attribution (CC BY) license (https://creativecommons.org/licenses/by/4.0/).
Share and Cite
Min, S.; Seo, B.; Roh, C.; Hong, S.; Cheong, J. Phoswich Detectors in Sensing Applications. Sensors 2021, 21, 4047. https://doi.org/10.3390/s21124047
Min S, Seo B, Roh C, Hong S, Cheong J. Phoswich Detectors in Sensing Applications. Sensors. 2021; 21(12):4047. https://doi.org/10.3390/s21124047
Chicago/Turabian StyleMin, Sujung, Bumkyung Seo, Changhyun Roh, Sangbum Hong, and JaeHak Cheong. 2021. "Phoswich Detectors in Sensing Applications" Sensors 21, no. 12: 4047. https://doi.org/10.3390/s21124047