Abstract
Exhaled breath analysis has become more and more popular as a supplementary tool for medical diagnosis. However, the number of variables that have to be taken into account forces researchers to develop novel algorithms for proper data interpretation. This paper presents a system for analyzing exhaled air with the use of various sensors. Breath simulations with acetone as a diabetes biomarker were performed using the proposed e-nose system. The XGBoost algorithm for diabetes detection based on artificial breath analysis is presented. The results have shown that the designed system based on the XGBoost algorithm is highly selective for acetone, even at low concentrations. Moreover, in comparison with other commonly used algorithms, it was shown that XGBoost exhibits the highest performance and recall.
1. Introduction
Nowadays, groups of researchers are focused on non-invasive methods for diagnosing various diseases. One of the promising tools is exhaled breath analysis. Its potential in medical diagnosis has been known since the time of Hippocrates when he used the smell of the breath to diagnose liver disease and uncontrolled diabetes [1].
The air inhaled and exhaled by humans consists mainly of nitrogen, oxygen and carbon dioxide (Figure 1). Exhaled air contains more carbon dioxide and less oxygen than inhaled air because oxygen is used to generate energy during respiration, while carbon dioxide is produced as a by-product of the energy production process. Among the major components, exhaled breath consists of over 3500 Volatile Organic Compounds (VOCs) and a single breath consists of around 500 various VOCs, which are typically in the part per million (ppm), part per billion (ppb) or part per trillion (ppt) range [2]. Some of them are named biomarkers since their presence, as well as various concentration levels, may indicate several diseases. Biomarkers are compounds present in the body that can be used as indicators of physiology and diseases present. These types of VOCs are called endogenous VOCs and are produced by the metabolism of cells. On the other hand, the second type of VOCs are exogenous VOCs used to assess the effects of substances such as drugs, diet, cigarettes, toxic or noxious vapors and environmental pollution on the body. Exogenous VOCs are present in, for example, breath or blood as a result of circulation and/or internal metabolism [3,4,5]. Clear separation of biomarkers into these two groups is not possible because the same VOCs can be induced physiologically in the body as a result of disease, and also under the influence of external factors [4,5]. A general approach to determining biomarkers for a given pathological condition is to compare the VOC composition of a group of healthy and sick people [3]. There are several types of biomarkers: monitoring, predictive, prognostic, safety and susceptibility/risk biomarkers [6]. Systemic biomarkers are used to determine the functioning of the whole organism, while lung biomarkers are used to determine the processes and changes taking place in the respiratory system [7]. Currently, research is focused on biomarkers of various diseases, for example asthma [8,9], various types of cancers [10,11,12,13], chronic obstructive pulmonary disease [14,15] and, recently, metabolic disorders, such as diabetes [7,16,17,18,19,20,21,22,23,24], which will allow non-invasive detection and monitoring of these diseases using exhaled air. However, diet and pathological changes may affect the exhaled breath compositions; therefore, every person has their own unique molecular breath signature [7,25]. Similarly to a fingerprint, the exhaled profile is called the “breath-fingerprint” or “personal breath profile”. Common biomarkers of several diseases are listed in Table 1.
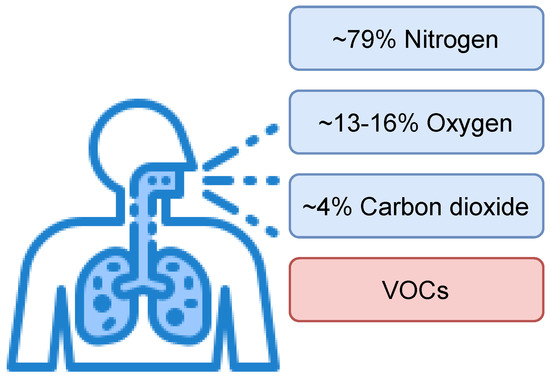
Figure 1.
General composition of humans’ exhaled breath.

Table 1.
Potential disease biomarkers in the breath.
Usually, the biomarker concentrations are too low to be detected without the utilization of advanced analytical systems such as GC/MS (Gas Chromatograph coupled to a Mass Spectrometer) [37,38], SIFT–MS (Selected Ion Flow Tube–Mass Spectrometry) [39,40], PTR–MS (Proton Transfer Reaction–Mass Spectrometry) [41]. One of the promising techniques to increase the volume of biomarkers is the utilization of preconcentrators, including micropreconcentrators [22,42,43].
One disease prevalent in civilization that requires constant monitoring is diabetes. Briefly, there are two main types of diabetes: type 1 (T1DM) and type 2 (T2DM); T2DM is the most common (90% of all cases). According to data provided by the World Health Organization (WHO), approximately 500 million people worldwide have diabetes, and this number is constantly growing. The vast majority of them live in low- and middle-income countries. The WHO also reports 1.6 million deaths annually from diabetes [44]. Diabetes over time damages the nervous system, blood vessels and heart, as well as the eyes and kidneys, leading to an increased risk of premature death [45]. Due to the ever-increasing number of people with diabetes and deaths from it, the WHO reports that there is a globally agreed goal to halt the development of diabetes and obesity by 2025 [44]. At present, there are no known methods of preventing type 1 diabetes. Its treatment consists of continuous monitoring of blood glucose level (BGL) and the patient’s insulin intake. However, in the case of type 2 diabetes, it is possible to reduce its incidence by adhering to a proper diet, increasing physical activity, and reducing smoking. In addition to diet and exercise, early diagnosis plays an important role in the treatment of diabetes, so it is important to develop an easily accessible and non-invasive device that can be used for screening [44,45,46]. In terms of exhaled breath analysis, acetone was identified as a biomarker of diabetes [7,16,17,18,19,20,21,22,23,24,47]. Results presented in Table 2 show that breath acetone concentrations for healthy peoples were lower than for diabetes patients.
Table 2.
Acetone concentration in health and diabetes samples.
Experimental results have shown that relative humidity (RH) and temperature of exhaled human breath vary between subjects. Mansour et al. examined Parisian and Halifa participants. The measured values were 31.4–35.4 °C and 65.0–88.6% for Halifa participants and 31.4–34.8 °C and 41.9–91.0% for Parisian participants [52]. Ferrus et al. showed that the RH in exhaled air from humans varies between 89 and 97% [53]. Due to the high relative humidity of the breath and its influence on the sensitivity of the measurement systems (especially metal oxide semiconductor sensors) [54,55,56], it is necessary to use moisture absorbers to properly store the breath samples and to take into account the influence of humidity on the measurements in designed algorithms.
The researchers present the results of using various supervised machine learning and deep learning algorithms to classify breath samples and detect diabetes. The most popular are K Nearest Neighbours (KNN) [57,58,59,60], Support Vector Machines (SVM) [37,59,61,62,63], Naive Bayes (NB) [59,64], Deep Neural Network (DNN) [59] and also Convolutional Neural Networks (CNN) [65]. The extraction and selection of features was most often performed using Principal Component Analysis [57,59,61,66]. The main limitation of the conducted research is the lack of an adequate number of patient samples. Only a small fraction of the research has been carried out on sample numbers above a hundred [57,58,61].
In this paper, the experimental results on the e-nose system for discrimination between healthy and diabetic patients based on the exhaled breath analysis are presented. Within this study, an artificial breath profile was developed to simulate real conditions and enable testing without involving real samples.
2. Materials and Methods
The scheme of the system proposed in this paper is presented in Figure 2.
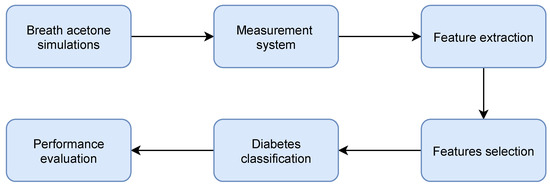
Figure 2.
Block scheme of the proposed system.
All algorithms were developed using scikit-learn Machine Learning in Python [67,68] and XGBoost, an open-source software library that provides a gradient boosting framework for C++, Java, Python, R, Julia, Perl, and Scala [69].
2.1. Equipment
Selected gas sensors (listed in Table 3) were placed in a measurement chamber with a 180 mL capacity and supplied with appropriate voltages in accordance with their data sheets. Due to the relative humidity influence on sensors’ sensitivity, in addition to gas sensors, temperature, relative humidity and pressure sensors were also used. The BME280 (Bosch Sensortec, Reutlingen, Germany) and SHT85 (Sensirion, Staefa ZH, Switzerland) sensors were placed inside the measurement chamber, while the second SHT85 sensor was placed before the gases entered the measurement chamber. All used sensors, except SGP30 and SHT85, responded to the dosed gases as voltage. For SGP30, the sensor returned Total Volatile Organic Compounds (TVOCs) and an equivalent carbon dioxide reading (eCO2) over the I2C communication bus. TGS1820 (Figaro Engineering Inc, Mino, Osaka, Japan), TGS2620 (Figaro Engineering Inc, Mino, Osaka, Japan), TGS8100 (Figaro Engineering Inc, Mino, Osaka, Japan), MQ3 (Waveshare, Shenzhen, China) and MICS5524 (Amphenol SGX Sensortech, Corcelles-Cormondreche, Switzerland) sensors’ responses were measured using Keithley 617 (Tektronix, Beaverton, OR, USA), Keithley 6514 (Tektronix, Beaverton, United States) and multimeter Keysight 34450A electrometers (Keysight, Santa Rosa, CA, USA). If the sensor sent the measured values using the Serial Peripheral Interface (SPI) or Inter-Integrated Circuit (I2C) communication bus, the ESP32 dev board (Espressif Systems, Shanghai, China) was used to read these values and send them to the measurement application written in the Python programming language. Figure 3 shows a scheme of the proposed e-nose measurement system. The glass flask shown in Figure 3 was used to simulate the humidity.
Table 3.
Sensors used in measurements.
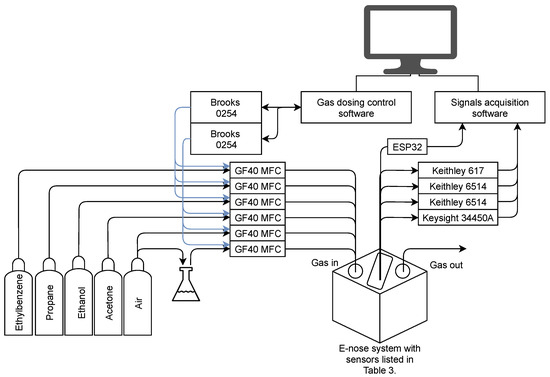
Figure 3.
Scheme of the proposed measurement system.
2.2. Exhaled Breath Simulations
The gas mixtures composed of synthetic air, acetone, ethanol, propane and ethylbenzene were dosed with a variable relative humidity to simulate exhaled air using the GF40 series (Brooks, Hatfield, United States) mass flow controllers with a Brooks 0254 controller. Due to the high humidity of the exhaled air, the measurements simulated humidity ranging from 0 to 70%. However, the relative humidity measured inside the chamber was 0 to 40% due to the increased temperature in the measurement chamber. Taking into account the number of all possible combinations of gas mixtures, the total duration of measurements was estimated to be more than 700 days. Thanks to the use of an artificial exhaled breath mixture, the experiments could be conducted constantly (24 h/7 d) without involving the diabetic patients. Since acetone is the key biomarker of diabetes, it was decided to measure the response to various concentrations of acetone contaminated with other gases in the concentration ranges that have been previously confirmed by the utilization of analytical techniques such as GC/MS [37,38]. Based on the obtained results presented in Table 2, the simulations assumed that the concentration of acetone in the exhaled air for a healthy person is <1.5 ppm and for a diabetic patient is ≥1.5 ppm.
2.3. Preprocessing
In order to obtain input data for the algorithms, preprocessing and features extraction were carried out. The use of baseline subtraction is important due to baseline drift. The result of the long-term stability test is given in Figure 4.
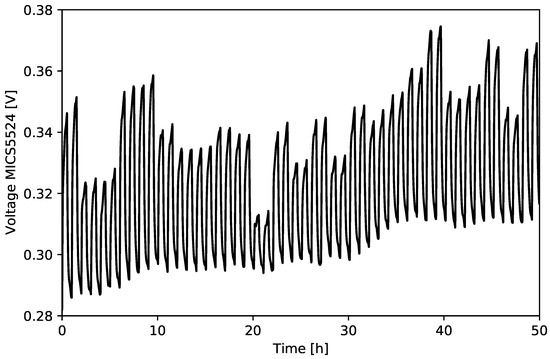
Figure 4.
Result of the long-term test for different gas mixtures—MICS5524.
The baseline was fitted to the raw data obtained from the sensors and then subtracted (Figure 5).
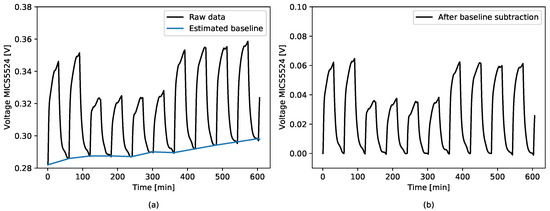
Figure 5.
Baseline subtraction. (a) Sensor raw response with fitted baseline; (b) result of the baseline subtraction.
The following features have been extracted from each gas sensor:
- The sensor response (S) defined by Equation (1):
- The sensor response change () defined by the Equation (2):where:—sensor exposed to target gas, e.g., acetone;—sensor exposed to pure synthetic air;
- Area under sensor’s response curve (AUC) calculated when the sensor is exposed to gas. Result approximated by the trapezoidal numerical integration.
The prepared dataset from the simulation of acetone in the breath was divided into two separate sets—the training set and the test set. In order to simulate the real case, where samples from healthy subjects are overwhelmingly obtained [37,38,70,71], the simulations were conducted with an unbalanced number of samples. Moreover, not every algorithm, i.e., Support Vector Machines, K Nearest Neighbours [72,73,74], works well with an unbalanced dataset; therefore, such experiments are crucial. Due to the unbalanced number of samples belonging to the “healthy” and “diabetes” classes, the data were divided in such a way that the same percentage of samples from each class was included in both the test and training sets. Distribution of samples in the dataset are given in Figure 6.
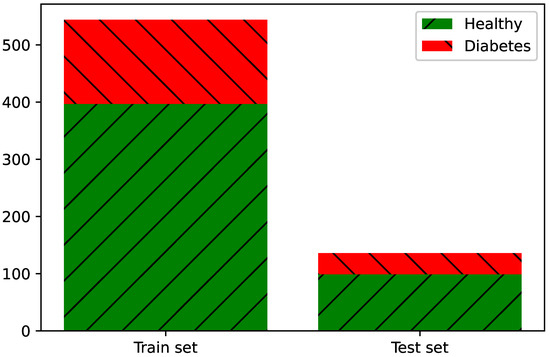
Figure 6.
Dataset abundance and distribution.
2.4. Features Selection
Due to the correlation between the features extracted from the raw data from each sensor, we decided to use the calculated S results and the values read from the temperature and humidity sensors as an input to the algorithms. As detailed in Section 3.3, the gas sensors, except SGP30, used the S value that slightly changes with the change in humidity, which is important when measuring exhaled air, characterized by high humidity.
2.5. XGBoost Classifier
Recently, extreme gradient boosting (XGBoost) state-of-the-art algorithms are becoming more and more popular not only for classification, but also for regression problems, due to their high performance [69,75,76,77]. The XGBoost alghorithm is a scalable tree boosting system which was developed by Chen and Guestrin in 2016. Parallel, distributed, out-of-core and cache-aware computing makes the algorithm more than ten times faster than popular models used in machine learning (ML) and deep learning (DL). Another advantage of this algorithm is that it is well optimized and scalable. Due to this innovation, it can be successfully used to process billions of examples in distributed or memory-limited settings. This cutting-edge application of gradient boosting machines was designed to handle real-world problems where the input data sparsity is a common issue. The algorithm is aware of the presence of missing values, too frequent zero values in the dataset and results of applied feature engineering techniques. The ensemble technique is the recursive addition of new models until further addition no longer noticeably enhances the performance of existing models. The loss of the model is minimized by the gradient descent algorithm [69].
2.6. Hyperparameter Optimization
To determine the best performance, the model’s hyperparemeters were optimized by a grid search algorithm. Model evaluation was performed using the stratified k-fold cross-validation method. It is commonly used to evaluate models with limited datasets. We decided to use a stratified version of this algorithm due to the unbalanced dataset; it splits the dataset, keeping the equal proportions of each output class in each fold. The use of this method enables the selection of optimal model hyperparameters and reduces overfitting of the data. The training set was divided into k sets, then the model was trained with the use of k−1 datasets, and the remaining set was used to validate the model using the selected metrics. The final value of a metric is the average of the k iteration [78,79].
2.7. Classifiers’ Performance Evaluation Metrics
In this paper, we mainly focused on obtaining the highest possible sensitivity value (recall score) defined by Equation (3):
where:
TPR—true positive rate (recall, sensitivity);
TP—true positive;
FN—false negative [80].
This metric is especially important in medical applications, when the dataset is unbalanced, and we strive to minimize the type II error. For example, in the case of screening tests, it is important to mark all potentially sick patients and possibly, in further, more accurate, as well as invasive and more expensive tests, confirm or rule out diabetes.
3. Results and Discussion
3.1. Sensors’ Sensitivity to Gases Used in Simulations
Figure 7 shows the responses of each sensor to different acetone concentrations. Each concentration was repeated at least twice in order to check the stability of the sensors and the repeatability of the response to individual gas concentrations. The results show that each of the sensors is sensitive to changes in acetone concentration, and in the case of the same concentration being used several times, the sensors are stable and the responses are repeatable.
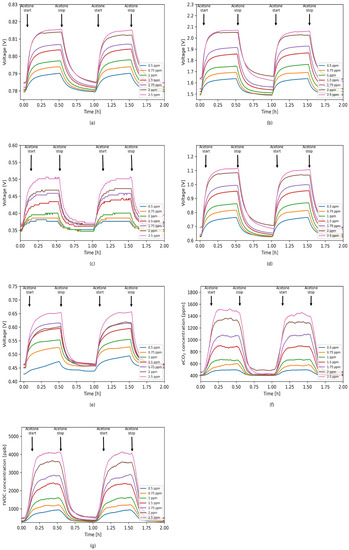
Figure 7.
Sensors’ responses to different acetone concentrations in 0% RH. (a) TGS1820; (b) TGS2620; (c) TGS8100; (d) MQ3; (e) MICS5524; (f) SGP30 eCO2; (g) SGP30 tVOC.
3.2. Sensors’ Selectivity to Acetone
The results of measurements of the sensor response to various gas mixtures with a constant concentration of acetone—1.5 ppm in each mixture, given in Figure 8—show that none of the sensors included in the designed e-nose system is fully acetone selective. Therefore, it is important to use a sensor array where each sensor is selective for different gases/gas mixtures.
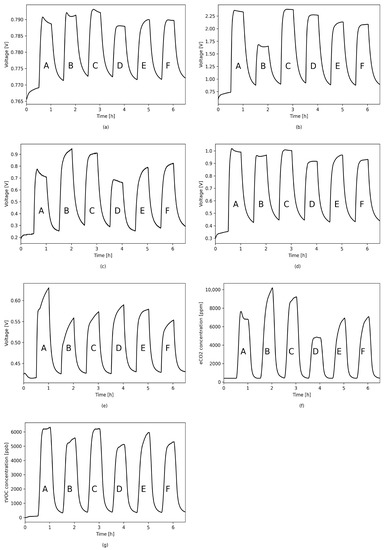
Figure 8.
Sensors’ responses to different simulated mixtures in 0% RH. A. 1.5 ppm acetone, 2.5 ppm ethanol, 1 ppm propane; B. 1.5 ppm acetone, 1 ppm ethanol, 2.5 ppm ethylbenzene; C. 1.5 ppm acetone, 1.5 ppm ethanol, 1 ppm ethylbenzene, 1 ppm propane; D. 1.5 ppm acetone, 1.5 ppm ethanol, 1 ppm propane; E. 1.5 ppm acetone, 1.5 ppm ethanol, 0.5 ppm ethylbenzene, 0.5 ppm propane; F. 1.5 ppm acetone, 1 ppm ethanol, 1 ppm ethylbenzene, 0.5 ppm propane; (a) TGS1820; (b) TGS2620; (c) TGS8100; (d) MQ3; (e) MICS5524; (f) SGP30 eCO2; (g) SGP30 tVOC.
3.3. Relative Humidity Dependency
Due to the high humidity of the breath, measurements were made at different simulated humidities. For each of the sensors used, the characteristics of the relative dependence of the sensor’s response to humidity were determined and the dependence of the sensitivity to 1 ppm of acetone on the ambient humidity was also calculated. Results are given in Figure 9.
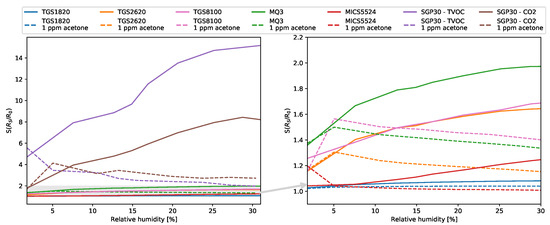
Figure 9.
Sensors’ sensitivity in different relative humidities in chamber.
3.4. Classification
The optimal model hyperparameters were determined using the grid search algorithm. In order to assess whether the model is underfitted or overfitted, validation was used with the use of a separate validation set. Learning curves showing the dependence of the classification error on the number of training epochs are shown in Figure 10.
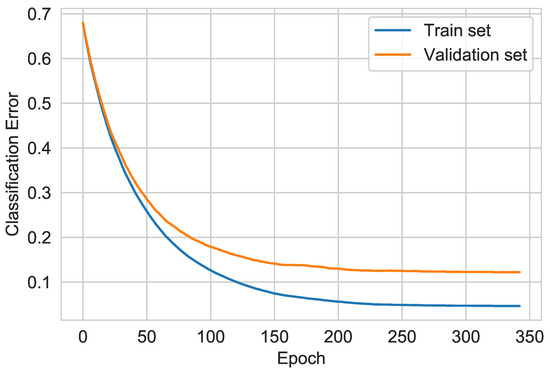
Figure 10.
XGBoost learning curves.
3.5. Feature Importance
The results of the algorithm showed that the three most important features for the classification were measurements from the MQ3, TGS1820, SGP30 and SHT85 sensors placed inside the chamber. Feature importance values for the most significant sensors are given in Figure 11.
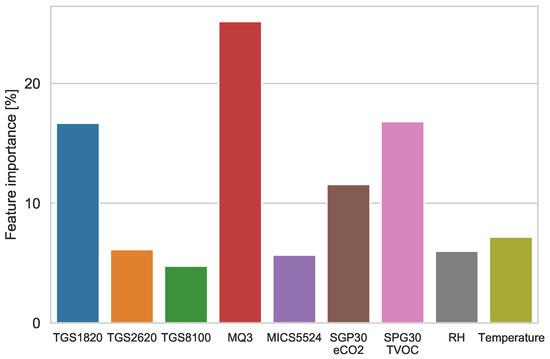
Figure 11.
XGBoost features’ importance.
3.6. Performance Evaluation
In the case of using the algorithm based on the gradient of boosted trees, the recall equals 1, which means that all the sick patients were correctly marked as sick and the type II error was minimized. The other calculated performance evaluation metrics are summarized in Table 4. As we assumed, the algorithm’s hyperparameters were selected in such a way that it achieved the highest recall value.
Table 4.
Classifier performance evaluation results.
Confusion Matrix
The algorithm’s confusion matrix is shown in Figure 12. It shows that the healthy diabetes samples were classified properly. The confusion matrix allows one to accurately quantify the true positive, true negative, false positive and false negative test samples. Based on these values, the remaining metrics are calculated. In the case of the proposed XGBoost Classifier algorithm, two cases of simulated diabetes patients were incorrectly classified. This is a type I statistical error.
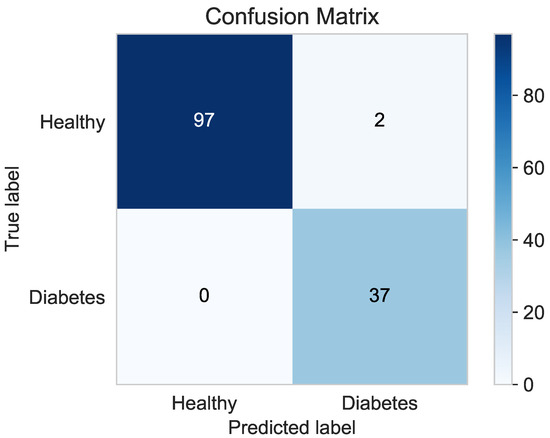
Figure 12.
XGBoost Classifier confusion matrix.
3.7. Comparison with Classic Machine Learning Algorithms
In this paper, we also compared the classification performance achieved using the XGBoost algorithm with the results of classic classifiers such as Support Vector Machines (SVM), K Nearest Neightbour (KNN), Decision Tree Classifier (DT) and Random Forest Classifier (RF), commonly used in previous research. For these algorithms, the hyperparameters were also determined using the grid search method and the K-Fold validation was performed. The classification was carried out using the same train and test sets as for XGBoost.
Figure 13 shows a comparison of the achieved recall of the algorithms.
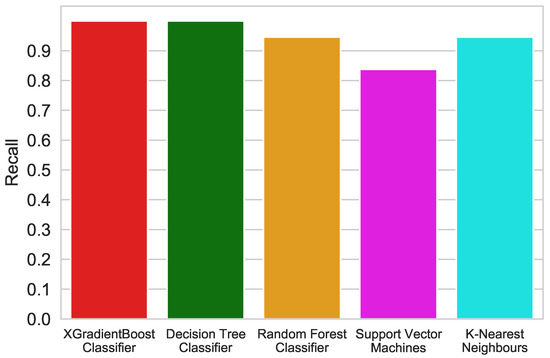
Figure 13.
Recall comparison of different algorithms.
The receiver operating characteristics (ROC) curve shows the dependence between recall and 1-specificity. It is commonly used in machine learning tasks for medical applications. The closer the curve for a given model is to the point (0,1), the better the classifier. The most common problem in designing models for medical data is that the data contain more healthy cases than disease ones [81]. Figure 14 shows the ROC comparison for each of the algorithms used in this research.
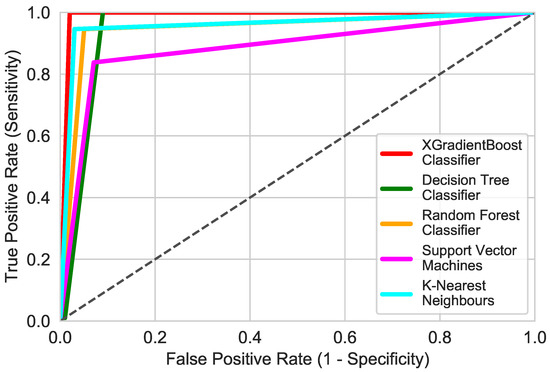
Figure 14.
ROC comparison of different algorithms.
All of the used algorithms exhibited good performances. Each of these algorithms obtained recall and false positive rates of over 80%. By analyzing the determined metrics, it can be seen that the XGBoost Classifier has the highest accuracy and recall equal to 99 and 100%, respectively. Decision Tree Classifier obtained a recall identical to the XGBoost Classiffier, but the results differ in the amount of false positives. It is true that in screening tests, the most important detection is as many true positives as possible, but reducing the number of false positives, i.e., healthy ones classified as sick, reduces the cost of further diagnosis.
3.8. Discussion
Due to the individual variability shown in the literature, depending on, inter alia, sex, age, diet, duration of diabetes life, the course of treatment and its type, it is necessary to conduct tests on breath samples. It may also be necessary to develop a method for calibrating the device tailored to an individual patient. The results presented in this paper show that the designed system is highly selective for acetone, even at low concentrations. In order to confirm the selectivity of the system towards all breath components, it is necessary to carry out measurements on samples of exhaled air taken from healthy people and diabetics. The graphs of dependence of the sensor’s response and sensitivity on the ambient humidity in the measurement chamber showed that the all sensors used, except SGP30, are slightly sensitive to humidity. Measurements of humidity in the chamber and taking these results into account in the input data to the algorithms made it possible to compensate for its influence. In the case of the presented sensors’ system and the algorithm used, the classification of diabetics was independent of the relative humidity inside the measuring chamber. Comparison with other commonly used algorithms showed that XGBoost showed the highest performance and recall. One of the disadvantages of the system is the long response and retention time of each of the sensors used; therefore, in order to use such a system for medical applications, it is necessary to use a different sensor matrix, a preconcentrator, increase the total air flows in the chamber or reduce the volume of the measurement chamber.
4. Conclusions
Exhaled breath analysis consists of several steps including sample collection, compound detection, data analysis, and data interpretation. Each stage could be realized in various manners. So far, the researchers have made efforts to develop the compound detection units, for example, by the utilization of electronic noses, which offer cheap, fast, and reliable results. However, due to the number of compounds present in exhaled human breath as well as high humidity concentration, the detection unit has to be supported by an artificial intelligence element to deliver reliable results. In this paper, the XGBoost algorithm for diabetes detection based on the exhaled breath analysis is presented. The results have shown that the designed system based on the XGBoost algorithm was highly selective for acetone, even at low concentrations. Moreover, in comparison with other commonly used algorithms, it was shown that XGBoost exhibits the highest performance and recall, which makes it a first choice for data analysis in terms of diabetes detection.
Author Contributions
Conceptualization, A.P.; methodology, A.P.; software, A.P.; validation, A.P and D.G.; formal analysis, A.P., A.R. and D.G.; investigation, A.P. and D.G.; data curation, A.P.; writing—original draft preparation, A.P.; writing—review and editing, A.R.; visualization, A.P.; supervision, A.R.; project administration, A.R.; funding acquisition, A.R. All authors have read and agreed to the published version of the manuscript.
Funding
This work was supported by the National Science Centre, NCN Poland 2017/26/D/ST7/00355.
Institutional Review Board Statement
Not applicable.
Informed Consent Statement
Not applicable.
Data Availability Statement
Not applicable.
Conflicts of Interest
The authors declare no conflict of interest.
References
- Phillips, M. Breath tests in medicine. Sci. Am. 1992, 267, 74–79. [Google Scholar] [CrossRef]
- Selvaraj, R.; Vasa, N.J.; Nagendra, S.M.S.; Mizaikoff, B. Advances in Mid-Infrared Spectroscopy-Based Sensing Techniques for Exhaled Breath Diagnostics. Molecules 2020, 25, 2227. [Google Scholar] [CrossRef] [PubMed]
- Gaude, E.; Nakhleh, M.K.; Patassini, S.; Boschmans, J.; Allsworth, M.; Boyle, B.; van der Schee, M.P. Targeted breath analysis: Exogenous volatile organic compounds (EVOC) as metabolic pathway-specific probes. J. Breath Res. 2019, 13, 032001. [Google Scholar] [CrossRef] [PubMed]
- Longo, V.; Forleo, A.; Ferramosca, A.; Notari, T.; Pappalardo, S.; Siciliano, P.; Capone, S.; Montano, L. Blood, urine and semen Volatile Organic Compound (VOC) pattern analysis for assessing health environmental impact in highly polluted areas in Italy. Environ. Pollut. 2021, 117410. [Google Scholar] [CrossRef] [PubMed]
- Capone, S.; Tufariello, M.; Forleo, A.; Longo, V.; Giampetruzzi, L.; Radogna, A.V.; Casino, F.; Siciliano, P. Chromatographic analysis of VOC patterns in exhaled breath from smokers and nonsmokers. Biomed. Chromatogr. 2018, 32, e4132. [Google Scholar] [CrossRef]
- Califf, R.M. Biomarker definitions and their applications. Exp. Biol. Med. 2018, 243, 213–221. [Google Scholar] [CrossRef] [PubMed]
- Popov, T.A. Human exhaled breath analysis. Ann. Allergy Asthma Immunol. 2011, 106, 451–456. [Google Scholar] [CrossRef]
- Melo, R.E.; Popov, T.A.; Solé, D. Exhaled breath temperature, a new biomarker in asthma control: A pilot study. J. Bras. Pneumol. 2010, 36, 693–699. [Google Scholar] [CrossRef]
- Harkins, M.S.; Fiato, K.L.; Iwamoto, G.K. Exhaled nitric oxide predicts asthma exacerbation. J. Asthma 2004, 41, 471–476. [Google Scholar] [CrossRef]
- Sakumura, Y.; Koyama, Y.; Tokutake, H.; Hida, T.; Sato, K.; Itoh, T.; Akamatsu, T.; Shin, W. Diagnosis by volatile organic compounds in exhaled breath from lung cancer patients using support vector machine algorithm. Sensors 2017, 17, 287. [Google Scholar] [CrossRef]
- Dent, A.G.; Sutedja, T.G.; Zimmerman, P.V. Exhaled breath analysis for lung cancer. J. Thorac. Dis. 2013, 5, S540. [Google Scholar]
- Herman-Saffar, O.; Boger, Z.; Libson, S.; Lieberman, D.; Gonen, R.; Zeiri, Y. Early non-invasive detection of breast cancer using exhaled breath and urine analysis. Comput. Biol. Med. 2018, 96, 227–232. [Google Scholar] [CrossRef]
- Li, J.; Peng, Y.; Duan, Y. Diagnosis of breast cancer based on breath analysis: An emerging method. Crit. Rev. Oncol. 2013, 87, 28–40. [Google Scholar] [CrossRef]
- Christiansen, A.; Davidsen, J.R.; Titlestad, I.; Vestbo, J.; Baumbach, J. A systematic review of breath analysis and detection of volatile organic compounds in COPD. J. Breath Res. 2016, 10, 034002. [Google Scholar] [CrossRef]
- Bregy, L.; Nussbaumer-Ochsner, Y.; Sinues, P.M.L.; García-Gómez, D.; Suter, Y.; Gaisl, T.; Stebler, N.; Gaugg, M.T.; Kohler, M.; Zenobi, R. Real-time mass spectrometric identification of metabolites characteristic of chronic obstructive pulmonary disease in exhaled breath. Clin. Mass Spectrom. 2018, 7, 29–35. [Google Scholar] [CrossRef]
- Wang, Z.; Wang, C. Is breath acetone a biomarker of diabetes? A historical review on breath acetone measurements. J. Breath Res. 2013, 7, 037109. [Google Scholar] [CrossRef]
- Minh, T.D.C.; Blake, D.R.; Galassetti, P.R. The clinical potential of exhaled breath analysis for diabetes mellitus. Diabetes Res. Clin. Pract. 2012, 97, 195–205. [Google Scholar] [CrossRef]
- Deng, C.; Zhang, J.; Yu, X.; Zhang, W.; Zhang, X. Determination of acetone in human breath by gas chromatography–mass spectrometry and solid-phase microextraction with on-fiber derivatization. J. Chromatogr. B 2004, 810, 269–275. [Google Scholar] [CrossRef]
- Nelson, N.; Lagesson, V.; Nosratabadi, A.R.; Ludvigsson, J.; Tagesson, C. Exhaled isoprene and acetone in newborn infants and in children with diabetes mellitus. Pediatr. Res. 1998, 44, 363–367. [Google Scholar] [CrossRef]
- Španěl, P.; Dryahina, K.; Smith, D. Acetone, ammonia and hydrogen cyanide in exhaled breath of several volunteers aged 4–83 years. J. Breath Res. 2007, 1, 011001. [Google Scholar] [CrossRef] [PubMed]
- Ghimenti, S.; Tabucchi, S.; Lomonaco, T.; Francesco, F.D.; Fuoco, R.; Onor, M.; Lenzi, S.; Trivella, M.G. Monitoring breath during oral glucose tolerance tests. J. Breath Res. 2013, 7, 017115. [Google Scholar] [CrossRef]
- Ueta, I.; Saito, Y.; Hosoe, M.; Okamoto, M.; Ohkita, H.; Shirai, S.; Tamura, H.; Jinno, K. Breath acetone analysis with miniaturized sample preparation device: In-needle preconcentration and subsequent determination by gas chromatography–mass spectroscopy. J. Chromatogr. B 2009, 877, 2551–2556. [Google Scholar] [CrossRef]
- Rydosz, A. Sensors for enhanced detection of acetone as a potential tool for noninvasive diabetes monitoring. Sensors 2018, 18, 2298. [Google Scholar] [CrossRef]
- Sun, M.; Chen, Z.; Gong, Z.; Zhao, X.; Jiang, C.; Yuan, Y.; Wang, Z.; Li, Y.; Wang, C. Determination of breath acetone in 149 Type 2 diabetic patients using a ringdown breath-acetone analyzer. Anal. Bioanal. Chem. 2015, 407, 1641–1650. [Google Scholar] [CrossRef] [PubMed]
- Davis, C.E.; Frank, M.; Mizaikoff, B.; Oser, H. The future of sensors and instrumentation for human breath analysis. IEEE Sens. J. 2010, 10, 3–6. [Google Scholar] [CrossRef]
- Buszewski, B.; Kęsy, M.; Ligor, T.; Amann, A. Human exhaled air analytics: Biomarkers of diseases. Biomed. Chromatogr. 2007, 21, 553–566. [Google Scholar] [CrossRef]
- Smith, D.; Španěl, P.; Gilchrist, F.J.; Lenney, W. Hydrogen cyanide, a volatile biomarker of Pseudomonas aeruginosa infection. J. Breath Res. 2013, 7, 044001. [Google Scholar] [CrossRef] [PubMed]
- Gilchrist, F.J.; Razavi, C.; Webb, A.K.; Jones, A.M.; Španěl, P.; Smith, D.; Lenney, W. An investigation of suitable bag materials for the collection and storage of breath samples containing hydrogen cyanide. J. Breath Res. 2012, 6, 036004. [Google Scholar] [CrossRef] [PubMed]
- Grabowska-Polanowska, B.; Faber, J.; Skowron, M.; Miarka, P.; Pietrzycka, A.; Śliwka, I.; Amann, A. Detection of potential chronic kidney disease markers in breath using gas chromatography with mass-spectral detection coupled with thermal desorption method. J. Chromatogr. A 2013, 1301, 179–189. [Google Scholar] [CrossRef]
- Haines, A.; Dilawari, J.; Metz, G.; Blendis, L.; Wiggins, H. Breath-methane in patients with cancer of the large bowel. Lancet 1977, 310, 481–483. [Google Scholar] [CrossRef]
- Sivertsen, S.; Bjørneklett, A.; Gullestad, H.; Nygaard, K. Breath methane and colorectal cancer. Scand. J. Gastroenterol. 1992, 27, 25–28. [Google Scholar] [CrossRef]
- Weitz, Z.; Birnbaum, A.; Skosey, J.; Sobotka, P.; Zarling, E. High breath pentane concentrations during acute myocardial infarction. Lancet 1991, 337, 933–935. [Google Scholar] [CrossRef]
- Mendis, S.; Sobotka, P.A.; Euler, D.E. Expired hydrocarbons in patients with acute myocardial infarction. Free Radic. Res. 1995, 23, 117–122. [Google Scholar] [CrossRef] [PubMed]
- Olopade, C.O.; Christon, J.A.; Zakkar, M.; Swedler, W.I.; Rubinstein, I.; Hua, C.w.; Scheff, P.A. Exhaled pentane and nitric oxide levels in patients with obstructive sleep apnea. Chest 1997, 111, 1500–1504. [Google Scholar] [CrossRef] [PubMed]
- Davies, S.; Spanel, P.; Smith, D. Quantitative analysis of ammonia on the breath of patients in end-stage renal failure. Kidney Int. 1997, 52, 223–228. [Google Scholar] [CrossRef] [PubMed]
- Popa, C.; Dutu, D.; Cernat, R.; Matei, C.; Bratu, A.; Banita, S.; Dumitras, D.C. Ethylene and ammonia traces measurements from the patients’ breath with renal failure via LPAS method. Appl. Phys. B 2011, 105, 669–674. [Google Scholar] [CrossRef]
- Saidi, T.; Zaim, O.; Moufid, M.; El Bari, N.; Ionescu, R.; Bouchikhi, B. Exhaled breath analysis using electronic nose and gas chromatography–mass spectrometry for non-invasive diagnosis of chronic kidney disease, diabetes mellitus and healthy subjects. Sens. Actuators B Chem. 2018, 257, 178–188. [Google Scholar] [CrossRef]
- Siegel, A.P.; Daneshkhah, A.; Hardin, D.S.; Shrestha, S.; Varahramyan, K.; Agarwal, M. Analyzing breath samples of hypoglycemic events in type 1 diabetes patients: Towards developing an alternative to diabetes alert dogs. J. Breath Res. 2017, 11, 026007. [Google Scholar] [CrossRef]
- Storer, M.; Dummer, J.; Lunt, H.; Scotter, J.; McCartin, F.; Cook, J.; Swanney, M.; Kendall, D.; Logan, F.; Epton, M. Measurement of breath acetone concentrations by selected ion flow tube mass spectrometry in type 2 diabetes. J. Breath Res. 2011, 5, 046011. [Google Scholar] [CrossRef] [PubMed]
- Dummer, J.F.; Storer, M.K.; Hu, W.P.; Swanney, M.P.; Milne, G.J.; Frampton, C.M.; Scotter, J.M.; Prisk, G.K.; Epton, M.J. Accurate, reproducible measurement of acetone concentration in breath using selected ion flow tube-mass spectrometry. J. Breath Res. 2010, 4, 046001. [Google Scholar] [CrossRef]
- Thekedar, B.; Szymczak, W.; Höllriegl, V.; Hoeschen, C.; Oeh, U. Investigations on the variability of breath gas sampling using PTR-MS. J. Breath Res. 2009, 3, 027007. [Google Scholar] [CrossRef]
- Rydosz, A.; Maziarz, W.; Pisarkiewicz, T.; de Torres, H.B.; Mueller, J. A micropreconcentrator design using low temperature cofired ceramics technology for acetone detection applications. IEEE Sens. J. 2013, 13, 1889–1896. [Google Scholar] [CrossRef]
- Rydosz, A. Micropreconcentrator in LTCC technology with mass spectrometry for the detection of acetone in healthy and type-1 diabetes mellitus patient breath. Metabolites 2014, 4, 921–931. [Google Scholar] [CrossRef] [PubMed]
- WHO. Global Report on Diabetes (2019); WHO: Geneva, Switzerland, 2019. [Google Scholar]
- Ley, S.H.; Hamdy, O.; Mohan, V.; Hu, F.B. Prevention and management of type 2 diabetes: Dietary components and nutritional strategies. Lancet 2014, 383, 1999–2007. [Google Scholar] [CrossRef]
- Hegde, H.; Shimpi, N.; Panny, A.; Glurich, I.; Christie, P.; Acharya, A. Development of non-invasive diabetes risk prediction models as decision support tools designed for application in the dental clinical environment. Inform. Med. Unlocked 2019, 17, 100254. [Google Scholar] [CrossRef] [PubMed]
- Jiang, C.; Sun, M.; Wang, Z.; Chen, Z.; Zhao, X.; Yuan, Y.; Li, Y.; Wang, C. A portable real-time ringdown breath acetone analyzer: Toward potential diabetic screening and management. Sensors 2016, 16, 1199. [Google Scholar] [CrossRef] [PubMed]
- Saasa, V.; Beukes, M.; Lemmer, Y.; Mwakikunga, B. Blood ketone bodies and breath acetone analysis and their correlations in type 2 diabetes mellitus. Diagnostics 2019, 9, 224. [Google Scholar] [CrossRef]
- Wang, C.; Mbi, A.; Shepherd, M. A study on breath acetone in diabetic patients using a cavity ringdown breath analyzer: Exploring correlations of breath acetone with blood glucose and glycohemoglobin A1C. IEEE Sens. J. 2009, 10, 54–63. [Google Scholar] [CrossRef]
- Schwarz, K.; Pizzini, A.; Arendacka, B.; Zerlauth, K.; Filipiak, W.; Schmid, A.; Dzien, A.; Neuner, S.; Lechleitner, M.; Scholl-Bürgi, S.; et al. Breath acetone—aspects of normal physiology related to age and gender as determined in a PTR-MS study. J. Breath Res. 2009, 3, 027003. [Google Scholar] [CrossRef]
- Teshima, N.; Li, J.; Toda, K.; Dasgupta, P.K. Determination of acetone in breath. Anal. Chim. Acta 2005, 535, 189–199. [Google Scholar] [CrossRef]
- Mansour, E.; Vishinkin, R.; Rihet, S.; Saliba, W.; Fish, F.; Sarfati, P.; Haick, H. Measurement of temperature and relative humidity in exhaled breath. Sens. Actuators B Chem. 2020, 304, 127371. [Google Scholar] [CrossRef]
- Ferrus, L.; Guenard, H.; Vardon, G.; Varene, P. Respiratory water loss. Respir. Physiol. 1980, 39, 367–381. [Google Scholar] [CrossRef]
- Beauchamp, J.; Herbig, J.; Gutmann, R.; Hansel, A. On the use of Tedlar® bags for breath-gas sampling and analysis. J. Breath Res. 2008, 2, 046001. [Google Scholar] [CrossRef] [PubMed]
- Tricoli, A.; Righettoni, M.; Pratsinis, S.E. Minimal cross-sensitivity to humidity during ethanol detection by SnO2–TiO2 solid solutions. Nanotechnology 2009, 20, 315502. [Google Scholar] [CrossRef] [PubMed]
- Lekha, S.; Suchetha, M. Real-time non-invasive detection and classification of diabetes using modified convolution neural network. IEEE J. Biomed. Health Inform. 2017, 22, 1630–1636. [Google Scholar] [CrossRef] [PubMed]
- Guo, D.; Zhang, D.; Li, N.; Zhang, L.; Yang, J. A novel breath analysis system based on electronic olfaction. IEEE Trans. Biomed. Eng. 2010, 57, 2753–2763. [Google Scholar]
- Yan, K.; Zhang, D. A novel breath analysis system for diabetes diagnosis. In Proceedings of the 2012 International Conference on Computerized Healthcare (ICCH), Hong Kong, China, 17–18 December 2012; pp. 166–170. [Google Scholar]
- Sarno, R.; Sabilla, S.I.; Wijaya, D.R. Electronic Nose for Detecting Multilevel Diabetes using Optimized Deep Neural Network. Eng. Lett. 2020, 28. [Google Scholar]
- Hariyanto; Sarno, R.; Wijaya, D.R. Detection of diabetes from gas analysis of human breath using e-Nose. In Proceedings of the 2017 11th International Conference on Information & Communication Technology and System (ICTS), Surabaya, Indonesia, 31 October 2017; pp. 241–246. [Google Scholar]
- Yan, K.; Zhang, D.; Wu, D.; Wei, H.; Lu, G. Design of a breath analysis system for diabetes screening and blood glucose level prediction. IEEE Trans. Biomed. Eng. 2014, 61, 2787–2795. [Google Scholar] [CrossRef]
- Guo, D.; Zhang, D.; Li, N.; Zhang, L.; Yang, J. Diabetes identification and classification by means of a breath analysis system. In Proceedings of the International Conference on Medical Biometrics, Hong Kong, China, 28–30 June 2010; Springer: Berlin/Heidelberg, Germany, 2010; pp. 52–63. [Google Scholar]
- Lekha, S.; Suchetha, M. Non-invasive diabetes detection and classification using breath analysis. In Proceedings of the 2015 International Conference on Communications and Signal Processing (ICCSP), Melmaruvathur, India, 2–4 April 2015; pp. 0955–0958. [Google Scholar]
- Kalidoss, R.; Umapathy, S.; Kothalam, R.; Sakthivelu, U. Adsorption kinetics feature extraction from breathprint obtained by graphene based sensors for diabetes diagnosis. J. Breath Res. 2020, 15, 016005. [Google Scholar] [CrossRef]
- Lekha, S.; Suchetha, M. A novel 1-D convolution neural network with SVM architecture for real-time detection applications. IEEE Sens. J. 2017, 18, 724–731. [Google Scholar] [CrossRef]
- Zhang, D.; Guo, D.; Yan, K. Breath Signal Analysis for Diabetics. In Breath Analysis for Medical Applications; Springer: Berlin/Heidelberg, Germany, 2017; pp. 241–258. [Google Scholar]
- Buitinck, L.; Louppe, G.; Blondel, M.; Pedregosa, F.; Mueller, A.; Grisel, O.; Niculae, V.; Prettenhofer, P.; Gramfort, A.; Grobler, J.; et al. API design for machine learning software: Experiences from the scikit-learn project. In ECML PKDD Workshop: Languages for Data Mining and Machine Learning; Springer: Prague, Czech Republic, 2013; pp. 108–122. [Google Scholar]
- Pedregosa, F.; Varoquaux, G.; Gramfort, A.; Michel, V.; Thirion, B.; Grisel, O.; Blondel, M.; Prettenhofer, P.; Weiss, R.; Dubourg, V.; et al. Scikit-learn: Machine Learning in Python. J. Mach. Learn. Res. 2011, 12, 2825–2830. [Google Scholar]
- Chen, T.; Guestrin, C. XGBoost: A Scalable Tree Boosting System. In Proceedings of the 22nd ACM SIGKDD International Conference on Knowledge Discovery and Data Mining, San Francisco, CA, USA, 13–17 August 2016; KDD ’16; ACM: New York, NY, USA, 2016; pp. 785–794. [Google Scholar] [CrossRef]
- Fan, G.T.; Yang, C.L.; Lin, C.H.; Chen, C.C.; Shih, C.H. Applications of Hadamard transform-gas chromatography/mass spectrometry to the detection of acetone in healthy human and diabetes mellitus patient breath. Talanta 2014, 120, 386–390. [Google Scholar] [CrossRef]
- Bajtarevic, A.; Ager, C.; Pienz, M.; Klieber, M.; Schwarz, K.; Ligor, M.; Ligor, T.; Filipiak, W.; Denz, H.; Fiegl, M.; et al. Noninvasive detection of lung cancer by analysis of exhaled breath. BMC Cancer 2009, 9, 1–16. [Google Scholar] [CrossRef]
- Cateni, S.; Colla, V.; Vannucci, M. A method for resampling imbalanced datasets in binary classification tasks for real-world problems. Neurocomputing 2014, 135, 32–41. [Google Scholar] [CrossRef]
- Liu, W.; Chawla, S. Class confidence weighted knn algorithms for imbalanced data sets. In Pacific-Asia Conference on Knowledge Discovery and Data Mining; Springer: Berlin/Heidelberg, Germany, 2011; pp. 345–356. [Google Scholar]
- Akbani, R.; Kwek, S.; Japkowicz, N. Applying support vector machines to imbalanced datasets. In European Conference on Machine Learning; Springer: Berlin/Heidelberg, Germany, 2004; pp. 39–50. [Google Scholar]
- Torlay, L.; Perrone-Bertolotti, M.; Thomas, E.; Baciu, M. Machine learning–XGBoost analysis of language networks to classify patients with epilepsy. Brain Inform. 2017, 4, 159–169. [Google Scholar] [CrossRef]
- Ogunleye, A.; Wang, Q.G. XGBoost Model for Chronic Kidney Disease Diagnosis. IEEE/ACM Trans. Comput. Biol. Bioinform. 2020, 17, 2131–2140. [Google Scholar] [CrossRef] [PubMed]
- Ogunleye, A.; Wang, Q.G. Enhanced XGBoost-based automatic diagnosis system for chronic kidney disease. In Proceedings of the 2018 IEEE 14th International Conference on Control and Automation (ICCA), Anchorage, AK, USA, 12–15 June 2018; pp. 805–810. [Google Scholar]
- James, G.; Witten, D.; Hastie, T.; Tibshirani, R. An Introduction to Statistical Learning; Springer: Berlin/Heidelberg, Germany, 2013; Volume 112, p. 181. [Google Scholar]
- Goodfellow, I.; Bengio, Y.; Courville, A. Deep Learning; MIT Press: Cambridge, MA, USA, 2016; Available online: http://www.deeplearningbook.org (accessed on 17 June 2021).
- Géron, A. Hands-On Machine Learning with Scikit-Learn, Keras, and TensorFlow: Concepts, Tools, and Techniques to Build Intelligent Systems; O’Reilly Media: Newton, MA, USA, 2019. [Google Scholar]
- Fawcett, T. An introduction to ROC analysis. ROC Analysis in Pattern Recognition. Pattern Recognit. Lett. 2006, 27, 861–874. [Google Scholar] [CrossRef]


Publisher’s Note: MDPI stays neutral with regard to jurisdictional claims in published maps and institutional affiliations. |
© 2021 by the authors. Licensee MDPI, Basel, Switzerland. This article is an open access article distributed under the terms and conditions of the Creative Commons Attribution (CC BY) license (https://creativecommons.org/licenses/by/4.0/).