
Non-Contact Measurement of Motion Sickness Using Pupillary Rhythms from an Infrared Camera


Abstract
:1. Introduction
2. Materials and Methods
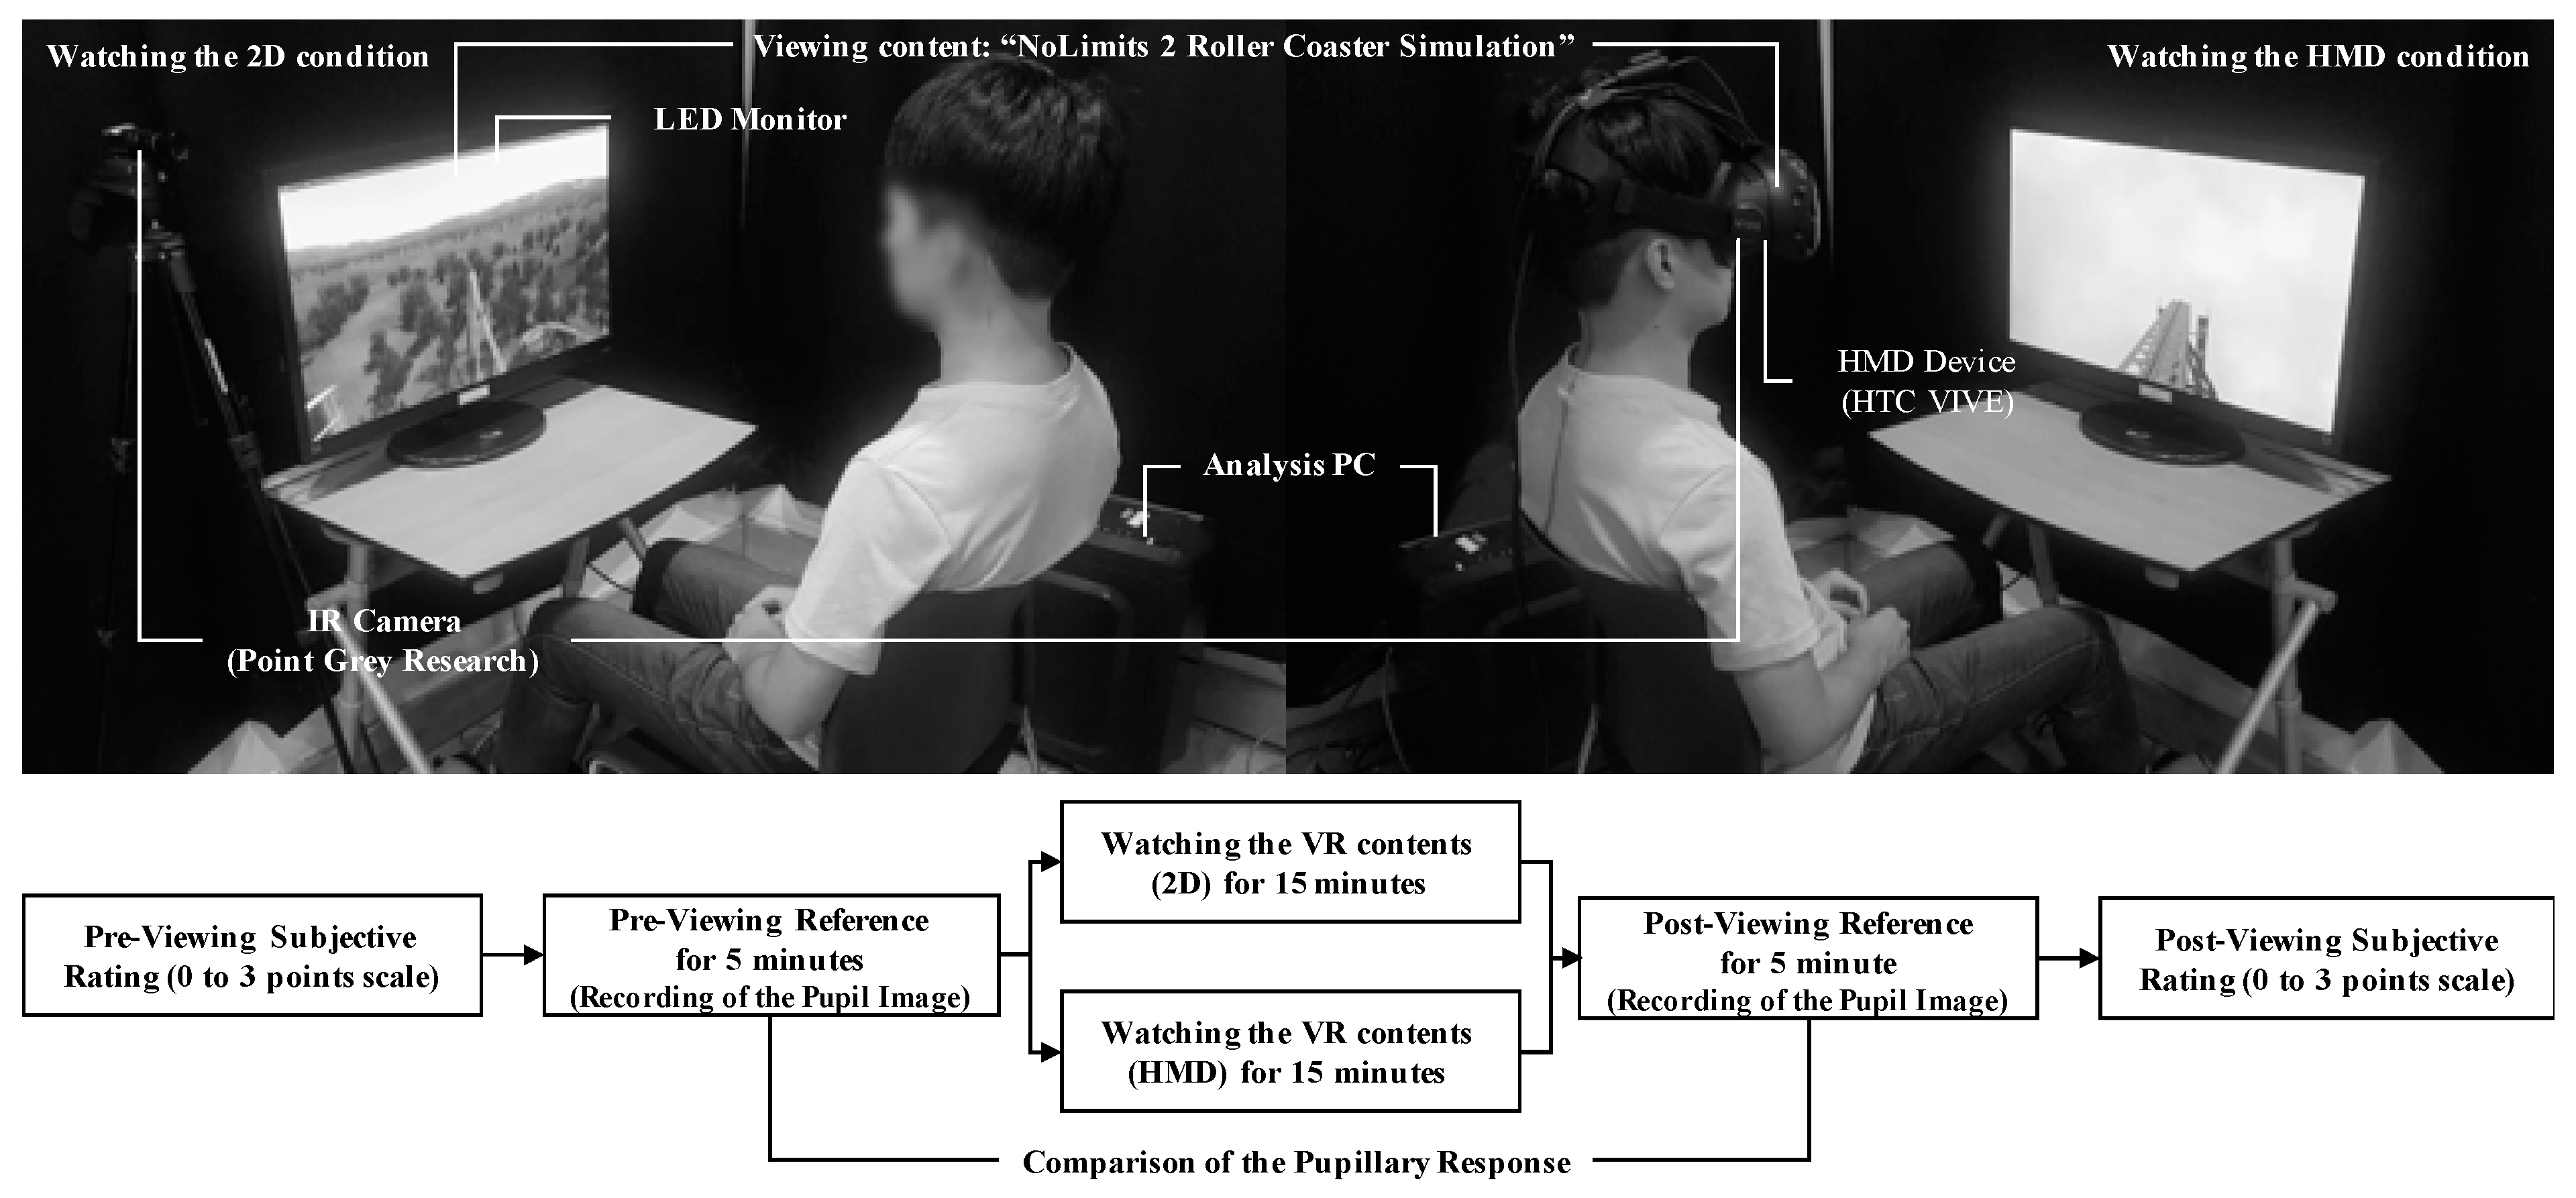
2.1. Experimental Design
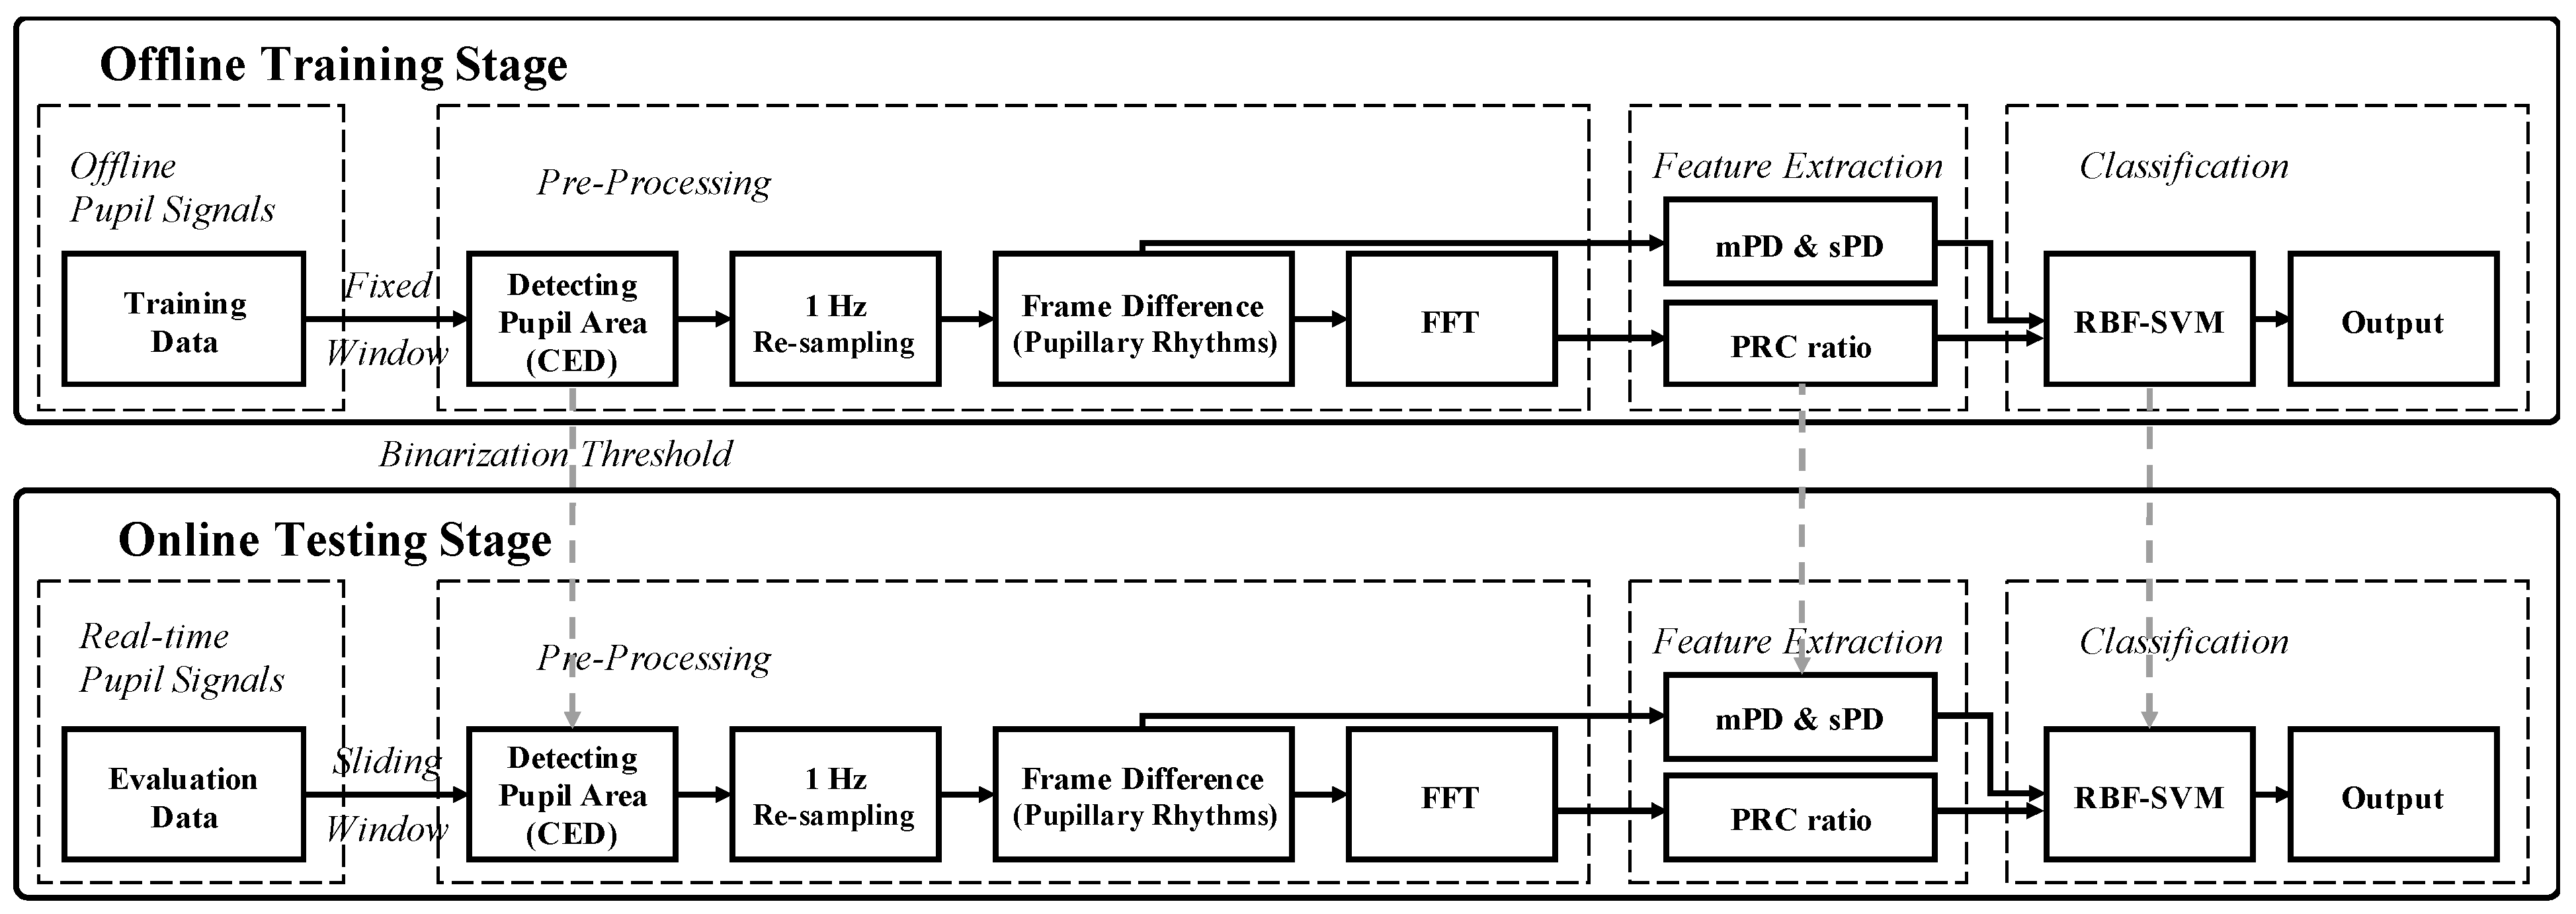
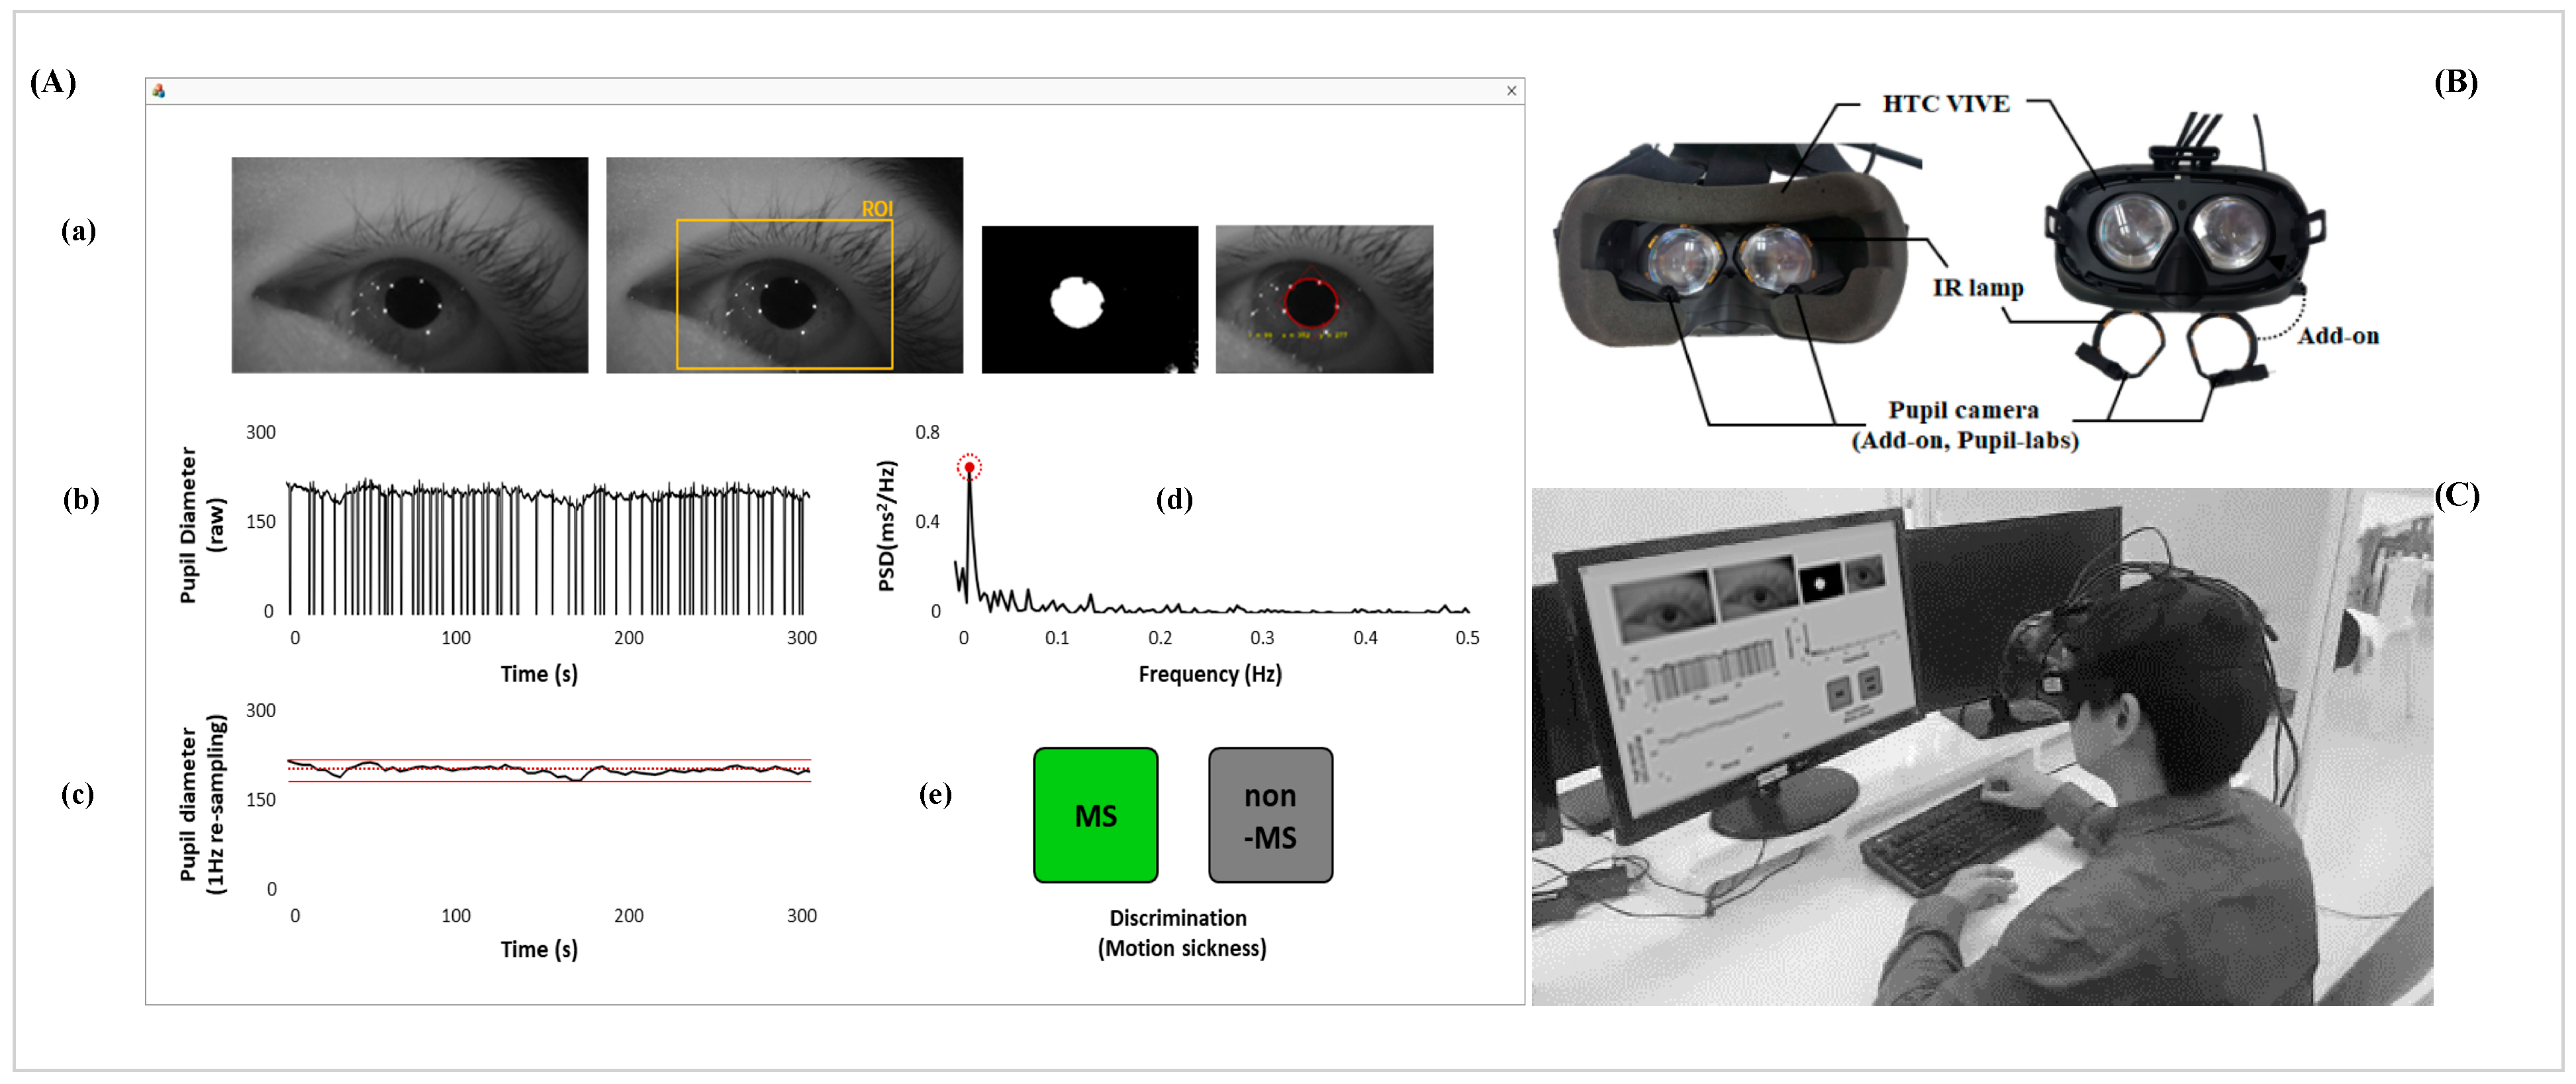
2.2. Data Acquisition and Signal Processing
2.3. Statistical Analysis
2.4. Classification
- Accuracy is used to calculate the proportion of the total number of predictions that are correct.
- Sensitivity is used to measure the proportion of actual positives that are correctly identified.
- Specificity is used to measure the proportion of actual negatives that are correctly identified.
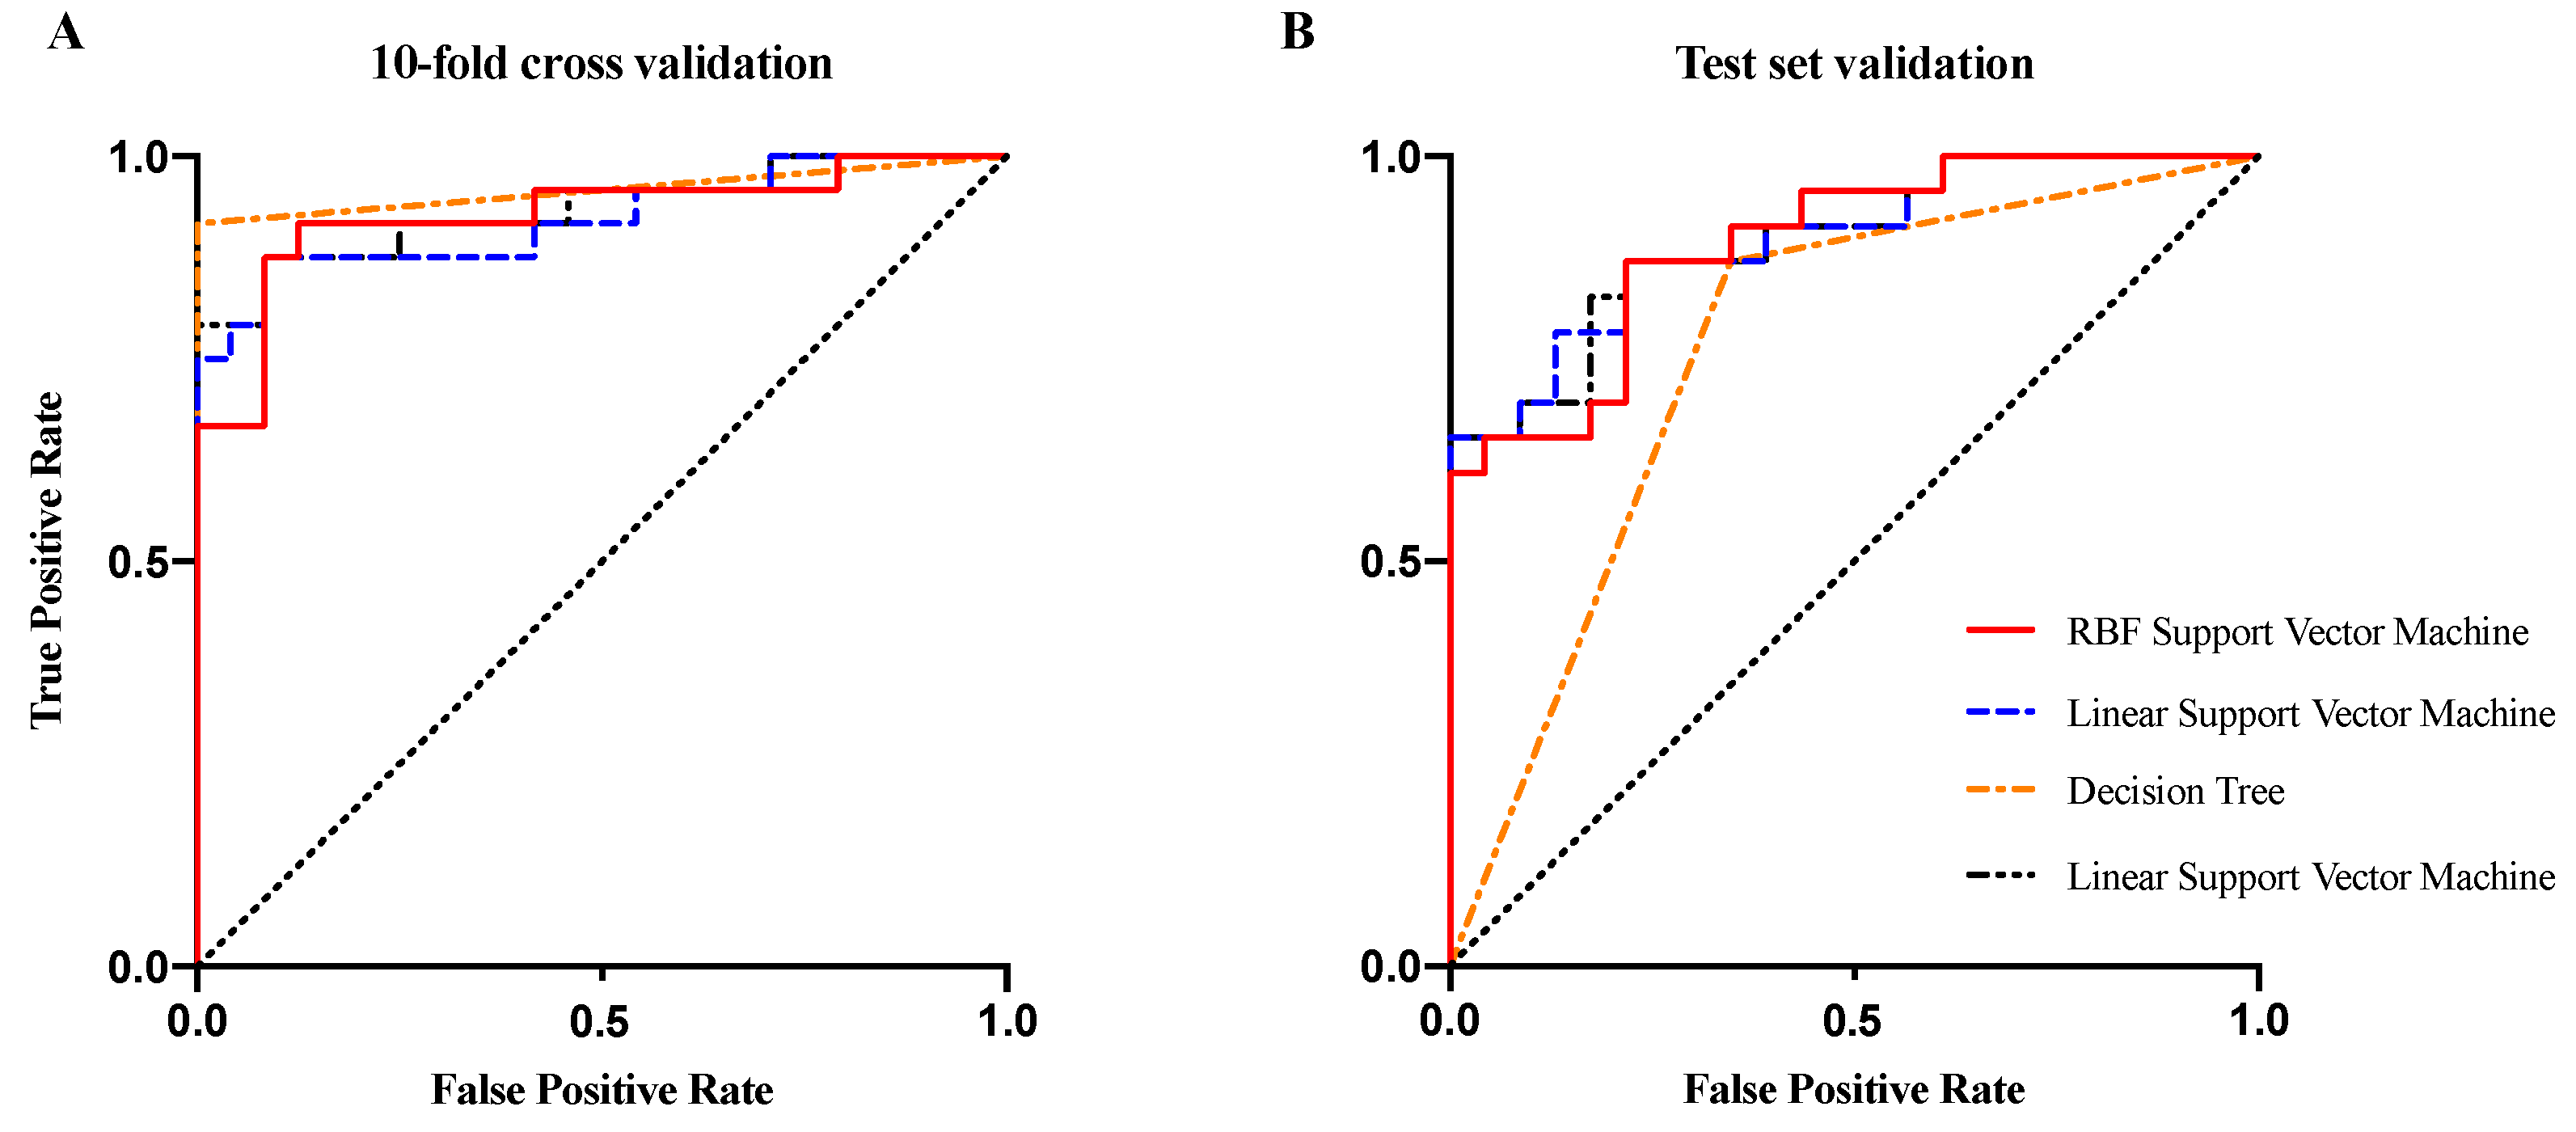
- AUC: area under the receiver operating characteristic curve. The AUC value lies between 0.5 and 1, where 0.5 denotes a bad classifier and 1 denotes an excellent classifier.
3. Result
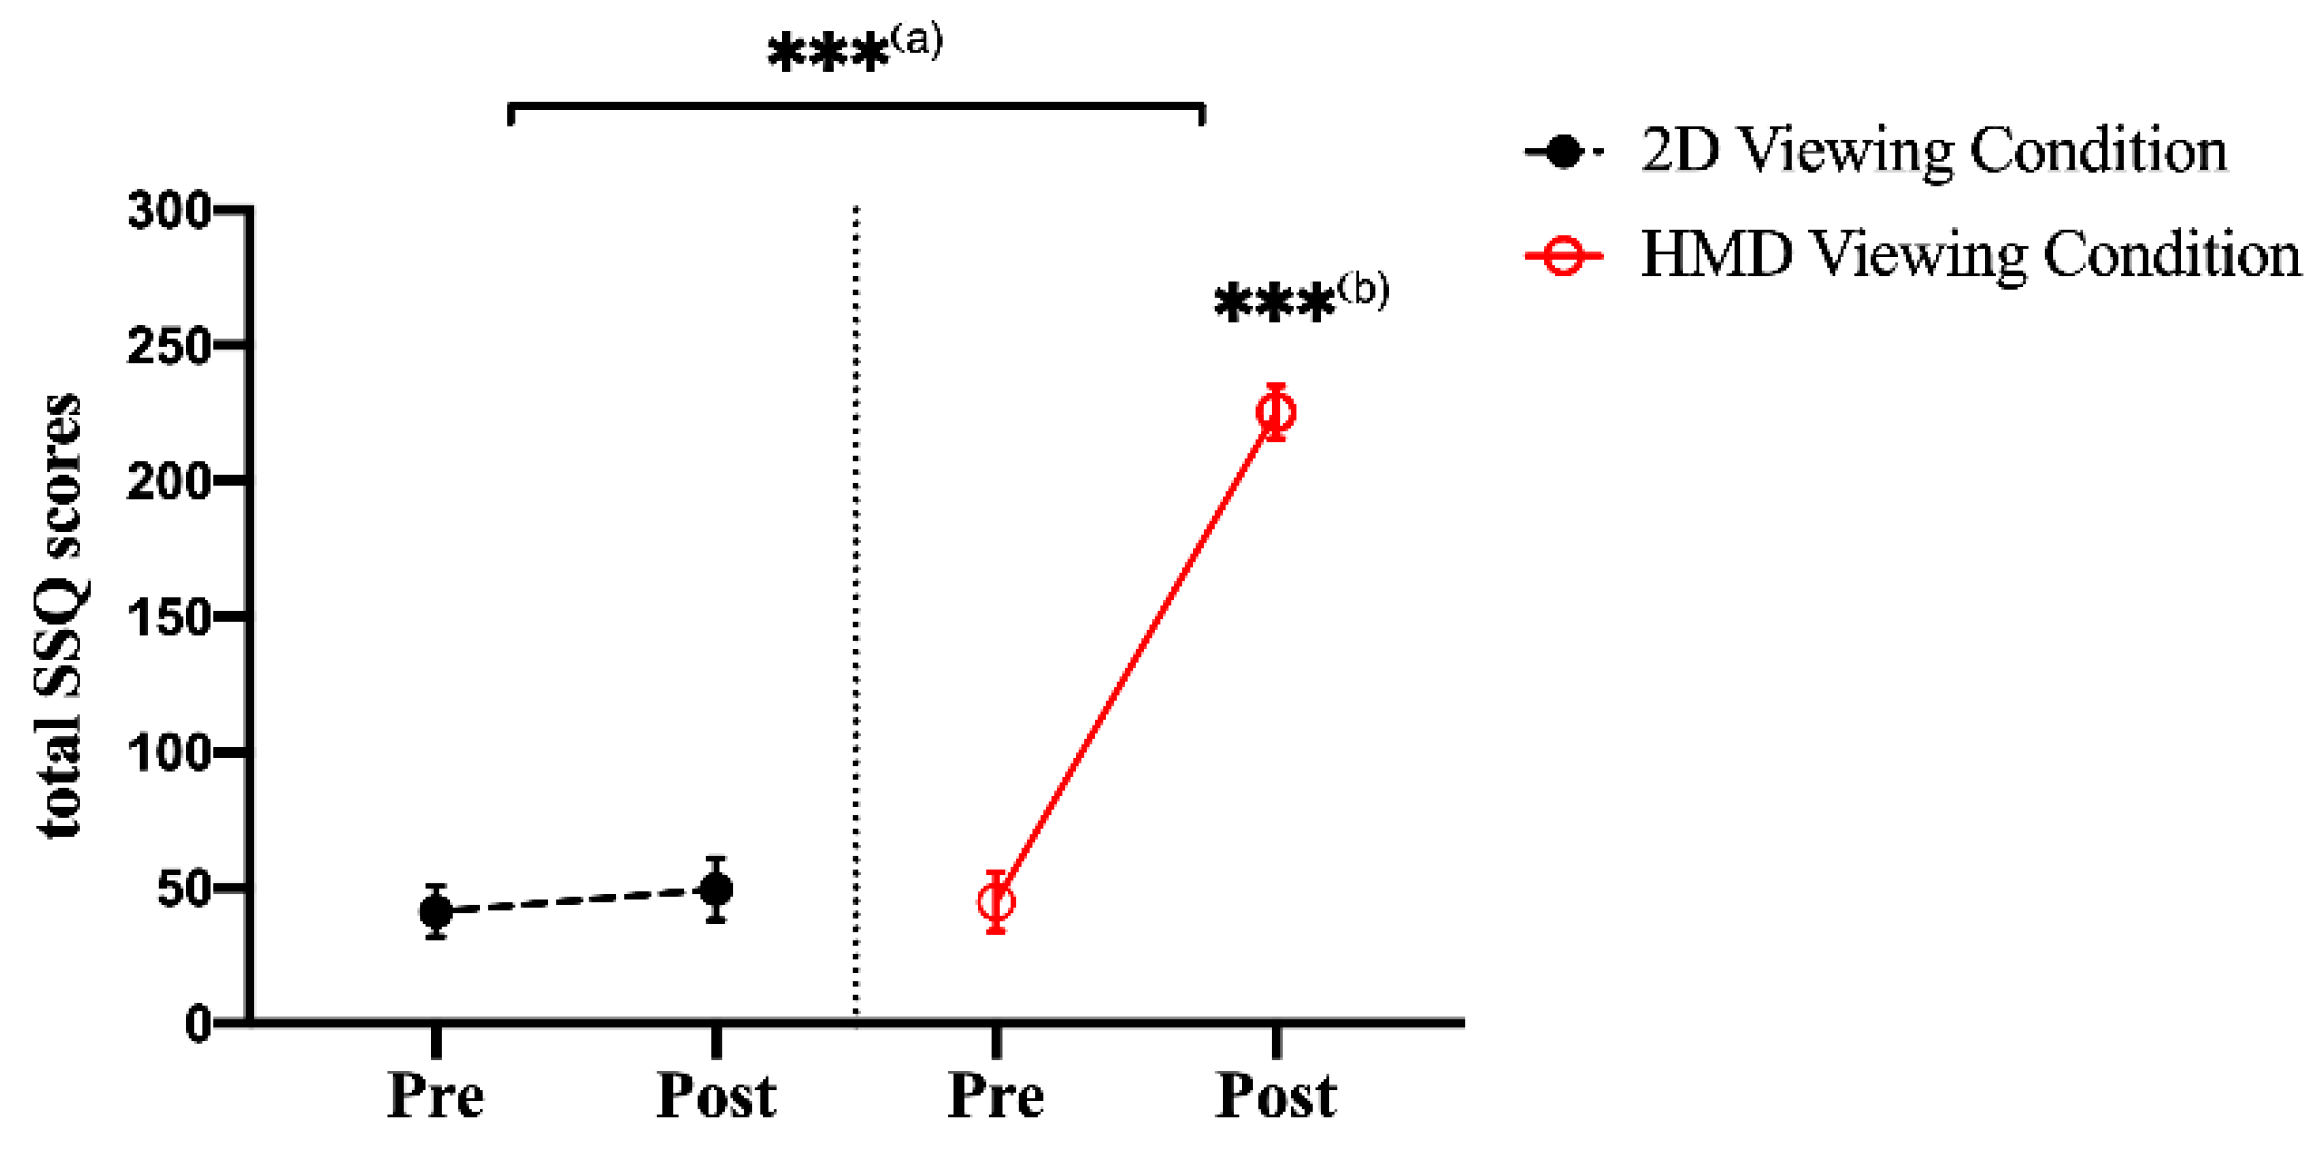
3.1. SSQ Scores
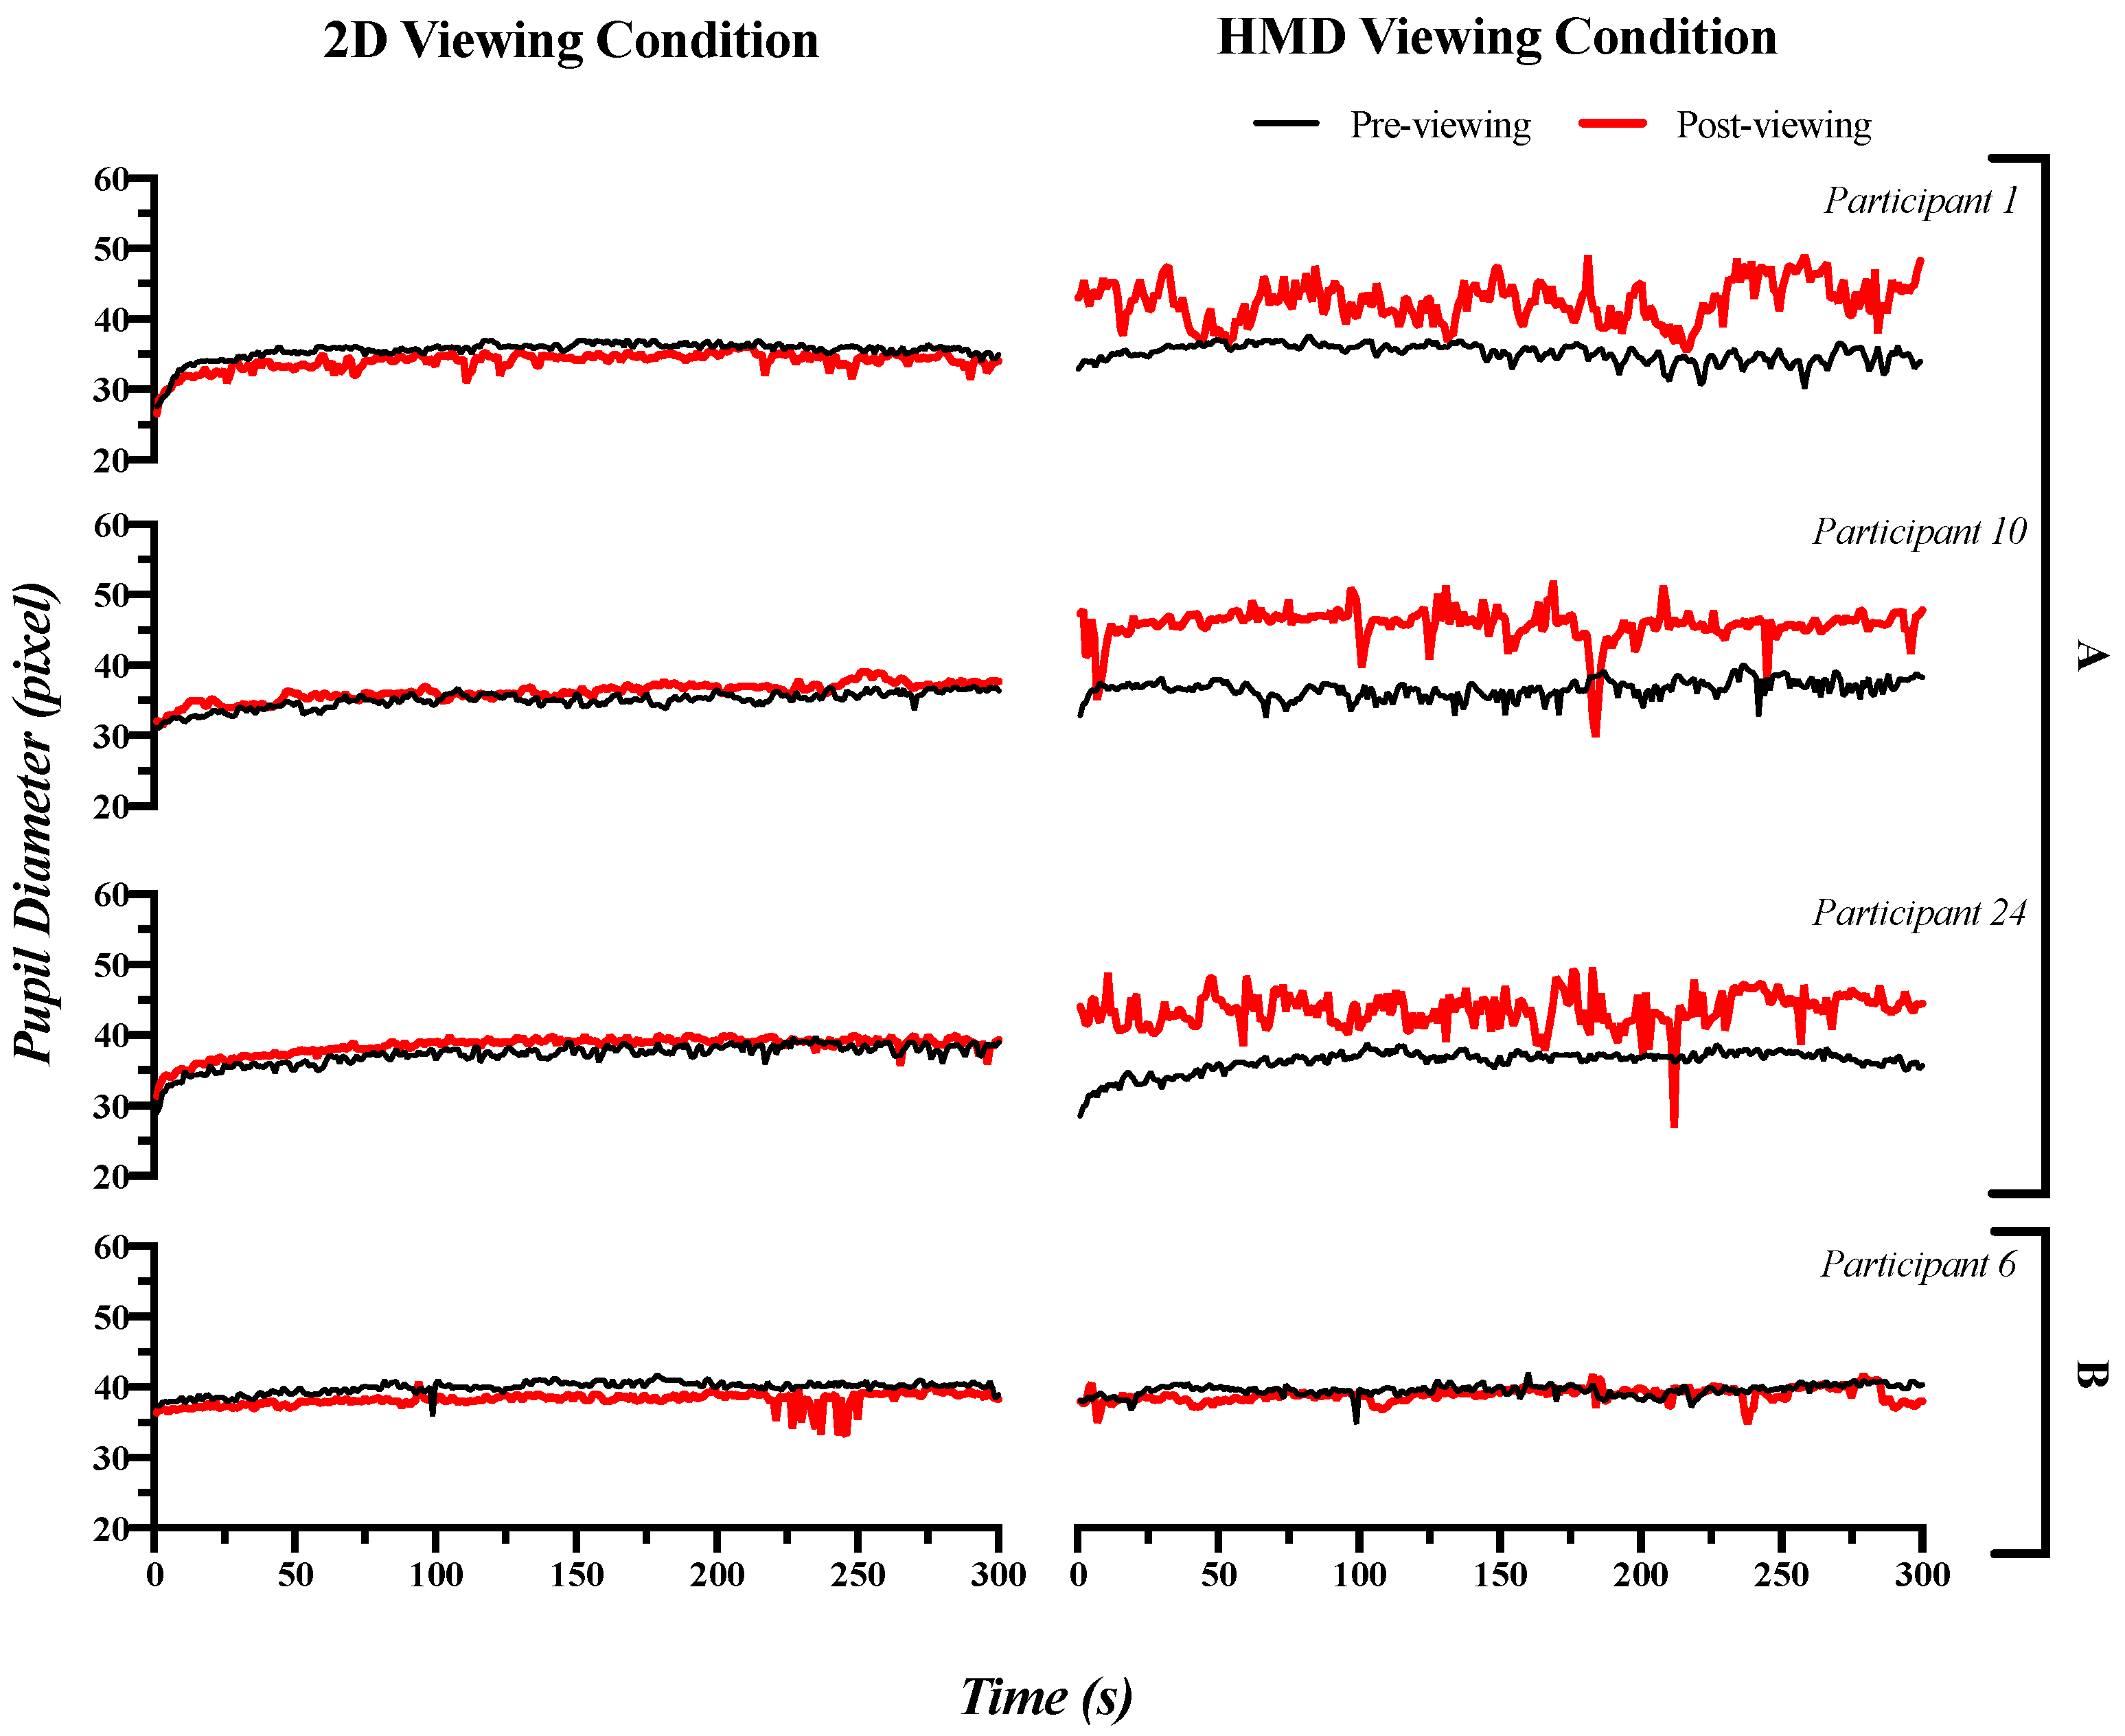
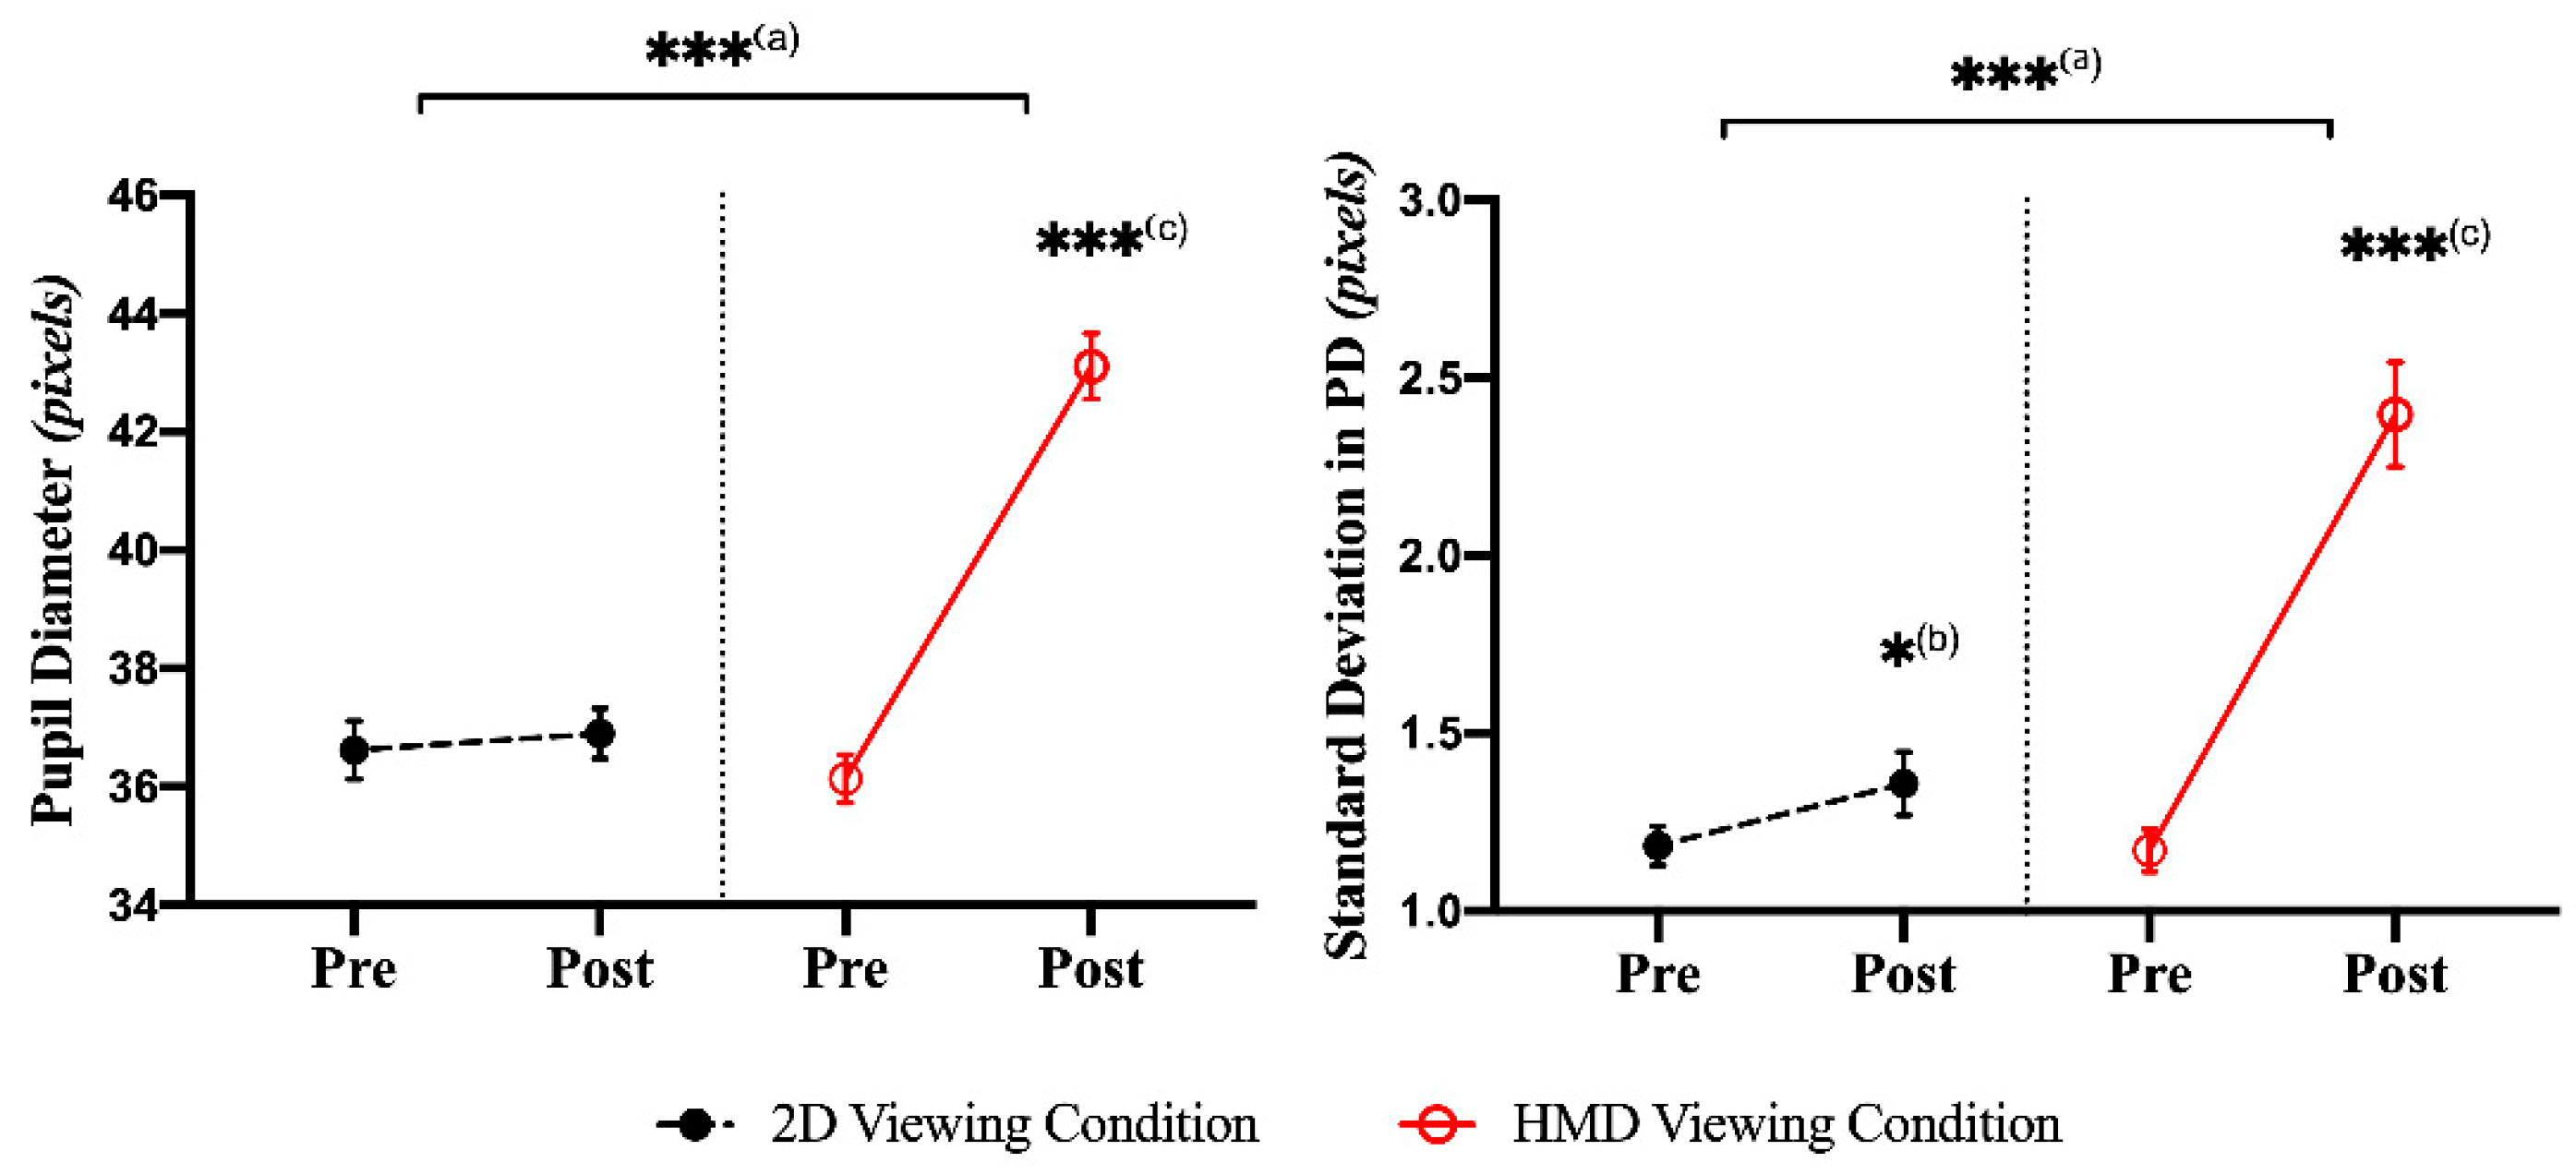
3.2. Pupillary Response: Time Domain Index
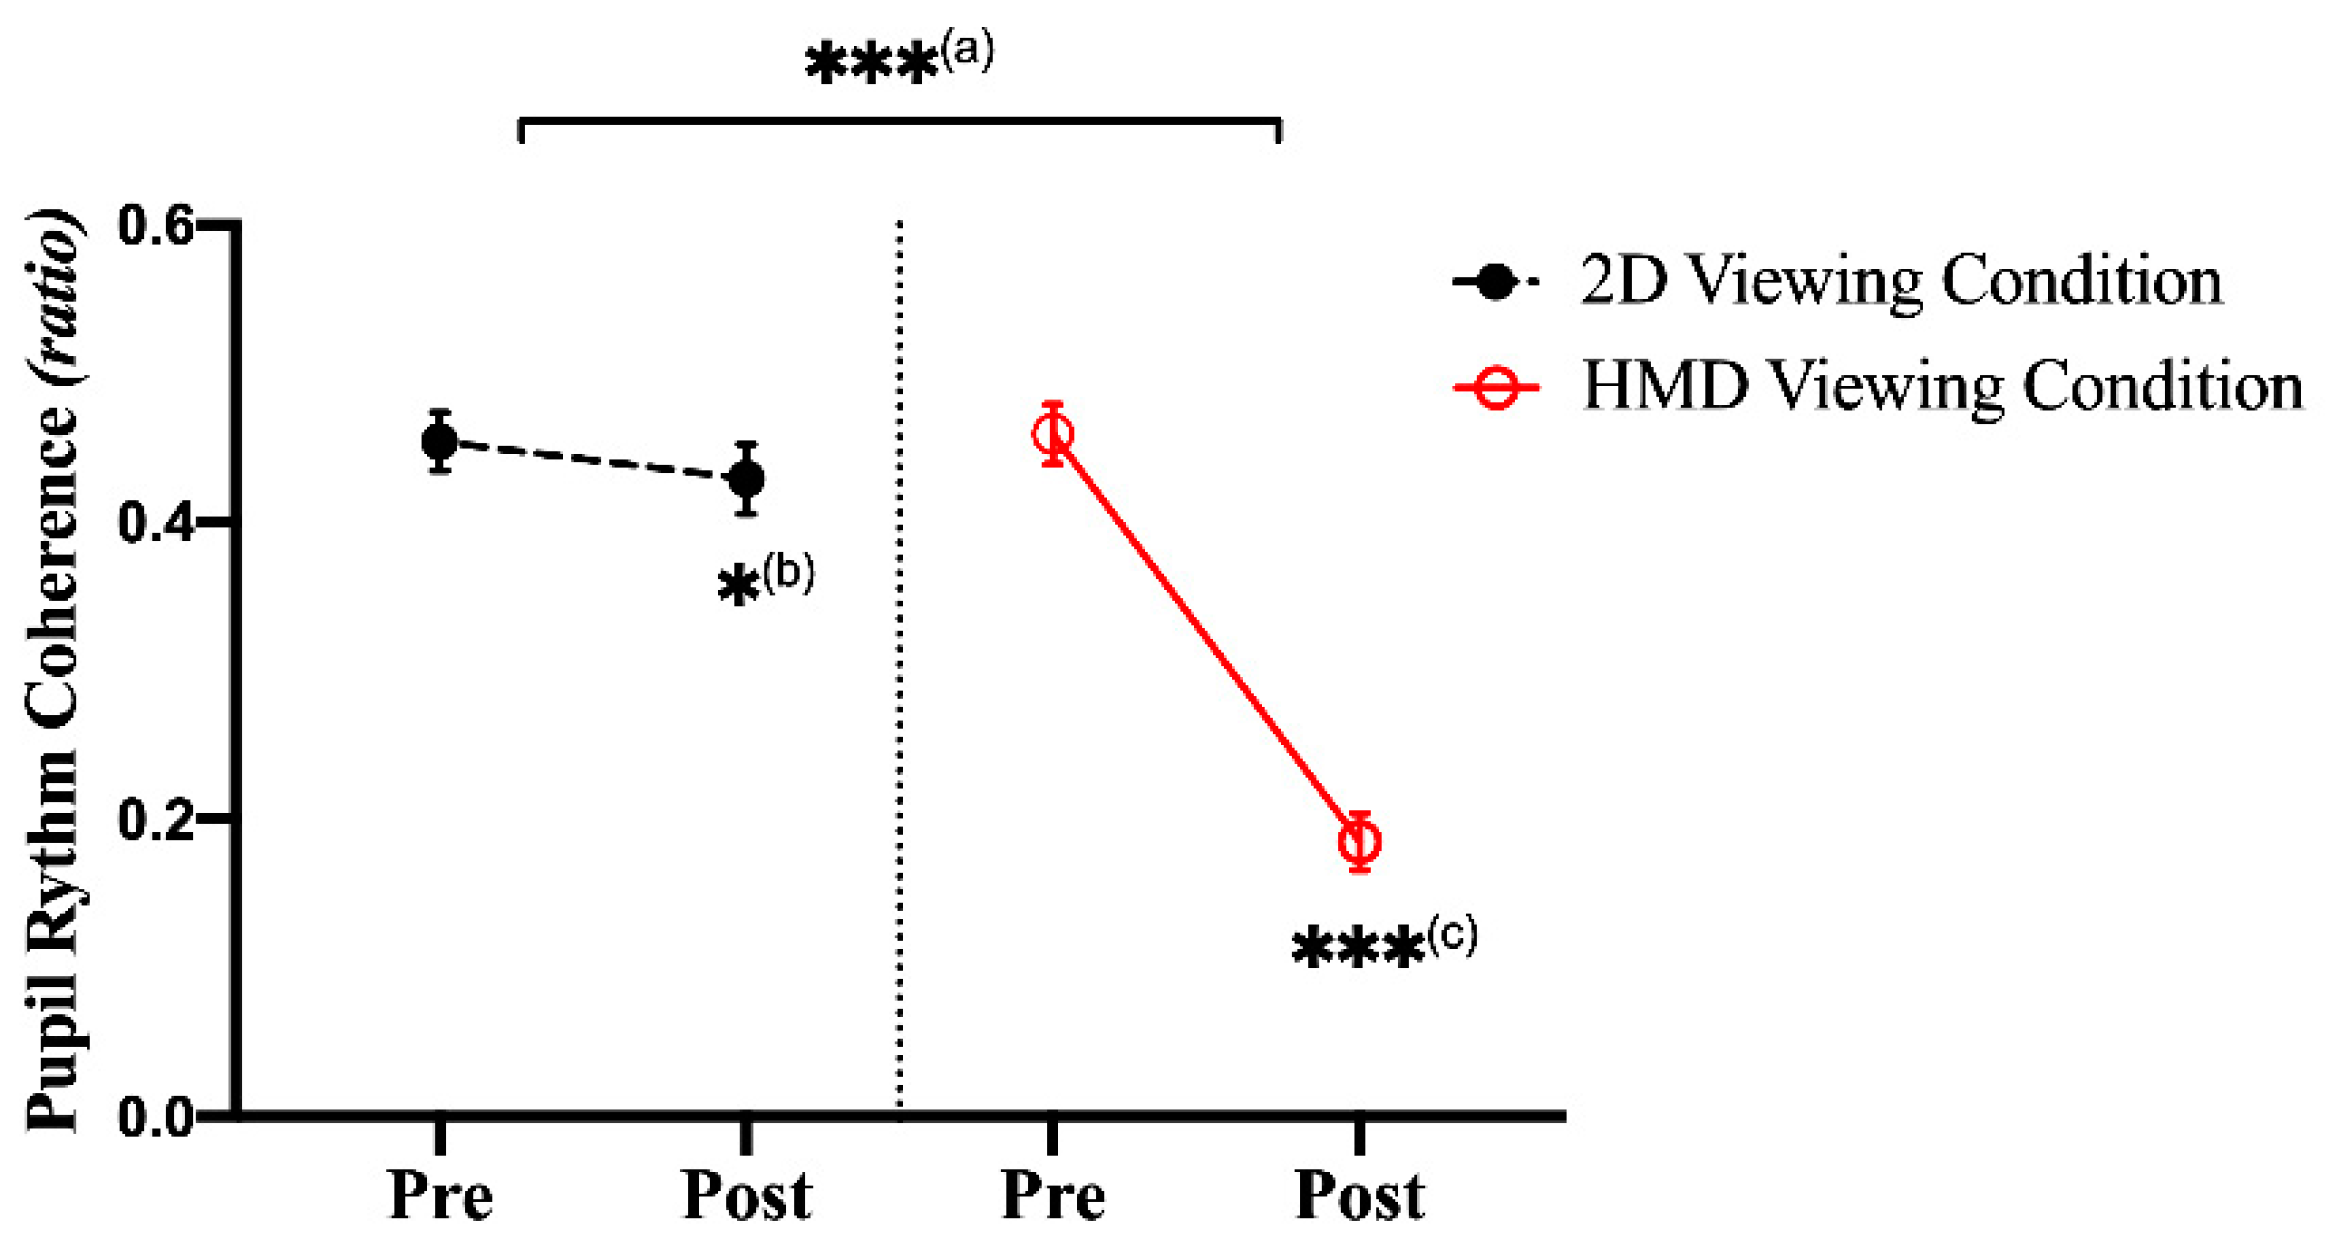
3.3. Pupillary Response: Frequency Domain Index
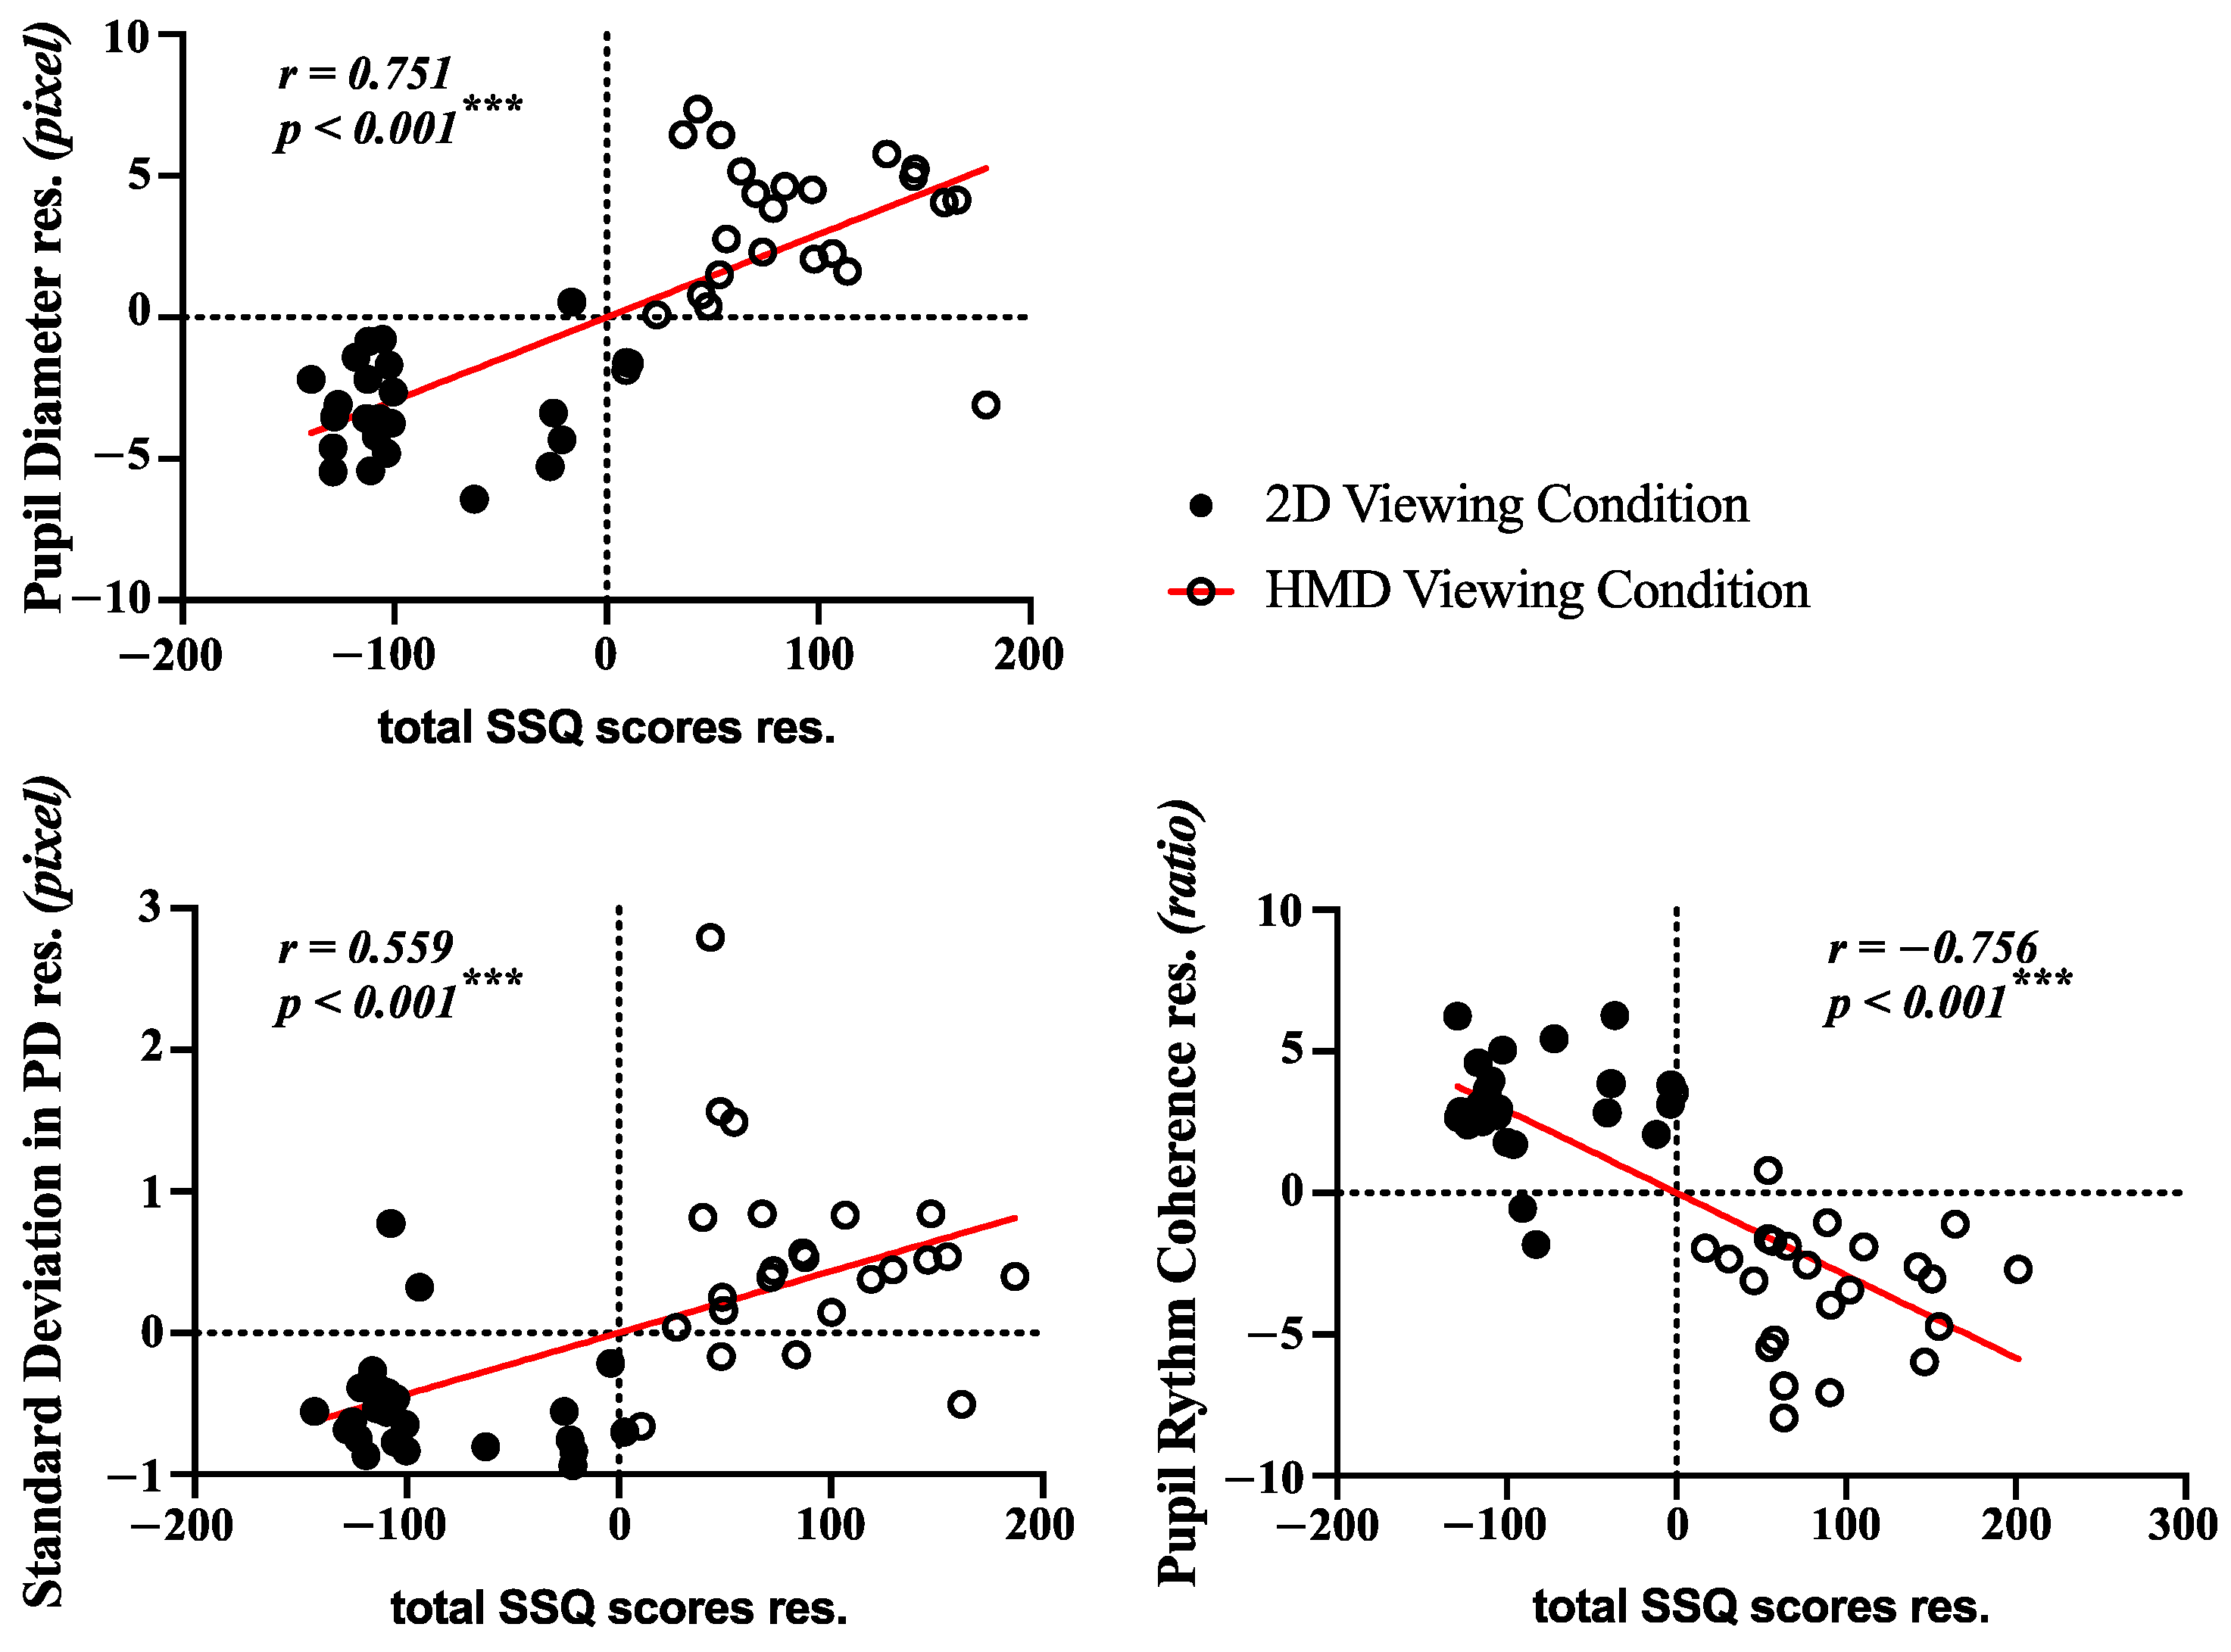
3.4. Correlation Analysis and Classification
3.5. Non-Contact Measurement System of Motion Sickness in Real Time
4. Discussion
5. Conclusions
Author Contributions
Funding
Institutional Review Board Statement
Informed Consent Statement
Conflicts of Interest
Abbreviations
| Abbreviations | Definition |
| HMDs | head-mounted devices |
| VR | virtual reality |
| SSQ | simulator sickness questionnaire |
| MSSQ | motion sickness susceptibility questionnaire |
| ANS | autonomic nervous system |
| HR | heart rate |
| SKT | skin temperature |
| GSR | galvanic skin response |
| RR | respiration |
| BP | blood pressure |
| CNS | central nervous system |
| EEG | electroencephalogram |
| fMRI | function-al magnetic resonance imaging |
| ECG | electrocardiogram |
| PPG | photoplethysmography |
| IR | infrared |
| CED | circular edge detection |
| FFT | fast Fourier transform |
| PRC | pupillary rhythm coherence |
| ANCOVA | analysis of covariance |
| LDA | linear discriminant analysis |
| DT | decision tree |
| SVM | support vector machine |
| RBF-SVM | radial basis function kernel-SVM |
| AUC | area under the curve |
| ROC | receiver operating characteristics |
| HRPs | heart rhythm patterns |
| LE–NC | locus coeruleus–norepinephrine |
| DAN | dorsal attention network |
| LCD | liquid crystal display |
| EOG | electrooculography |
| COP | center of pressure in force plate |
| PCA | principal component analysis |
| SONFIN | self-organizing neural fuzzy inference network |
Appendix A

| Participants | Mean of Pupil Diameter (mPD) | Standard Deviation of Pupil Diameter (SPD) | Pupillary Rhythm Coherence Ratio (PRC Ratio) | |||||||||
|---|---|---|---|---|---|---|---|---|---|---|---|---|
| 2D | HMD | 2D | HMD | 2D | HMD | |||||||
| Pre | Post | Pre | Post | Pre | Post | Pre | Post | Pre | Post | Pre | Post | |
| P1 | 35.556 | 34.004 | 35.168 | 42.522 | 1.276 | 1.264 | 1.276 | 2.889 | 0.530 | 0.556 | 0.595 | 0.092 |
| P2 | 37.222 | 38.200 | 36.483 | 45.101 | 1.337 | 1.440 | 1.172 | 2.353 | 0.288 | 0.309 | 0.295 | 0.177 |
| P3 | 37.910 | 35.546 | 35.984 | 46.919 | 0.766 | 0.815 | 1.011 | 2.735 | 0.504 | 0.578 | 0.483 | 0.220 |
| P4 | 35.219 | 34.681 | 33.051 | 43.558 | 1.385 | 1.164 | 1.346 | 2.495 | 0.471 | 0.519 | 0.472 | 0.275 |
| P5 | 36.593 | 36.259 | 35.295 | 46.890 | 1.228 | 1.321 | 1.266 | 4.679 | 0.308 | 0.298 | 0.381 | 0.203 |
| P6 | 39.902 | 38.200 | 39.543 | 38.899 | 0.854 | 1.034 | 0.798 | 1.002 | 0.505 | 0.481 | 0.505 | 0.476 |
| P7 | 35.779 | 34.193 | 34.413 | 41.298 | 1.133 | 1.247 | 1.235 | 2.006 | 0.526 | 0.531 | 0.561 | 0.207 |
| P8 | 38.209 | 39.079 | 37.762 | 45.238 | 1.069 | 0.950 | 0.909 | 2.555 | 0.396 | 0.375 | 0.348 | 0.061 |
| P9 | 35.034 | 36.221 | 36.716 | 45.841 | 1.157 | 1.263 | 1.308 | 2.385 | 0.391 | 0.379 | 0.361 | 0.151 |
| P10 | 34.853 | 34.872 | 35.465 | 44.885 | 0.968 | 1.001 | 1.046 | 2.649 | 0.467 | 0.429 | 0.473 | 0.043 |
| P11 | 32.706 | 38.702 | 32.450 | 40.274 | 1.265 | 2.817 | 1.326 | 2.329 | 0.294 | 0.189 | 0.305 | 0.142 |
| P12 | 36.480 | 36.091 | 37.137 | 41.481 | 1.374 | 1.469 | 1.399 | 3.503 | 0.535 | 0.510 | 0.525 | 0.223 |
| P13 | 40.176 | 38.140 | 40.469 | 43.943 | 0.903 | 1.089 | 0.906 | 3.237 | 0.407 | 0.384 | 0.414 | 0.315 |
| P14 | 34.963 | 35.202 | 34.057 | 45.615 | 1.619 | 1.675 | 1.641 | 2.229 | 0.461 | 0.421 | 0.465 | 0.106 |
| P15 | 39.275 | 38.859 | 37.092 | 45.010 | 1.657 | 1.799 | 1.855 | 2.130 | 0.399 | 0.350 | 0.387 | 0.128 |
| P16 | 36.857 | 36.437 | 35.127 | 41.716 | 0.733 | 0.789 | 0.501 | 2.015 | 0.431 | 0.413 | 0.455 | 0.207 |
| P17 | 35.758 | 37.403 | 35.374 | 40.396 | 1.051 | 1.339 | 1.062 | 1.987 | 0.504 | 0.461 | 0.505 | 0.247 |
| P18 | 40.505 | 39.580 | 38.098 | 44.726 | 1.523 | 1.844 | 1.246 | 2.493 | 0.505 | 0.485 | 0.499 | 0.206 |
| P19 | 39.858 | 41.734 | 38.038 | 44.355 | 1.368 | 1.468 | 1.211 | 1.336 | 0.613 | 0.502 | 0.614 | 0.156 |
| P20 | 32.395 | 33.270 | 34.293 | 40.858 | 1.148 | 1.437 | 1.073 | 2.162 | 0.525 | 0.596 | 0.527 | 0.271 |
| P21 | 33.973 | 38.319 | 34.214 | 36.064 | 0.743 | 1.927 | 0.941 | 2.104 | 0.297 | 0.151 | 0.296 | 0.115 |
| P22 | 39.456 | 36.281 | 39.079 | 44.876 | 0.995 | 0.979 | 0.764 | 2.055 | 0.580 | 0.531 | 0.564 | 0.149 |
| P23 | 33.016 | 35.834 | 35.664 | 40.332 | 1.280 | 1.120 | 1.215 | 1.758 | 0.384 | 0.348 | 0.381 | 0.196 |
| P24 | 37.219 | 38.467 | 36.342 | 43.620 | 1.549 | 1.332 | 1.564 | 2.417 | 0.579 | 0.500 | 0.605 | 0.072 |
| Avg. | 36.621 | 36.899 | 36.138 | 43.101 | 1.183 | 1.357 | 1.170 | 2.396 | 0.454 | 0.429 | 0.459 | 0.185 |
| SD | 2.373 | 2.020 | 1.968 | 2.662 | 0.266 | 0.427 | 0.289 | 0.704 | 0.093 | 0.113 | 0.096 | 0.092 |
| SE | 0.484 | 0.412 | 0.402 | 0.543 | 0.054 | 0.087 | 0.059 | 0.144 | 0.019 | 0.023 | 0.020 | 0.019 |
| Participants | Mean of Pupil Diameter (mPD) | Standard Deviation of Pupil Diameter (SPD) | Pupillary Rhythm Coherence Ratio (PRC Ratio) | |||||||||
|---|---|---|---|---|---|---|---|---|---|---|---|---|
| 2D | HMD | 2D | HMD | 2D | HMD | |||||||
| Pre | Post | Pre | Post | Pre | Post | Pre | POST | Pre | Post | Pre | Post | |
| P1 | 33.241 | 34.062 | 34.142 | 39.643 | 1.144 | 1.126 | 1.212 | 1.872 | 0.512 | 0.506 | 0.492 | 0.212 |
| P2 | 35.112 | 35.463 | 35.412 | 38.461 | 1.241 | 1.316 | 1.301 | 1.442 | 0.442 | 0.412 | 0.516 | 0.336 |
| P3 | 34.024 | 38.127 | 34.781 | 37.034 | 0.972 | 1.107 | 1.042 | 1.136 | 0.372 | 0.320 | 0.416 | 0.310 |
| P4 | 39.142 | 40.032 | 38.162 | 40.372 | 0.892 | 1.142 | 0.982 | 1.047 | 0.518 | 0.242 | 0.502 | 0.464 |
| P5 | 34.117 | 35.012 | 35.172 | 42.174 | 1.112 | 1.146 | 1.047 | 1.562 | 0.482 | 0.446 | 0.572 | 0.312 |
| P6 | 36.117 | 36.042 | 36.047 | 41.174 | 1.412 | 1.406 | 1.362 | 1.745 | 0.502 | 0.460 | 0.482 | 0.141 |
| P7 | 33.192 | 35.174 | 34.562 | 35.149 | 0.872 | 1.121 | 0.946 | 1.088 | 0.432 | 0.116 | 0.502 | 0.420 |
| P8 | 35.002 | 35.176 | 35.722 | 39.874 | 0.972 | 1.002 | 1.042 | 1.392 | 0.616 | 0.548 | 0.582 | 0.333 |
| P9 | 38.162 | 38.472 | 37.663 | 42.164 | 1.212 | 1.244 | 1.198 | 1.562 | 0.441 | 0.402 | 0.482 | 0.206 |
| P10 | 33.205 | 37.624 | 34.182 | 38.114 | 1.107 | 1.192 | 0.982 | 1.399 | 0.482 | 0.441 | 0.522 | 0.304 |
| P11 | 36.104 | 38.142 | 35.066 | 42.179 | 1.206 | 1.227 | 1.117 | 1.824 | 0.642 | 0.612 | 0.663 | 0.318 |
| P12 | 34.112 | 34.922 | 35.016 | 40.327 | 1.466 | 1.432 | 1.372 | 1.590 | 0.381 | 0.388 | 0.415 | 0.224 |
| P13 | 33.004 | 35.132 | 34.142 | 36.832 | 1.112 | 1.414 | 1.032 | 1.201 | 0.382 | 0.282 | 0.444 | 0.389 |
| P14 | 37.109 | 40.442 | 36.492 | 39.032 | 1.142 | 1.166 | 1.002 | 1.312 | 0.446 | 0.412 | 0.496 | 0.182 |
| P15 | 35.198 | 35.642 | 34.824 | 40.006 | 0.982 | 1.001 | 1.004 | 1.414 | 0.382 | 0.396 | 0.412 | 0.264 |
| P16 | 36.121 | 36.897 | 35.002 | 39.446 | 0.876 | 0.924 | 0.882 | 1.221 | 0.702 | 0.664 | 0.641 | 0.344 |
| P17 | 34.102 | 35.116 | 34.442 | 38.806 | 1.116 | 1.202 | 1.241 | 1.493 | 0.442 | 0.476 | 0.492 | 0.218 |
| P18 | 38.166 | 38.442 | 38.264 | 44.162 | 0.882 | 0.896 | 0.942 | 1.411 | 0.392 | 0.364 | 0.382 | 0.164 |
| P19 | 32.172 | 36.442 | 33.008 | 36.172 | 0.924 | 1.232 | 1.015 | 1.128 | 0.442 | 0.206 | 0.446 | 0.312 |
| P20 | 36.045 | 38.323 | 35.414 | 37.032 | 1.142 | 1.362 | 1.624 | 1.832 | 0.366 | 0.227 | 0.516 | 0.412 |
| P21 | 37.122 | 37.462 | 36.882 | 42.187 | 1.112 | 1.146 | 0.986 | 1.387 | 0.392 | 0.402 | 0.422 | 0.232 |
| P22 | 34.562 | 35.032 | 35.003 | 39.556 | 0.941 | 1.002 | 1.065 | 1.475 | 0.485 | 0.444 | 0.396 | 0.246 |
| P23 | 38.022 | 38.146 | 37.068 | 42.323 | 0.877 | 0.902 | 0.911 | 1.302 | 0.396 | 0.442 | 0.472 | 0.231 |
| Avg. | 35.354 | 36.753 | 35.499 | 39.662 | 1.075 | 1.161 | 1.100 | 1.428 | 0.463 | 0.400 | 0.490 | 0.286 |
| SD | 1.892 | 1.745 | 1.331 | 2.240 | 0.163 | 0.156 | 0.176 | 0.233 | 0.087 | 0.125 | 0.071 | 0.084 |
| SE | 0.386 | 0.356 | 0.272 | 0.457 | 0.033 | 0.032 | 0.036 | 0.048 | 0.018 | 0.026 | 0.015 | 0.017 |
Appendix B. (Example of Simulator Sickness Questionnaire, Kennedy et al., 1993)
| 1. General discomfort | None□ | Slight□ | Moderate□ | Severe□ |
| 2. Fatigue | None□ | Slight□ | Moderate□ | Severe□ |
| 3. Headache | None□ | Slight□ | Moderate□ | Severe□ |
| 4. Eyestrain | None□ | Slight□ | Moderate□ | Severe□ |
| 5. Difficulty focusing | None□ | Slight□ | Moderate□ | Severe□ |
| 6. Increased salivation | None□ | Slight□ | Moderate□ | Severe□ |
| 7. Sweating | None□ | Slight□ | Moderate□ | Severe□ |
| 8. Nausea | None□ | Slight□ | Moderate□ | Severe□ |
| 9. Difficulty concentrating | None□ | Slight□ | Moderate□ | Severe□ |
| 10. Fullness of Head | None□ | Slight□ | Moderate□ | Severe□ |
| 11. Blurred vision | None□ | Slight□ | Moderate□ | Severe□ |
| 12. Dizziness with eye open | None□ | Slight□ | Moderate□ | Severe□ |
| 13. Dizziness with eye closed | None□ | Slight□ | Moderate□ | Severe□ |
| 14. Vertigo | None□ | Slight□ | Moderate□ | Severe□ |
| 15. Stomach awareness | None□ | Slight□ | Moderate□ | Severe□ |
| 16. Burping | None□ | Slight□ | Moderate□ | Severe□ |
| Original version: Kennedy, R.S.; Lane, N.E.; Berbaum, K.S.; Lilienthal, M.G. Simulator sickness questionnaire: An enhanced method for quantifying simulator sickness. Int. J. Aviat. Psychol. 1993, 3, 203–220. | ||||
References
- Pan, Z.; Cheok, A.D.; Yang, H.; Zhu, J.; Shi, J. Virtual reality and mixed reality for virtual learning environments. Comput. Graph. 2006, 30, 20–28. [Google Scholar] [CrossRef]
- Nee, A.; Ong, S.K. Virtual and Augmented Reality Applications in Manufacturing; Springer Science & Business Media: Berlin/Heidelberg, Germany, 2013. [Google Scholar]
- Kesim, M.; Ozarslan, Y. Augmented Reality in Education: Current Technologies and the Potential for Education. Procedia Soc. Behav. Sci. 2012, 47, 297–302. [Google Scholar] [CrossRef] [Green Version]
- Riva, G. Virtual reality: An experiential tool for clinical psychology. Br. J. Guid. Couns. 2009, 37, 337–345. [Google Scholar] [CrossRef]
- Raajan, N.; Suganya, S.; Priya, M.; Ramanan, S.V.; Janani, S.; Nandini, N.S.; Hemanand, R.; Gayathri, S. Augmented Reality Based Virtual Reality. Procedia Eng. 2012, 38, 1559–1565. [Google Scholar] [CrossRef] [Green Version]
- Kim, C.J.; Park, S.; Won, M.J.; Whang, M.; Lee, E.C. Autonomic Nervous System Responses Can Reveal Visual Fatigue Induced by 3D Displays. Sensors 2013, 13, 13054–13062. [Google Scholar] [CrossRef] [PubMed]
- Kim, M.; Jeon, C.; Kim, J. A Study on Immersion and Presence of a Portable Hand Haptic System for Immersive Virtual Reality. Sensors 2017, 17, 1141. [Google Scholar] [CrossRef] [Green Version]
- Kennedy, R.S.; Drexler, J. Research in visually induced motion sickness. Appl. Ergon. 2010, 41, 494–503. [Google Scholar] [CrossRef] [PubMed]
- Van Krevelen, D.; Poelman, R. A Survey of Augmented Reality Technologies, Applications and Limitations. Int. J. Virtual Real. 2010, 9, 1–20. [Google Scholar] [CrossRef] [Green Version]
- Naqvi, S.A.A.; Badruddin, N.; Malik, A.; Hazabbah, W.; Abdullah, B. Does 3D produce more symptoms of visually induced motion sickness? In Proceedings of the 2013 35th Annual International Conference of the IEEE Engineering in Medicine and Biology Society (EMBC), Osaka, Japan, 3–7 July 2013; pp. 6405–6408. [Google Scholar]
- Rebenitsch, L.; Owen, C.B. Review on cybersickness in applications and visual displays. Virtual Real. 2016, 20, 101–125. [Google Scholar] [CrossRef]
- Clifton, J.; Palmisano, S. Effects of steering locomotion and teleporting on cybersickness and presence in HMD-based virtual reality. Virtual Real. 2020, 24, 453–468. [Google Scholar] [CrossRef]
- Sharples, S.; Cobb, S.; Moody, A.; Wilson, J.R. Virtual reality induced symptoms and effects (VRISE): Comparison of head mounted display (HMD), desktop and projection display systems. Displays 2008, 29, 58–69. [Google Scholar] [CrossRef]
- Lambooij, M.M.; Ijsselsteijn, W.W.; Fortuin, M.M.; Heynderickx, I.I. Visual Discomfort and Visual Fatigue of Stereoscopic Displays: A Review. J. Imaging Sci. Technol. 2009, 53. [Google Scholar] [CrossRef] [Green Version]
- Bouchard, S.; Robillard, G.; Renaud, P.; Bernier, F. Exploring new dimensions in the assessment of virtual reality induced side effects. J. Comput. Inf. Technol. 2011, 1, 20–32. [Google Scholar]
- Carnegie, K.; Rhee, T. Reducing Visual Discomfort with HMDs Using Dynamic Depth of Field. IEEE Eng. Med. Boil. Mag. 2015, 35, 34–41. [Google Scholar] [CrossRef] [PubMed]
- Kennedy, R.S.; Lane, N.E.; Berbaum, K.; Lilienthal, M.G. Simulator Sickness Questionnaire: An Enhanced Method for Quantifying Simulator Sickness. Int. J. Aviat. Psychol. 1993, 3, 203–220. [Google Scholar] [CrossRef]
- Lee, E.C.; Heo, H.; Park, K.R. The comparative measurements of eyestrain caused by 2D and 3D displays. IEEE Trans. Consum. Electron. 2010, 56, 1677–1683. [Google Scholar] [CrossRef]
- Park, S.; Won, M.; Mun, S.; Lee, E.; Whang, M. Does visual fatigue from 3D displays affect autonomic regulation and heart rhythm? Int. J. Psychophysiol. 2014, 92, 42–48. [Google Scholar] [CrossRef] [PubMed]
- Park, S.; Won, M.J.; Lee, E.C.; Mun, S.; Park, M.-C.; Whang, M. Evaluation of 3D cognitive fatigue using heart–brain synchronization. Int. J. Psychophysiol. 2015, 97, 120–130. [Google Scholar] [CrossRef] [PubMed]
- Yokota, Y.; Aoki, M.; Mizuta, K.; Ito, Y.; Isu, N. Motion sickness susceptibility associated with visually induced postural instability and cardiac autonomic responses in healthy subjects. Acta Otolaryngol. 2005, 125, 280–285. [Google Scholar] [CrossRef] [PubMed]
- Diels, C.; Ukai, K.; A Howarth, P. Visually induced motion sickness with radial displays: Effects of gaze angle and fixation. Aviat. Space Environ. Med. 2007, 78, 659–665. [Google Scholar]
- Bos, J.E.; de Vries, S.C.; van Emmerik, M.L.; Groen, E.L. The effect of internal and external fields of view on visually induced motion sickness. Appl. Ergon. 2010, 41, 516–521. [Google Scholar] [CrossRef] [PubMed]
- Moss, J.D.; Muth, E.R. Characteristics of Head-Mounted Displays and Their Effects on Simulator Sickness. Hum. Factors J. Hum. Factors Ergon. Soc. 2011, 53, 308–319. [Google Scholar] [CrossRef] [PubMed] [Green Version]
- Merhi, O.; Faugloire, E.; Flanagan, M.; Stoffregen, T.A. Motion sickness, console video games, and head-mounted displays. Hum. Factors J. Hum. Factors Ergon. Soc. 2007, 49, 920–934. [Google Scholar] [CrossRef]
- Kiryu, T.; Tada, G.; Toyama, H.; Iijima, A. Integrated evaluation of visually induced motion sickness in terms of autonomic nervous regulation. In Proceedings of the 2008 30th Annual International Conference of the IEEE Engineering in Medicine and Biology Society, Vancouver, BC, Canada, 20–24 August 2008; pp. 4597–4600. [Google Scholar]
- Palmisano, S.; Mursic, R.; Kim, J. Vection and cybersickness generated by head-and-display motion in the Oculus Rift. Displays 2017, 46, 1–8. [Google Scholar] [CrossRef] [Green Version]
- Kim, Y.Y.; Kim, H.J.; Kim, E.N.; Ko, H.D. Characteristic changes in the physiological components of cybersickness. Psychophysiology 2005, 42, 616–625. [Google Scholar] [CrossRef] [PubMed]
- Lin, C.-T.; Tsai, S.-F.; Ko, L.-W. EEG-Based Learning System for Online Motion Sickness Level Estimation in a Dynamic Vehicle Environment. IEEE Trans. Neural Netw. Learn. Syst. 2013, 24, 1689–1700. [Google Scholar] [CrossRef] [PubMed]
- Nalivaiko, E.; Davis, S.L.; Blackmore, K.; Vakulin, A.; Nesbitt, K. Cybersickness provoked by head-mounted display affects cutaneous vascular tone, heart rate and reaction time. Physiol. Behav. 2015, 151, 583–590. [Google Scholar] [CrossRef]
- Chuang, S.-W.; Chuang, C.-H.; Yu, Y.-H.; King, J.-T.; Lin, C.-T. (Ct) EEG Alpha and Gamma Modulators Mediate Motion Sickness-Related Spectral Responses. Int. J. Neural Syst. 2016, 26, 1650007. [Google Scholar] [CrossRef] [PubMed]
- Toschi, N.; Kim, J.; Sclocco, R.; Duggento, A.; Barbieri, R.; Kuo, B.; Napadow, V. Motion sickness increases functional connectivity between visual motion and nausea-associated brain regions. Auton. Neurosci. 2017, 202, 108–113. [Google Scholar] [CrossRef] [PubMed] [Green Version]
- Zużewicz, K.; Saulewicz, A.; Konarska, M.; Kaczorowski, Z. Heart Rate Variability and Motion Sickness During Forklift Simulator Driving. Int. J. Occup. Saf. Ergon. 2011, 17, 403–410. [Google Scholar] [CrossRef] [PubMed] [Green Version]
- Malińska, M.; Zużewicz, K.; Bugajska, J.; Grabowski, A. Heart rate variability (HRV) during virtual reality immersion. Int. J. Occup. Saf. Ergon. 2015, 21, 47–54. [Google Scholar] [CrossRef]
- Ohyama, S.; Nishiike, S.; Watanabe, H.; Matsuoka, K.; Akizuki, H.; Takeda, N.; Harada, T. Autonomic responses during motion sickness induced by virtual reality. Auris Nasus Larynx 2007, 34, 303–306. [Google Scholar] [CrossRef] [PubMed]
- Chardonnet, J.-R.; Mirzaei, M.A.; Mérienne, F. Features of the Postural Sway Signal as Indicators to Estimate and Predict Visually Induced Motion Sickness in Virtual Reality. Int. J. Hum. Comput. Interact. 2017, 33, 771–785. [Google Scholar] [CrossRef] [Green Version]
- Gianaros, P.J.; Quigley, K.S.; Muth, E.R.; Levine, M.E.; Vasko, J.R.C.; Stern, R.M. Relationship between temporal changes in cardiac parasympathetic activity and motion sickness severity. Psychophysiology 2003, 40, 39–44. [Google Scholar] [CrossRef] [Green Version]
- Annett, J. Subjective rating scales: Science or art? Ergonomics 2002, 45, 966–987. [Google Scholar] [CrossRef]
- Cain, B. A Review of the Mental Workload Literature; Defence Research And Development Toronto (Canada): Toronto, ON, Canada, 2007. [Google Scholar]
- Park, S.; Lee, D.W.; Mun, S.; Kim, H.-I.; Whang, M. Effect of Simulator Sickness Caused by Head-mounted Display on the Stability of the Pupillary Rhythm. Korean Soc. Emot. Sensib. 2018, 21, 43–54. [Google Scholar] [CrossRef]
- Oman, C.M. Motion sickness: A synthesis and evaluation of the sensory conflict theory. Can. J. Physiol. Pharmacol. 1990, 68, 294–303. [Google Scholar] [CrossRef] [PubMed]
- Mun, S.; Park, M.-C.; Park, S.; Whang, M. SSVEP and ERP measurement of cognitive fatigue caused by stereoscopic 3D. Neurosci. Lett. 2012, 525, 89–94. [Google Scholar] [CrossRef] [PubMed]
- Mun, S.; Kim, E.-S.; Park, M.-C. Effect of mental fatigue caused by mobile 3D viewing on selective attention: An ERP study. Int. J. Psychophysiol. 2014, 94, 373–381. [Google Scholar] [CrossRef]
- Fotiou, F.; Fountoulakis, K.; Tsolaki, M.; Goulas, A.; Palikaras, A. Changes in pupil reaction to light in Alzheimer’s disease patients: A preliminary report. Int. J. Psychophysiol. 2000, 37, 111–120. [Google Scholar] [CrossRef]
- Partala, T.; Surakka, V. Pupil size variation as an indication of affective processing. Int. J. Hum. Comput. Stud. 2003, 59, 185–198. [Google Scholar] [CrossRef]
- Kojima, M.; Shioiri, T.; Hosoki, T.; Kitamura, H.; Bando, T.; Someya, T. Pupillary light reflex in panic disorder. Eur. Arch. Psychiatry Clin. Neurosci. 2004, 254, 242–244. [Google Scholar] [CrossRef] [PubMed]
- Kozicz, T.; Bittencourt, J.; May, P.J.; Reiner, A.; Gamlin, P.D.; Palkovits, M.; Horn, A.; Toledo, C.A.; Ryabinin, A.E. The Edinger-Westphal nucleus: A historical, structural, and functional perspective on a dichotomous terminology. J. Comp. Neurol. 2011, 519, 1413–1434. [Google Scholar] [CrossRef] [PubMed] [Green Version]
- Júnior, E.D.D.S.; Da Silva, A.V.; Da Silva, K.R.; Haemmerle, C.; Batagello, D.S.; Da Silva, J.M.; Lima, L.B.; Da Silva, R.J.; Diniz, G.; Sita, L.V.; et al. The centrally projecting Edinger–Westphal nucleus—I: Efferents in the rat brain. J. Chem. Neuroanat. 2015, 68, 22–38. [Google Scholar] [CrossRef] [Green Version]
- Just, M.; Carpenter, P.A. The intensity dimension of thought: Pupillometric indices of sentence processing. Can. J. Exp. Psychol. 1993, 47, 310–339. [Google Scholar] [CrossRef] [PubMed]
- Just, M.A.; Carpenter, P.A.; Keller, T.A.; Eddy, W.F.; Thulborn, K.R. Brain activation modulated by sentence comprehension. Science 1996, 274, 114–116. [Google Scholar] [CrossRef]
- Klingner, J.; Kumar, R.; Hanrahan, P. Measuring the task-evoked pupillary response with a remote eye tracker. In Proceedings of the 2008 symposium on Eye tracking research & applications—ETRA ’08, Savannah, GA, USA, 26–28 March 2008; pp. 69–72. [Google Scholar]
- Jimenez-Molina, A.; Retamal, C.; Lira, H. Using Psychophysiological Sensors to Assess Mental Workload During Web Browsing. Sensors 2018, 18, 458. [Google Scholar] [CrossRef] [Green Version]
- Hink, R.; Van Voorhis, S.; Hillyard, S.; Smith, T. The division of attention and the human auditory evoked potential. Neuropsychologia 1977, 15, 597–605. [Google Scholar] [CrossRef]
- Beatty, J. Pupillometric signs of selective attention in man. In Neurophysiology and Psychophysiology: Experimental and Clinical Applications; Academic Press: New York, NY, USA, 1988; pp. 138–143. [Google Scholar]
- Lee, E.C.; Park, K.R.; Whang, M.; Min, K. Measuring the degree of eyestrain caused by watching LCD and PDP devices. Int. J. Ind. Ergon. 2009, 39, 798–806. [Google Scholar] [CrossRef]
- Park, S.; Whang, M. Infrared Camera-Based Non-contact Measurement of Brain Activity From Pupillary Rhythms. Front. Physiol. 2018, 9, 1400. [Google Scholar] [CrossRef]
- Park, S.; Won, M.J.; Lee, D.W.; Whang, M. Non-contact measurement of heart response reflected in human eye. Int. J. Psychophysiol. 2018, 123, 179–198. [Google Scholar] [CrossRef]
- Park, S.; Mun, S.; Lee, D.W.; Whang, M. IR-camera-based measurements of 2D/3D cognitive fatigue in 2D/3D display system using task-evoked pupillary response. Appl. Opt. 2019, 58, 3467–3480. [Google Scholar] [CrossRef] [PubMed]
- McCraty, R.; Atkinson, M.; Tomasino, D.; Bradley, R.T. The coherent heart heart-brain interactions, psychophysiological coherence, and the emergence of system-wide order. Integral Rev. 2009, 5, 10–115. [Google Scholar]
- Keselman, H.J.; Huberty, C.J.; Lix, L.M.; Olejnik, S.; Cribbie, R.A.; Donahue, B.; Kowalchuk, R.K.; Lowman, L.L.; Petoskey, M.D.; Keselman, J.C.; et al. Statistical Practices of Educational Researchers: An Analysis of their ANOVA, MANOVA, and ANCOVA Analyses. Rev. Educ. Res. 1998, 68, 350–386. [Google Scholar] [CrossRef]
- Jung, H.; Kim, H.S.; Kim, J.Y.; Sun, J.-M.; Ahn, J.S.; Ahn, M.-J.; Park, K.; Esteller, M.; Lee, S.-H.; Choi, J.K. DNA methylation loss promotes immune evasion of tumours with high mutation and copy number load. Nat. Commun. 2019, 10, 4278. [Google Scholar] [CrossRef] [PubMed] [Green Version]
- Dunnett, C.W. A multiple comparison procedure for comparing several treatments with a control. J. Am. Stat. Assoc. 1955, 50, 1096–1121. [Google Scholar] [CrossRef]
- Armstrong, R.A. When to use the Bonferroni correction. Ophthalmic Physiol. Opt. 2014, 34, 502–508. [Google Scholar] [CrossRef]
- Huck, S.W.; Cormier, W.H.; Bounds, W.G. Reading Statistics and Research; Harper & Row: New York, NY, USA, 1974. [Google Scholar]
- Narsky, I.; Porter, F.C. Statistical Analysis Techniques in Particle Physics; Wiley Online Library: Hoboken, NJ, USA, 2013. [Google Scholar]
- Myszczynska, M.A.; Ojamies, P.N.; Lacoste, A.M.B.; Neil, D.; Saffari, A.; Mead, R.; Hautbergue, G.M.; Holbrook, J.D.; Ferraiuolo, L. Applications of machine learning to diagnosis and treatment of neurodegenerative diseases. Nat. Rev. Neurol. 2020, 16, 440–456. [Google Scholar] [CrossRef]
- Alloghani, M.; Al-Jumeily, D.; Hussain, A.; Liatsis, P.; Aljaaf, A. Performance-Based Prediction of Chronic Kidney Disease Using Machine Learning for High-Risk Cardiovascular Disease Patients. In Nature-Inspired Computation in Data Mining and Machine Learning; Studies in Computational Intelligence; Springer: Berlin/Heidelberg, Germany, 2020; pp. 187–206. [Google Scholar]
- Lindholm, A.; Wahlström, N.; Lindsten, F.; Schön, T.B. Supervised machine learning. 2020, unpublished. [Google Scholar]
- James, G.; Witten, D.; Hastie, T.; Tibshirani, R. An Introduction to Statistical Learning; Springer: Cham, Switzerland, 2013; Volume 112. [Google Scholar]
- Saito, T.; Rehmsmeier, M. Precrec: Fast and accurate precision–recall and ROC curve calculations in R. Bioinformatics 2017, 33, 145–147. [Google Scholar] [CrossRef] [Green Version]
- Kahneman, D.; Beatty, J. Pupil Diameter and Load on Memory. Science 1966, 154, 1583–1585. [Google Scholar] [CrossRef]
- Ahern, S.; Beatty, J. Pupillary responses during information processing vary with Scholastic Aptitude Test scores. Science 1979, 205, 1289–1292. [Google Scholar] [CrossRef] [PubMed]
- Hansen, A.L.; Johnsen, B.H.; Thayer, J.F. Vagal influence on working memory and attention. Int. J. Psychophysiol. 2003, 48, 263–274. [Google Scholar] [CrossRef]
- McGuigan, F.J.; Andreassi, J.L. Psychophysiology—Human Behavior and Physiological Response. Am. J. Psychol. 1981, 94, 359. [Google Scholar] [CrossRef]
- Gabay, S.; Pertzov, Y.; Henik, A. Orienting of attention, pupil size, and the norepinephrine system. Atten. Percept. Psychophys. 2010, 73, 123–129. [Google Scholar] [CrossRef] [PubMed]
- Geva, R.; Zivan, M.; Warsha, A.; Olchik, D. Alerting, orienting or executive attention networks: Differential patters of pupil dilations. Front. Behav. Neurosci. 2013, 7, 145. [Google Scholar] [CrossRef] [PubMed] [Green Version]
- Murphy, P.R.; O’Connell, R.G.; O’Sullivan, M.; Robertson, I.H.; Balsters, J.H. Pupil diameter covaries with BOLD activity in human locus coeruleus. Hum. Brain Mapp. 2014, 35, 4140–4154. [Google Scholar] [CrossRef] [PubMed] [Green Version]
- Hong, L.; Walz, J.; Sajda, P. Your Eyes Give You Away: Prestimulus Changes in Pupil Diameter Correlate with Poststimulus Task-Related EEG Dynamics. PLoS ONE 2014, 9, e91321. [Google Scholar] [CrossRef]
- Joshi, S.; Li, Y.; Kalwani, R.M.; Gold, J.I. Relationships between Pupil Diameter and Neuronal Activity in the Locus Coeruleus, Colliculi, and Cingulate Cortex. Neuron 2016, 89, 221–234. [Google Scholar] [CrossRef] [Green Version]
- Alnaes, D.; Sneve, M.H.; Espeseth, T.; Endestad, T.; Van De Pavert, S.H.P.; Laeng, B. Pupil size signals mental effort deployed during multiple object tracking and predicts brain activity in the dorsal attention network and the locus coeruleus. J. Vis. 2014, 14, 1. [Google Scholar] [CrossRef]
- Wang, C.-A.J.; Munoz, D.P. A circuit for pupil orienting responses: Implications for cognitive modulation of pupil size. Curr. Opin. Neurobiol. 2015, 33, 134–140. [Google Scholar] [CrossRef]
- Ebitz, R.B.; Platt, M.L. Neuronal Activity in Primate Dorsal Anterior Cingulate Cortex Signals Task Conflict and Predicts Adjustments in Pupil-Linked Arousal. Neuron 2015, 85, 628–640. [Google Scholar] [CrossRef] [PubMed] [Green Version]
- Mittelstaedt, J.M.; Wacker, J.; Stelling, D. VR aftereffect and the relation of cybersickness and cognitive performance. Virtual Real. 2019, 23, 143–154. [Google Scholar] [CrossRef]


| Classifier | 10-Fold Cross Validation | Test Set Validation | ||||||
|---|---|---|---|---|---|---|---|---|
| Accuracy | Sensitivity | Specificity | AUC | Accuracy | Sensitivity | Specificity | AUC | |
| LDA | 0.88 | 0.83 | 0.92 | 0.93 | 0.80 | 0.74 | 0.87 | 0.90 |
| Decision Tree | 0.83 | 0.75 | 0.92 | 0.95 | 0.76 | 0.65 | 0.87 | 0.76 |
| Linear SVM | 0.90 | 0.88 | 0.92 | 0.92 | 0.80 | 0.74 | 0.87 | 0.90 |
| RBF SVM | 0.90 | 0.88 | 0.92 | 0.92 | 0.80 | 0.74 | 0.87 | 0.89 |
| Study | Device | Feature | Classifier | Accuracy | ||||
|---|---|---|---|---|---|---|---|---|
| Train Set | n | Test Set | n | |||||
| 1 | Lin et al., 2013 | HMD | EEG | PCA + SONFIN | 0.82 | 17 | - | - |
| 2 | Pane et al., 2018 | LCD | CN2 Rules | 0.89 | 9 | - | - | |
| 3 | Mawalid et al., 2018 | LCD | Naïve Bayes | 0.84 | 9 | - | - | |
| 4 | Li et al., 2020 | HMD | SVM | 0.79 | 18 | - | - | |
| 5 | Dennison Jr et al., 2019 | HMD | EEG, EOG, RSP, etc. | Tree Bagger | 0.95 | 18 | - | - |
| 6 | Li et al., 2019 | HMD | EEG and COP | Voting Classifier | 0.76 | 20 | - | - |
| 7 | Present study | HMD | Pupillary Response | SVM | 0.90 | 48 | 0.80 | 46 |
Publisher’s Note: MDPI stays neutral with regard to jurisdictional claims in published maps and institutional affiliations. |
© 2021 by the authors. Licensee MDPI, Basel, Switzerland. This article is an open access article distributed under the terms and conditions of the Creative Commons Attribution (CC BY) license (https://creativecommons.org/licenses/by/4.0/).
Share and Cite
Park, S.; Mun, S.; Ha, J.; Kim, L. Non-Contact Measurement of Motion Sickness Using Pupillary Rhythms from an Infrared Camera. Sensors 2021, 21, 4642. https://doi.org/10.3390/s21144642
Park S, Mun S, Ha J, Kim L. Non-Contact Measurement of Motion Sickness Using Pupillary Rhythms from an Infrared Camera. Sensors. 2021; 21(14):4642. https://doi.org/10.3390/s21144642
Chicago/Turabian StylePark, Sangin, Sungchul Mun, Jihyeon Ha, and Laehyun Kim. 2021. "Non-Contact Measurement of Motion Sickness Using Pupillary Rhythms from an Infrared Camera" Sensors 21, no. 14: 4642. https://doi.org/10.3390/s21144642
APA StylePark, S., Mun, S., Ha, J., & Kim, L. (2021). Non-Contact Measurement of Motion Sickness Using Pupillary Rhythms from an Infrared Camera. Sensors, 21(14), 4642. https://doi.org/10.3390/s21144642