
The Contribution of Machine Learning in the Validation of Commercial Wearable Sensors for Gait Monitoring in Patients: A Systematic Review


Abstract
:1. Introduction
2. Methods
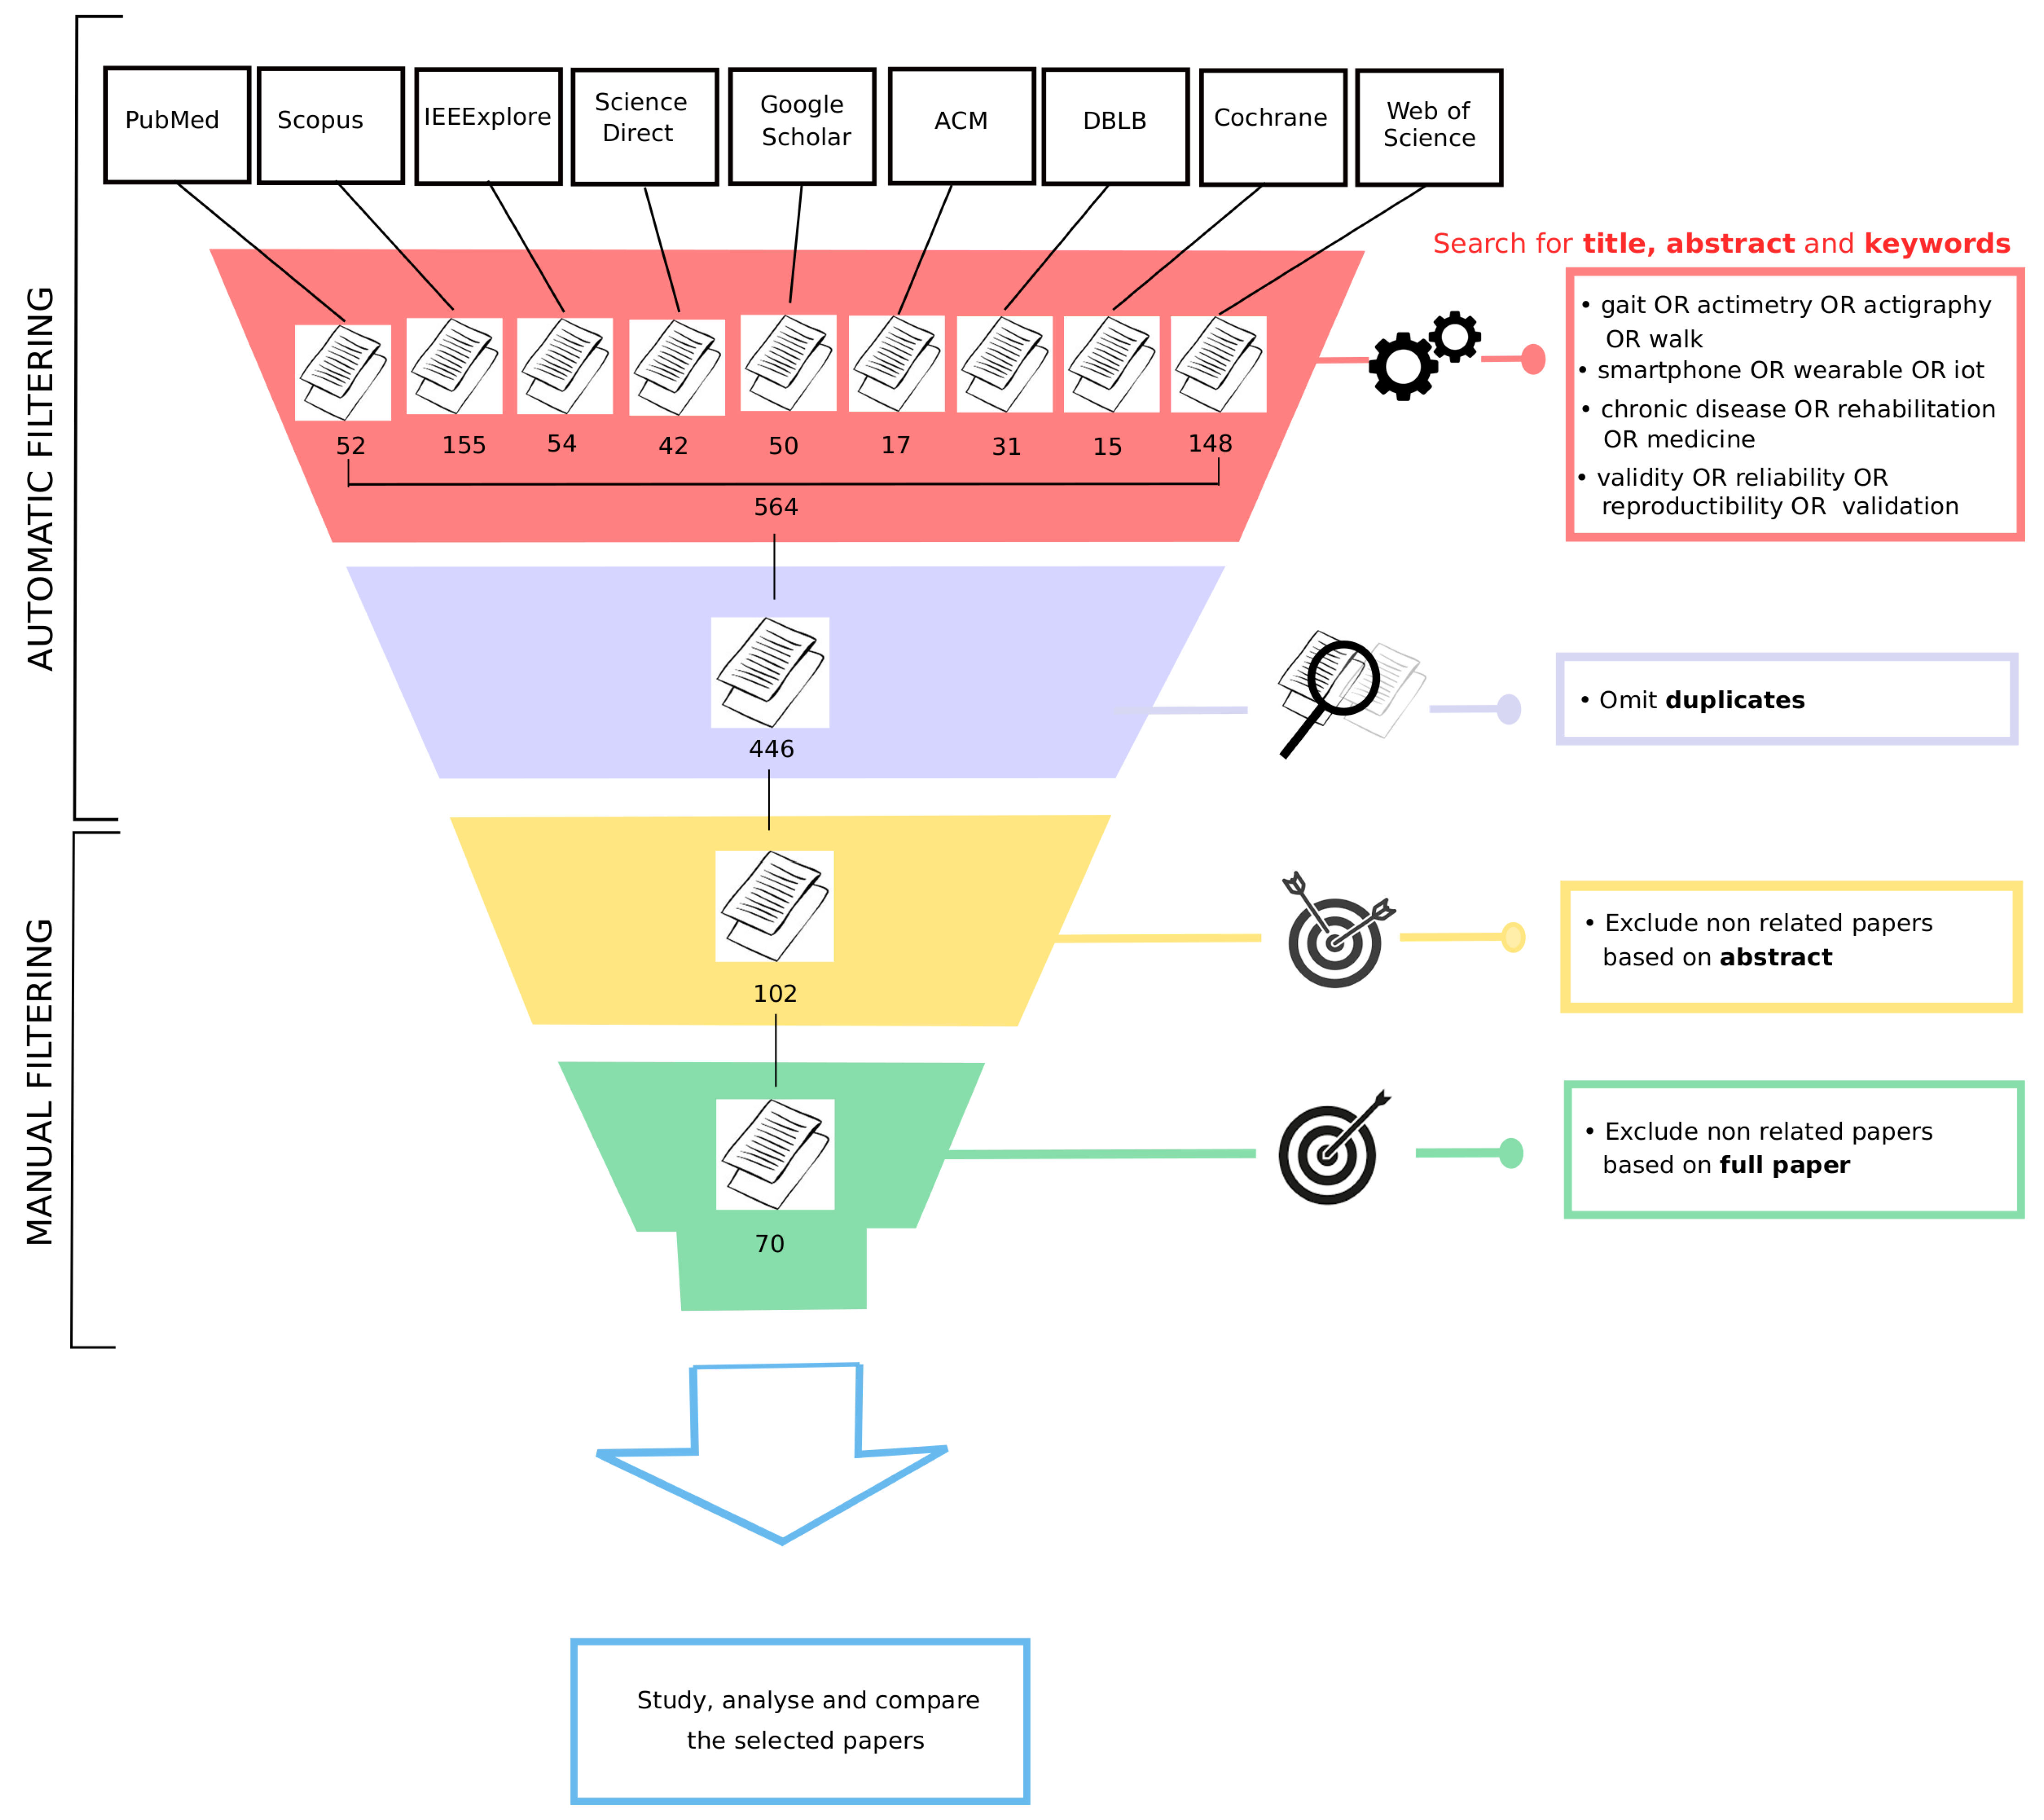
2.1. Databases
2.2. Literature Search
2.3. Inclusion Criteria
- The study must be centered on gait or posture analysis (e.g., detect stance and swing phases, detect the risk of falling, etc.). Studies focusing only on activities or step counting were excluded.
- Given the application to remote monitoring in patients, only devices allowing wireless data flow wer considered. This flow had to have been conducted using bluetooth between the device and the smartphone to then send data by Wi-Fi to a remote server. Sensors that temporarily store the data locally and send the data a posteriori when a Wi-Fi connection is available were also included.
- The devices had to have been used in a clinical setting for long-term follow-up or rehabilitation of a chronic pathology. Studies on young or healthy patients and on animals were excluded.
- The validity of the sensor and the resulting indicators must have been assessed. Therefore, a ground truth must be proposed and the study must include at least one statistical measure (e.g., statistical test, correlation, and mean square error) or one evaluation metric (e.g., accuracy, F1-score, precision, and sensitivity) to indicate the performance of the sensor on detecting the associated gait feature.
2.4. Selection of Articles
2.5. Data Extraction
- Sample size: the total number of participants for each study.
- Pathology: the disease monitored in the study.
- Duration of data collection: how long the participants wore the sensor(s) to collect data for the study.
- Condition of data collection: specifies on whether the study was conducted in a laboratory or in free-living conditions.
- Number of wearable devices: the total number of wearable devices in which the sensor’s signal data were used to study the patient’s gait. Any other equipment that was part of the acquisition system but did not provide data to evaluate the gait was not included in this count.
- Type of sensor(s): the type of sensor embedded within the wearable device(s) used to assess gait.
- Device brand(s) and model(s): the specific brand and model of the wearable device(s) used in the study.
- Location of device(s): details specific to the placement/location of wearable device(s) on the patient’s body.
- Gait indicators measured by the device(s): gait outcomes that were derived from the signal recorded on the device. In some studies, several gait indicators were extracted from the raw data.
- Ground-truth method(s): the method that was used in the study to evaluate the performance of the device(s) to assess gait.
- Evaluation metric(s) of the device(s): any evaluation metric, reported either in the text, a figure, or a table, that described the performance of the wearable device(s) on assessing gait. Only evaluation metrics that were exclusively used to study gait were included.
2.6. Summarizing Data and Categories
3. Results
3.1. Literature Search
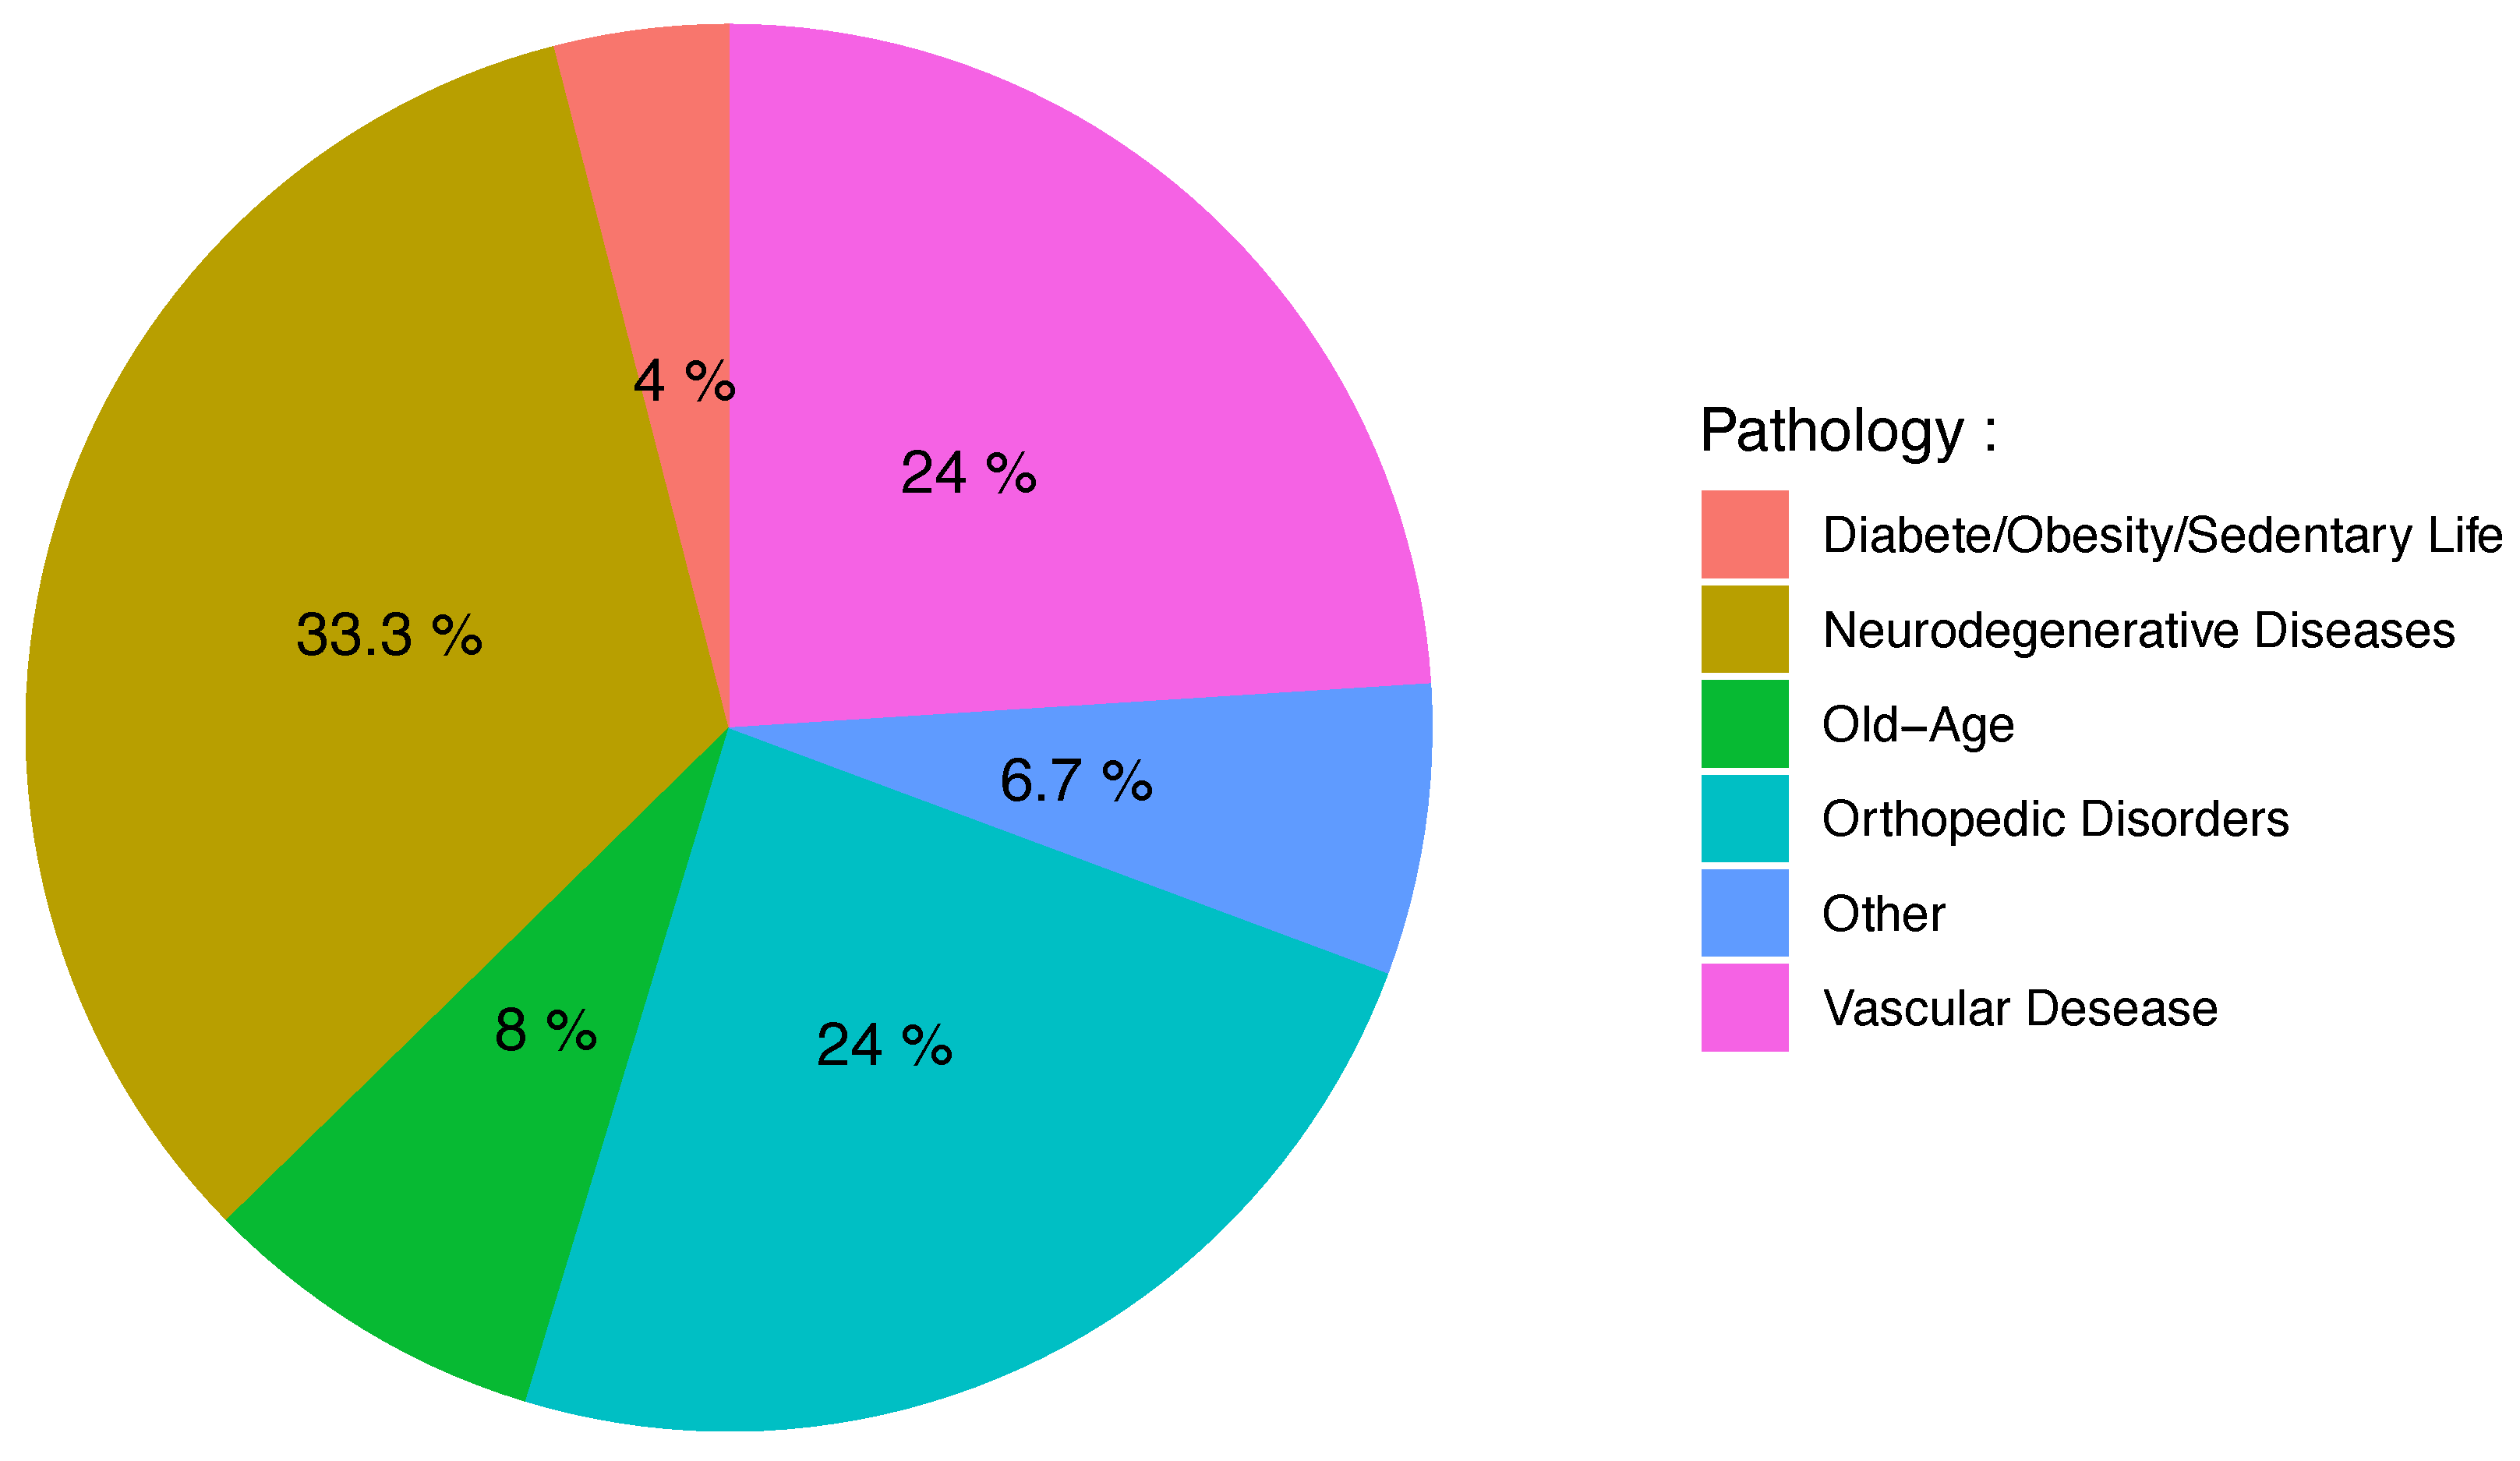
3.2. Clinical Context
3.3. Wearable Sensor Types
3.4. Data-Acquisition Conditions
3.5. Gait Indicators
3.6. Ground Truth
3.7. Evaluation Methods and Metrics
3.8. Summary of Key Findings
4. Discussion
4.1. Trends and Challenges
4.2. Recommendations
5. Conclusions
Author Contributions
Funding
Institutional Review Board Statement
Informed Consent Statement
Data Availability Statement
Conflicts of Interest
Abbreviations
| 6MWT | Six-minute walk test |
| ML | Machine learning |
| SD | Standard deviation |
| IMU | Inertial Measurement Unit |
Appendix A. Extraction from Databases

| Database | Search String | Records |
|---|---|---|
| ACM | [[Abstract: gait] OR [Abstract: actimetry] OR [Abstract: actigraphy] | 17 |
| OR [Abstract: walk]] AND [[[Abstract: smartphone] OR [Abstract: wearable] | ||
| OR [Abstract: iot]] AND [[Abstract: “chronic disease”] OR [Abstract: rehabilitation] | ||
| OR [Abstract: medicine]] AND [[Abstract: validity] OR [Abstract: reliability] | ||
| OR [Abstract: reproductibility or validation] OR [Publication Title: gait] | ||
| OR [Publication Title: actimetry] OR [Publication Title: actigraphy] | ||
| OR [Publication Title: walk]] AND [[Publication Title: smartphone] | ||
| OR [Publication Title: wearable] OR [Publication Title: iot] | ||
| AND [Publication Title: “chronic disease”] OR [Publication Title: rehabilitation] | ||
| OR [Publication Title: medicine]] AND [[Publication Title: validity] | ||
| OR [Publication Title: reliability] OR [Publication Title: reproductibility or validation]] | ||
| AND [Publication Date: (01 January 2010 TO 31 October 2020)] | ||
| Cochrane | ((gait OR actimetry OR actigraphy OR walk) AND (smartphone OR wearable OR iot) AND | 15 |
| (“chronic disease” OR rehabilitation OR medicine) AND (validity OR reliability OR | ||
| reproductibility OR validation)) in Title Abstract Keyword—between Jan 2010 and October 2020 | ||
| DBLB | (gait | walk | actimetry) (smartphone | device | iot) (valid | rehabilitation) | 31 |
| IEEE Xplore | ((gait OR actimetry OR actigraphy OR walk) AND (smartphone OR wearable OR iot) | 54 |
| AND (“chronic disease” OR rehabilitation OR medicine) AND (validity | ||
| OR reliability OR reproductibility or validation)) | ||
| PubMed | ((gait OR actimetry OR actigraphy OR walk) | 52 |
| AND (smartphone OR wearable OR iot) AND | ||
| (“chronic disease” OR rehabilitation OR medicine) AND | ||
| (validity OR reliability OR reproductibility or validation)) | ||
| Filters: from 2010–2020 | ||
| Scholar | title:(gait smartphone “wearable device” rehabilitation validity) | 1010 |
| ScienceDirect | ((gait OR actimetry) AND (smartphone OR iot) AND | 3 |
| #1 | (“chronic disease” OR medicine) AND | |
| (validity OR validation)) | ||
| ScienceDirect | ((gait OR walk) AND (smartphone OR wearable) AND | 10 |
| #2 | (rehabilitation OR medicine) AND | |
| (validity OR reliability)) | ||
| ScienceDirect | ((gait OR walk) AND (smartphone OR iot) AND | 1 |
| #3 | AND (“chronic disease” OR medicine) AND | |
| (validity OR validation)) | ||
| ScienceDirect | ((gait OR walk) AND (smartphone OR wearable) AND | 16 |
| #4 | AND (rehabilitation OR medicine) AND | |
| (validity OR validation)) | ||
| ScienceDirect | ((gait OR actimetry OR walk) AND | 12 |
| #5 | (smartphone OR wearable OR iot) AND | |
| rehabilitation AND validation) | ||
| SCOPUS | TITLE-ABS-KEY((( gait OR actimetry OR actigraphy OR walk ) | 155 |
| AND ( smartphone OR wearable OR iot ) AND | ||
| ( “chronic disease” OR rehabilitation OR medicine ) AND | ||
| ( validity OR reliability OR reproductibility OR validation))) | ||
| AND PUBYEAR ≥ 2010 AND PUBYEAR ≤ 2020 | ||
| Web of Science | (TS = ((gait OR actimetry OR actigraphy OR walk) | 148 |
| AND (smartphone OR wearable OR iot) AND (“chronic disease” OR | ||
| rehabilitation OR medicine) AND (validity OR reliability OR | ||
| reproductibility OR validation))) AND LANGUAGE: (English) | ||
| AND DOCUMENT TYPES: (Article) Indexes=SCI-EXPANDED, | ||
| SSCI, A&HCI, CPCI-S, CPCI-SSH, ESCI, | ||
| CCR-EXPANDED, IC Timespan=2010-2020 |
References
- Roberts, M.; Mongeon, D.; Prince, F. Biomechanical parameters for gait analysis: A systematic review of healthy human gait. Phys. Ther. Rehabil. 2017, 4, 6. [Google Scholar] [CrossRef]
- Middleton, A.; Fritz, S.L.; Lusardi, M. Walking speed: The functional vital sign. J. Aging Phys. Act. 2015, 23, 314–322. [Google Scholar] [CrossRef]
- Lewek, M.D.; Bradley, C.E.; Wutzke, C.J.; Zinder, S.M. The relationship between spatiotemporal gait asymmetry and balance in individuals with chronic stroke. J. Appl. Biomech. 2014, 30, 31–36. [Google Scholar] [CrossRef] [Green Version]
- Galna, B.; Lord, S.; Rochester, L. Is gait variability reliable in older adults and Parkinson’s disease? Towards an optimal testing protocol. Gait Posture 2013, 37, 580–585. [Google Scholar] [CrossRef] [PubMed]
- Cruz-Jimenez, M. Normal changes in gait and mobility problems in the elderly. Phys. Med. Rehabil. Clin. 2017, 28, 713–725. [Google Scholar] [CrossRef] [PubMed]
- Uszko-Lencer, N.H.; Mesquita, R.; Janssen, E.; Werter, C.; Brunner-La Rocca, H.P.; Pitta, F.; Wouters, E.F.; Spruit, M.A. Reliability, construct validity and determinants of 6-minute walk test performance in patients with chronic heart failure. Int. J. Cardiol. 2017, 240, 285–290. [Google Scholar] [CrossRef] [PubMed] [Green Version]
- DePew, Z.S.; Karpman, C.; Novotny, P.J.; Benzo, R.P. Correlations between gait speed, 6-minute walk distance, physical activity, and self-efficacy in patients with severe chronic lung disease. Respir. Care 2013, 58, 2113–2119. [Google Scholar] [CrossRef] [Green Version]
- Holland, A.E.; Spruit, M.A.; Troosters, T.; Puhan, M.A.; Pepin, V.; Saey, D.; McCormack, M.C.; Carlin, B.W.; Sciurba, F.C.; Pitta, F.; et al. An official European Respiratory Society/American Thoracic Society technical standard: Field walking tests in chronic respiratory disease. Eur. Respir. J. 2014, 44, 1428–1446. [Google Scholar] [CrossRef] [PubMed]
- Weiss, A.; Herman, T.; Mirelman, A.; Shiratzky, S.S.; Giladi, N.; Barnes, L.L.; Bennett, D.A.; Buchman, A.S.; Hausdorff, J.M. The transition between turning and sitting in patients with Parkinson’s disease: A wearable device detects an unexpected sequence of events. Gait Posture 2019, 67, 224–229. [Google Scholar] [CrossRef]
- Cuevas-Trisan, R. Balance problems and fall risks in the elderly. Phys. Med. Rehabil. Clin. 2017, 28, 727–737. [Google Scholar] [CrossRef]
- Shine, J.; Handojoseno, A.; Nguyen, T.; Tran, Y.; Naismith, S.; Nguyen, H.; Lewis, S. Abnormal patterns of theta frequency oscillations during the temporal evolution of freezing of gait in Parkinson’s disease. Clin. Neurophysiol. 2014, 125, 569–576. [Google Scholar] [CrossRef] [PubMed]
- Majumder, S.; Mondal, T.; Deen, M.J. Wearable sensors for remote health monitoring. Sensors 2017, 17, 130. [Google Scholar] [CrossRef] [PubMed]
- Dias, D.; Paulo Silva Cunha, J. Wearable health devices—vital sign monitoring, systems and technologies. Sensors 2018, 18, 2414. [Google Scholar] [CrossRef] [PubMed] [Green Version]
- Botros, A.; Schütz, N.; Camenzind, M.; Urwyler, P.; Bolliger, D.; Vanbellingen, T.; Kistler, R.; Bohlhalter, S.; Müri, R.M.; Mosimann, U.P.; et al. Long-term home-monitoring sensor technology in patients with Parkinson’s disease—Acceptance and adherence. Sensors 2019, 19, 5169. [Google Scholar] [CrossRef] [Green Version]
- Evenson, K.R.; Goto, M.M.; Furberg, R.D. Systematic review of the validity and reliability of consumer-wearable activity trackers. Int. J. Behav. Nutr. Phys. Act. 2015, 12, 159. [Google Scholar] [CrossRef] [PubMed] [Green Version]
- Appelboom, G.; Yang, A.H.; Christophe, B.R.; Bruce, E.M.; Slomian, J.; Bruyère, O.; Bruce, S.S.; Zacharia, B.E.; Reginster, J.Y.; Connolly, E.S., Jr. The promise of wearable activity sensors to define patient recovery. J. Clin. Neurosci. 2014, 21, 1089–1093. [Google Scholar] [CrossRef]
- Sprint, G.; Cook, D.; Weeks, D.; Dahmen, J.; La Fleur, A. Analyzing sensor-based time series data to track changes in physical activity during inpatient rehabilitation. Sensors 2017, 17, 2219. [Google Scholar] [CrossRef]
- Vienne, A.; Barrois, R.P.; Buffat, S.; Ricard, D.; Vidal, P.P. Inertial sensors to assess gait quality in patients with neurological disorders: A systematic review of technical and analytical challenges. Front. Psychol. 2017, 8, 817. [Google Scholar] [CrossRef] [Green Version]
- Carcreff, L.; Gerber, C.N.; Paraschiv-Ionescu, A.; De Coulon, G.; Newman, C.J.; Aminian, K.; Armand, S. Comparison of gait characteristics between clinical and daily life settings in children with cerebral palsy. Sci. Rep. 2020, 10, 2091. [Google Scholar] [CrossRef]
- Feehan, L.M.; Geldman, J.; Sayre, E.C.; Park, C.; Ezzat, A.M.; Yoo, J.Y.; Hamilton, C.B.; Li, L.C. Accuracy of Fitbit devices: Systematic review and narrative syntheses of quantitative data. JMIR mHealth uHealth 2018, 6, e10527. [Google Scholar] [CrossRef] [Green Version]
- Düking, P.; Fuss, F.K.; Holmberg, H.C.; Sperlich, B. Recommendations for assessment of the reliability, sensitivity, and validity of data provided by wearable sensors designed for monitoring physical activity. JMIR mHealth uHealth 2018, 6, e102. [Google Scholar] [CrossRef] [PubMed]
- Kobsar, D.; Charlton, J.M.; Tse, C.T.; Esculier, J.F.; Graffos, A.; Krowchuk, N.M.; Thatcher, D.; Hunt, M.A. Validity and reliability of wearable inertial sensors in healthy adult walking: A systematic review and meta-analysis. J. Neuroeng. Rehabil. 2020, 17, 1–21. [Google Scholar] [CrossRef] [PubMed]
- Poitras, I.; Dupuis, F.; Bielmann, M.; Campeau-Lecours, A.; Mercier, C.; Bouyer, L.J.; Roy, J.S. Validity and reliability of wearable sensors for joint angle estimation: A systematic review. Sensors 2019, 19, 1555. [Google Scholar] [CrossRef] [PubMed] [Green Version]
- Straiton, N.; Alharbi, M.; Bauman, A.; Neubeck, L.; Gullick, J.; Bhindi, R.; Gallagher, R. The validity and reliability of consumer-grade activity trackers in older, community-dwelling adults: A systematic review. Maturitas 2018, 112, 85–93. [Google Scholar] [CrossRef] [Green Version]
- Loy-Benitez, J.; Heo, S.; Yoo, C. Soft sensor validation for monitoring and resilient control of sequential subway indoor air quality through memory-gated recurrent neural networks-based autoencoders. Control Eng. Pract. 2020, 97, 104330. [Google Scholar] [CrossRef]
- Seibert, V.; Araújo, R.; McElligott, R. Sensor Validation for Indoor Air Quality using Machine Learning. In Proceedings of the Anais do XVII Encontro Nacional de Inteligência Artificial e Computacional (ENIAC), Rio Grande, Brazil, 20–23 October 2020; pp. 730–739. [Google Scholar]
- Bergamini, E.; Iosa, M.; Belluscio, V.; Morone, G.; Tramontano, M.; Vannozzi, G. Multi-sensor assessment of dynamic balance during gait in patients with subacute stroke. J. Biomech. 2017, 61, 208–215. [Google Scholar] [CrossRef]
- Qiu, S.; Liu, L.; Zhao, H.; Wang, Z.; Jiang, Y. MEMS inertial sensors based gait analysis for rehabilitation assessment via multi-sensor fusion. Micromachines 2018, 9, 442. [Google Scholar] [CrossRef] [Green Version]
- Nukala, B.T.; Nakano, T.; Rodriguez, A.; Tsay, J.; Lopez, J.; Nguyen, T.Q.; Zupancic, S.; Lie, D.Y. Real-time classification of patients with balance disorders vs. normal subjects using a low-cost small wireless wearable gait sensor. Biosensors 2016, 6, 58. [Google Scholar] [CrossRef] [Green Version]
- Altilio, R.; Rossetti, A.; Fang, Q.; Gu, X.; Panella, M. A comparison of machine learning classifiers for smartphone-based gait analysis. Med Biol. Eng. Comput. 2021, 59, 535–546. [Google Scholar] [CrossRef]
- Goshvarpour, A.; Goshvarpour, A. Nonlinear Analysis of Human Gait Signals. Int. J. Inf. Eng. Electron. Bus. 2012, 4, 15–21. [Google Scholar] [CrossRef]
- Pérez-Toro, P.; Vásquez-Correa, J.; Arias-Vergara, T.; Nöth, E.; Orozco-Arroyave, J. Nonlinear dynamics and Poincaré sections to model gait impairments in different stages of Parkinson’s disease. Nonlinear Dyn. 2020, 100, 3253–3276. [Google Scholar] [CrossRef]
- Page, M.J.; McKenzie, J.E.; Bossuyt, P.M.; Boutron, I.; Hoffmann, T.C.; Mulrow, C.D.; Shamseer, L.; Tetzlaff, J.M.; Moher, D. Updating guidance for reporting systematic reviews: Development of the PRISMA 2020 statement. J. Clin. Epidemiol. 2021, 134, 103–112. [Google Scholar] [CrossRef]
- Abdollahi, M.; Ashouri, S.; Abedi, M.; Azadeh-Fard, N.; Parnianpour, M.; Khalaf, K.; Rashedi, E. Using a Motion Sensor to Categorize Nonspecific Low Back Pain Patients: A Machine Learning Approach. Sensors 2020, 20, 3600. [Google Scholar] [CrossRef]
- Aich, S.; Pradhan, P.M.; Park, J.; Sethi, N.; Vathsa, V.S.S.; Kim, H.C. A validation study of freezing of gait (FoG) detection and machine-learning-based FoG prediction using estimated gait characteristics with a wearable accelerometer. Sensors 2018, 18, 3287. [Google Scholar] [CrossRef] [Green Version]
- Aich, S.; Pradhan, P.M.; Chakraborty, S.; Kim, H.C.; Kim, H.T.; Lee, H.G.; Kim, I.H.; Joo, M.i.; Jong Seong, S.; Park, J. Design of a Machine Learning-Assisted Wearable Accelerometer-Based Automated System for Studying the Effect of Dopaminergic Medicine on Gait Characteristics of Parkinson’s Patients. J. Healthc. Eng. 2020, 2020, 1823268. [Google Scholar] [CrossRef]
- Angelini, L.; Carpinella, I.; Cattaneo, D.; Ferrarin, M.; Gervasoni, E.; Sharrack, B.; Paling, D.; Nair, K.P.S.; Mazzà, C. Is a wearable sensor-based characterisation of gait robust enough to overcome differences between measurement protocols? A multi-centric pragmatic study in patients with multiple sclerosis. Sensors 2020, 20, 79. [Google Scholar] [CrossRef] [PubMed] [Green Version]
- Antos, S.A.; Danilovich, M.K.; Eisenstein, A.R.; Gordon, K.E.; Kording, K.P. Smartwatches can detect walker and cane use in older adults. Innov. Aging 2019, 3, igz008. [Google Scholar] [CrossRef] [PubMed]
- Arcuria, G.; Marcotulli, C.; Amuso, R.; Dattilo, G.; Galasso, C.; Pierelli, F.; Casali, C. Developing a smartphone application, triaxial accelerometer-based, to quantify static and dynamic balance deficits in patients with cerebellar ataxias. J. Neurol. 2020, 267, 625–639. [Google Scholar] [CrossRef] [PubMed]
- Ata, R.; Gandhi, N.; Rasmussen, H.; El-Gabalawy, O.; Gutierrez, S.; Ahmad, A.; Suresh, S.; Ravi, R.; Rothenberg, K.; Aalami, O. Clinical validation of smartphone-based activity tracking in peripheral artery disease patients. NPJ Digit. Med. 2018, 1, 66. [Google Scholar] [CrossRef] [PubMed]
- Banky, M.; Clark, R.A.; Mentiplay, B.F.; Olver, J.H.; Kahn, M.B.; Williams, G. Toward accurate clinical spasticity assessment: Validation of movement speed and joint angle assessments using Smartphones and camera tracking. Arch. Phys. Med. Rehabil. 2019, 100, 1482–1491. [Google Scholar] [CrossRef]
- Brinkløv, C.F.; Thorsen, I.K.; Karstoft, K.; Brøns, C.; Valentiner, L.; Langberg, H.; Vaag, A.A.; Nielsen, J.S.; Pedersen, B.K.; Ried-Larsen, M. Criterion validity and reliability of a smartphone delivered sub-maximal fitness test for people with type 2 diabetes. BMC Sport. Sci. Med. Rehabil. 2016, 8, 31. [Google Scholar] [CrossRef] [Green Version]
- Capela, N.A.; Lemaire, E.D.; Baddour, N. Novel algorithm for a smartphone-based 6-minute walk test application: Algorithm, application development, and evaluation. J. Neuroeng. Rehabil. 2015, 12, 19. [Google Scholar] [CrossRef] [Green Version]
- Carpinella, I.; Gervasoni, E.; Anastasi, D.; Lencioni, T.; Cattaneo, D.; Ferrarin, M. Instrumental assessment of stair ascent in people with multiple sclerosis, stroke, and Parkinson’s disease: A wearable-sensor-based approach. IEEE Trans. Neural Syst. Rehabil. Eng. 2018, 26, 2324–2332. [Google Scholar] [CrossRef] [PubMed]
- Cheng, Q.; Juen, J.; Bellam, S.; Fulara, N.; Close, D.; Silverstein, J.C.; Schatz, B. Predicting pulmonary function from phone sensors. Telemed. e-Health 2017, 23, 913–919. [Google Scholar] [CrossRef] [Green Version]
- Cheong, I.Y.; An, S.Y.; Cha, W.C.; Rha, M.Y.; Kim, S.T.; Chang, D.K.; Hwang, J.H. Efficacy of mobile health care application and wearable device in improvement of physical performance in colorectal cancer patients undergoing chemotherapy. Clin. Color. Cancer 2018, 17, e353–e362. [Google Scholar] [CrossRef]
- Chiu, Y.L.; Tsai, Y.J.; Lin, C.H.; Hou, Y.R.; Sung, W.H. Evaluation of a smartphone-based assessment system in subjects with chronic ankle instability. Comput. Methods Programs Biomed. 2017, 139, 191–195. [Google Scholar] [CrossRef]
- Compagnat, M.; Batcho, C.S.; David, R.; Vuillerme, N.; Salle, J.Y.; Daviet, J.C.; Mandigout, S. Validity of the walked distance estimated by wearable devices in stroke individuals. Sensors 2019, 19, 2497. [Google Scholar] [CrossRef] [Green Version]
- Compagnat, M.; Mandigout, S.; Batcho, C.; Vuillerme, N.; Salle, J.; David, R.; Daviet, J. Validity of wearable actimeter computation of total energy expenditure during walking in post-stroke individuals. Ann. Phys. Rehabil. Med. 2020, 63, 209–215. [Google Scholar] [CrossRef] [PubMed]
- DasMahapatra, P.; Chiauzzi, E.; Bhalerao, R.; Rhodes, J. Free-living physical activity monitoring in adult US patients with multiple sclerosis using a consumer wearable device. Digit. Biomarkers 2018, 2, 47–63. [Google Scholar] [CrossRef] [PubMed] [Green Version]
- Del Rosario, M.B.; Lovell, N.H.; Fildes, J.; Holgate, K.; Yu, J.; Ferry, C.; Schreier, G.; Ooi, S.Y.; Redmond, S.J. Evaluation of an mHealth-based adjunct to outpatient cardiac rehabilitation. IEEE J. Biomed. Health Informa. 2017, 22, 1938–1948. [Google Scholar] [CrossRef] [PubMed]
- Derungs, A.; Schuster-Amft, C.; Amft, O. Longitudinal walking analysis in hemiparetic patients using wearable motion sensors: Is there convergence between body sides? Front. Bioeng. Biotechnol. 2018, 6, 57. [Google Scholar] [CrossRef] [PubMed]
- Dobkin, B.H.; Xu, X.; Batalin, M.; Thomas, S.; Kaiser, W. Reliability and validity of bilateral ankle accelerometer algorithms for activity recognition and walking speed after stroke. Stroke 2011, 42, 2246–2250. [Google Scholar] [CrossRef] [Green Version]
- El-Gohary, M.; Peterson, D.; Gera, G.; Horak, F.B.; Huisinga, J.M. Validity of the instrumented push and release test to quantify postural responses in persons with multiple sclerosis. Arch. Phys. Med. Rehabil. 2017, 98, 1325–1331. [Google Scholar] [CrossRef]
- Erb, M.K.; Karlin, D.R.; Ho, B.K.; Thomas, K.C.; Parisi, F.; Vergara-Diaz, G.P.; Daneault, J.F.; Wacnik, P.W.; Zhang, H.; Kangarloo, T.; et al. mHealth and wearable technology should replace motor diaries to track motor fluctuations in Parkinson’s disease. NPJ Digit. Med. 2020, 3, 6. [Google Scholar] [CrossRef] [PubMed]
- Fantozzi, S.; Cortesi, M.; Giovanardi, A.; Borra, D.; Di Michele, R.; Gatta, G. Effect of walking speed during gait in water of healthy elderly. Gait Posture 2020, 82, 6–13. [Google Scholar] [CrossRef] [PubMed]
- Ferrari, A.; Ginis, P.; Hardegger, M.; Casamassima, F.; Rocchi, L.; Chiari, L. A mobile Kalman-filter based solution for the real-time estimation of spatio-temporal gait parameters. IEEE Trans. Neural Syst. Rehabil. Eng. 2015, 24, 764–773. [Google Scholar] [CrossRef] [Green Version]
- Flachenecker, F.; Gaßner, H.; Hannik, J.; Lee, D.H.; Flachenecker, P.; Winkler, J.; Eskofier, B.; Linker, R.A.; Klucken, J. Objective sensor-based gait measures reflect motor impairment in multiple sclerosis patients: Reliability and clinical validation of a wearable sensor device. Mult. Scler. Relat. Disord. 2020, 39, 101903. [Google Scholar] [CrossRef]
- Furtado, S.; Godfrey, A.; Del Din, S.; Rochester, L.; Gerrand, C. Are Accelerometer-based Functional Outcome Assessments Feasible and Valid After Treatment for Lower Extremity Sarcomas? Clin. Orthop. Relat. Res. 2020, 478, 482–503. [Google Scholar] [CrossRef]
- Gadaleta, M.; Cisotto, G.; Rossi, M.; Rehman, R.Z.U.; Rochester, L.; Del Din, S. Deep learning techniques for improving digital gait segmentation. In Proceedings of the 2019 41st Annual International Conference of the IEEE Engineering in Medicine and Biology Society (EMBC), Berlin, Germany, 23–27 July 2019; pp. 1834–1837. [Google Scholar]
- Grimpampi, E.; Bonnet, V.; Taviani, A.; Mazzà, C. Estimate of lower trunk angles in pathological gaits using gyroscope data. Gait Posture 2013, 38, 523–527. [Google Scholar] [CrossRef]
- Henriksen, A.; Sand, A.S.; Deraas, T.; Grimsgaard, S.; Hartvigsen, G.; Hopstock, L. Succeeding with prolonged usage of consumer-based activity trackers in clinical studies: A mixed methods approach. BMC Public Health 2020, 20, 1300. [Google Scholar] [CrossRef]
- Ilias, T.; Filip, B.; Radu, C.; Dag, N.; Marina, S.; Mevludin, M. Using measurements from wearable sensors for automatic scoring of Parkinson’s disease motor states: Results from 7 patients. In Proceedings of the 2017 39th Annual International Conference of the IEEE Engineering in Medicine and Biology Society (EMBC), Jeju, Korea, 11–15 July 2017; pp. 131–134. [Google Scholar]
- Isho, T.; Tashiro, H.; Usuda, S. Accelerometry-based gait characteristics evaluated using a smartphone and their association with fall risk in people with chronic stroke. J. Stroke Cerebrovasc. Dis. 2015, 24, 1305–1311. [Google Scholar] [CrossRef]
- Item-Glatthorn, J.F.; Casartelli, N.C.; Petrich-Munzinger, J.; Munzinger, U.K.; Maffiuletti, N.A. Validity of the intelligent device for energy expenditure and activity accelerometry system for quantitative gait analysis in patients with hip osteoarthritis. Arch. Phys. Med. Rehabil. 2012, 93, 2090–2093. [Google Scholar] [CrossRef]
- Jang, I.Y.; Kim, H.R.; Lee, E.; Jung, H.W.; Park, H.; Cheon, S.H.; Lee, Y.S.; Park, Y.R. Impact of a wearable device-based walking programs in rural older adults on physical activity and health outcomes: Cohort study. JMIR mHealth uHealth 2018, 6, e11335. [Google Scholar] [CrossRef]
- Jayaraman, C.; Mummidisetty, C.K.; Mannix-Slobig, A.; Koch, L.M.; Jayaraman, A. Variables influencing wearable sensor outcome estimates in individuals with stroke and incomplete spinal cord injury: A pilot investigation validating two research grade sensors. J. Neuroeng. Rehabil. 2018, 15, 19. [Google Scholar] [CrossRef]
- Juen, J.; Cheng, Q.; Prieto-Centurion, V.; Krishnan, J.A.; Schatz, B. Health monitors for chronic disease by gait analysis with mobile phones. Telemed. e-Health 2014, 20, 1035–1041. [Google Scholar] [CrossRef] [PubMed] [Green Version]
- Juen, J.; Cheng, Q.; Schatz, B. Towards a natural walking monitor for pulmonary patients using simple smart phones. In Proceedings of the 5th ACM Conference on Bioinformatics, Computational Biology, and Health Informatics, Newport Beach, CA, USA, 20–23 September 2014; pp. 53–62. [Google Scholar]
- Kim, H.B.; Lee, H.J.; Lee, W.W.; Kim, S.K.; Jeon, H.S.; Park, H.Y.; Shin, C.W.; Yi, W.J.; Jeon, B.; Park, K.S. Validation of freezing-of-gait monitoring using smartphone. Telemed. e-Health 2018, 24, 899–907. [Google Scholar] [CrossRef]
- Kim, J.; Colabianchi, N.; Wensman, J.; Gates, D.H. Wearable Sensors Quantify Mobility in People With Lower Limb Amputation During Daily Life. IEEE Trans. Neural Syst. Rehabil. Eng. 2020, 28, 1282–1291. [Google Scholar] [CrossRef]
- Kleiner, A.F.R.; Pacifici, I.; Vagnini, A.; Camerota, F.; Celletti, C.; Stocchi, F.; De Pandis, M.F.; Galli, M. Timed up and go evaluation with wearable devices: Validation in Parkinson’s disease. J. Bodyw. Mov. Ther. 2018, 22, 390–395. [Google Scholar] [CrossRef]
- Kobsar, D.; Osis, S.T.; Boyd, J.E.; Hettinga, B.A.; Ferber, R. Wearable sensors to predict improvement following an exercise intervention in patients with knee osteoarthritis. J. Neuroeng. Rehabil. 2017, 14, 94. [Google Scholar] [CrossRef] [Green Version]
- Kozey-Keadle, S.; Libertine, A.; Lyden, K.; Staudenmayer, J.; Freedson, P.S. Validation of wearable monitors for assessing sedentary behavior. Med. Sci. Sport. Exerc. 2011, 43, 1561–1567. [Google Scholar] [CrossRef] [PubMed] [Green Version]
- Lemay, J.F.; Noamani, A.; Unger, J.; Houston, D.J.; Rouhani, H.; Musselmann, K.E. Using wearable sensors to characterize gait after spinal cord injury: Evaluation of test—retest reliability and construct validity. Spinal Cord 2020, 59, 675–683. [Google Scholar] [CrossRef]
- Lemoyne, R.; Mastroianni, T. Implementation of a smartphone as a wireless accelerometer platform for quantifying hemiplegic gait disparity in a functionally autonomous context. J. Mech. Med. Biol. 2018, 18, 1850005. [Google Scholar] [CrossRef]
- Lipsmeier, F.; Taylor, K.I.; Kilchenmann, T.; Wolf, D.; Scotland, A.; Schjodt-Eriksen, J.; Cheng, W.Y.; Fernandez-Garcia, I.; Siebourg-Polster, J.; Jin, L.; et al. Evaluation of smartphone-based testing to generate exploratory outcome measures in a phase 1 Parkinson’s disease clinical trial. Mov. Disord. 2018, 33, 1287–1297. [Google Scholar] [CrossRef]
- Maqbool, H.F.; Husman, M.A.B.; Awad, M.I.; Abouhossein, A.; Iqbal, N.; Dehghani-Sanij, A.A. A real-time gait event detection for lower limb prosthesis control and evaluation. IEEE Trans. Neural Syst. Rehabil. Eng. 2016, 25, 1500–1509. [Google Scholar] [CrossRef]
- McGinnis, R.S.; Mahadevan, N.; Moon, Y.; Seagers, K.; Sheth, N.; Wright, J.A., Jr.; DiCristofaro, S.; Silva, I.; Jortberg, E.; Ceruolo, M.; et al. A machine learning approach for gait speed estimation using skin-mounted wearable sensors: From healthy controls to individuals with multiple sclerosis. PLoS ONE 2017, 12, e0178366. [Google Scholar] [CrossRef]
- Meisel, C.; El Atrache, R.; Jackson, M.; Schubach, S.; Ufongene, C.; Loddenkemper, T. Machine learning from wristband sensor data for wearable, noninvasive seizure forecasting. Epilepsia 2020, 61, 2653–2666. [Google Scholar] [CrossRef] [PubMed]
- Mileti, I.; Germanotta, M.; Di Sipio, E.; Imbimbo, I.; Pacilli, A.; Erra, C.; Petracca, M.; Rossi, S.; Del Prete, Z.; Bentivoglio, A.R.; et al. Measuring gait quality in Parkinson’s disease through real-time gait phase recognition. Sensors 2018, 18, 919. [Google Scholar] [CrossRef] [PubMed] [Green Version]
- Munguía-Izquierdo, D.; Santalla, A.; Legaz-Arrese, A. Evaluation of a wearable body monitoring device during treadmill walking and jogging in patients with fibromyalgia syndrome. Arch. Phys. Med. Rehabil. 2012, 93, 115–122. [Google Scholar] [CrossRef]
- Na, A.; Buchanan, T.S. Validating wearable sensors using self-reported instability among patients with knee osteoarthritis. PM&R 2021, 13, 119–127. [Google Scholar]
- Newman, M.A.; Hirsch, M.A.; Peindl, R.D.; Habet, N.A.; Tsai, T.J.; Runyon, M.S.; Huynh, T.; Phillips, C.; Zheng, N.; Group, C.T.N.R.; et al. Use of an instrumented dual-task timed up and go test in children with traumatic brain injury. Gait Posture 2020, 76, 193–197. [Google Scholar] [CrossRef]
- Pavon, J.M.; Sloane, R.J.; Pieper, C.F.; Colón-Emeric, C.S.; Cohen, H.J.; Gallagher, D.; Hall, K.S.; Morey, M.C.; McCarty, M.; Hastings, S.N. Accelerometer-Measured Hospital Physical Activity and Hospital-Acquired Disability in Older Adults. J. Am. Geriatr. Soc. 2020, 68, 261–265. [Google Scholar] [CrossRef] [PubMed]
- Raknim, P.; Lan, K.C. Gait monitoring for early neurological disorder detection using sensors in a smartphone: Validation and a case study of parkinsonism. Telemed. e-Health 2016, 22, 75–81. [Google Scholar] [CrossRef] [Green Version]
- Revi, D.A.; Alvarez, A.M.; Walsh, C.J.; De Rossi, S.M.; Awad, L.N. Indirect measurement of anterior-posterior ground reaction forces using a minimal set of wearable inertial sensors: From healthy to hemiparetic walking. J. Neuroeng. Rehabil. 2020, 17, 82. [Google Scholar] [CrossRef]
- Rogan, S.; de Bie, R.; de Bruin, E.D. Sensor-based foot-mounted wearable system and pressure sensitive gait analysis. Z. Gerontol. Geriatr. 2017, 50, 488–497. [Google Scholar] [CrossRef]
- Rubin, D.S.; Dalton, A.; Tank, A.; Berkowitz, M.; Arnolds, D.E.; Liao, C.; Gerlach, R.M. Development and pilot study of an iOS smartphone application for perioperative functional capacity assessment. Anesth. Analg. 2020, 131, 830–839. [Google Scholar] [CrossRef] [PubMed]
- Salarian, A.; Horak, F.B.; Zampieri, C.; Carlson-Kuhta, P.; Nutt, J.G.; Aminian, K. iTUG, a sensitive and reliable measure of mobility. IEEE Trans. Neural Syst. Rehabil. Eng. 2010, 18, 303–310. [Google Scholar] [CrossRef] [PubMed] [Green Version]
- Schließmann, D.; Nisser, M.; Schuld, C.; Gladow, T.; Derlien, S.; Heutehaus, L.; Weidner, N.; Smolenski, U.; Rupp, R. Trainer in a pocket-proof-of-concept of mobile, real-time, foot kinematics feedback for gait pattern normalization in individuals after stroke, incomplete spinal cord injury and elderly patients. J. Neuroeng. Rehabil. 2018, 15, 44. [Google Scholar] [CrossRef] [Green Version]
- Schwenk, M.; Hauer, K.; Zieschang, T.; Englert, S.; Mohler, J.; Najafi, B. Sensor-derived physical activity parameters can predict future falls in people with dementia. Gerontology 2014, 60, 483–492. [Google Scholar] [CrossRef] [Green Version]
- Schwenk, M.; Grewal, G.S.; Holloway, D.; Muchna, A.; Garland, L.; Najafi, B. Interactive sensor-based balance training in older cancer patients with chemotherapy-induced peripheral neuropathy: A randomized controlled trial. Gerontology 2016, 62, 553–563. [Google Scholar] [CrossRef]
- Shema-Shiratzky, S.; Hillel, I.; Mirelman, A.; Regev, K.; Hsieh, K.L.; Karni, A.; Devos, H.; Sosnoff, J.J.; Hausdorff, J.M. A wearable sensor identifies alterations in community ambulation in multiple sclerosis: Contributors to real-world gait quality and physical activity. J. Neurol. 2020, 26, 1912–1921. [Google Scholar] [CrossRef] [PubMed]
- Sprint, G.; Cook, D.J.; Weeks, D.L.; Borisov, V. Predicting functional independence measure scores during rehabilitation with wearable inertial sensors. IEEE Access 2015, 3, 1350–1366. [Google Scholar] [CrossRef] [PubMed]
- Terrier, P.; Le Carré, J.; Connaissa, M.L.; Léger, B.; Luthi, F. Monitoring of gait quality in patients with chronic pain of lower limbs. IEEE Trans. Neural Syst. Rehabil. Eng. 2017, 25, 1843–1852. [Google Scholar] [CrossRef]
- Teufl, W.; Taetz, B.; Miezal, M.; Lorenz, M.; Pietschmann, J.; Jöllenbeck, T.; Fröhlich, M.; Bleser, G. Towards an inertial sensor-based wearable feedback system for patients after total hip arthroplasty: Validity and applicability for gait classification with gait kinematics-based features. Sensors 2019, 19, 5006. [Google Scholar] [CrossRef] [Green Version]
- Ullrich, M.; Küderle, A.; Hannink, J.; Del Din, S.; Gaßner, H.; Marxreiter, F.; Klucken, J.; Eskofier, B.M.; Kluge, F. Detection of gait from continuous inertial sensor data using harmonic frequencies. IEEE J. Biomed. Health Inform. 2020, 24, 1869–1878. [Google Scholar] [CrossRef] [Green Version]
- Ummels, D.; Beekman, E.; Theunissen, K.; Braun, S.; Beurskens, A.J. Counting steps in activities of daily living in people with a chronic disease using nine commercially available fitness trackers: Cross-sectional validity study. JMIR mHealth uHealth 2018, 6, e70. [Google Scholar] [CrossRef]
- Vadnerkar, A.; Figueiredo, S.; Mayo, N.E.; Kearney, R.E. Design and validation of a biofeedback device to improve heel-to-toe gait in seniors. IEEE J. Biomed. Health Informatics 2017, 22, 140–146. [Google Scholar] [CrossRef]
- Wang, C.; Goel, R.; Noun, M.; Ghanta, R.K.; Najafi, B. Wearable Sensor-Based Digital Biomarker to Estimate Chest Expansion During Sit-to-Stand Transitions–A Practical Tool to Improve Sternal Precautions in Patients Undergoing Median Sternotomy. IEEE Trans. Neural Syst. Rehabil. Eng. 2019, 28, 165–173. [Google Scholar] [CrossRef]
- Wüest, S.; Masse, F.; Aminian, K.; Gonzenbach, R.; De Bruin, E.D. Reliability and validity of the inertial sensor-based Timed “Up and Go” test in individuals affected by stroke. J. Rehabil. Res. Dev. 2016, 53, 599–610. [Google Scholar] [CrossRef] [PubMed]
- Zhai, Y.; Nasseri, N.; Pöttgen, J.; Gezhelbash, E.; Heesen, C.; Stellmann, J.P. Smartphone accelerometry: A smart and reliable measurement of real-life physical activity in multiple sclerosis and healthy individuals. Front. Neurol. 2020, 11, 688. [Google Scholar] [CrossRef]
- Keogh, A.; Taraldsen, K.; Caulfield, B.; Vereijken, B. It’s not about the capture, it’s about what we can learn”: A qualitative study of experts’ opinions and experiences regarding the use of wearable sensors to measure gait and physical activity. J. Neuroeng. Rehabil. 2021, 18, 78. [Google Scholar] [CrossRef] [PubMed]
- Martindale, C.F.; Roth, N.; Hannink, J.; Sprager, S.; Eskofier, B.M. Smart annotation tool for multi-sensor gait-based daily activity data. In Proceedings of the 2018 IEEE International Conference on Pervasive Computing and Communications Workshops (PerCom Workshops), Athens, Greece, 19–23 March 2018; pp. 549–554. [Google Scholar]
- Ordóñez, F.J.; Roggen, D. Deep convolutional and lstm recurrent neural networks for multimodal wearable activity recognition. Sensors 2016, 16, 115. [Google Scholar] [CrossRef] [PubMed] [Green Version]
- Truong, A.; Walters, A.; Goodsitt, J.; Hines, K.; Bruss, C.B.; Farivar, R. Towards automated machine learning: Evaluation and comparison of AutoML approaches and tools. In Proceedings of the 2019 IEEE 31st International Conference on Tools with Artificial Intelligence (ICTAI), Portland, OR, USA, 4–6 November 2019; pp. 1471–1479. [Google Scholar]
- Lundberg, S.M.; Erion, G.; Chen, H.; DeGrave, A.; Prutkin, J.M.; Nair, B.; Katz, R.; Himmelfarb, J.; Bansal, N.; Lee, S.I. From local explanations to global understanding with explainable AI for trees. Nat. Mach. Intell. 2020, 2, 2522–5839. [Google Scholar] [CrossRef] [PubMed]
- Rawassizadeh, R.; Pierson, T.J.; Peterson, R.; Kotz, D. NoCloud: Exploring network disconnection through on-device data analysis. IEEE Pervasive Comput. 2018, 17, 64–74. [Google Scholar] [CrossRef]
- Dobbins, C.; Rawassizadeh, R. Towards clustering of mobile and smartwatch accelerometer data for physical activity recognition. Informatics 2018, 5, 29. [Google Scholar] [CrossRef] [Green Version]
- Vallati, C.; Virdis, A.; Gesi, M.; Carbonaro, N.; Tognetti, A. ePhysio: A wearables-enabled platform for the remote management of musculoskeletal diseases. Sensors 2019, 19, 2. [Google Scholar] [CrossRef] [Green Version]
- Park, S.J.; Hussain, I.; Hong, S.; Kim, D.; Park, H.; Benjamin, H.C.M. Real-time Gait Monitoring System for Consumer Stroke Prediction Service. In Proceedings of the 2020 IEEE International Conference on Consumer Electronics (ICCE), Las Vegas, NV, USA, 4–6 January 2020; pp. 1–4. [Google Scholar]
- Jourdan, T.; Boutet, A.; Frindel, C. Toward privacy in IoT mobile devices for activity recognition. In Proceedings of the 15th EAI International Conference on Mobile and Ubiquitous Systems: Computing, Networking and Services (MobiQuitous), New York, NY, USA, 5–7 November 2018; pp. 155–165. [Google Scholar]
- Debs, N.; Jourdan, T.; Moukadem, A.; Boutet, A.; Frindel, C. Motion sensor data anonymization by time-frequency filtering. In Proceedings of the 2020 28th European Signal Processing Conference (EUSIPCO), Amsterdam, The Netherlands, 18–21 January 2021; pp. 1707–1711. [Google Scholar]
- Sozinov, K.; Vlassov, V.; Girdzijauskas, S. Human activity recognition using federated learning. In Proceedings of the 2018 IEEE Intl Conf on Parallel & Distributed Processing with Applications, Ubiquitous Computing & Communications, Big Data & Cloud Computing, Social Computing & Networking, Sustainable Computing & Communications (ISPA/IUCC/BDCloud/SocialCom/SustainCom), Melbourne, Australia, 11–13 December 2018; pp. 1103–1111. [Google Scholar]
- Bzdok, D.; Altman, N.; Krzywinski, M. Points of Significance: Statistics Versus Machine Learning. Nat. Methods 2018, 15, 233–234. [Google Scholar] [CrossRef]


| Acquisition Time | t < 1 h | 1 ≤ t < 24 h | 1 ≤ t < 7 d | 1 ≤ t < 4 w | 1 ≤ t < 12 m | t ≤ 1 y |
|---|---|---|---|---|---|---|
| Laboratory (N = 53) | 46 | 3 | 0 | 1 | 2 | 1 |
| Free Living (N = 17) | 1 | 1 | 1 | 8 | 3 | 3 |
| Author | No. of Device(s) | Sensor Type(s) | Location of Device(s) | Sensor Model, Brand |
|---|---|---|---|---|
| Salarian et al. [90] | 7 (IMU) | A,G | Forearms, shanks, thighs, sternum | Physilogs, BioAGM |
| Dobkin et al. [53] | 2 (S) | A | Both ankles | GCDC, LLC |
| Kozey-Keadle et al. [74] | 2 (S) | A | Right leg, right side of the hip | activPAL, PALF GT3X, ActiGraph |
| Munguía-Izquierdo et al. [82] | 1 (IMU) | A,O | Arm | SenseWear, Bodymedia |
| Item-Glatthorn et al. [65] | 5 (S) | A | Chest, thigh, forefoot | MiniSun, IDEEA |
| Grimpampi et al. [61] | 1 (IMU) | A,G | Lumbar spine | Freesense, Sensorize |
| Schwenk et al. [92] | 1 (IMU) | A,G | Chest | Physilog, GaitUp |
| Juen et al. [68] | 1 (SPHN) | A | Pants pocket or fanny pack | Galaxy Ace, Samsung |
| Juen et al. [69] | 2 (SPHN and S) | A | L3 vertebra | Galaxy Ace/4, Samsung |
| Sprint et al. [95] | 3 (IMU) | A,G | Lumbar spine, shank | Shimmer3, Shimmer |
| Capela et al. [43] | 1 (SPHN) | A,G,M | Rear pocket | Z10, BlackBerry |
| Schwenk et al. [93] | 5 (IMU) | A,G,M | Shank, thigh, lower back | LegSys, BioSensic |
| Isho et al. [64] | 1 (SPHN) | A | Torso | Xperia Ray SO-03C, Sony |
| Wuest et al. [102] | 8 (IMU) | A,G | Wrists, shanks, trunk, feet, back | Physilog, GaitUp |
| Raknim et al. [86] | 1 (SPHN) | A | Free (pocket, during phone call, on the bag during walk) | HTC and Samsung |
| Ferrari et al. [57] | 2 (IMU) | A,G | Shoes | EXLs1 and EXLs3, EXEL |
| Brinkløv et al. [42] | 1 (SPHN) | A | Pants pocket, jacket pocket | Iphone 5C, Apple |
| El-Gohary et al. [54] | 3 (IMU) | A,G | Lumbar vertebra, feet, ankles | Opal, APDM |
| Ilias et al. [63] | 4 (IMU) | A,G | Upper, lower limbs, wrists, legs | Shimmer3, Shimmer |
| Maqbool et al. [78] | 1 (IMU) | A,G | Shank | MPU 6050, InvenSense |
| Terrier et al. [96] | 1 (S) | A | Right hip | wGT3X-BT, ActiGraph |
| Rogan et al. [88] | 1 (IMU) | A,G | Lateral malleolus | RehaWatch, Hasomed |
| Chiu et al. [47] | 1 (SPHN) | A | Shin | Zenfone 2, ASUS |
| Cheng et al. [45] | 1 (SPHN) | A | Carried in fanny pack | Galaxy S5, Samsung Optimus Zone2, LG |
| Kobsar et al. [73] | 4 (IMU) | A,G | Foot, shank, thigh, lower back | iNEMO, STmicroelectronics |
| McGinnis et al. [79] | 5 (IMU) | A | Sacrum, thighs, shanks | BioStampRC, MC10 |
| Lipsmeier et al. [77] | 1 (SPHN) | A,G,M,O | Hand, trouser pocket, belt | Galaxy S3 mini, Samsung |
| Kleiner et al. [72] | 1 (IMU) | A,G,M | L5 verterbra | BTS G-walk, BTS G-Sensor |
| Carpinella et al. [44] | 1 (IMU) | A,G,M | Sternum | MTw, Xsens |
| Jayaraman et al. [67] | 4 (S) | A,O | Arm, waist, ankle | wGT3X-BT, ActiGraph Metria-IH1, Vandrico |
| Jang et al. [66] | 1 (IMU) | A,O | Wrist | Mi band 2, Xiaomi |
| Derungs et al. [52] | 6 (IMU) | A,G,M | Wrists, arms, thighs | Shimmer3, Shimmer |
| Mileti et al. [81] | 10 (IMU and S) | A,G,M,O | Feet | Mtw, MTw, Xsens |
| Aich et al. [35] | 2 (S) | A | Knees | Fit Meter, Fit.Life |
| Cheong et al. [46] | 1 (IMU) | A | Wrists | Urban S, Partron Co |
| Ata et al. [40] | 2 (SPHN and S) | A | Hand, hip | iPhones SE/6/7/7+, Apple GT9X, ActiGraph |
| Kim et al. [70] | 3 (SPHN) | A,G | Waist, pocket, ankle | Nexus 5, Google |
| Vadnerkar et al. [100] | 1 (IMU) | A,G | Feet | Shimmer 2r, Shimmer |
| Rosario et al. [51] | 1 (SPHN) | A,G | Trouser pocket | Galaxy S3, Samsung |
| Lemoyne et al. [76] | 1 (SPHN) | A | Malleolus | iPhone, Apple |
| Dasmahapatra et al. [50] | 1 (S) | A | Belt, pocket, or bra | Fitbit One, Fitbit |
| Schliessmann et al. [91] | 2 (IMU) | A,G,M | Feet | RehaGait, HASOMED GmbH |
| Ummels et al. [99] | 9 (IMU and S) | other | Leg, belt, wrist | UP24, Jawbone Lumoback, Lumo Bodytech Moves, ProtoGeo Oy Accupedo, Corusen LLC Walking Style X, Omron |
| Banky et al. [41] | 1 (SPHN) | G | Galaxy S5, Samsung | |
| Flachenecker et al. [58] | 2 (IMU) | A,G | Shoes | Shimmer 3, Shimmer |
| Gadaleta et al. [60] | 3 (IMU) | A,G,M | L5 lumbar vertebrae, ankles | Opal, APDM |
| Teufl et al. [97] | 7 (IMU) | A,G | Pelvis, both foot, both thighs | MTw Awinda, Xsens |
| Angelini et al. [37] | 3 (IMU) | A,G | L5 lumbar vertebra, ankles | MTw Xsens Opal, APDM |
| Antos et al. [38] | 2 (S and SPHN) | A,G | Waist, wrist | Nexus 5, Google wGT3X-BT, Actigraph |
| Compagnat et al. [48] | 9 (S) | A,O | Wrists, ankles, hip, arm, neck | GT3x, Actigraph Sensewear, Body Media |
| Newman et al. [84] | 1 (IMU) | A,G | Interclavicular notch | Opal, APDM |
| Ullrich et al. [98] | 3 IMU | A,G | Ankles, shoes | Shimmer2R, Shimmer |
| Wang et al. [101] | 2 (IMU) | A,G | Pectoralis major | BioStampRC, MC10 |
| Pavon et al. [85] | 2 (S) | A | Ankle | GT3x+, ActiGraph |
| Arcuria et al. [39] | 1 (SPHN) | A | Breastbone | Galaxy J3, Samsung |
| Erb et al. [55] | 7 to 16 (IMU) | A,G,M,O | Wrists, torso, thigh, feet | Shimmer, Shimmer |
| Aich et al. [36] | 2 (S) | A | Knees | Fit Meter, Fit. Life |
| Rubin et al. [89] | 1 (SPHN) | A,G | Pants pocket, belt | iPhone 6, Apple |
| Henriksen et al. [62] | 1 (IMU) | A,O | Wrist | M430 AT, Polar |
| Shema-Shiratzky et al. [94] | 1 (IMU) | A | Lower Back | Opal, APDM and AX3, Axivity |
| Abdollahi et al. [34] | 1 (IMU) | A,G | Sternum | 9DOF Razor IMU, Sparkfun |
| Kim et al. [71] | 2 (IMU) | A,G | Shoe, ankle | GT9X Link, ActiGraph |
| Lemay et al. [75] | 5 (IMU) | A,G,O | Feet, shanks, sacrum | Physilog, GaitUp |
| Meisel et al. [80] | 1 (S) | A,O | Wrist or ankle | E4, Empatica |
| Fantozzi et al. [56] | 5 (IMU) | A,G,M | Trunk, pelvis, thigh, shank, foot | Opal, APDM |
| Zhai et al. [103] | 2 (SPHN and S) | A | Wrist, pocket | Galaxy S4 mini, Samsung GT3X+, ActiGraph |
| Revi et al. [87] | 3 (IMU) | A | Shank, thigh, pelvis | MTw Awinda, Xsens |
| Compagnat et al. [49] | 2 (S) | A | Non-paretic hip | GT3x, ActiGraph |
| Furtado et al. [59] | 1 (S) | A | L5 lumbar vertebrae within the pocket of a belt | AX3, Axivity |
| Na et al. [83] | 5 (IMU) | A,G | Femur, tibia, pelvis, sacral ridge | 3D Myomotion, Noraxon |
| Device Type | Sensor Type | ||
|---|---|---|---|
| IMU | 39 | Accelerometer | 39 (100%) |
| Gyroscope | 30 (77%) | ||
| Magnetometer | 8 (20%) | ||
| Others | 7 (18%) | ||
| Sensors | 17 | Accelerometer | 14 (82%) |
| Gyroscope | 1 (0.7%) | ||
| Magnetometer | 1 (0.7%) | ||
| Others | 4 (3%) | ||
| Smartphones | 18 | Accelerometer | 17 (94%) |
| Gyroscope | 7 (38%) | ||
| Magnetometer | 2 (11%) | ||
| Others | 1 (5%) | ||
| Superior | Inferior | Chest | Free |
|---|---|---|---|
| 12 | 42 | 34 | 12 |
| Low Level | Medium Level | High Level | |||
|---|---|---|---|---|---|
| Total | 6 | Total | 20 | Total | 49 |
| Magnitude mean | 11 | Step length | 20 | ||
| Magnitude standard deviation | 10 | Number of steps | 18 | ||
| Peak frequency | 9 | Cadence | 15 | ||
| Mean crossing rate | 5 | Speed | 11 |
| Author | Ground-Truth Method | Gait Descriptors | # of Descriptors | Evaluation Method | Evaluation Outcomes |
|---|---|---|---|---|---|
| Salarian et al. [90] | controls, medical | high | 20 | stats + test | p-value < 0.023 |
| Dobkin et al. [53] | controls, metrologic | medium | 8 | ML + test | r = 0.98 |
| Kozey-Keadle et al. [74] | expert | high | 3 | stats | = 0.94 |
| Munguía-Izquierdo et al. [82] | med device | high | 1 | stats + test | r = 0.87–0.99 |
| Item-Glatthorn et al. [65] | metrologic | high | 6 | stats + test | = 0.815–0.997 |
| Grimpampi et al. [61] | metrologic | low, medium | 3 | stats + test | r = 0.74–0.87 |
| Schwenk et al. [92] | controls, user | high | 9 | stats + test | = 0.77, sen/spe = 72%/76% |
| Juen et al. [68] | medical | medium | 8 | ML | acc = 89.22–94.13% |
| Juen et al. [69] | med device | medium | 9 | ML | error < 10.2% |
| Sprint et al. [95] | medical | medium,high | 18 | ML + test | r = 0.97 |
| Capela et al. [43] | expert | high | 10 | stats | time difference = 0.014 s |
| Schwenk et al. [93] | controls, user | high | 6 | LM + test | p-value < 0.022 |
| Isho et al. [64] | controls, user | medium | 3 | ML + test | = 0.745 |
| Wuest et al. [102] | controls, medical | high | 13 | stats + test | p-value < 0.02 |
| Raknim et al. [86] | controls | high | 2 | ML | acc = 94% |
| Ferrari et al. [57] | metrologic | high | 4 | LM + test | error = 2.9% |
| Brinkløv et al. [42] | med device | medium | 6 | LM + test | = 0.45–0.60 |
| El-Gohary et al. [54] | metrologic, controls | high | 7 | stats + test | r = 0.592–0.992 |
| Ilias et al. [63] | expert | medium | 152 | ML + test | r = 0.78–0.79 |
| Maqbool et al. [78] | metrologic, controls | high | 1 | stats | time difference = 50 ms |
| Terrier et al. [96] | controls, medical | high | 4 | LM + stats | = 0.44 |
| Rogan et al. [88] | metrologic | high | 6 | stats + test | p-value < 0.05 |
| Chiu et al. [47] | controls | medium | 1 | stats + test | p-value < 0.027 |
| Cheng et al. [45] | med device, medical | medium,high | 10 | ML | NA |
| Kobsar et al. [73] | medical | medium | 38 | LM + test | acc = 74–81.7% |
| McGinnis et al. [79] | metrologic, controls | medium | 32 | ML + test | speed difference = 0.12–0.16 m/s |
| Lipsmeier et al. [77] | controls, medical | high | 6 | ML + test | p-value < 0.055 |
| Kleiner et al. [72] | metrologic, medical | high | 1 | stats | time difference = 0.585 s |
| Carpinella et al. [44] | medical, controls | high | 5 | stats + test | r = −0.367–0.536 |
| Jayaraman et al. [67] | expert, metrologic | high | 3 | stats + test | p-value < 0.05 |
| Jang et al. [66] | controls | high | 5 | stats + test | p-value < 0.02 |
| Derungs et al. [52] | expert | medium | 8 | LM + test | sen/spe = 80%/94% |
| Mileti et al. [81] | controls, medical | low | 3 | ML + test | = 0.48–0.98 |
| Aich et al. [35] | metrologic, controls | high | 28 | ML | acc = 88% |
| Cheong et al. [46] | controls | high | 1 | stats + test | p-value < 0.04 |
| Ata et al. [40] | expert, med device | high | 3 | stats | = 0.9–0.92 |
| Kim et al. [70] | expert | medium | 8 | ML | sen/spe = 93.8%/90.1% |
| Vadnerkar et al. [100] | expert | low | 1 | LM + test | acc = 84%, sen/spe = 75.9%/95.9% |
| Rosario et al. [51] | controls, medical | high | 2 | stats + test | r = 0.472 |
| Lemoyne et al. [76] | controls | high | 5 | stats + test | p-value < 0.05 |
| Dasmahapatra et al. [50] | controls, medical | high | 6 | LM + test | p-value < 0.05 |
| Schliessmann et al. [91] | controls | high | 4 | stats + test | p-value < 0.05 |
| Ummels et al. [99] | metrologic | high | 1 | stats + test | r = −0.02–0.33 |
| Banky et al. [41] | metrologic, controls | low | 3 | stats + test | r=0.8 |
| Flachenecker et al. [58] | controls, medical | high | 8 | stats + test | r = −0.583–0.668 |
| Gadaleta et al. [60] | metrologic | low | 24 | ML | bias = −0.012–0.000, IQR = 0.004–0.032 |
| Teufl et al. [97] | metrologic, controls | high | 10 | ML + test | acc = 0.87–0.97 |
| Angelini et al. [37] | expert, controls | high | 14 | stats + test | p-value < 0.05 |
| Antos et al. [38] | expert, controls | medium | 56 | ML + test | acc = 0.90–0.95 |
| Compagnat et al. [48] | expert | high | 2 | stats + test | p-value < 0.05 |
| Newman et al. [84] | controls, medical | high | 9 | stats + test | p-value < 0.05 |
| Ullrich et al. [98] | expert | medium | 7 | stats + test | sen/spe = 98%/96% |
| Wang et al. [101] | controls | medium | 1 | stats + test | p-value < 0.05 |
| Pavon et al. [85] | controls, medical | high | 3 | stats + test | p-value < 0.16 |
| Arcuria et al. [39] | metrologic, controls, medical | high | 1 | stats + test | r = −0.72–0.91 |
| Erb et al. [55] | user, expert | high | 2 | stats + test | FN = 35%, FP = 15% |
| Aich et al. [36] | metrologic, controls, medical | high | 5 | ML | acc = 88.46% |
| Rubin et al. [89] | med device | high | 1 | stats + test | = 0.72 |
| Henriksen et al. [62] | med device | high | 4 | stats | r = 0.446–0.925 |
| Shema-Shiratzky et al. [94] | controls, expert | high | 5 | stats + test | p-value < 0.05 |
| Abdollahi et al. [34] | medical | medium | 920 | ML | acc = 60–75% |
| Kim et al. [71] | controls | high | 5 | stats + test | p < 0.05 |
| Lemay et al. [75] | medical, controls | high | 6 | LM + test | r = −0.49–0.498 |
| Meisel et al. [80] | expert | low | 6 | ML + test | acc = 43% |
| Fantozzi et al. [56] | controls | high | 14 | LM + test | NA |
| Zhai et al. [103] | med device, controls, medical | medium | 14 | stats + test | r = 0.43–0.605 |
| Revi et al. [87] | metrologic | high | 8 | stats | = 0.90–0.93 |
| Compagnat et al. [49] | med device | high | 1 | stats + test | r = 0.44–0.87 |
| Furtado et al. [59] | metrologic, controls, medical | medium,high | 10 | stats + test | p-value < 0.024 |
| Na et al. [83] | metrologic, controls | high | 6 | stats + test | p-value < 0.04 |
| Author | Task | Model Type | Training Size | # of Descriptors | Outcome |
|---|---|---|---|---|---|
| Dobkin et al. [53] | Speed prediction | Naive Bayes | NA | 24 | r = 0.98 |
| Juen et al. [68] | Healthy/patient | SVM | 10–20 | 8 | accuracy = 89.22–94.13% |
| Juen et al. [69] | Speed prediction Distance prediction | GPR NN SVM | 24 | 60 | error rate = 2.51% error rate = 10.2% |
| Sprint et al. [95] | FIM motor score prediction | SVM RF | 19 | 18 | NRMSE = 10–30% |
| Raknim et al. [86] | Step length estimation Before/after PD | SVM | 1 | 2 | accuracy = 98% accuracy = 94% |
| Ilias et al. [63] | Motor function prediction | SVM | 6 | 152 | RMSE = 0.46-0.70 r = 0.78–0.79 |
| Cheng et al. [45] | 3 pulmonary severity stages | SVM | 22–25 | 10 | NA |
| McGinnis et al. [79] | Walking speed | SVM | 16 | 32 | RMSE = 10–20% |
| Lipsmeier et al. [77] | Activities | LSTM | 44 | 6 (*n) | accuracy = 98% |
| Mileti et al. [81] | 4 gait phases | HMM | 1–11 | 3 (*n) | = 0.48–0.98 sens= 80–100% spe = 70–90% |
| goodness Index = 10–40% | |||||
| Aich et al. [35] | Healthy/patient | SVM Decision tree Naive Bayes kNN | 36 | 28 | accuracy=91.42% sens/spe = 90.9%/91.2% |
| Kim et al. [70] | Walking/freezing | CNN | 29 | 8 (*n) | f1-score = 91.8 sen/spe = 93.8%/90.1% |
| Vadnerkar et al. [100] | Gait quality | ROC decision boundary | 8 | 1 | accuracy = 84% sen/spe = 75.9%/95.9% |
| Gadaleta et al. [60] | Right/left foot events | CNN | 138 | 24 (*n) | bias = −0.012–0.000 IQR = 0.004–0.032 |
| Teufl et al. [97] | Healthy/patient | SVM | 40 | 10 | accuracy = 87–97% |
| Antos et al. [38] | With/without assistance | RF SVM Naive Bayes Logistic regression LDA | 1–13 | 56 | accuracy = 90–95% |
| Aich et al. [36] | Healthy/patient | kNN SVM Naive Bayes Decision tree | 62 | 10 | accuracy = 88.5% sens/spe = 92.9%/90.9% |
| Abdollahi et al. [34] | Risk of disability | SVM Perceptron | 93 | 920 | accuracy = 60–75% |
| Meisel et al. [80] | Seizure/healthy | LSTM | 68 | 6 (*n) | accuracy = 43% |
| Number of Studies | <10 | 10–100 | >100 |
|---|---|---|---|
| Statistical | 43 | 8 | 0 |
| ML | 3 | 9 | 7 |
| Author | Year | Pathology | Cohort Size | Duration of Data Collection | Condition Data Collection |
|---|---|---|---|---|---|
| Salarian et al. [90] | 2010 | Parkinson | 12 | min | Laboratory |
| Dobkin et al. [53] | 2011 | Stroke | 12 | min (Lab), days (FL) | Both |
| Kozey-Keadle et al. [74] | 2011 | Obesity | 20 | hours | Free living |
| Munguía-Izquierdo et al. [82] | 2012 | Fibromyalgia | 25 | min | Laboratory |
| Item-Glatthorn et al. [65] | 2012 | Osteoarthritis | 26 | min | Laboratory |
| Grimpampi et al. [61] | 2013 | Hemiplegia/Parkinson | 24 | min | Laboratory |
| Schwenk et al. [92] | 2014 | Dementia | 77 | days | Free living |
| Juen et al. [68] | 2014 | Lung disease | 30 | min | Laboratory |
| Juen et al. [69] | 2014 | Lung disease | 25 | min | Laboratory |
| Sprint et al. [95] | 2015 | Diverse | 20 | min | Laboratory |
| Capela et al. [43] | 2015 | Lung disease | 15 | min | laboratory |
| Schwenk et al. [93] | 2016 | Cancer | 22 | hours | laboratory |
| Isho et al. [64] | 2015 | Stroke | 24 | min | Laboratory |
| Wuest et al. [102] | 2016 | Stroke | 26 | min | Laboratory |
| Raknim et al. [86] | 2016 | Parkinson | 1 | years | Free living |
| Ferrari et al. [57] | 2016 | Parkinson | 14 | min | Laboratory |
| Brinkløv et al. [42] | 2016 | Diabete | 27 | min | Laboratory |
| El-Gohary et al. [54] | 2017 | Multiple sclerosis | 52 | min | Laboratory |
| Ilias et al. [63] | 2017 | Parkinson | 19 | min | Laboratory |
| Maqbool et al. [78] | 2017 | Amputee | 2 | min | Laboratory |
| Terrier et al. [96] | 2017 | Chronic Pain | 66 | weeks | Both |
| Rogan et al. [88] | 2017 | Old Age | 23 | min | Laboratory |
| Chiu et al. [47] | 2017 | Ankle instability | 15 | min | Laboratory |
| Cheng et al. [45] | 2017 | Cardiopulmonary disease | 25 | min | Laboratory |
| Kobsar et al. [73] | 2017 | Osteoarthritis | 39 | months | Laboratory |
| McGinnis et al. [79] | 2017 | Multiple sclerosis | 30 | min | Laboratory |
| Lipsmeier et al. [77] | 2018 | Parkinson | 44 | months | Free living |
| Kleiner et al. [72] | 2018 | Parkinson | 30 | min | Laboratory |
| Carpinella et al. [44] | 2018 | Diverse | 30 | min | Laboratory |
| Jayaraman et al. [67] | 2018 | Spinal Cord Injury | 18 | hours | Laboratory |
| Jang et al. [66] | 2018 | Old Age | 22 | years | Free living |
| Derungs et al. [52] | 2018 | Hemiparesis | 11 | weeks | Free living |
| Mileti et al. [81] | 2018 | Parkinson | 26 | min | Laboratory |
| Aich et al. [35] | 2018 | Parkinson | 51 | min | Laboratory |
| Cheong et al. [46] | 2018 | Cancer | 102 | months | Free living |
| Ata et al. [40] | 2018 | Artery disease | 114 | min | Laboratory |
| Kim et al. [70] | 2018 | Parkinson | 32 | min | Laboratory |
| Vadnerkar et al. [100] | 2018 | Old Age | 16 | min | Laboratory |
| Rosario et al. [51] | 2018 | Cardiac disease | 66 | months | Free living |
| Lemoyne et al. [76] | 2018 | Hemiplegia | 1 | min | Laboratory |
| Dasmahapatra et al. [50] | 2018 | Multiple Sclerosis | 114 | weeks | Free living |
| Schliessmann et al. [91] | 2018 | Diverse | 41 | min | Laboratory |
| Ummels et al. [99] | 2018 | Diverse | 130 | years | Laboratory |
| Banky et al. [41] | 2019 | Diverse | 35 | hours | Laboratory |
| Flachenecker et al. [58] | 2019 | Multiple sclerosis | 102 | min | Laboratory |
| Gadaleta et al. [60] | 2019 | Parkinson | 71 | min | Laboratory |
| Teufl et al. [97] | 2019 | Arthroplasty | 20 | min | Laboratory |
| Angelini et al. [37] | 2019 | Multiple sclerosis | 26 | min | Laboratory |
| Antos et al. [38] | 2019 | Old Age | 20 | min | Laboratory |
| Compagnat et al. [48] | 2019 | Stroke | 35 | min | Laboratory |
| Newman et al. [84] | 2020 | Brain injury | 12 | min | Laboratory |
| Ullrich et al. [98] | 2020 | Parkinson | 128 | min | Both |
| Wang et al. [101] | 2020 | Post Sternotomy | 22 | min | Laboratory |
| Pavon et al. [85] | 2020 | Disability | 46 | days | Laboratory |
| Arcuria et al. [39] | 2020 | Cerebellar ataxia | 40 | min | Laboratory |
| Erb et al. [55] | 2020 | Parkinson | 34 | weeks | Free Living |
| Aich et al. [36] | 2020 | Parkinson | 48 | min | Laboratory |
| Rubin et al. [89] | 2020 | Diverse | 78 | min | Laboratory |
| Henriksen et al. [62] | 2020 | Obesity | 16 | years | Free living |
| Shema-Shiratzky et al. [94] | 2020 | Multiple Sclerosis | 44 | min | Both |
| Abdollahi et al. [34] | 2020 | Chronic pain | 94 | min | Laboratory |
| Kim et al. [71] | 2020 | Amputation | 17 | min | Laboratory |
| Lemay et al. [75] | 2020 | Spinal cord injury | 18 | min | Laboratory |
| Meisel et al. [80] | 2020 | Epilepsy | 69 | months | Laboratory |
| Fantozzi et al. [56] | 2020 | Old Age | 9 | min | Laboratory |
| Zhai et al. [103] | 2020 | Multiple Sclerosis | 67 | min (Lab), weeks (FL) | Both |
| Revi et al. [87] | 2020 | Stroke | 5 | min | Laboratory |
| Compagnat et al. [49] | 2020 | Stroke | 26 | min | Laboratory |
| Furtado et al. [59] | 2020 | Amputation | 34 | hours (Lab), weeks (FL) | Both |
| Na et al. [83] | 2020 | Osteoarthritis | 39 | min | Laboratory |
Publisher’s Note: MDPI stays neutral with regard to jurisdictional claims in published maps and institutional affiliations. |
© 2021 by the authors. Licensee MDPI, Basel, Switzerland. This article is an open access article distributed under the terms and conditions of the Creative Commons Attribution (CC BY) license (https://creativecommons.org/licenses/by/4.0/).
Share and Cite
Jourdan, T.; Debs, N.; Frindel, C. The Contribution of Machine Learning in the Validation of Commercial Wearable Sensors for Gait Monitoring in Patients: A Systematic Review. Sensors 2021, 21, 4808. https://doi.org/10.3390/s21144808
Jourdan T, Debs N, Frindel C. The Contribution of Machine Learning in the Validation of Commercial Wearable Sensors for Gait Monitoring in Patients: A Systematic Review. Sensors. 2021; 21(14):4808. https://doi.org/10.3390/s21144808
Chicago/Turabian StyleJourdan, Théo, Noëlie Debs, and Carole Frindel. 2021. "The Contribution of Machine Learning in the Validation of Commercial Wearable Sensors for Gait Monitoring in Patients: A Systematic Review" Sensors 21, no. 14: 4808. https://doi.org/10.3390/s21144808
APA StyleJourdan, T., Debs, N., & Frindel, C. (2021). The Contribution of Machine Learning in the Validation of Commercial Wearable Sensors for Gait Monitoring in Patients: A Systematic Review. Sensors, 21(14), 4808. https://doi.org/10.3390/s21144808