
Integration of a Dielectrophoretic Tapered Aluminum Microelectrode Array with a Flow Focusing Technique

 ,
,  ,
,  , and
, and 
Abstract
:1. Introduction
1.1. Microfluidic Technology for Biological Analysis
1.2. Active Technique: DEP
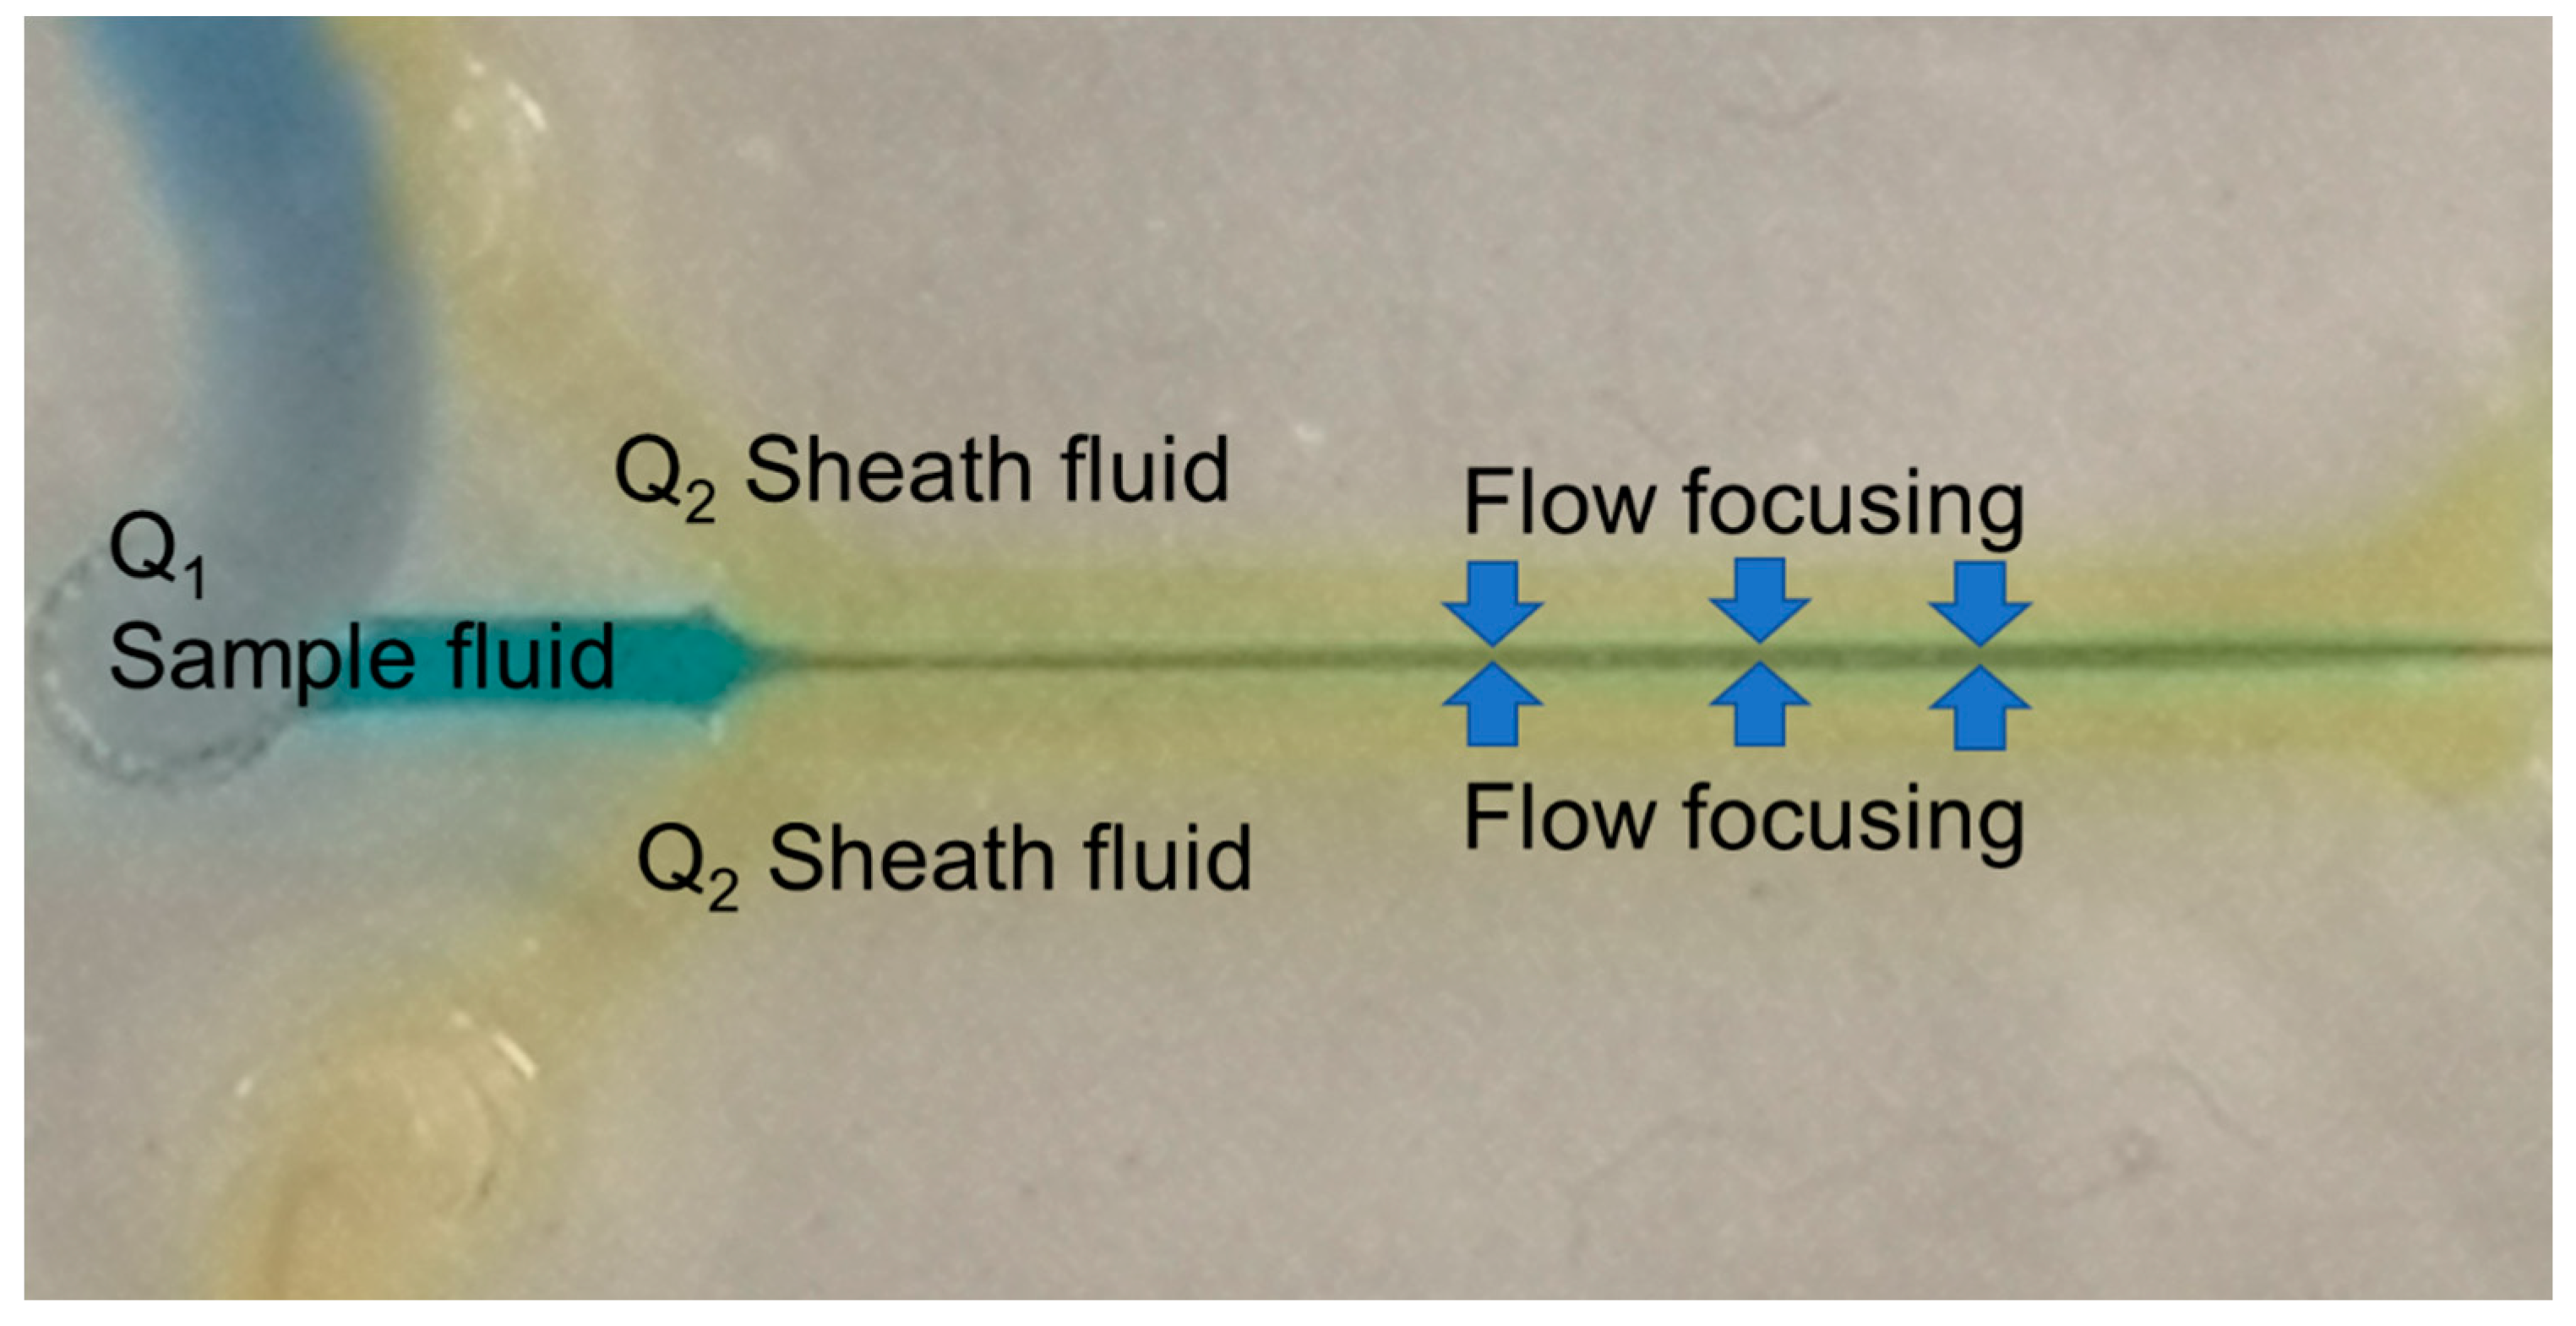
1.3. Passive Technique: Hydrodynamic Flow Focusing
2. Materials and Methods
2.1. Device Design
2.2. Flow Simulation
2.3. Experimental Setup
3. Results
3.1. Leaking Test
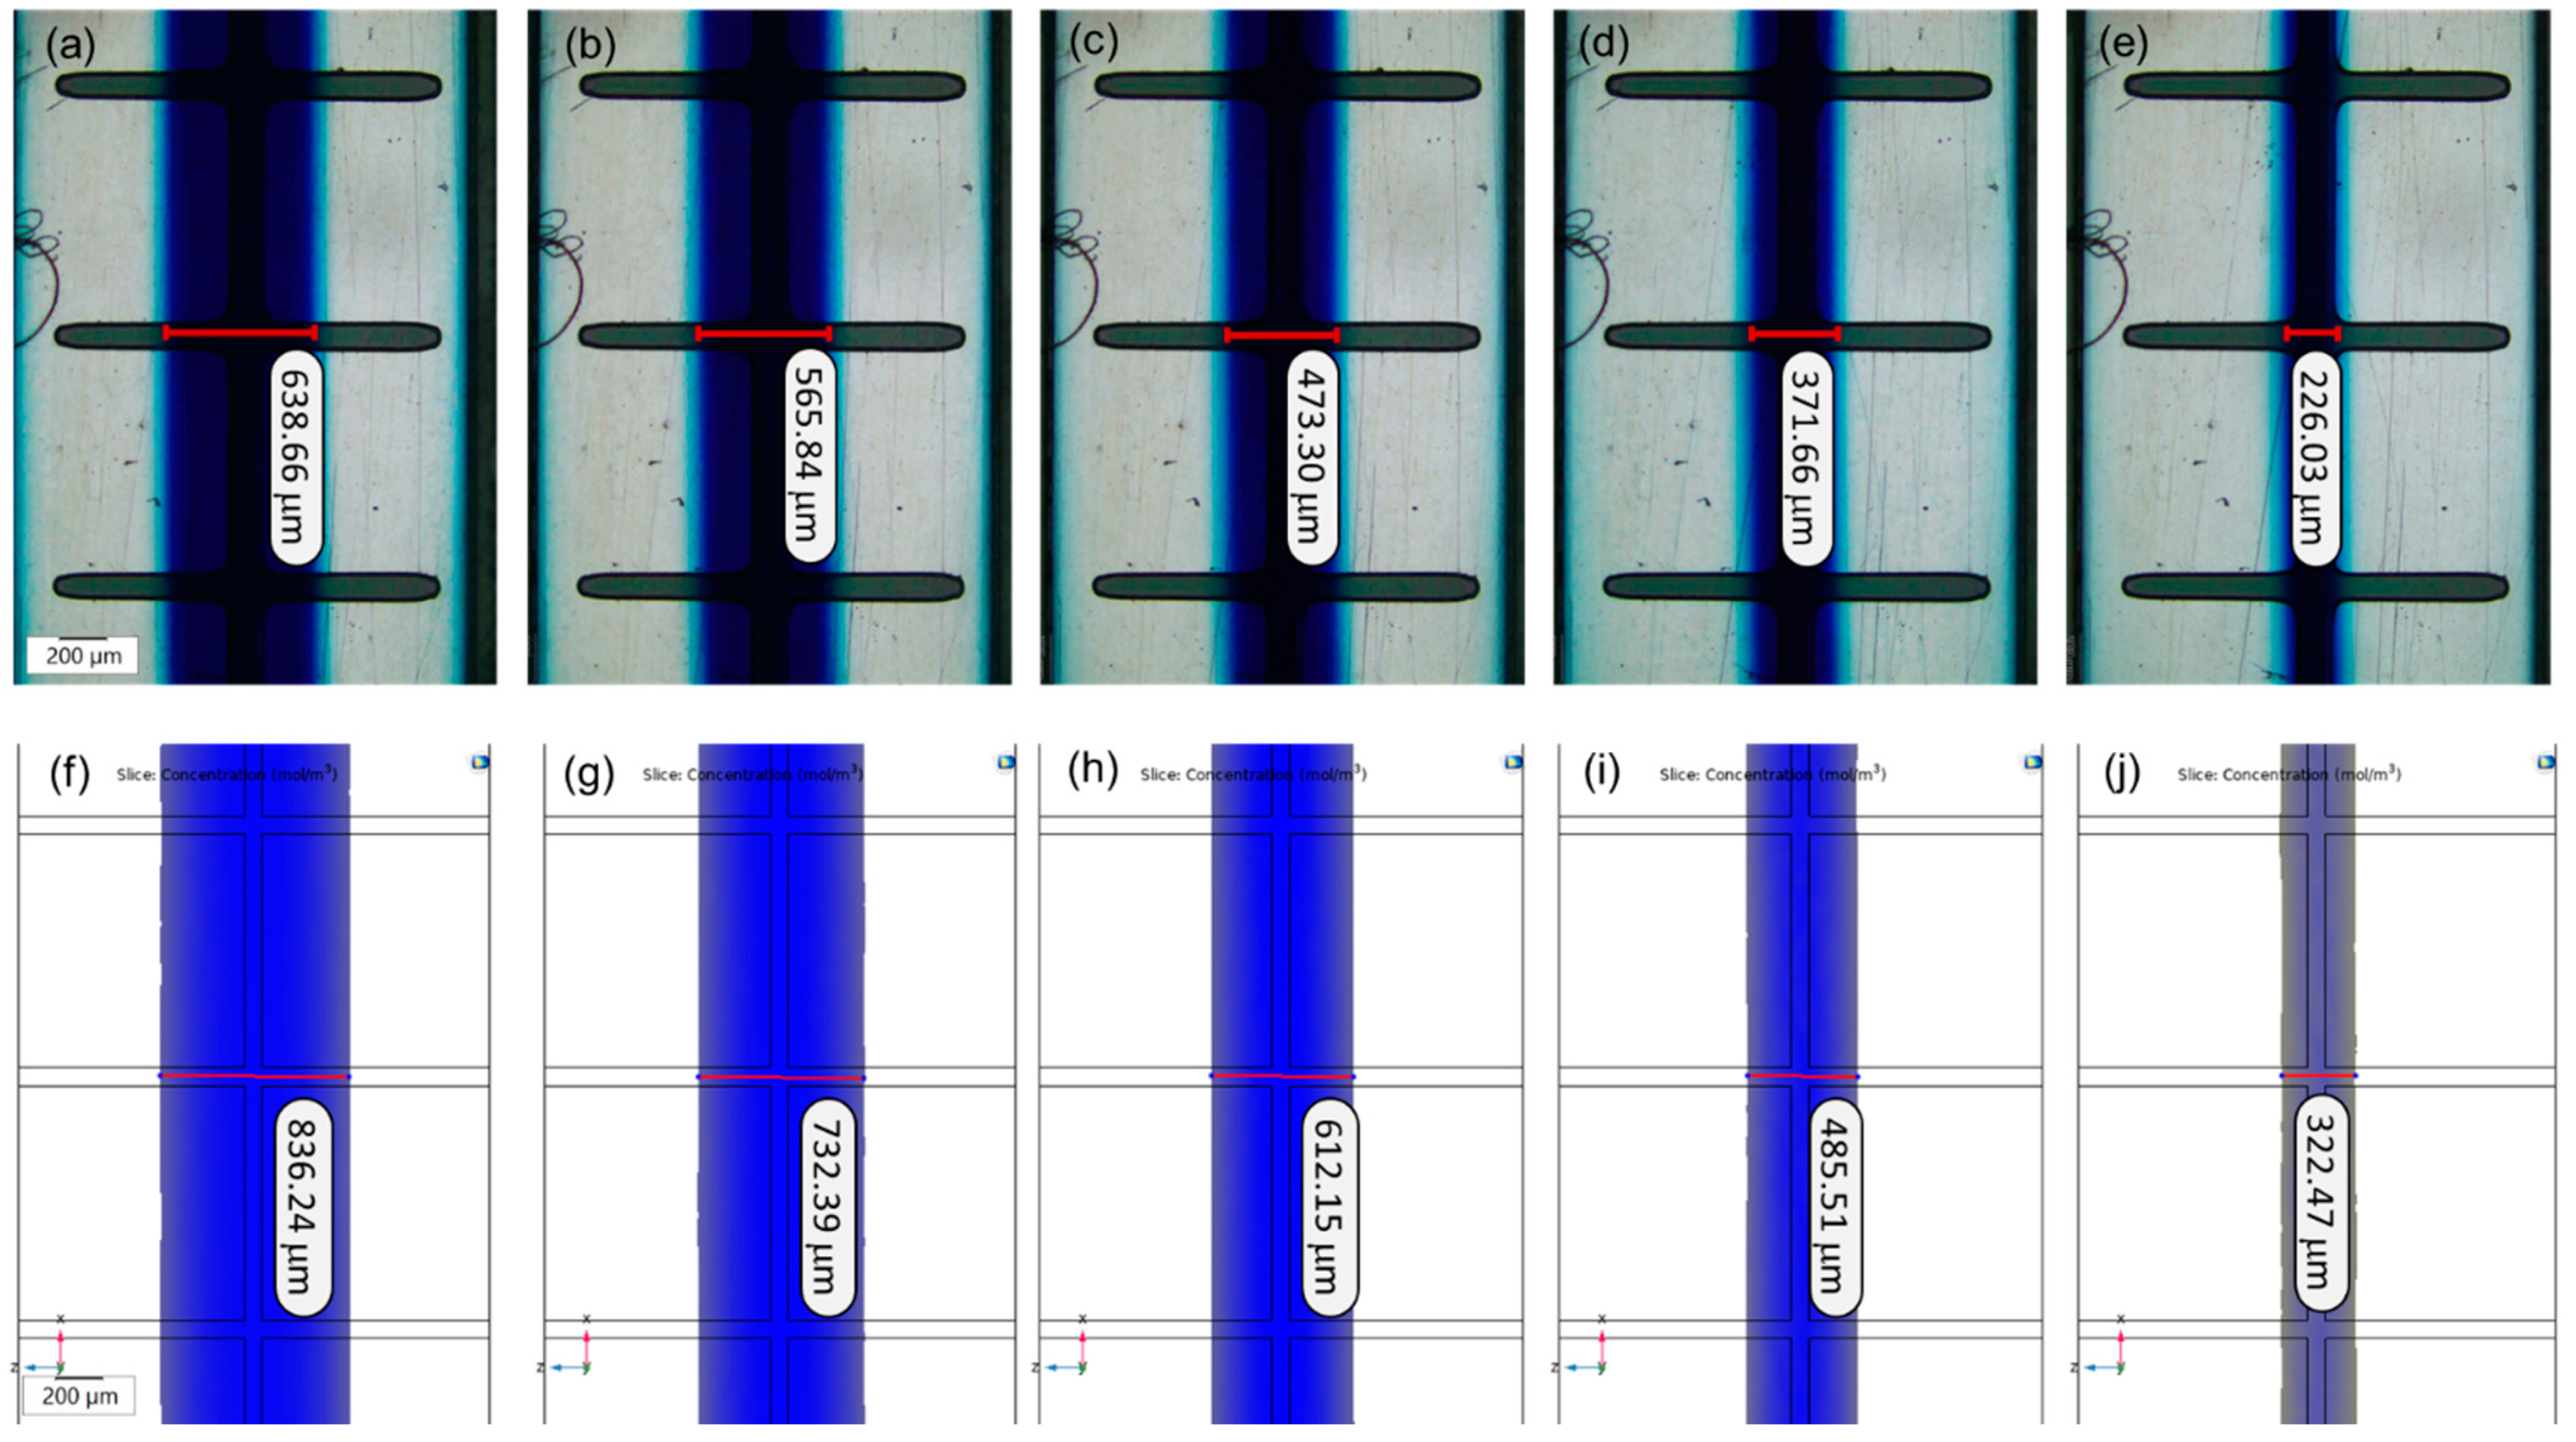
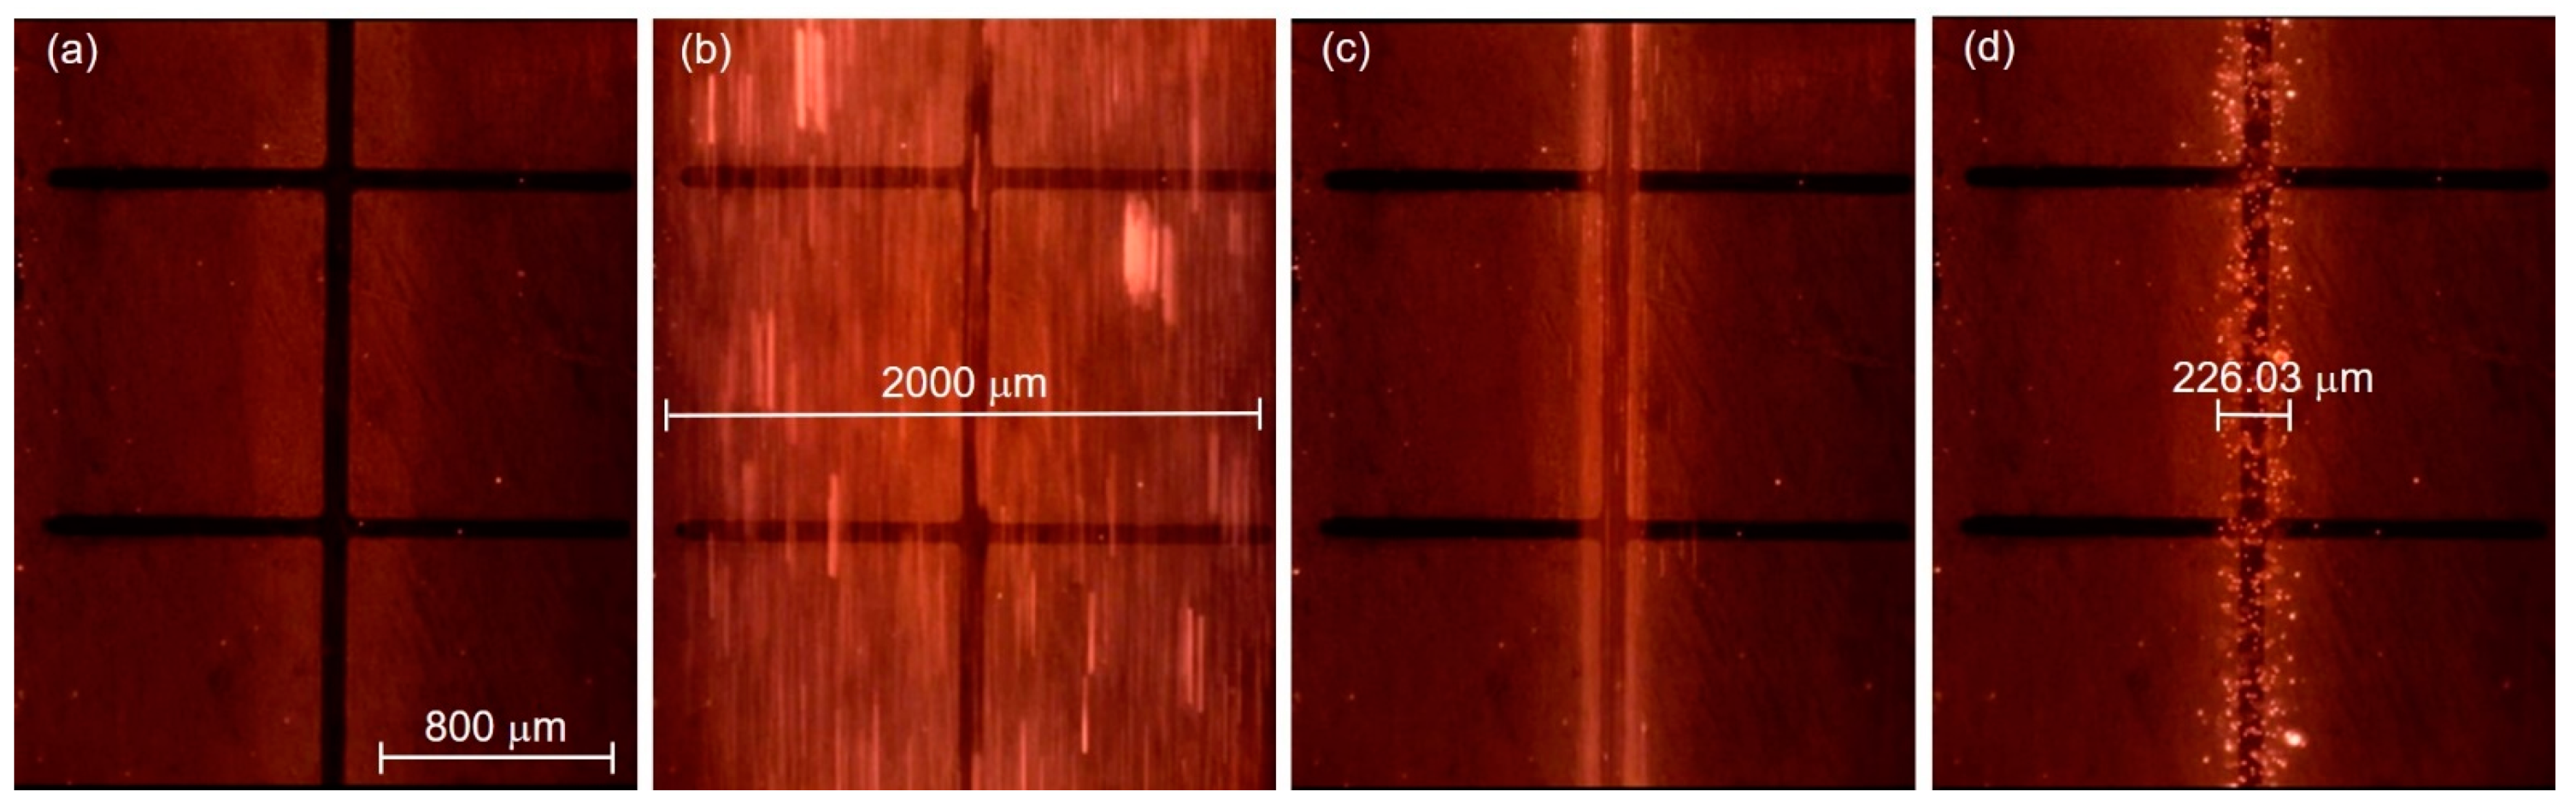
3.2. Effect of the Flow Rate Ratio to the Hydrodynamic Flow Focusing Width
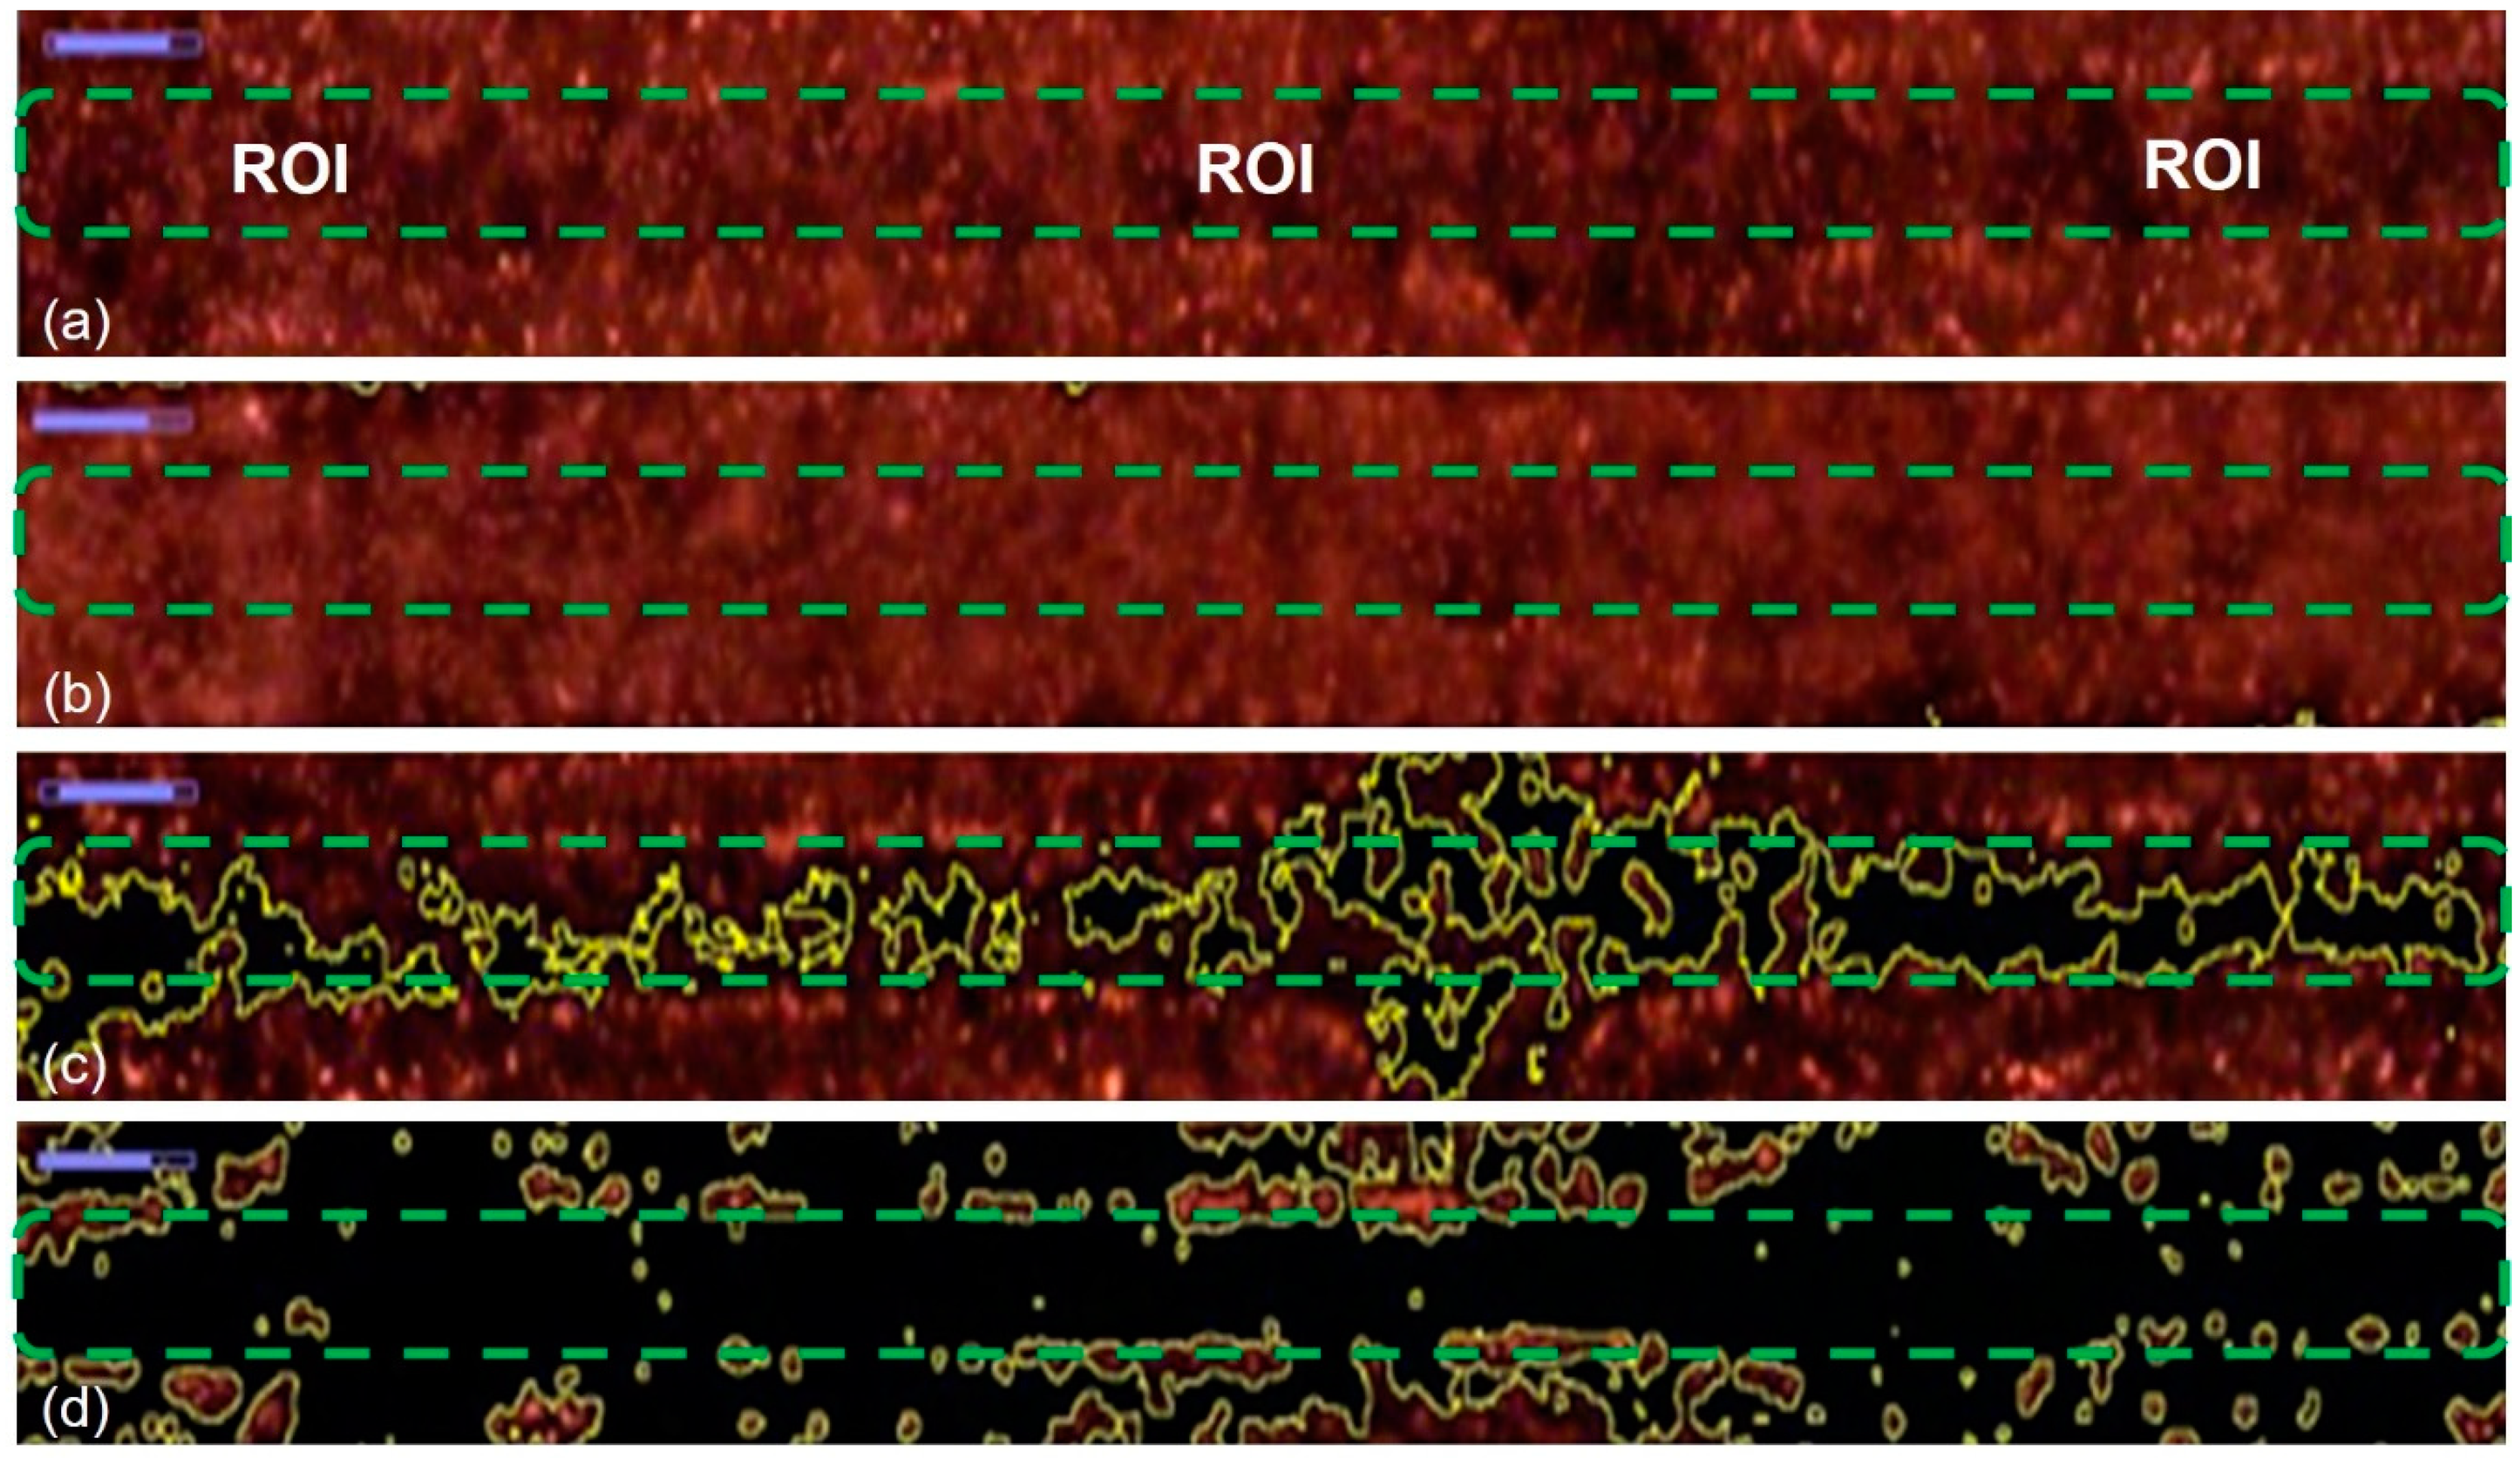
3.3. DEP Separation
4. Discussion
5. Conclusions
Supplementary Materials
Author Contributions
Funding
Institutional Review Board Statement
Informed Consent Statement
Data Availability Statement
Conflicts of Interest
References
- Karimi, A.; Yazdi, S.; Ardekani, A.M. Hydrodynamic mechanisms of cell and particle trapping in microfluidics. Biomicrofluidics 2013, 7, 021501. [Google Scholar] [CrossRef] [Green Version]
- Sieben, V.J.; Marun, C.S.D.; Pilarski, P.M.; Kaigala, G.V.; Pilarski, L.M.; Backhouse, C.J. Oxygen adsorption by carbon nanotubes and its application in radiotherapy. IET Nanobiotechnol. 2007, 1, 27–35. [Google Scholar] [CrossRef]
- Huang, L.R.; Cox, E.C.; Austin, R.H.; Sturm, J.C. Continuous Particle Separation Through Deterministic Lateral Displacement. Science 2004, 304, 987–990. [Google Scholar] [CrossRef]
- Dalili, A.; Taatizadeh, E.; Tahmooressi, H.; Tasnim, N.; Rellstab-Sánchez, P.I.; Shaunessy, M.; Najjaran, H.; Hoorfar, M. Parametric study on the geometrical parameters of a lab-on-a-chip platform with tilted planar electrodes for continuous dielectrophoretic manipulation of microparticles. Sci. Rep. 2020, 10, 1–11. [Google Scholar] [CrossRef]
- Xia, N.; Hunt, T.P.; Mayers, B.T.; Alsberg, E.; Whitesides, G.M.; Westervelt, R.M.; Ingber, D.E. Combined microfluidic-micromagnetic separation of living cells in continuous flow. Biomed. Microdevices 2006, 8, 299–308. [Google Scholar] [CrossRef] [PubMed]
- Mason, B.D.; Townsley, P.M. Dielectrophoretic separation of living cells. Can. J. Microbiol. 1971, 17, 879–888. [Google Scholar] [CrossRef]
- Barbaresco, F.; Cocuzza, M.; Pirri, C.F.; Marasso, S.L. Application of a micro free-flow electrophoresis 3d printed lab-on-a-chip for micro-nanoparticles analysis. Nanomaterials 2020, 10, 1277. [Google Scholar] [CrossRef]
- Tanyeri, M.; Johnson-Chavarria, E.M.; Schroeder, C.M. Hydrodynamic trap for single particles and cells. Appl. Phys. Lett. 2010, 96, 224101. [Google Scholar] [CrossRef] [PubMed] [Green Version]
- Tanyeri, M.; Ranka, M.; Sittipolkul, N.; Schroeder, C.M. A microfluidic-based hydrodynamic trap: Design and implementation. Lab Chip 2011, 11, 1786–1794. [Google Scholar] [CrossRef]
- Tanyeri, M.; Schroeder, C.M. Manipulation and Confinement of Single Particles Using Fluid Flow. Nano Lett. 2013, 13, 2357–2364. [Google Scholar] [CrossRef] [PubMed] [Green Version]
- Gossett, D.R.; Tse, H.T.K.; Lee, S.A.; Ying, Y.; Lindgren, A.G.; Yang, O.O.; Rao, J.; Clark, A.T.; Di Carlo, D. Hydrodynamic stretching of single cells for large population mechanical phenotyping. Proc. Natl. Acad. Sci. USA 2012, 109, 7630–7635. [Google Scholar] [CrossRef] [Green Version]
- Alazzam, A.; Mathew, B.; Alhammadi, F. Novel microfluidic device for the continuous separation of cancer cells using dielectrophoresis. J. Sep. Sci. 2017, 40, 1193–1200. [Google Scholar] [CrossRef]
- Chen, X.; Ren, Y.; Liu, W.; Feng, X.; Jia, Y.; Tao, Y.; Jiang, H. A Simplified Microfluidic Device for Particle Separation with Two Consecutive Steps: Induced Charge Electro-osmotic Prefocusing and Dielectrophoretic Separation. Anal. Chem. 2017, 89, 9583–9592. [Google Scholar] [CrossRef]
- Li, Y.; Dalton, C.; Crabtree, H.J.; Nilsson, G.; Kaler, K.V.I.S. Continuous dielectrophoretic cell separation microfluidic device. Lab Chip 2007, 7, 239–248. [Google Scholar] [CrossRef]
- Yang, L.; Banada, P.P.; Chatni, M.R.; Seop Lim, K.; Bhunia, A.K.; Ladisch, M.; Bashir, R. A multifunctional micro-fluidic system for dielectrophoretic concentration coupled with immuno-capture of low numbers of Listeria monocytogenes. Lab Chip 2006, 6, 896–905. [Google Scholar] [CrossRef]
- Choi, S.; Park, J.K. Microfluidic system for dielectrophoretic separation based on a trapezoidal electrode array. Lab Chip 2005, 5, 1161–1167. [Google Scholar] [CrossRef]
- Wang, L.; Lu, J.; Marchenko, S.A.; Monuki, E.S.; Flanagan, L.A.; Lee, A.P. Dual frequency dielectrophoresis with interdigitated sidewall electrodes for microfluidic flow-through separation of beads and cells. Electrophoresis 2009, 30, 782–791. [Google Scholar] [CrossRef]
- Yafouz, B.; Kadri, N.A.; Ibrahim, F. Dielectrophoretic Manipulation and Separation of Microparticles Using Microarray Dot Electrodes. Sensors 2014, 14, 6356–6369. [Google Scholar] [CrossRef]
- Adekanmbi, E.O.; Srivastava, S.K. Dielectrophoretic applications for disease diagnostics using lab-on-a-chip platforms. Lab Chip 2016, 16, 2148–2167. [Google Scholar] [CrossRef]
- Chan, J.Y.; Ahmad Kayani, A.B.; Md Ali, M.A.; Kok, C.K.; Yeop Majlis, B.; Hoe, S.L.L.; Marzuki, M.; Khoo, A.S.B.; Ostrikov, K.; Ataur Rahman, M.; et al. Dielectrophoresis-based microfluidic platforms for cancer diagnostics. Biomicrofluidics 2018, 12, 011503. [Google Scholar] [CrossRef]
- Pethig, R. Dielectrophoresis: Status of the theory, technology, and applications. Biomicrofluidics 2010, 4, 1–35. [Google Scholar] [CrossRef] [Green Version]
- Pethig, R. Review—Where Is Dielectrophoresis (DEP) Going? J. Electrochem. Soc. 2017, 164, B3049–B3055. [Google Scholar] [CrossRef]
- Kim, H.J.; Ahn, H.; Lee, D.S.; Park, D.; Kim, J.H.; Kim, J.; Yoon, D.S.; Hwang, K.S. Highly sensitive micropatterned interdigitated electrodes for enhancing the concentration effect based on dielectrophoresis. Sensors 2019, 19, 4152. [Google Scholar] [CrossRef] [PubMed] [Green Version]
- Yildizhan, Y.; Erdem, N.; Islam, M.; Martinez-Duarte, R.; Elitas, M. Dielectrophoretic separation of live and dead monocytes using 3D carbon-electrodes. Sensors 2017, 17, 2691. [Google Scholar] [CrossRef] [PubMed] [Green Version]
- Yunus, F.W.; Buyong, M.R.; Yunas, J.; Majlis, B.Y.; Hamzah, A.A. Separation of red blood cells along the planar plane using castellated and straight electrodes. ASM Sci. J. 2019, 12, 90–96. [Google Scholar]
- Guldiken, R.; Jo, M.C.; Gallant, N.D.; Demirci, U.; Zhe, J. Sheathless size-based acoustic particle separation. Sensors 2012, 12, 905–922. [Google Scholar] [CrossRef]
- Buyong, M.R.; Larki, F.; Faiz, M.S.; Hamzah, A.A.; Yunas, J.; Majlis, B.Y. A tapered aluminium microelectrode array for improvement of dielectrophoresis-based particle manipulation. Sensors 2015, 15, 10973–10990. [Google Scholar] [CrossRef] [Green Version]
- Buyong, M.R.; Kayani, A.A.; Hamzah, A.A.; Majlis, B.Y. Dielectrophoresis manipulation: Versatile lateral and vertical mechanisms. Biosensors 2019, 9, 30. [Google Scholar] [CrossRef] [Green Version]
- Buyong, M.R.; Ismail, A.G.; Yunus, F.W.; Samad, M.I.A.; Jamaludin, N.M.A.; Rahim, M.K.A.; Hamzah, A.A.; Majlis, B.Y.; Aziz, N.A. Tapered Dielectrophoresis Microelectrodes: Device, Operation, and Application. In Proceedings of the 2019 IEEE Regional Symposium on Micro and Nanoelectronics (RSM), Pahang, Malaysia, 21–23 August 2019; pp. 172–175. [Google Scholar] [CrossRef]
- Deivasigamani, R.; Maidin, N.N.M.; Wee, M.F.M.R.; Mohamed, M.A.; Buyong, M.R. Dielectrophoresis Prototypic Polystyrene Particle Synchronization toward Alive Keratinocyte Cells for Rapid Chronic Wound Healing. Sensors 2021, 21, 3007. [Google Scholar] [CrossRef] [PubMed]
- Buyong, M.R.; Larki, F.; Zainal, M.I.H.; Almahi, A.Y.A.; Ismail, A.G.; Hamzah, A.A.; Kayani, A.A.K.; Caille, C.E.; Majlis, B.Y. Implementation of capacitance as simultaneous sensing and actuating tool in tapered microelectrode arrays for dielectrophoresis-on-a-chip application. Microelectron. Int. 2020, 37, 215–224. [Google Scholar] [CrossRef]
- Razavi Bazaz, S.; Mashhadian, A.; Ehsani, A.; Saha, S.C.; Krüger, T.; Ebrahimi Warkiani, M. Computational inertial microfluidics: A review. Lab Chip 2020, 20, 1023–1048. [Google Scholar] [CrossRef]
- Di Carlo, D.; Irimia, D.; Tompkins, R.G.; Toner, M. Continuous inertial focusing, ordering, and separation of particles in microchannels. Proc. Natl. Acad. Sci. USA 2007, 104, 18892–18897. [Google Scholar] [CrossRef] [Green Version]
- Minetti, F.; Giorello, A.; Olivares, M.L.; Berli, C.L.A. Exact solution of the hydrodynamic focusing driven by hydrostatic pressure. Microfluid. Nanofluid. 2020, 24, 15. [Google Scholar] [CrossRef]
- Buyong, M.R.; Aziz, N.A.; Hamzah, A.A.; Wee, M.F.M.R.; Majlis, B.Y. Finite element modeling of dielectrophoretic microelectrodes based on a array and ratchet type. In Proceedings of the IEEE International Conference on Semiconductor Electronics, Kuala Lumpur, Malaysia, 27–29 August 2014; pp. 236–239. [Google Scholar] [CrossRef]
- Shkolnikov, V.; Xin, D.; Chen, C.H. Continuous dielectrophoretic particle separation via isomotive dielectrophoresis with bifurcating stagnation flow. Electrophoresis 2019, 40, 2988–2995. [Google Scholar] [CrossRef] [PubMed]
- Frankowski, M.; Theisen, J.; Kummrow, A.; Simon, P.; Ragusch, H.; Bock, N.; Schmidt, M.; Neukammer, J. Microflow cytometers with integrated hydrodynamic focusing. Sensors 2013, 13, 4674–4693. [Google Scholar] [CrossRef] [Green Version]
- Chiu, Y.; Cho, S.H.; Mei, Z.; Lien, V.; Wu, T.; Lo, Y. Universally applicable three-dimensional hydrodynamic microfluidic flow focusing. Lab Chip 2013, 13, 1803–1809. [Google Scholar] [CrossRef]
- Lee, G.B.; Chang, C.C.; Huang, S.B.; Yang, R.J. The hydrodynamic focusing effect inside rectangular microchannels. J. Micromech. Microeng. 2006, 16, 1024–1032. [Google Scholar] [CrossRef]
- Rahim, M.S.; Selamat, N.; Yunas, J.; Ehsan, A.A. Simulation of 3D Hydrodynamic Focusing in Microfluidic Rectangular Shape Microflow Cytometer for Micro Size Cell Application. IOP Conf. Ser. Mater. Sci. Eng. 2017, 403, 01101. [Google Scholar]
- Selamat, N.; Rahim, M.S.B.; Ehsan, A.A. Effect of microchannel sizes on 3D hydrodynamic focusing of a microflow cytometer. In Proceedings of the 2016 IEEE International Conference on Semiconductor Electronics (ICSE), Lumpur, Bangsar, 17−19 August 2016; pp. 109–112. [Google Scholar]
- Zeng, W.; Li, S.; Wang, Z. Characterization of Syringe-pump-driven Versus Pressure-driven Microfluidic Flows. In Proceedings of the 2015 International Conference on Fluid Power and Mechatronics, FPM 2015, Harbin, China, 5−7 August 2015; pp. 711–715. [Google Scholar]


| Flow Rate Ratio between the Main Flow and the Sheath Flow (Q1/Q2) | Experimental Flow Focusing Width (µm) | Simulation Flow Focusing Width (µm) | Differences (µm) |
|---|---|---|---|
| 0.2 | 226.03 | 322.47 | 96.44 |
| 0.4 | 371.66 | 485.51 | 113.85 |
| 0.6 | 473.30 | 612.15 | 138.85 |
| 0.8 | 565.84 | 732.39 | 166.55 |
| 1.0 | 638.66 | 836.24 | 197.58 |
| Figures | Mechanism |
|---|---|
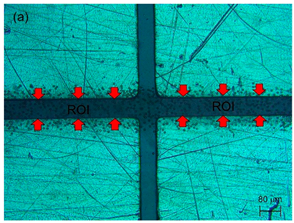 | 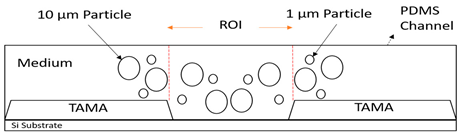 |
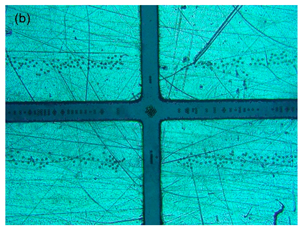 | 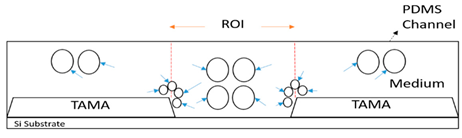 |
 |  |
 |  |
 |  |
 |  |
| Condition | Before Manipulation (µm2) | After Manipulation (µm2) | Manipulation Efficiency (%) |
|---|---|---|---|
| Area covered by particles without flow focusing | 519,422.8 | 414,208.1 | 20.3 |
| Area covered by particles with flow focusing | 517,465.7 | 102,116.3 | 80.3 |
Publisher’s Note: MDPI stays neutral with regard to jurisdictional claims in published maps and institutional affiliations. |
© 2021 by the authors. Licensee MDPI, Basel, Switzerland. This article is an open access article distributed under the terms and conditions of the Creative Commons Attribution (CC BY) license (https://creativecommons.org/licenses/by/4.0/).
Share and Cite
Rashid, N.F.A.; Deivasigamani, R.; Wee, M.F.M.R.; Hamzah, A.A.; Buyong, M.R. Integration of a Dielectrophoretic Tapered Aluminum Microelectrode Array with a Flow Focusing Technique. Sensors 2021, 21, 4957. https://doi.org/10.3390/s21154957
Rashid NFA, Deivasigamani R, Wee MFMR, Hamzah AA, Buyong MR. Integration of a Dielectrophoretic Tapered Aluminum Microelectrode Array with a Flow Focusing Technique. Sensors. 2021; 21(15):4957. https://doi.org/10.3390/s21154957
Chicago/Turabian StyleRashid, Naqib Fuad Abd, Revathy Deivasigamani, M. F. Mohd Razip Wee, Azrul Azlan Hamzah, and Muhamad Ramdzan Buyong. 2021. "Integration of a Dielectrophoretic Tapered Aluminum Microelectrode Array with a Flow Focusing Technique" Sensors 21, no. 15: 4957. https://doi.org/10.3390/s21154957