
Modulation of Pulse Propagation and Blood Flow via Cuff Inflation—New Distal Insights

 ,
,  , ,
, , 
Abstract
:1. Introduction
- In [1], the cuff is used to alter the transmural pressure across the brachial artery for the purpose of modulating Pulse Arrival Time (PAT). The change in PAT with respect to the controlled transmural pressure is analyzed in order to calibrate the BP-PAT relationship for the purpose of beat-to-beat PAT-based BP estimation.
- In [2] both the brachial artery volume oscillation and the PAT response to cuff-based perturbation are interpreted in order to estimate brachial arterial compliance and collapse mechanics. Changes in these vascular properties can precede changes in BP and cardiac output [2]. Intensive care clinicians have expressed interest in measuring short-term, dynamic regulation of arteries [3], however, methods for detecting such regulation mechanisms are not yet available, mainly due to the difficulty of measuring vascular properties with standard hemodynamic monitoring hospital equipment.
2. Materials and Methods
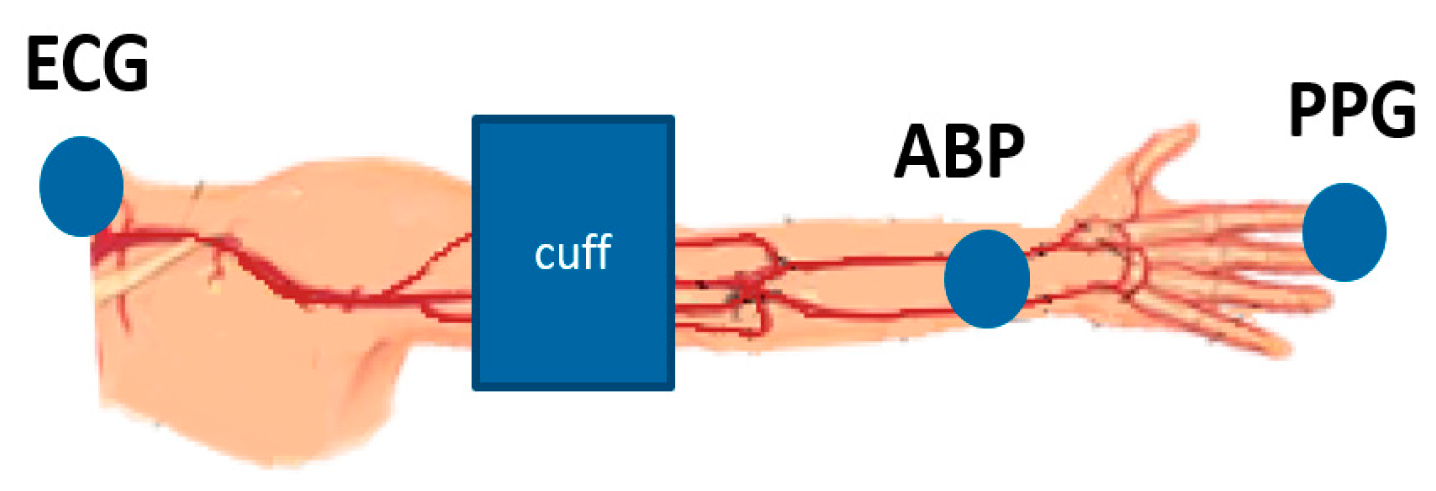
2.1. Measurement Procedure
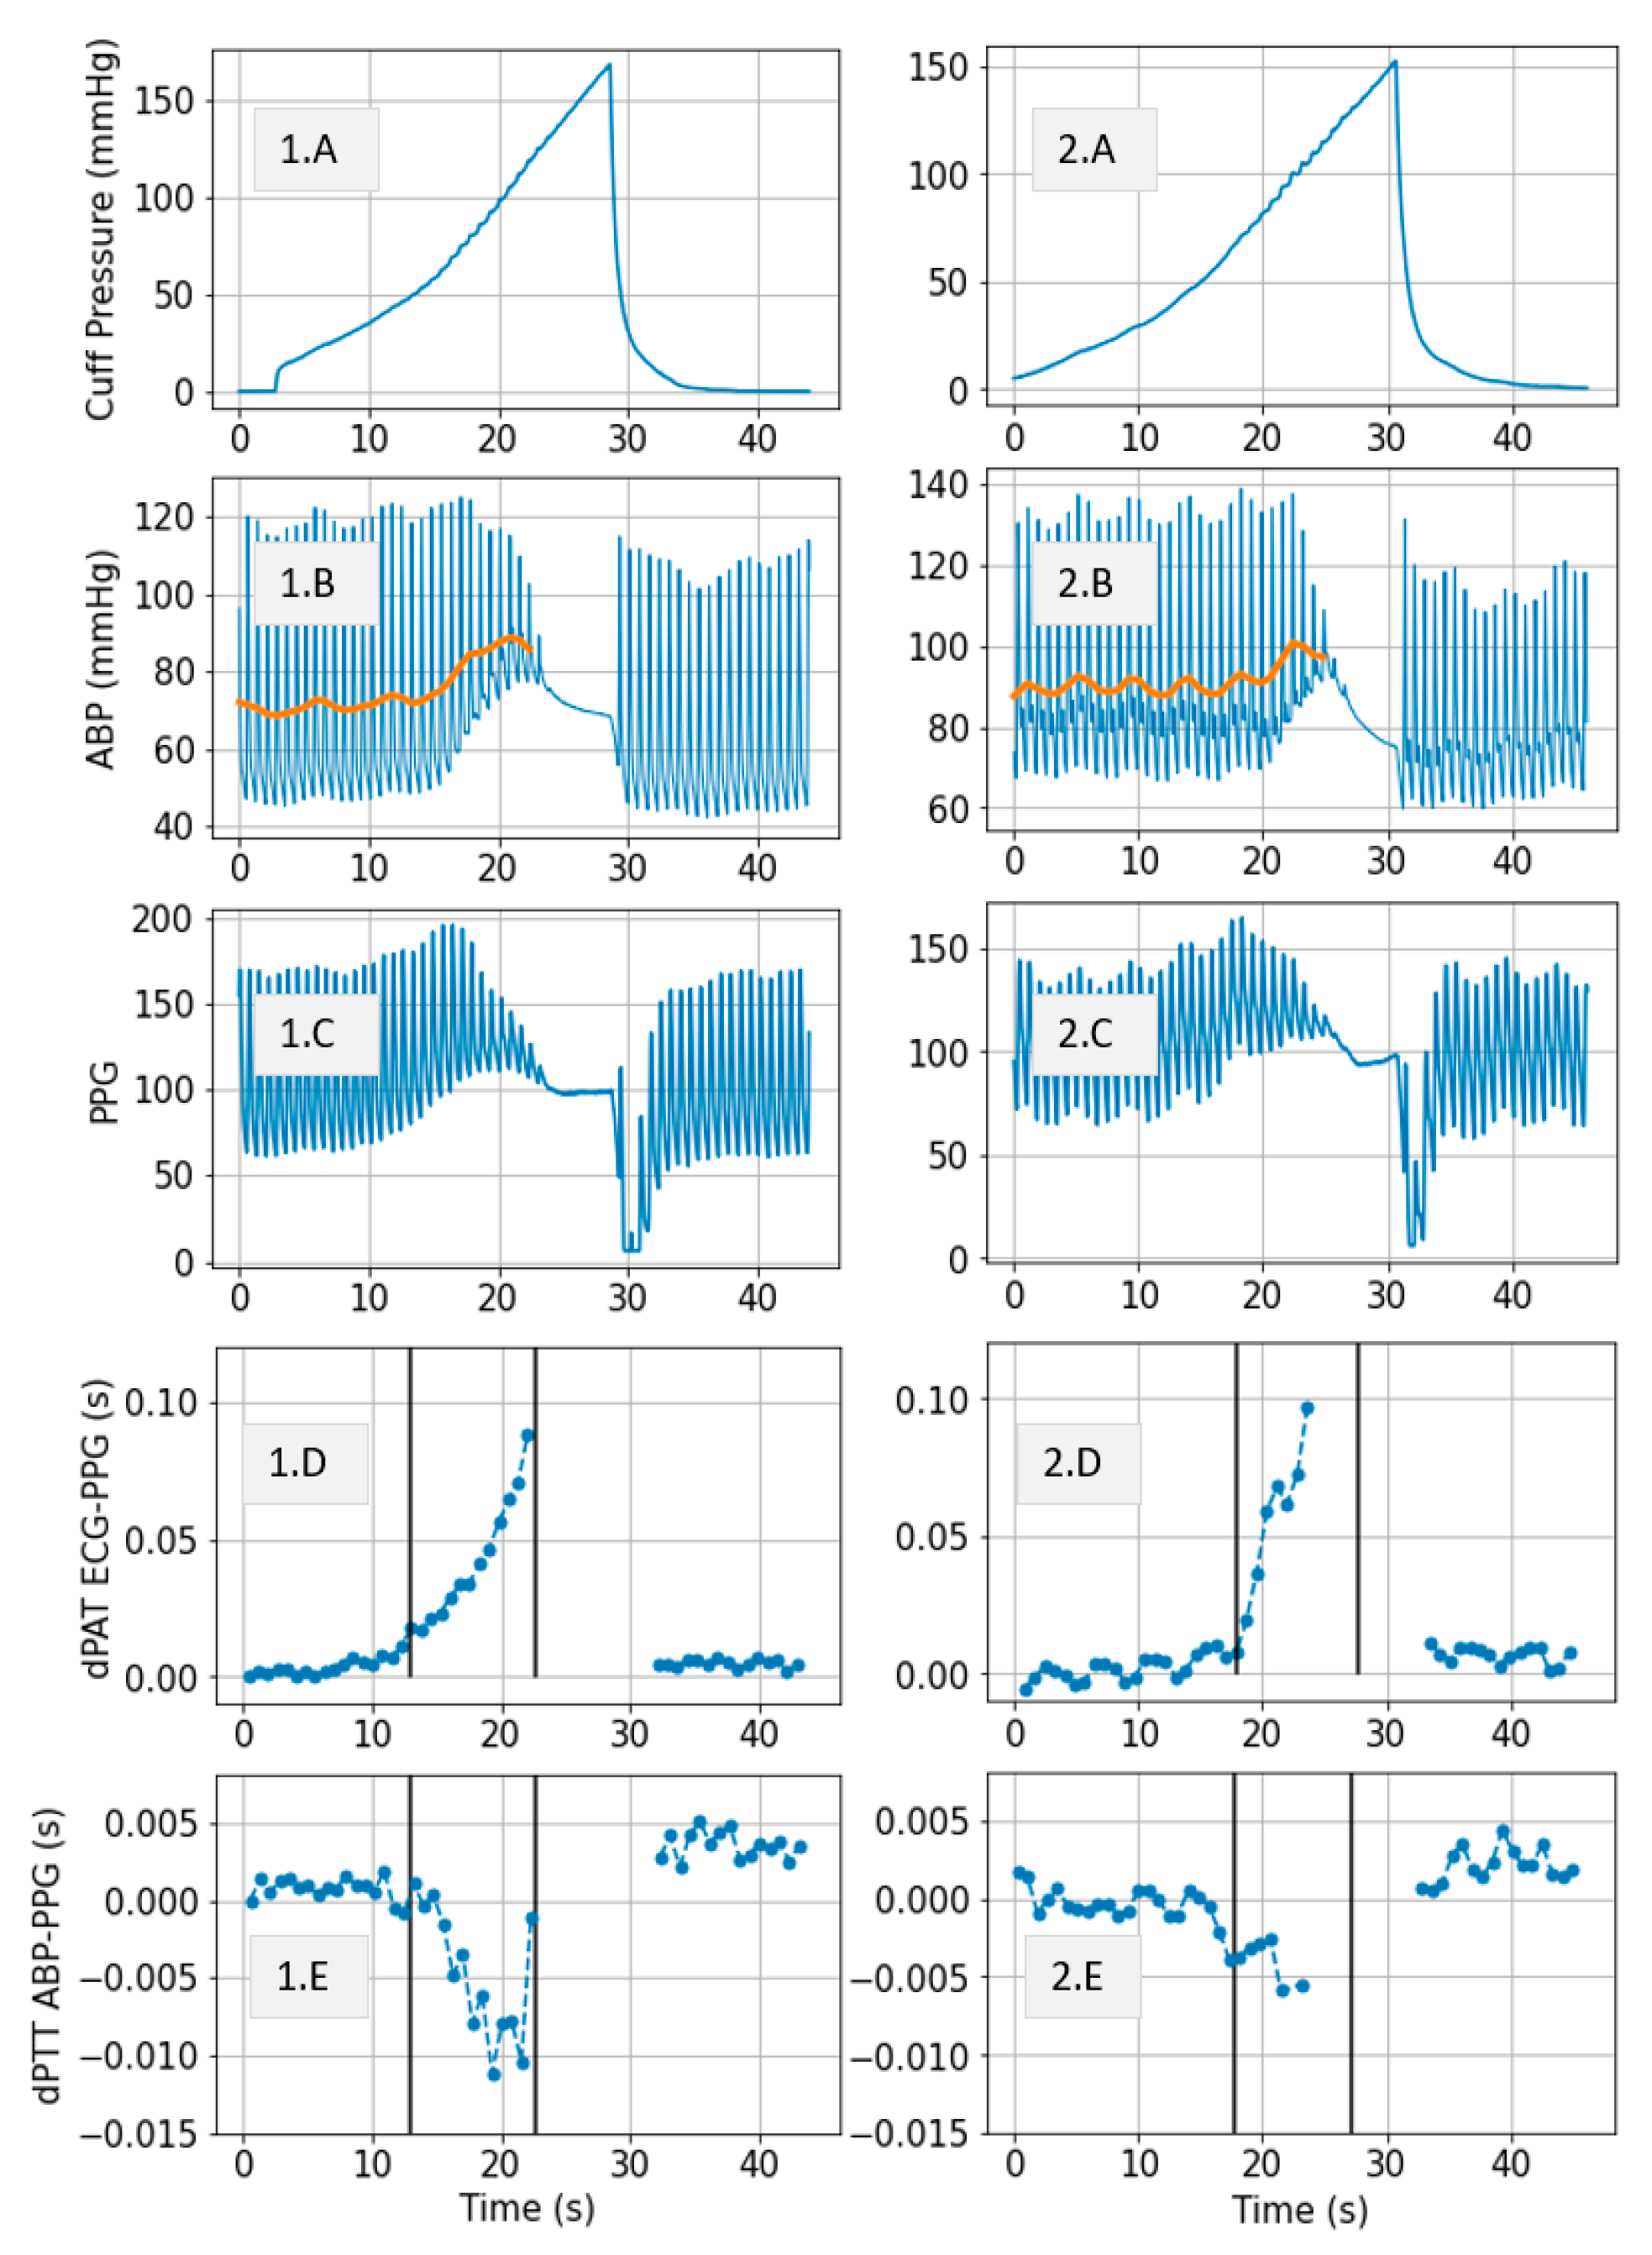
- Heart to finger site: is computed as the change in delay between the R-peak of the ECG signal and the foot of the PPG waveform as cuff pressure increases.
- Radial to finger site: is computed as the change in delay between the foot of the ABP waveform and the foot of the PPG waveform as cuff pressure increases.
2.2. Model
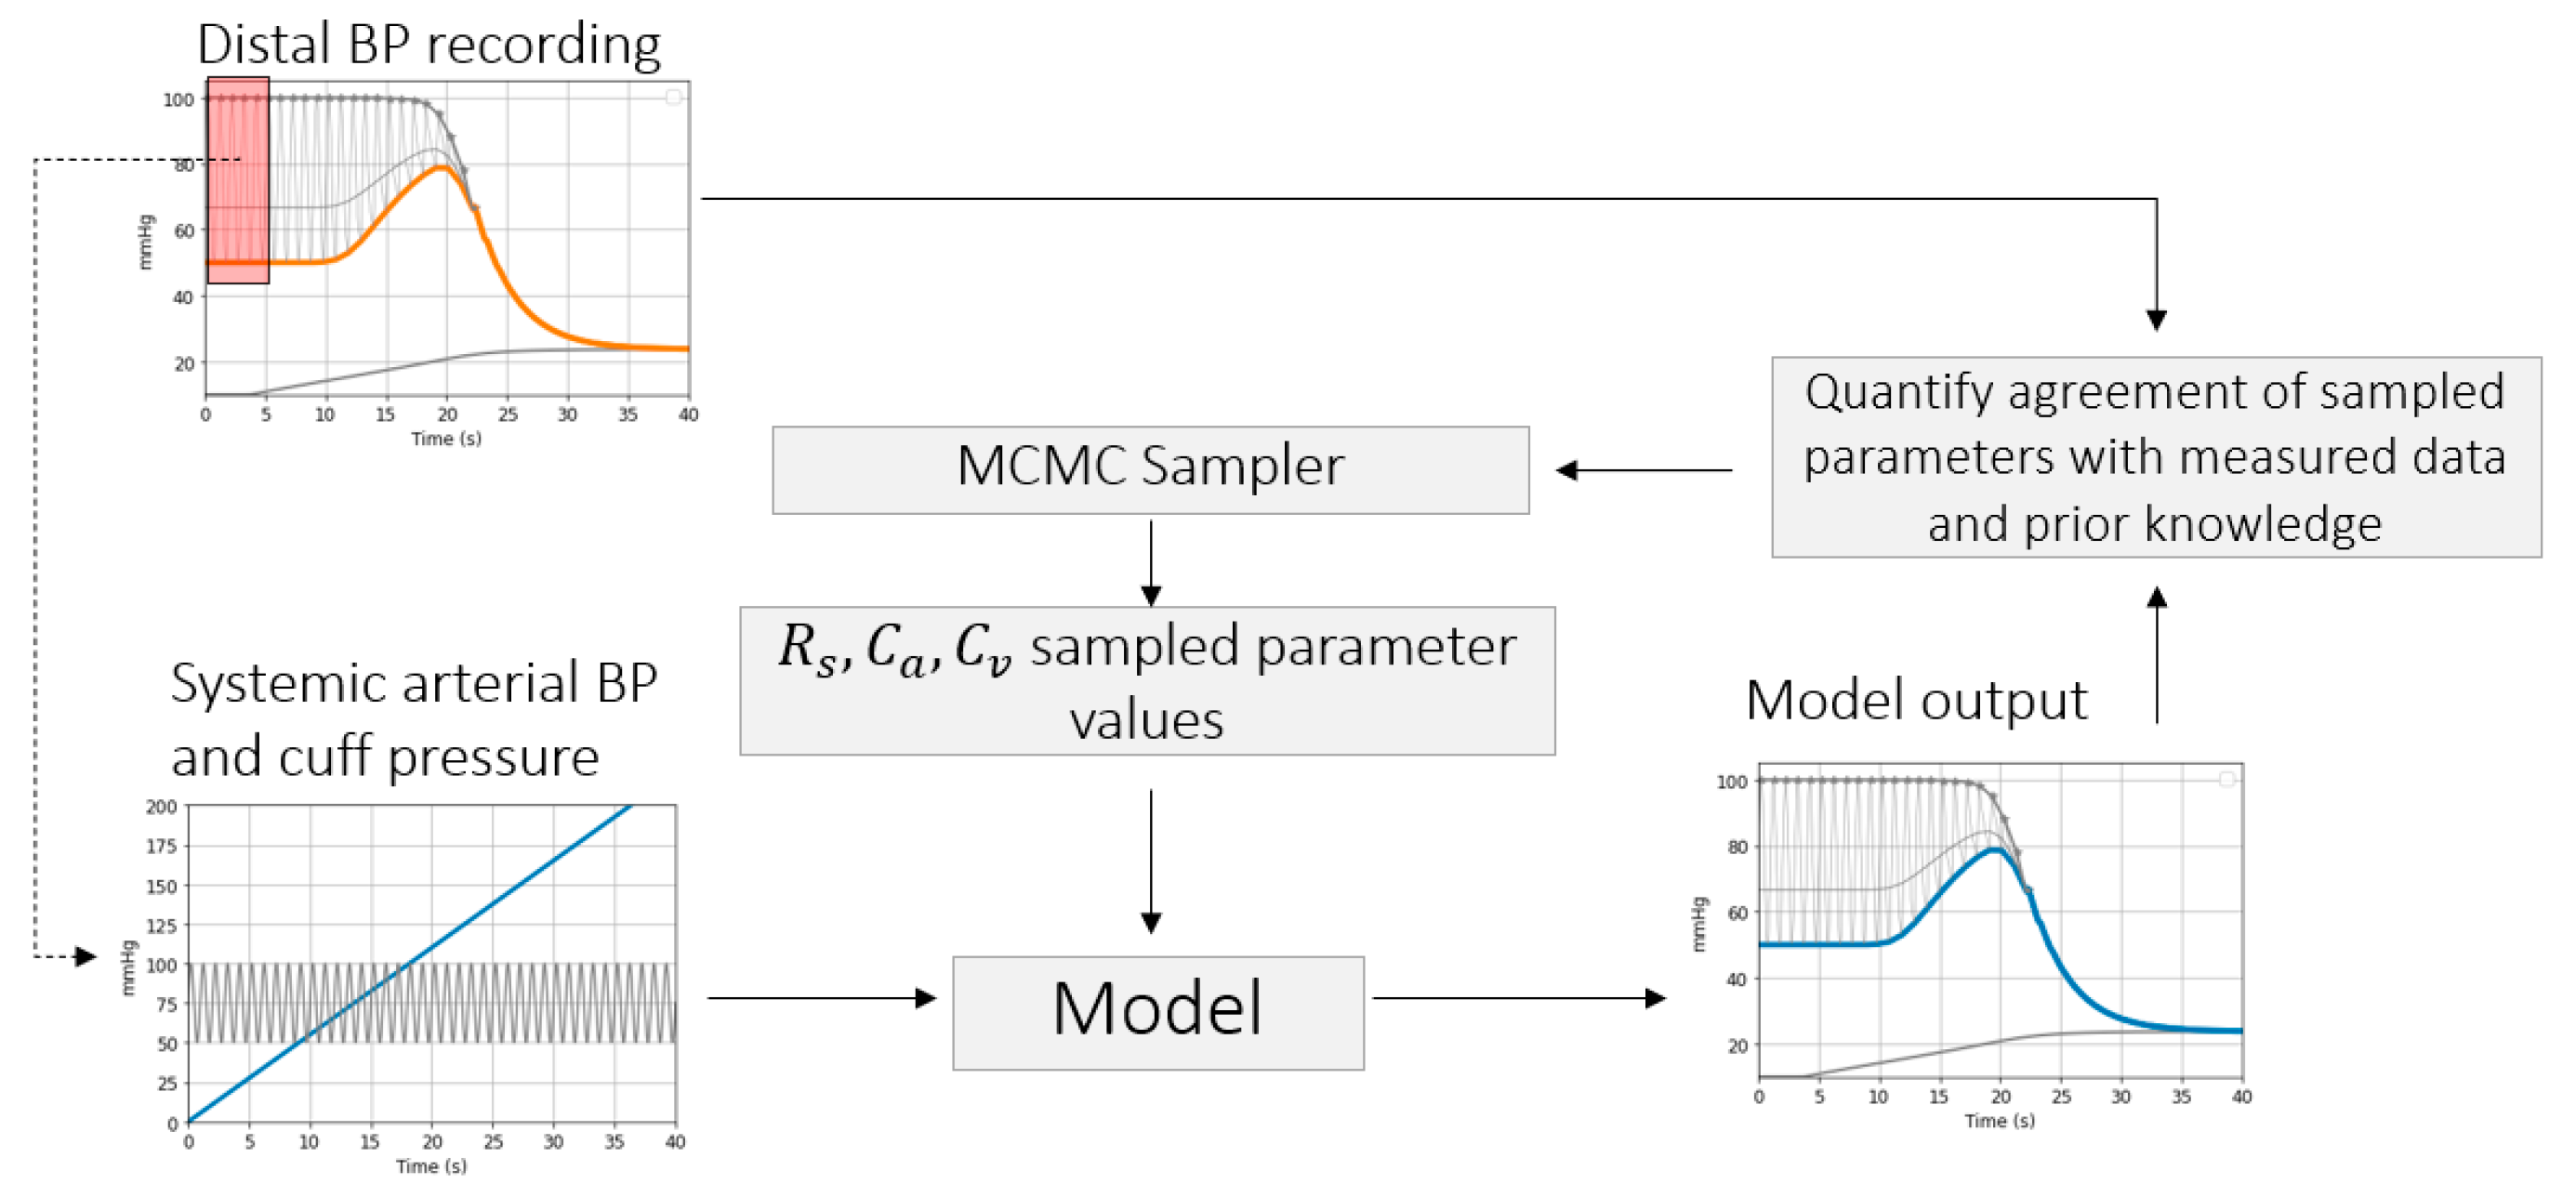
2.3. Parameter Inference
2.3.1. Brachial Artery Compliance Inference
Simulation Framework
Inference of Brachial Artery Parameters from Patient Data
2.3.2. Estimation of PAT-BP Calibration from Patient Data
2.3.3. Inference of Distal Arm Circulation Parameters
Time Constant and Mean Systemic Filling Pressure
Systemic Resistance and Distal Vascular Compliance
3. Results
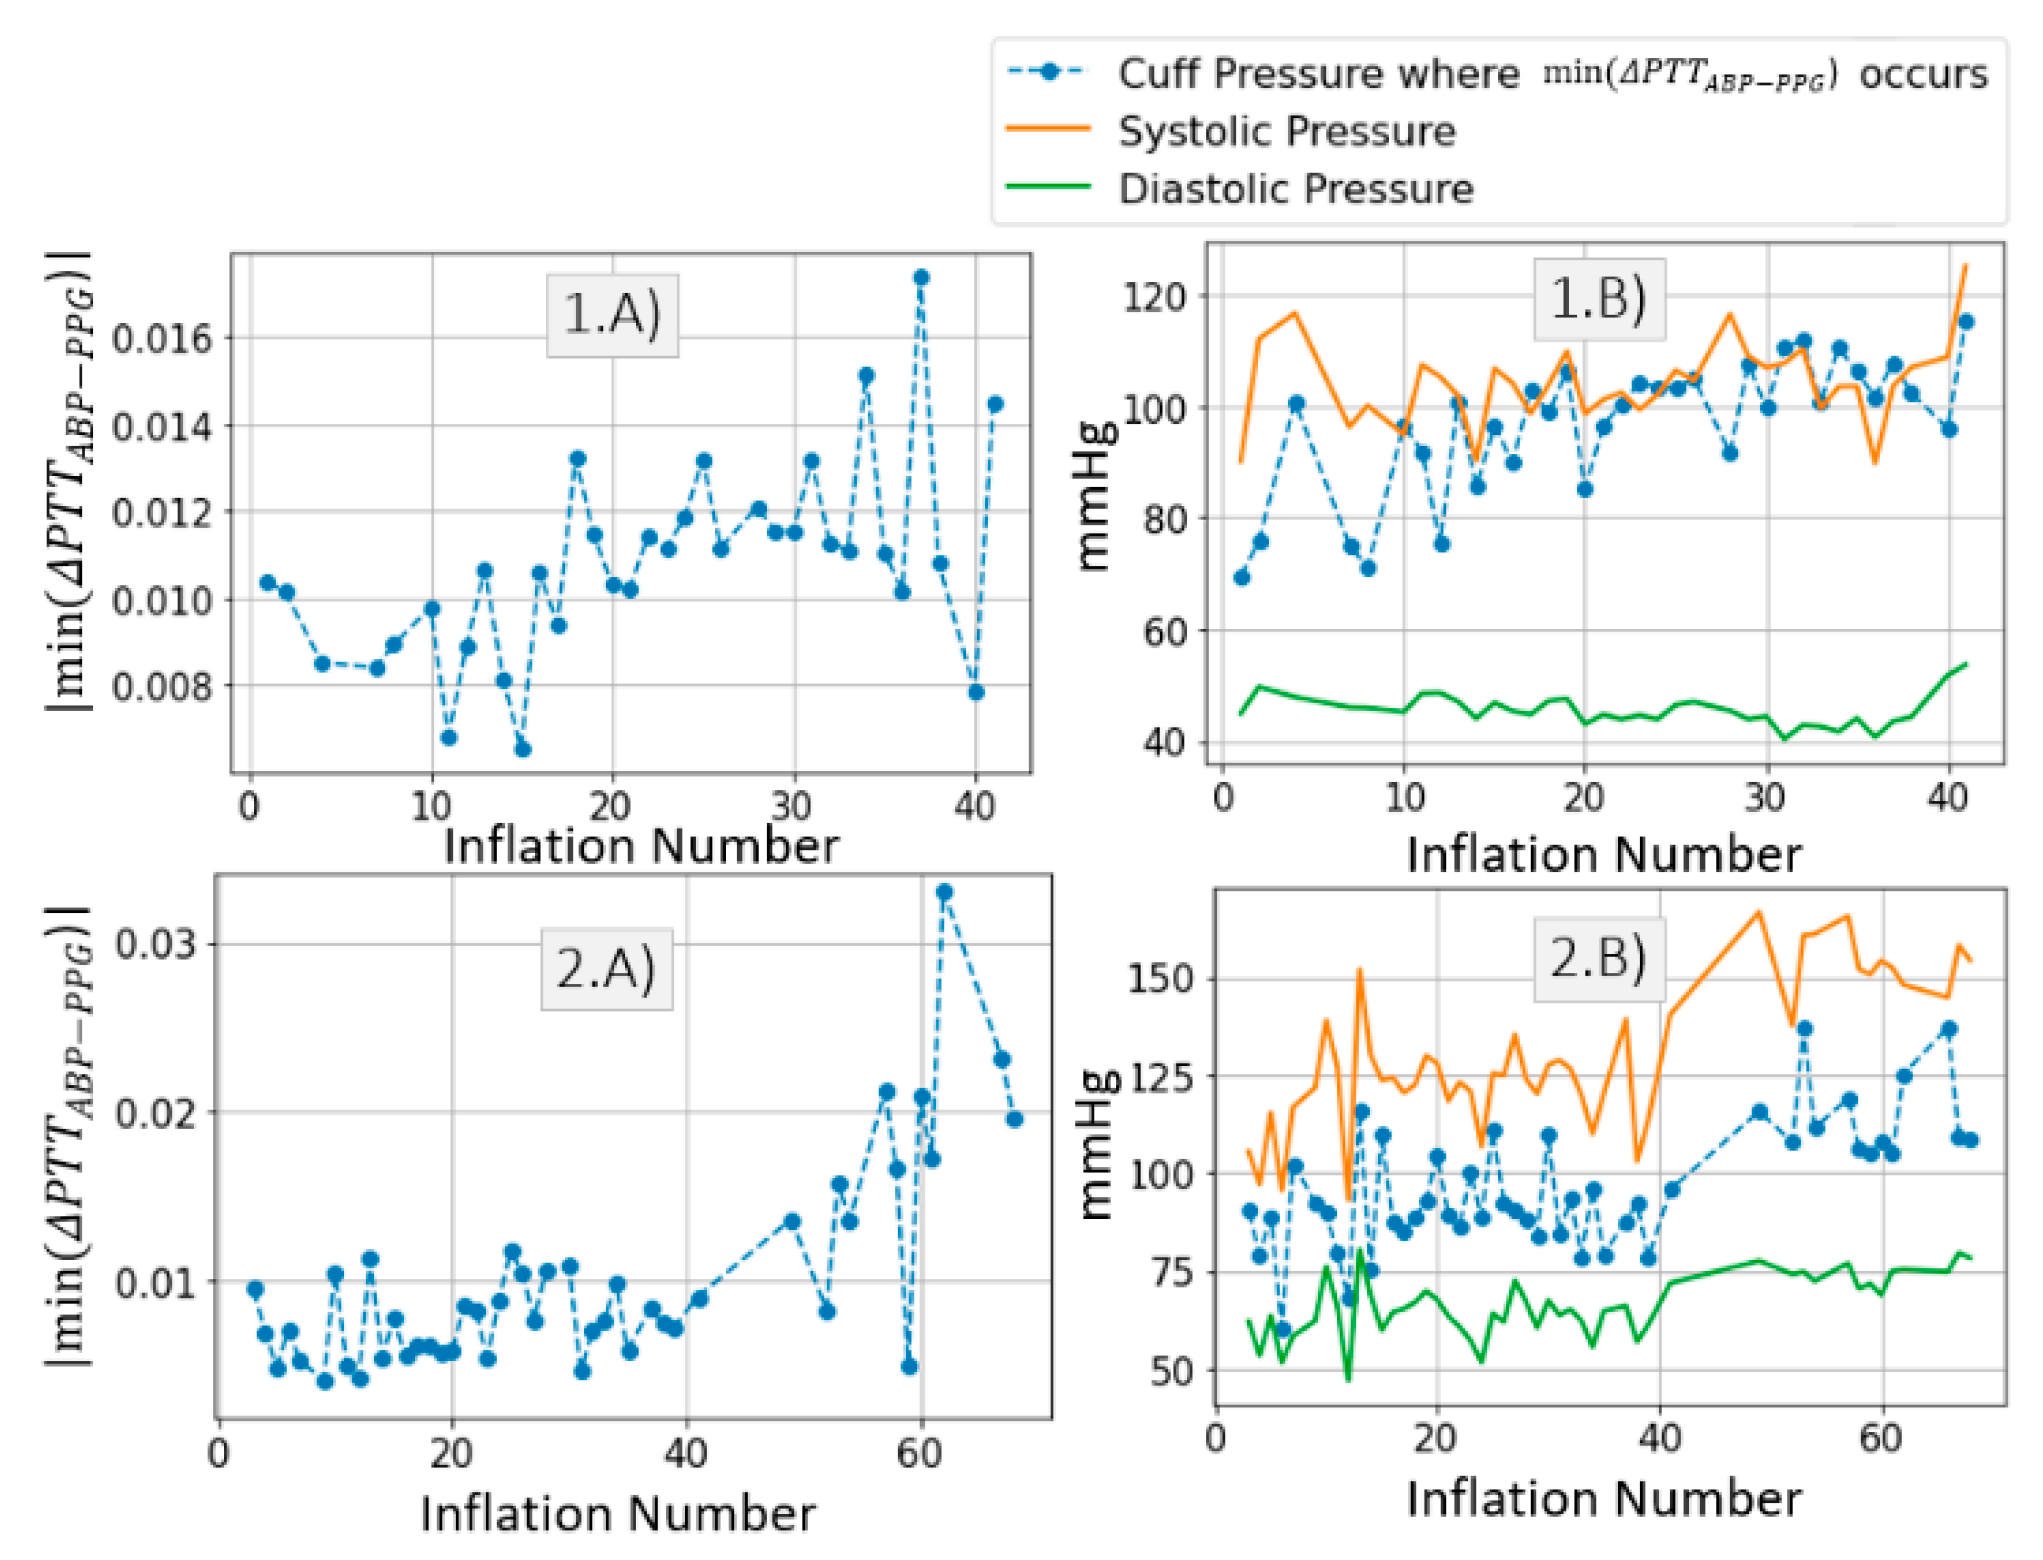
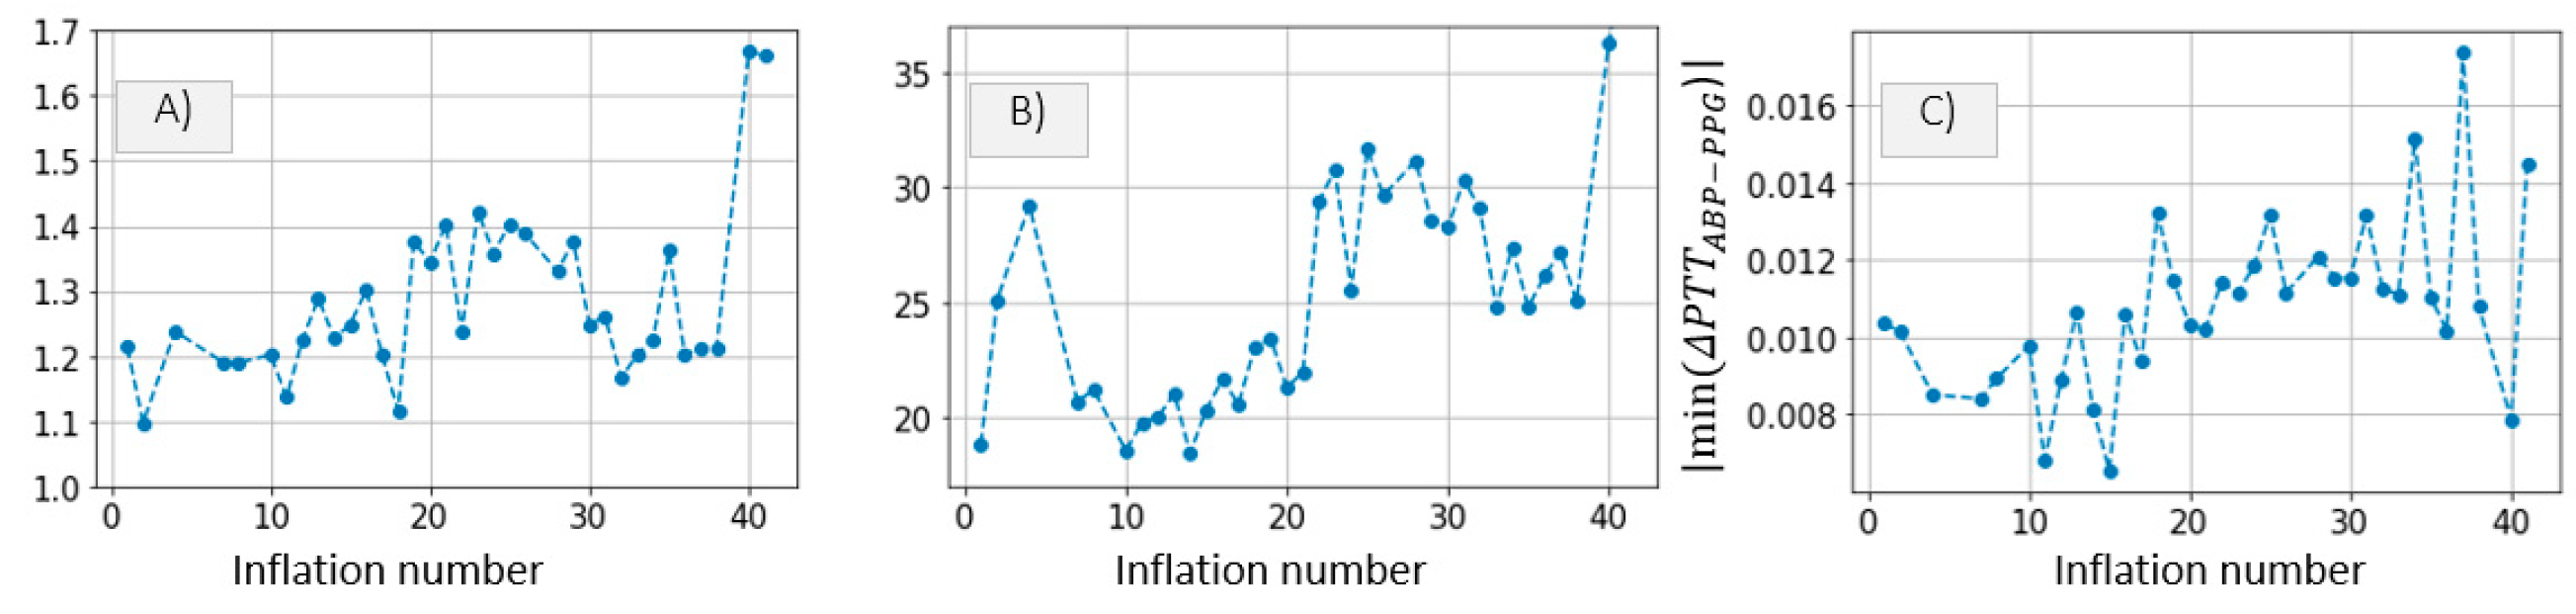
3.1. Measurements
3.2. Model Simulations and Inference Results
3.2.1. Brachial Artery Compliance Inference
Simulation Framework
Inference of Brachial Artery Parameters from Patient Data
3.2.2. Estimation of PAT-BP Calibration
3.2.3. Inference of Distal Arm Circulation Parameters
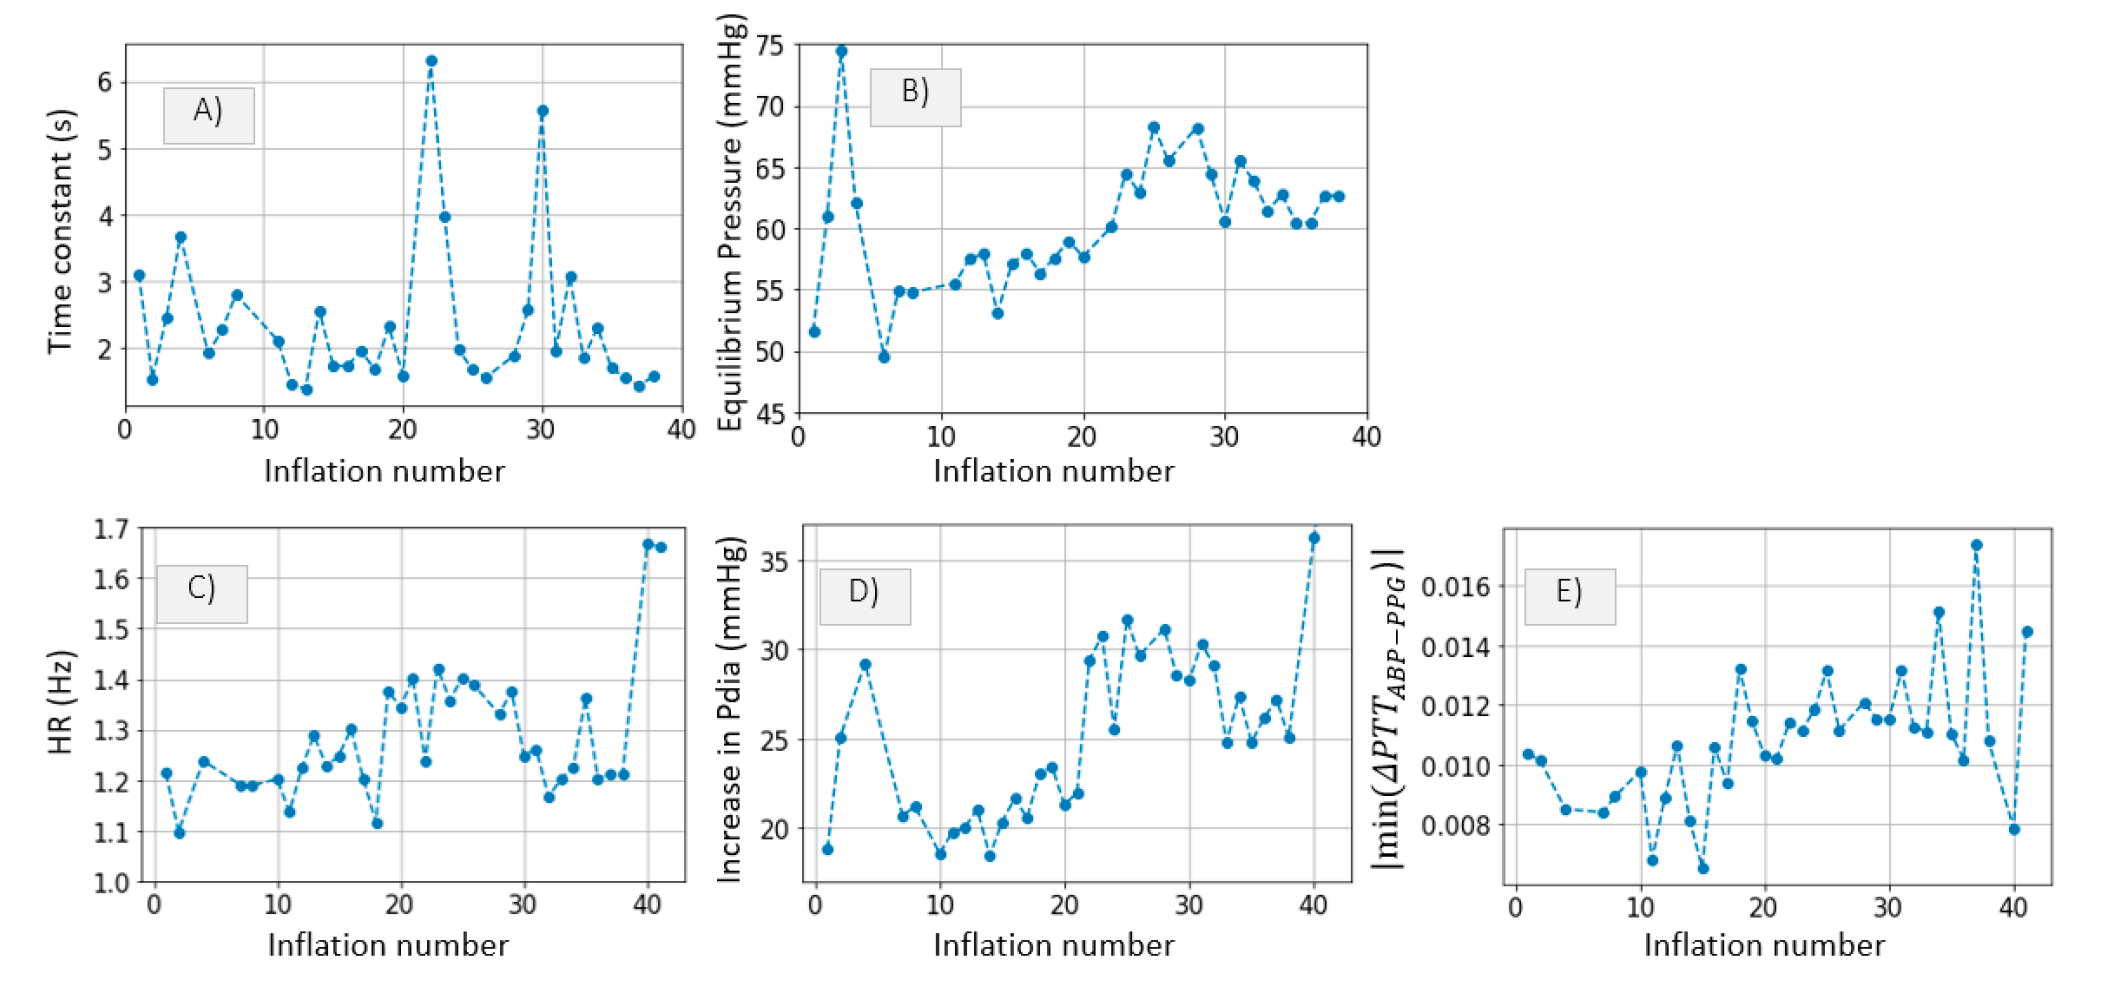
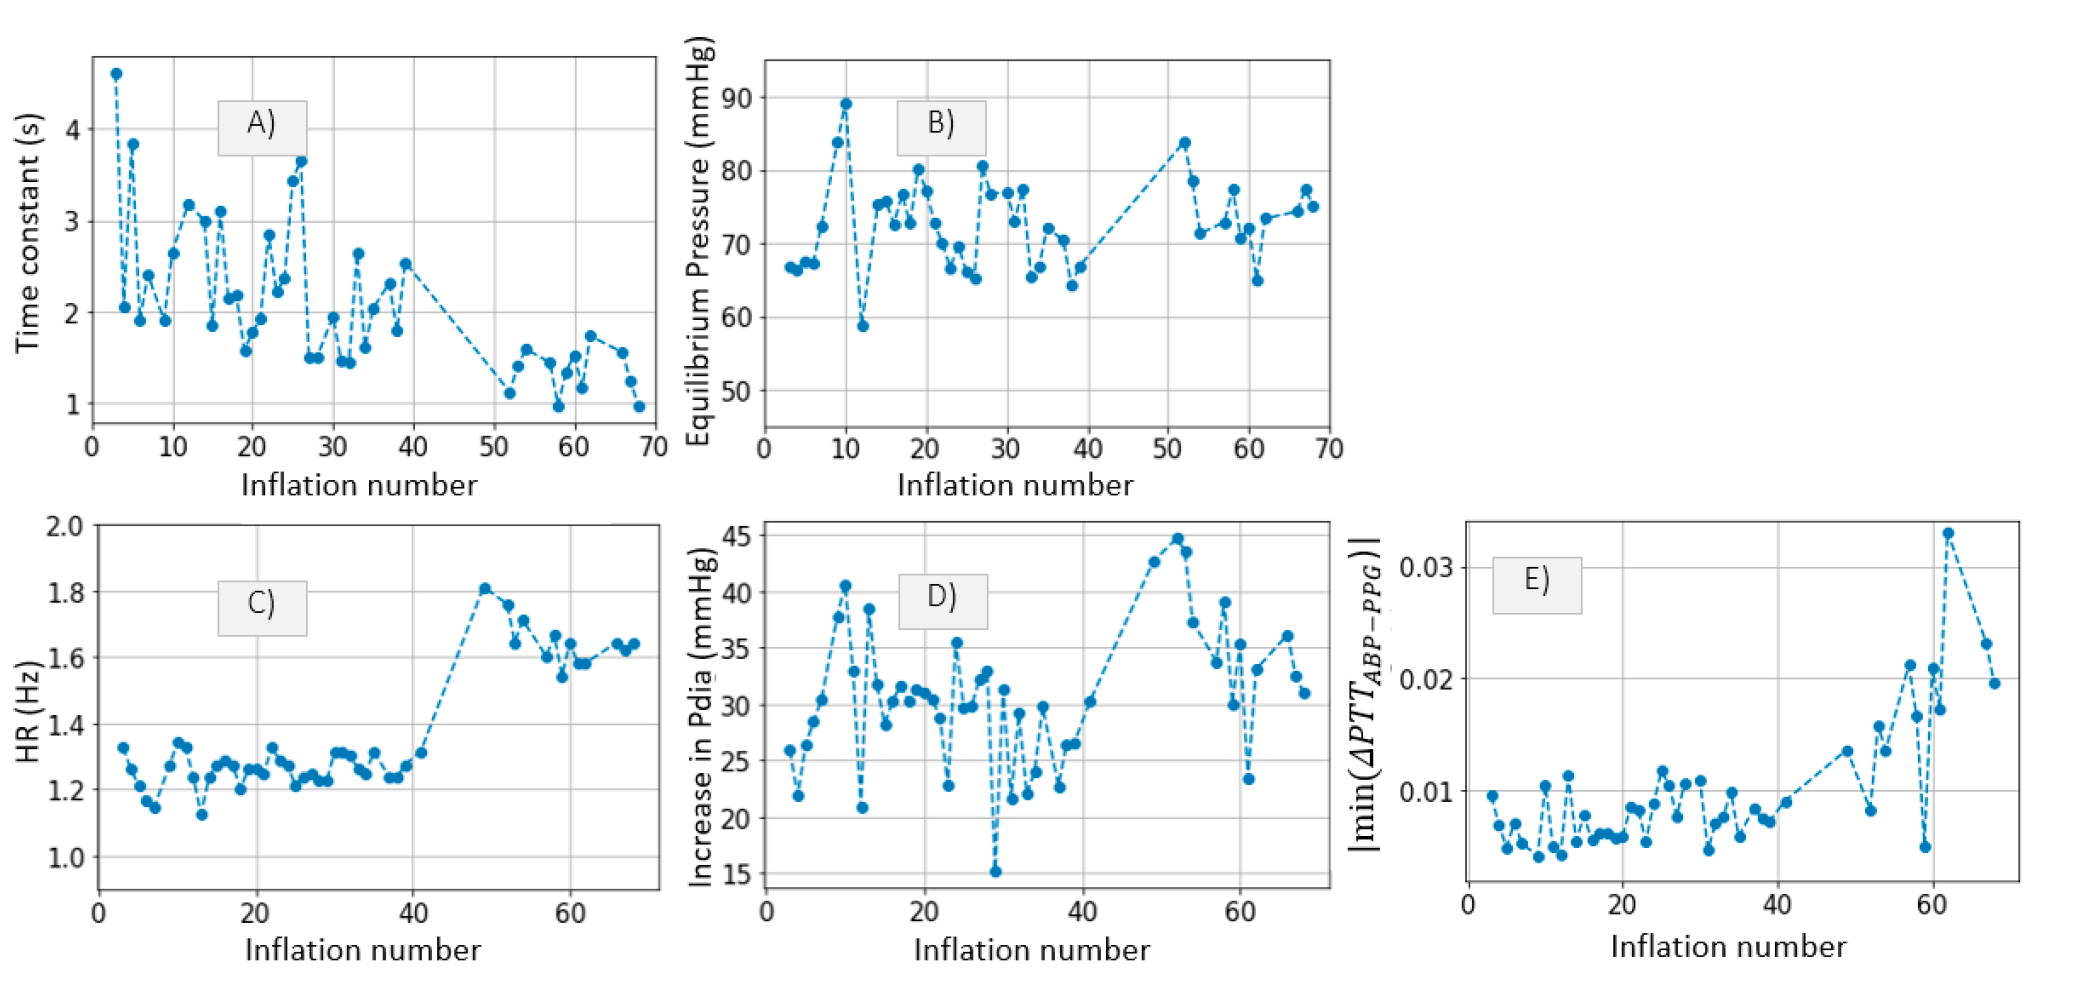
Time Constant and Mean Systemic Filling Pressure
Systemic Resistance, Distal Vascular Compliance
4. Discussion
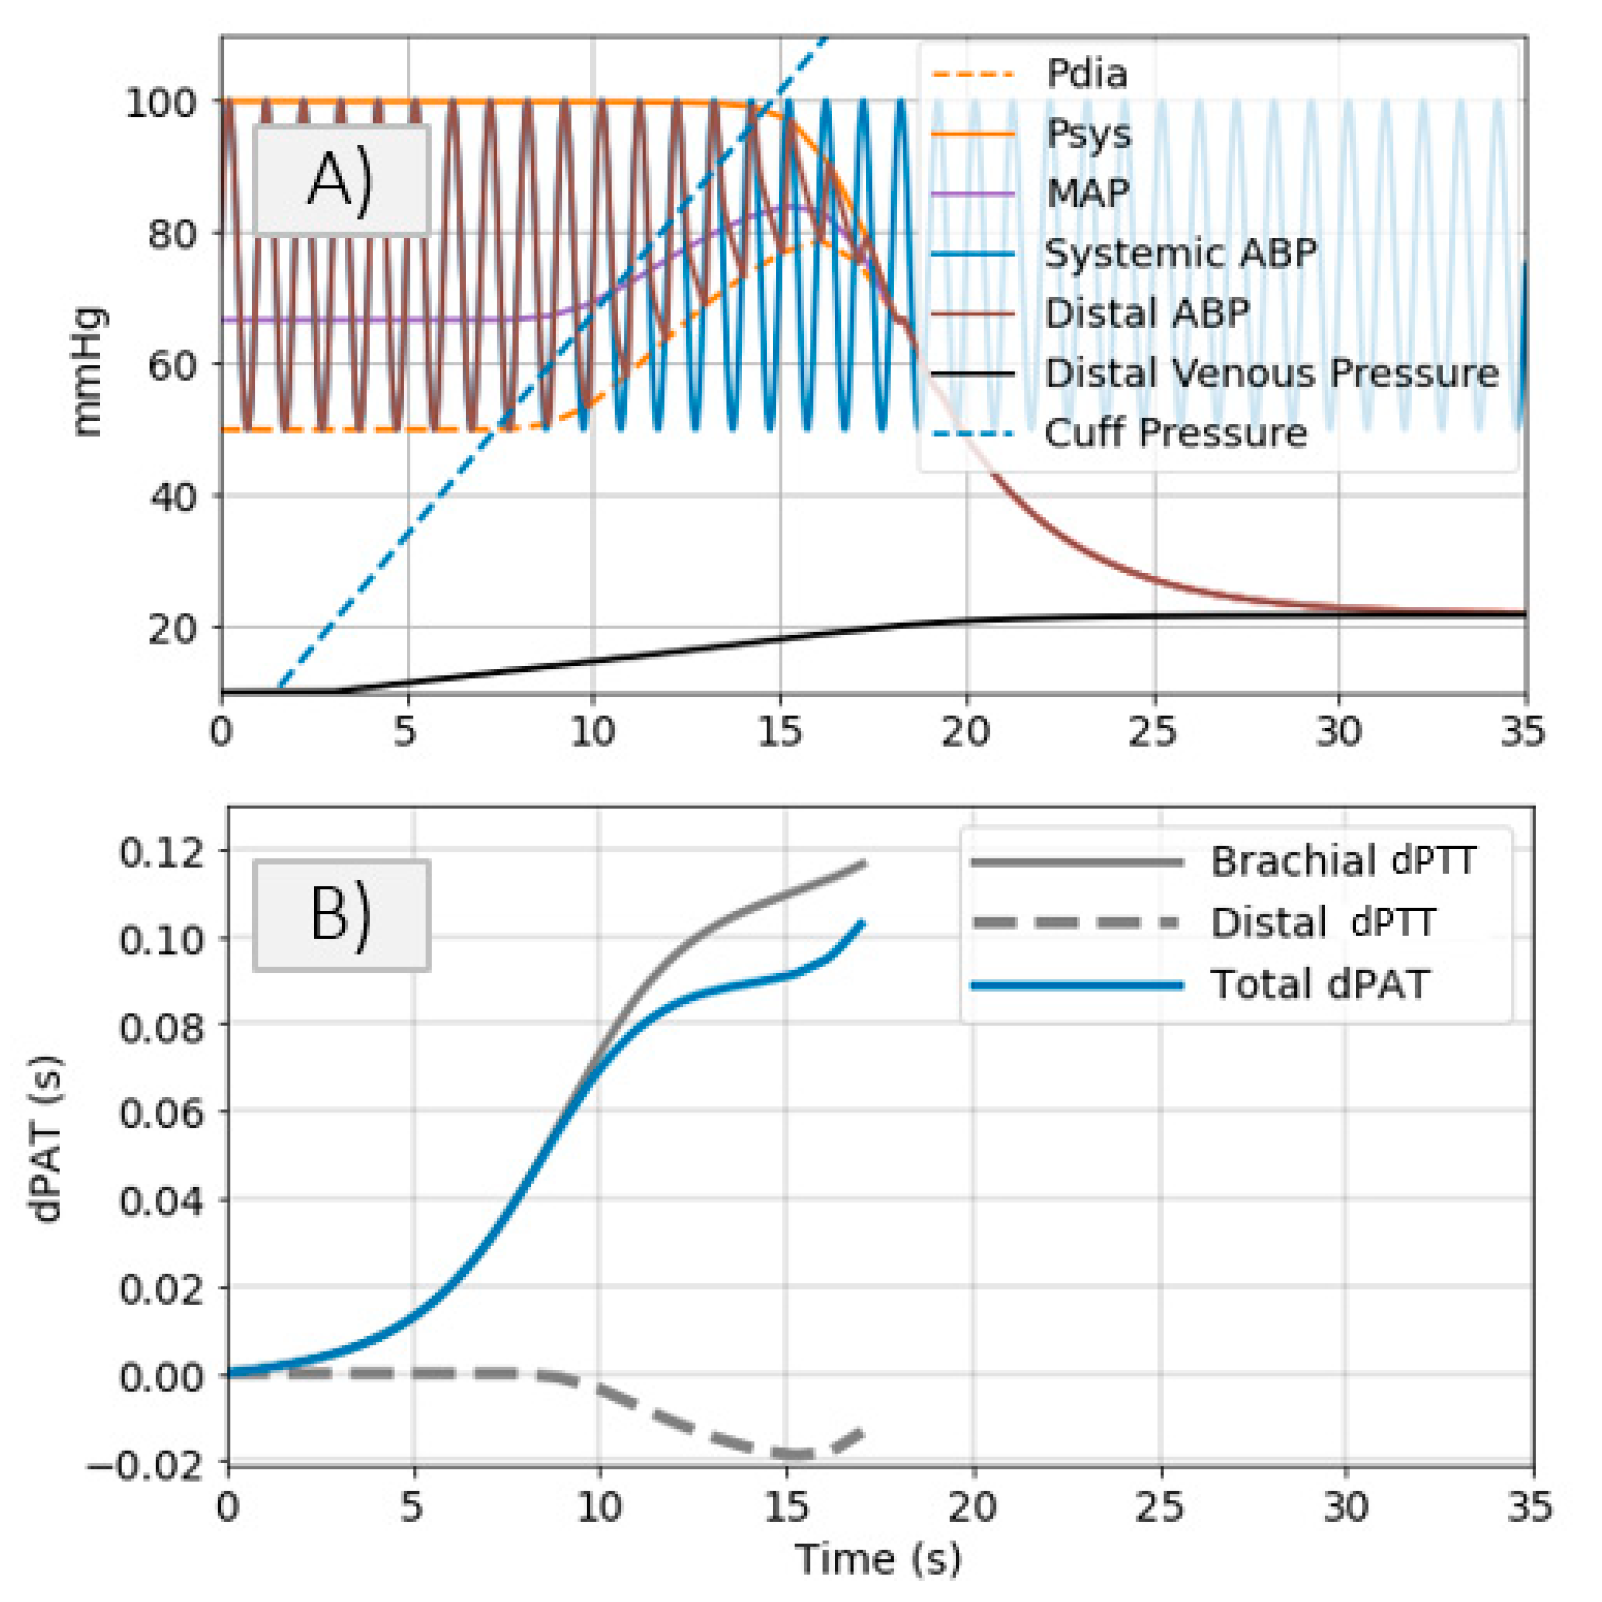
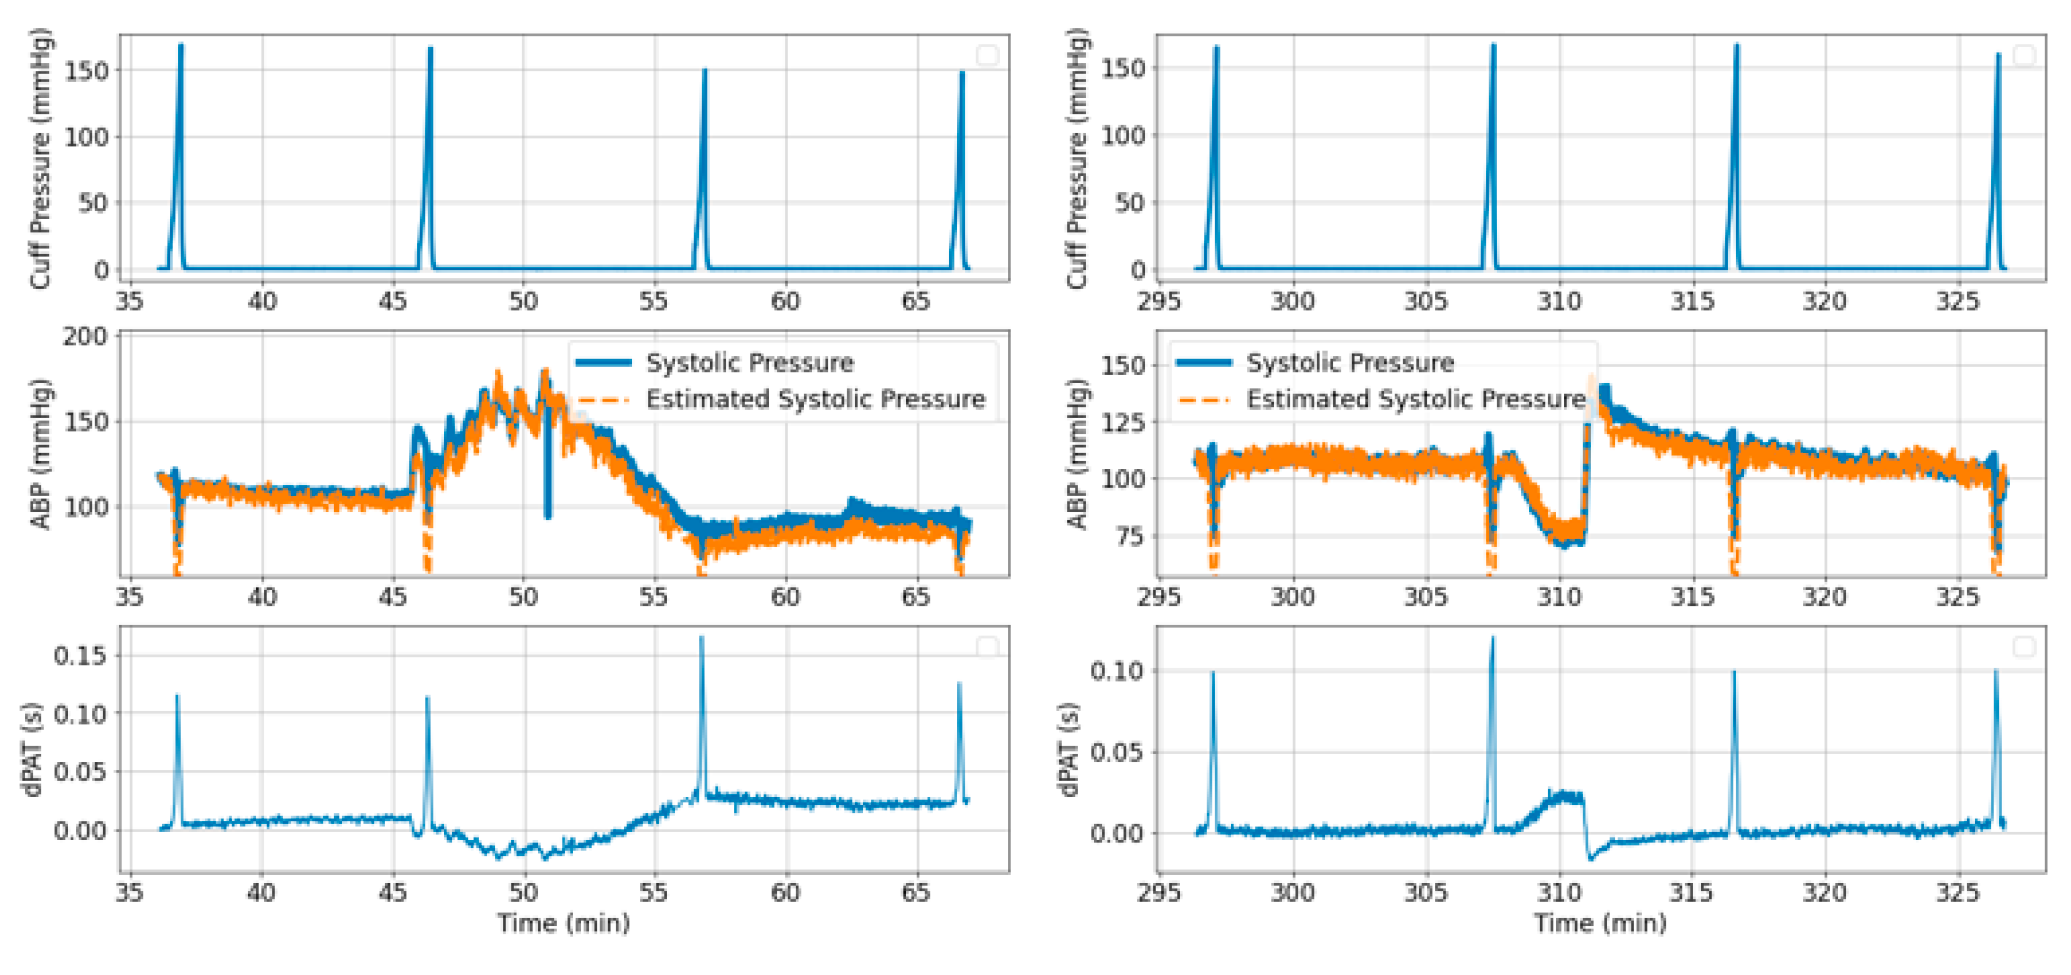
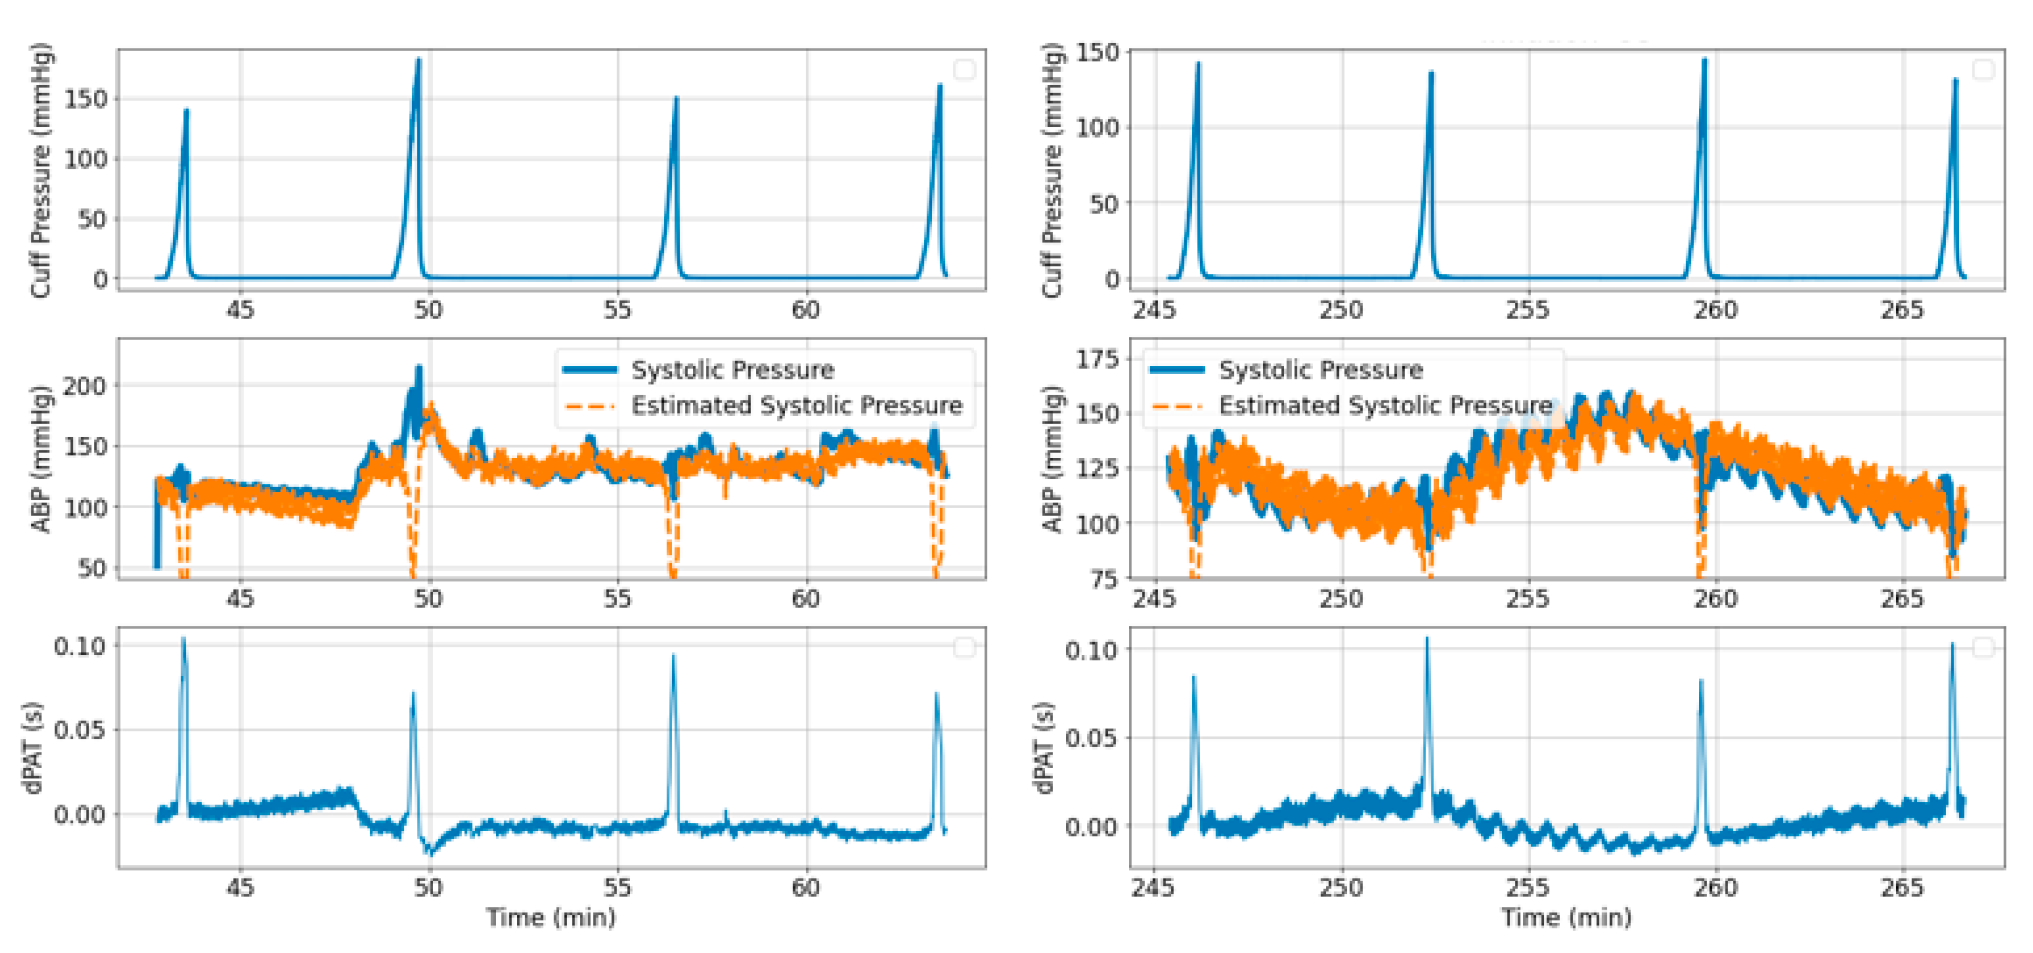
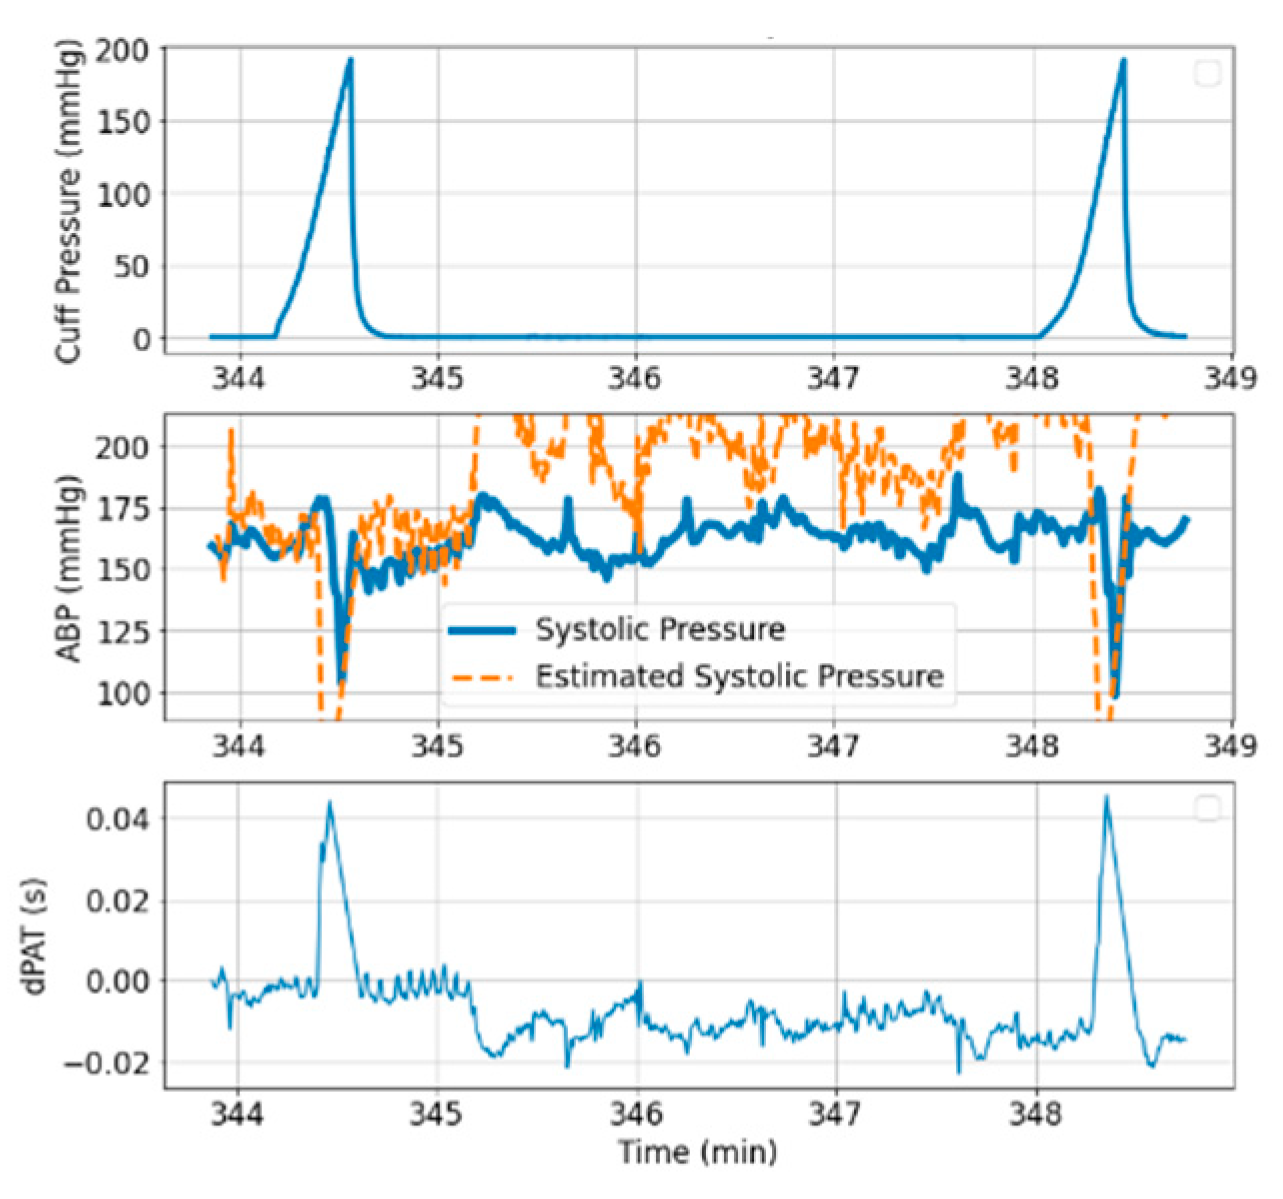
- Cuff pressure value is below systemic venous pressure: arm circulation remains unaltered.
- Cuff pressure increases beyond systemic venous pressure: vein collapses, flow out of the limb is stopped and buildup of blood begins to occur in the limb via the artery; arterial pressure is not visibly altered at this stage.
- Cuff pressure increases beyond systemic diastolic pressure leading to increase in distal diastolic pressure.
- Cuff pressure approaches systemic systolic pressure: minimal amount of blood flows into the limb at each heart-beat, a decrease in the distal systolic pressure is observed.
- Eventually, blood flow is stopped—arterial and venous pressures tend towards an equilibrium value.
4.1. Inference of Brachial Artery Compliance
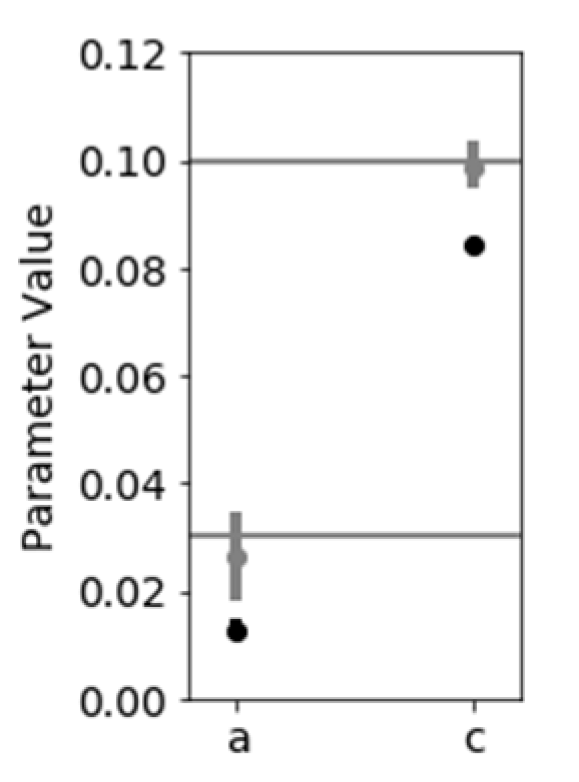
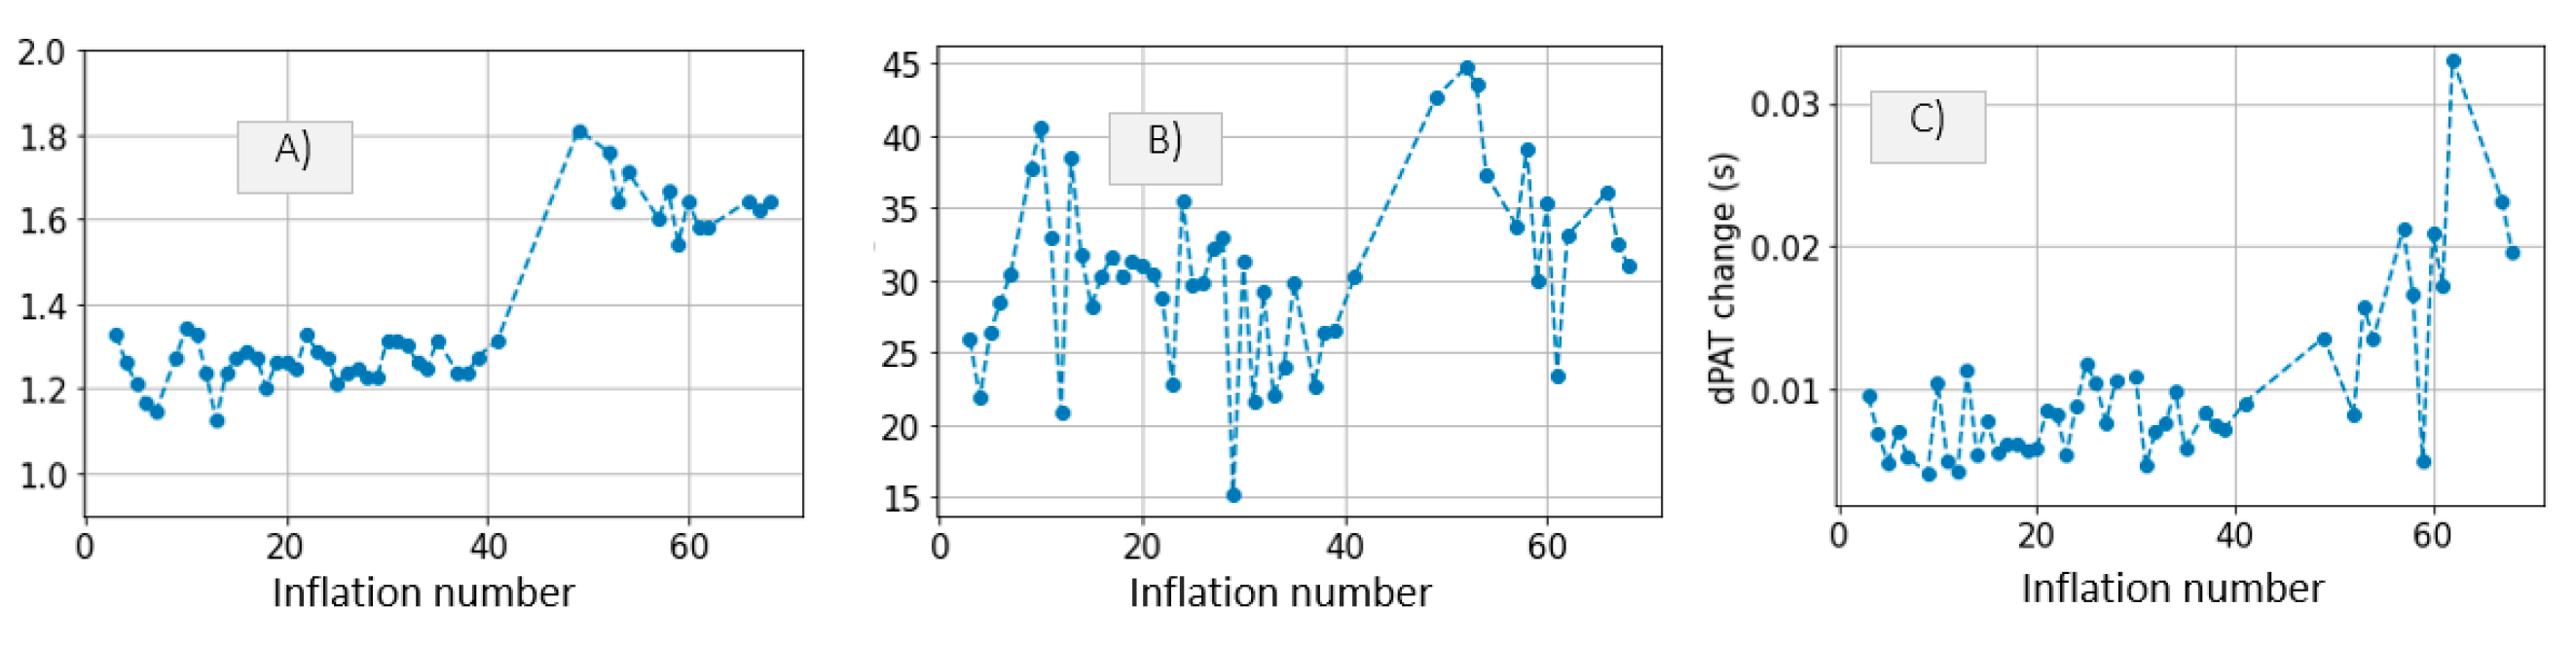
- Disregarding dPAT values recorded at cuff pressures greater than Pdia. This leads to accurate inference of the parameters a and c. One downside is in that a relatively high degree of uncertainty is present (Figure 10). This method is not suited to our data, which includes fast inflation speeds and few PAT points recorded at cuff pressures below Pdia.
4.2. Estimation of PAT-BP Calibration
4.3. Inference of Distal Arm Circulation Parameters
4.3.1. Time Constant and Mean Systemic Filling Pressure
4.3.2. Systemic Resistance, Distal Arterial and Venous Compliance
4.4. Outlook
5. Conclusions
Author Contributions
Funding
Institutional Review Board Statement
Informed Consent Statement
Data Availability Statement
Conflicts of Interest
References
- Bresch, E.; Muehlsteff, J.; Schmitt, L. Cuff-induced changes of pulse arrival time: Models and experimental results. In EMBEC & NBC 2017 IFMBE; Springer: Berlin/Heidelberg, Germany, 2017; pp. 101–104. [Google Scholar]
- Bogatu, L.I.; Turco, S.; Mischi, M.; Woerlee, P.; Bouwman, A.; Korsten, E.H.H.M.; Muehlsteff, J. A modelling framework for assessment of arterial compliance by fusion of oscillometry and pulse wave velocity information. Comput. Methods Programs Biomed. 2020, 196, 105492. [Google Scholar] [CrossRef] [PubMed]
- Vincent, J.L.; Rhodes, A.; Perel, A.; Martin, G.S.; Della Rocca, G.; Vallet, B.; Pinsky, M.R.; Hofer, C.K.; Teboul, J.L.; de Boode, W.P.; et al. Clinical review: Update on hemodynamic monitoring—A consensus of 16. Crit. Care 2011, 15, 1–8. [Google Scholar] [CrossRef] [PubMed] [Green Version]
- Yan, Y.S.; Zhang, Y.T. A model-based calibration method for noninvasive and cuffless measurement of arterial blood pressure. In Proceedings of the 2006 IEEE Biomedical Circuits and Systems Conference, London, UK, 29 November–1 December 2006; IEEE: Piscataway, NJ, USA, 2006; pp. 234–236. [Google Scholar]
- Yan, Y.S.; Zhang, Y.T. A novel calibration method for noninvasive blood pressure measurement using pulse transit time. In Proceedings of the 2007 4th IEEE/EMBS International Summer School and Symposium on Medical Devices and Biosensors, Cambridge, UK, 19–22 August 2007; IEEE: Piscataway, NJ, USA, 2007; pp. 22–24. [Google Scholar]
- Drzewiecki, G.; Hood, R.; Apple, H. Theory of the oscillometric maximum and the systolic and diastolic detection ratios. Ann. Biomed. Eng. 1994, 22, 88–96. [Google Scholar] [CrossRef] [PubMed]
- Bank, A.; Kaiser, D.; Rajala, S.; Cheng, A. In Vivo Human Brachial Artery Elastic Mechanics. Circulation 1999, 100, 41–47. [Google Scholar] [CrossRef] [PubMed] [Green Version]
- Babbs, C.F. Oscillometric measurement of systolic and diastolic blood pressures validated in a physiologic mathematical model. BioMed. Eng. OnLine 2012, 56, 1–22. [Google Scholar] [CrossRef] [PubMed] [Green Version]
- Philips. 2021 Patient Monitoring Systems|Philips Healthcare. Available online: https://www.philips.nl/healthcare/solutions/patientbewaking/clinical-measurement-modules (accessed on 17 August 2021).
- Edwards. TruWave Pressure Transducers|Edwards Lifesciences. 2021. Available online: https://www.edwards.com/devices/pressure-monitoring/transducer (accessed on 7 June 2021).
- Seagar, A.D.; Gibbs, J.M.; Davis, F.M. Interpretation of venous occlusion plethysmographic measurements using a simple model. Med. Biol. Eng. Comput. 1984, 22, 12–18. [Google Scholar] [CrossRef] [PubMed]
- Seshadri, R. Venous Hemodynamics, 2nd ed.; Elsevier: Amsterdam, The Netherlands, 2019; Chapter 2; pp. 21–36. ISBN 9780323511391. [Google Scholar]
- Rothe, C. Venous System: Physiology of the Capacitance Vessels. Compr. Physiol. 2011, 397–452. [Google Scholar] [CrossRef]
- Smink, J.; Bogatu, L.; Muehlsteff, J.; Bresch, E. Dynamic MRI visualization of the brachial artery during upper arm inflations. In Proceedings of the Meeting of ISMRM, Montreal, QC, Canada, 11–16 May 2019; p. 2019. [Google Scholar]
- Bogatu, L.; Muehlsteff, J.; Bresch, E.; Smink, J.; Woerlee, P.H. Insights into oscillometry: An Experimental Study for Improvement of Cuff-Based Blood Pressure Measurement Technology. In Proceedings of the 2019 41st Annual International Conference of the IEEE Engineering in Medicine and Biology Society, Berlin, Germany, 23–27 July 2019; pp. 7068–7071. [Google Scholar]
- Alastruey, J.; Parker, K.H.; Peiró, J.; Sherwin, S.J. Can the modified Allen’s test always detect sufficient collateral flow in the hand? A computational study. Comput. Methods Biomech. Biomed. Eng. 2006, 9, 353–361. [Google Scholar] [CrossRef] [PubMed]
- Gelman, S.; Warner, D.S.; Warner, M.A. Venous Function and Central Venous Pressure: A Physiologic Story. Anesthesiology 2008, 108, 735–748. [Google Scholar] [CrossRef] [PubMed] [Green Version]
- Jansen, J.R.; Maas, J.J.; Pinsky, M.R. Bedside assessment of mean systemic filling pressure. Curr. Opin. Crit. Care 2010, 16, 231–236. [Google Scholar] [CrossRef] [PubMed]
- Maas, J.J.; Pinsky, M.R.; Geerts, B.F.; de Wilde, R.B.; Jansen, J.R. Estimation of mean systemic filling pressure in postoperative cardiac surgery patients with three methods. Intensive Care Med. 2012, 38, 1452–1460. [Google Scholar] [CrossRef] [PubMed] [Green Version]
- Kruschke, J. Doing Bayesian Data Analysis; Academic Press: Burlington, MA, USA, 2011. [Google Scholar]
- Bogatu, L.; Turco, S.; Mischi, M.; Muehlsteff, J.; Woerlee, P.H. An Experimental Study on the Blood Pressure Cuff as a Transducer for Oscillometric Blood Pressure Measurements. IEEE Trans. Instrum. Meas. 2020, 70, 1–11. [Google Scholar] [CrossRef]
- Pinsky, M.R.; Payen, D. Functional hemodynamic monitoring. Crit. Care 2005, 9, 566–572. [Google Scholar] [CrossRef] [PubMed] [Green Version]
- Kuvin, J.T.; Patel, A.R.; Sliney, K.A.; Pandian, N.G.; Sheffy, J.; Schnall, R.P.; Karas, R.H.; Udelson, J.E. Assessment of peripheral vascular endothelial function with finger arterial pulse wave amplitude. Am. Heart J. 2003, 146, 168–174. [Google Scholar] [CrossRef]
- Pinsky, M.R. Functional Hemodynamic Monitoring. Crit. Care Clin. 2015, 31, 89–111. [Google Scholar] [CrossRef] [PubMed] [Green Version]


Publisher’s Note: MDPI stays neutral with regard to jurisdictional claims in published maps and institutional affiliations. |
© 2021 by the authors. Licensee MDPI, Basel, Switzerland. This article is an open access article distributed under the terms and conditions of the Creative Commons Attribution (CC BY) license (https://creativecommons.org/licenses/by/4.0/).
Share and Cite
Bogatu, L.I.; Turco, S.; Mischi, M.; Schmitt, L.; Woerlee, P.; Bresch, E.; Noordergraaf, G.J.; Paulussen, I.; Bouwman, A.; Korsten, H.H.M.; et al. Modulation of Pulse Propagation and Blood Flow via Cuff Inflation—New Distal Insights. Sensors 2021, 21, 5593. https://doi.org/10.3390/s21165593
Bogatu LI, Turco S, Mischi M, Schmitt L, Woerlee P, Bresch E, Noordergraaf GJ, Paulussen I, Bouwman A, Korsten HHM, et al. Modulation of Pulse Propagation and Blood Flow via Cuff Inflation—New Distal Insights. Sensors. 2021; 21(16):5593. https://doi.org/10.3390/s21165593
Chicago/Turabian StyleBogatu, Laura I., Simona Turco, Massimo Mischi, Lars Schmitt, Pierre Woerlee, Erik Bresch, Gerrit J. Noordergraaf, Igor Paulussen, Arthur Bouwman, Hendrikus H. M. Korsten, and et al. 2021. "Modulation of Pulse Propagation and Blood Flow via Cuff Inflation—New Distal Insights" Sensors 21, no. 16: 5593. https://doi.org/10.3390/s21165593