
Thermal Characterization of New 3D-Printed Bendable, Coplanar Capacitive Sensors

 ,
,  and
and 
Abstract
:1. Introduction
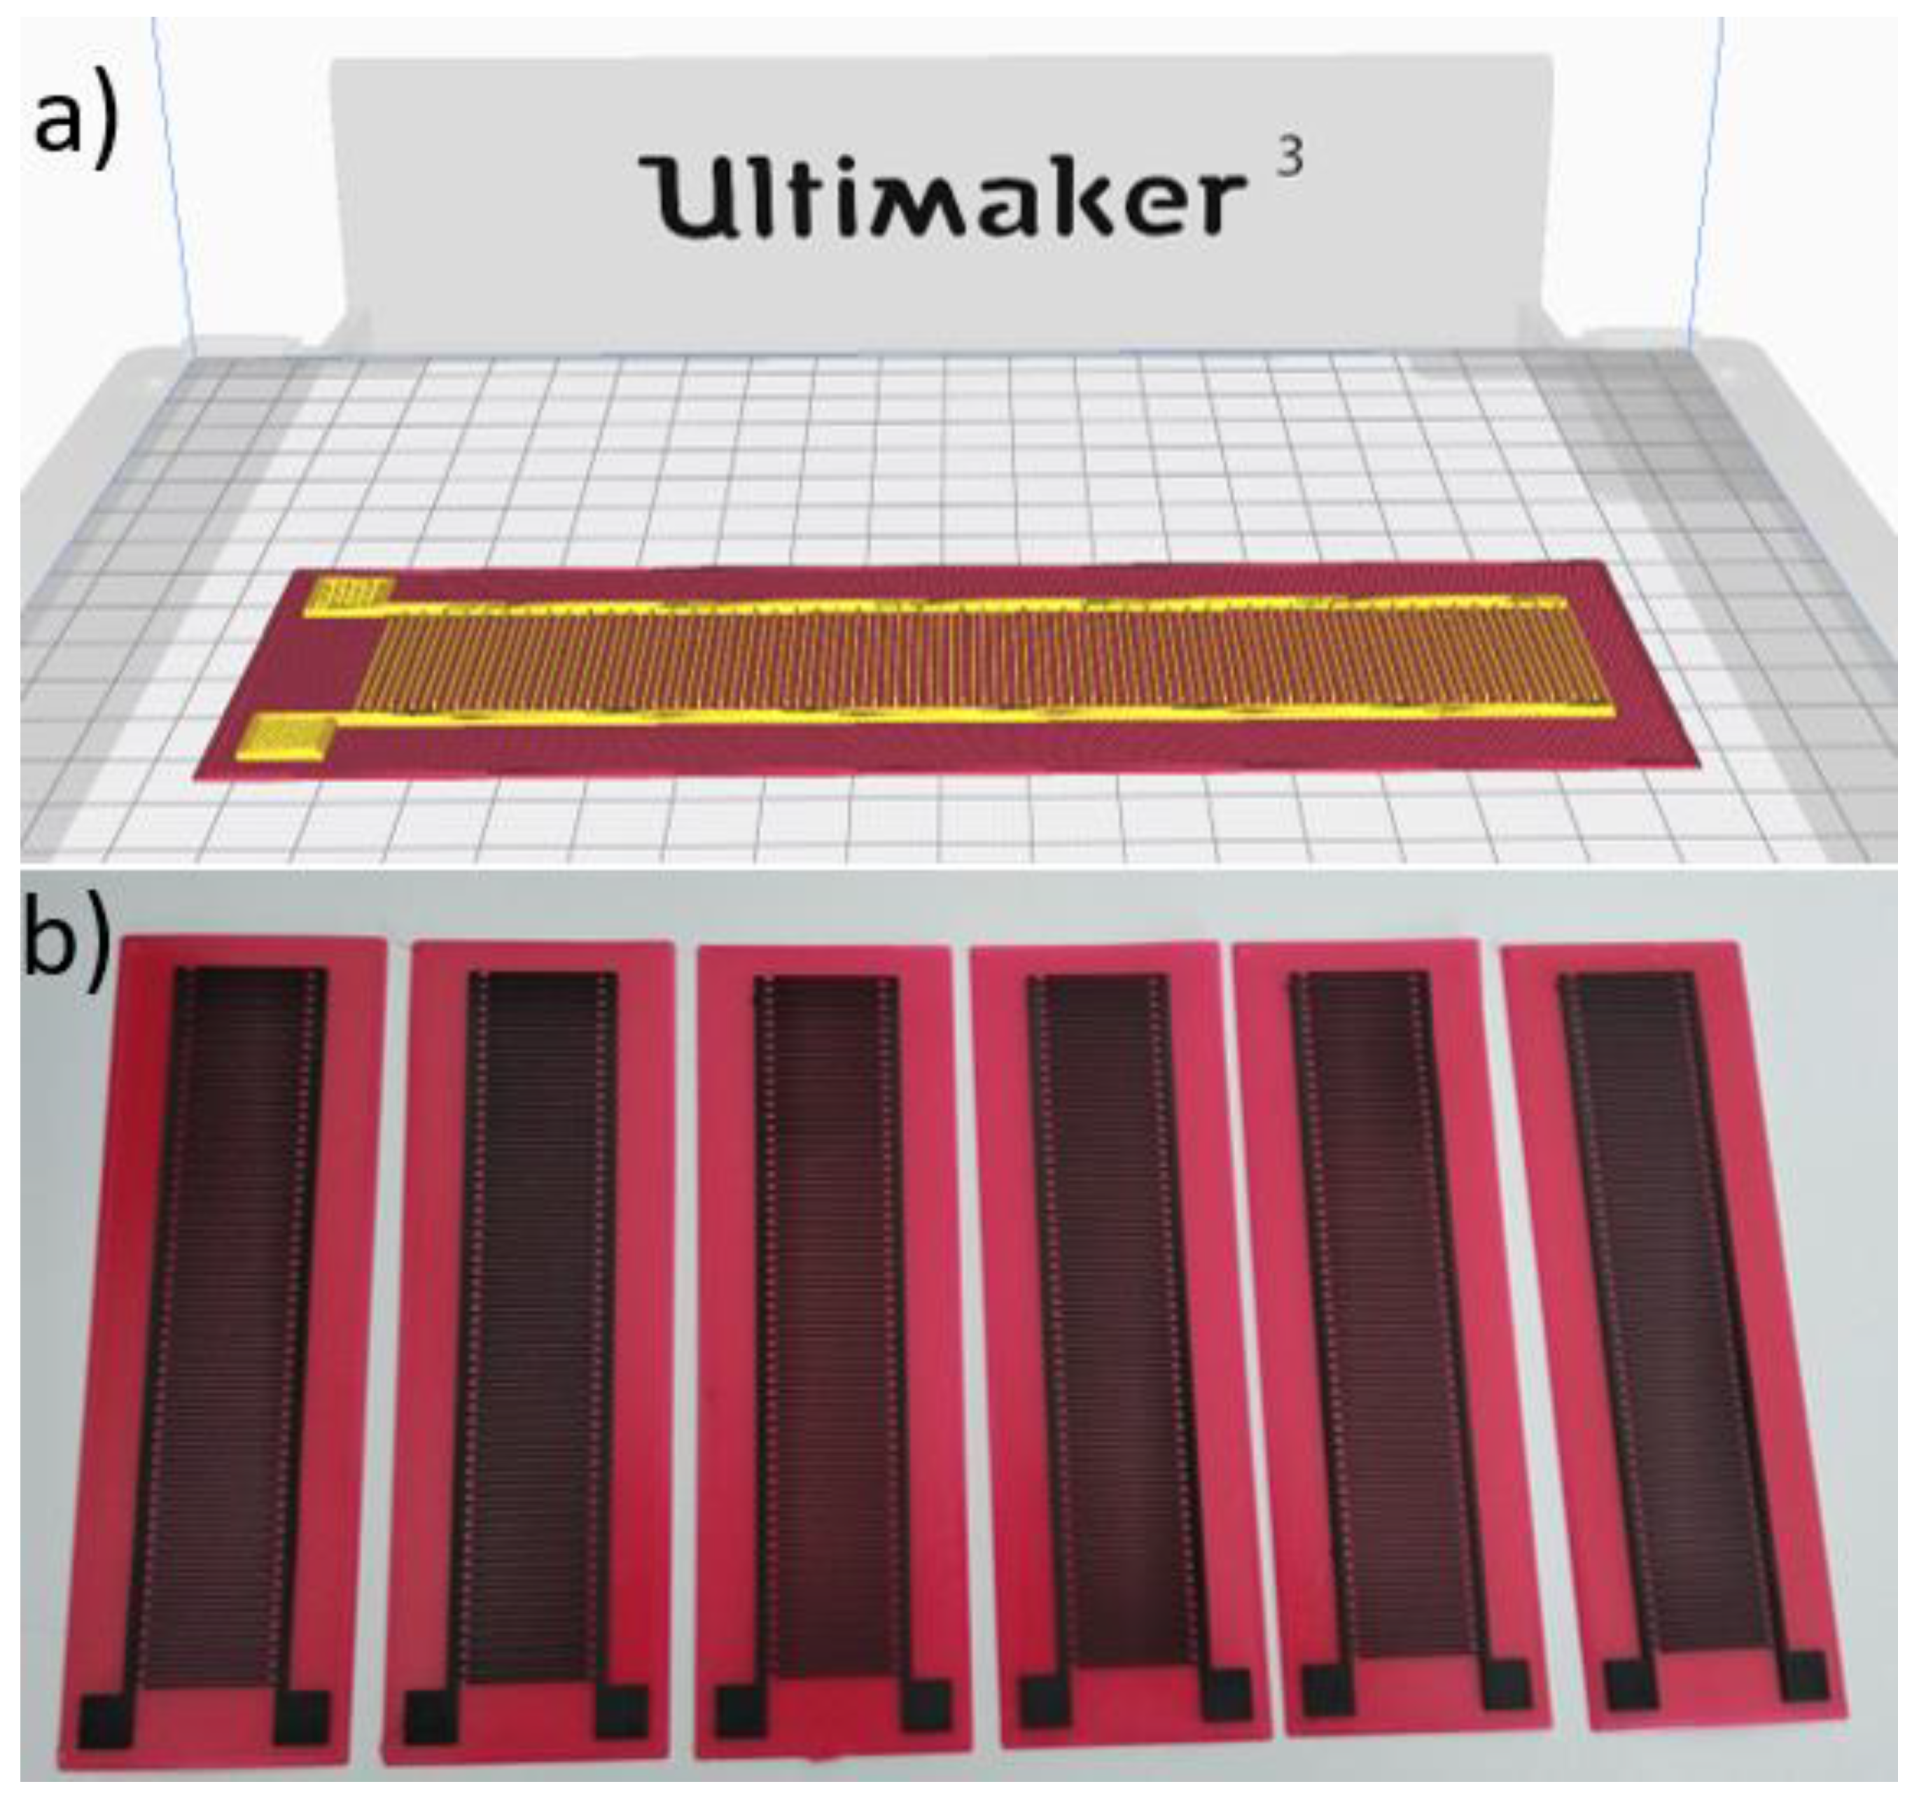
2. Manufacturing
- (1)
- The possibility to directly extrude two different materials in the same printing cycle. Thermoplastic polyurethane (TPU 95A, Ultimaker B.V., Utrecht, Netherlands) and a conductive material (AlfaOhm, Filoalfa by Ciceri de Mondel S.r.l., Turin, Italy) were employed for the flexible substrate and the electrodes, respectively. According to corresponding technical data sheets, the first one is characterized by an elongation at break of 580%, whereas the second one is a polylactic acid (PLA)-based filament doped with carbon nanotubes with a resistivity of 15 Ω cm along the layers.
- (2)
- The usage of only one manufacturing technology to manufacture the whole sensor: generally, at least two different technologies are required (one for the electrodes and one for the flexible substrate), so a reduction of manual and assembly tasks was achieved in conjunction with a reduction in the supply chain.
3. Characterization
3.1. Bending
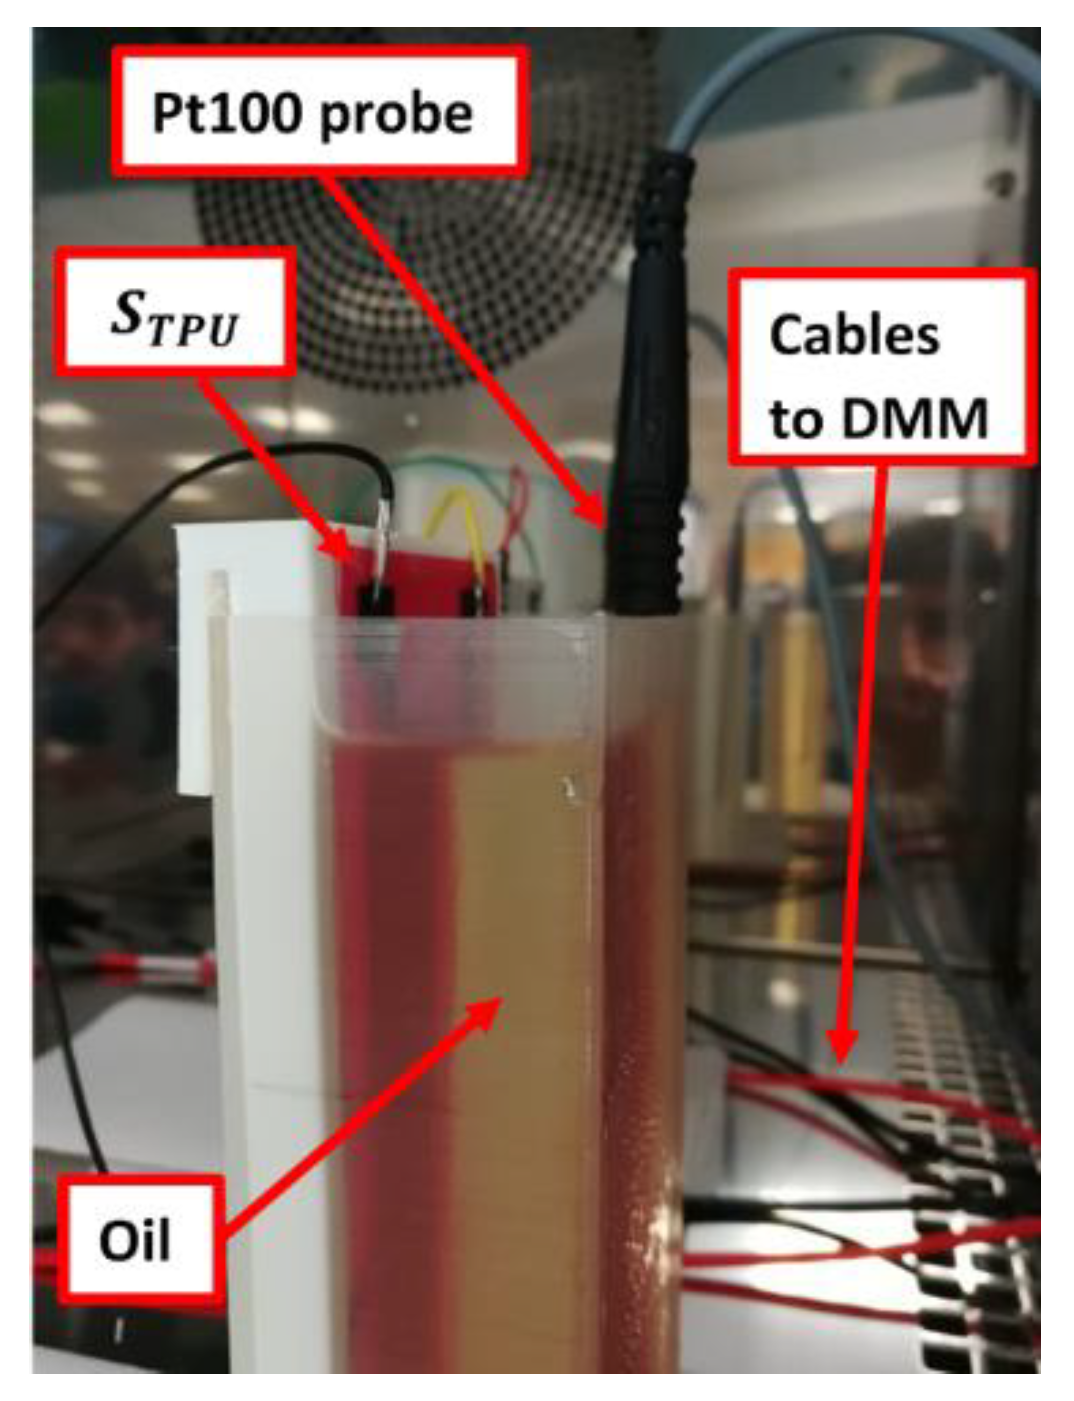
3.2. Thermal Characterization
- (1)
- A DY250 climatic chamber (Angelantoni Test Technologies S.r.l., Massa Martana, Italy), which can provide a temperature range from –40 °C to 180 °C. The temperature in the chamber was measured by means of a Pt100 resistive temperature probe, which was placed at the bottom of the test chamber.
- (2)
- The WinKratos software (Angelantoni Test Technologies S.r.l., Massa Martana, Italy), for remote control of the climatic chamber for automatic tests and temperature profile setting.
- (3)
- A 34461A digital multimeter (Keysight, Santa Rosa, CA, USA) to measure sensor capacitance.
- (4)
- A GDM-8351 digital multimeter (Good Will Instruments Co., Ltd., New Taipei City, Taiwan) to perform 4-wire resistance measurement of a SE019 Pt100 temperature sensor, with an uncertainty of 0.15 °C at 0 °C, which was inserted into the tank to accurately measure liquid temperature.
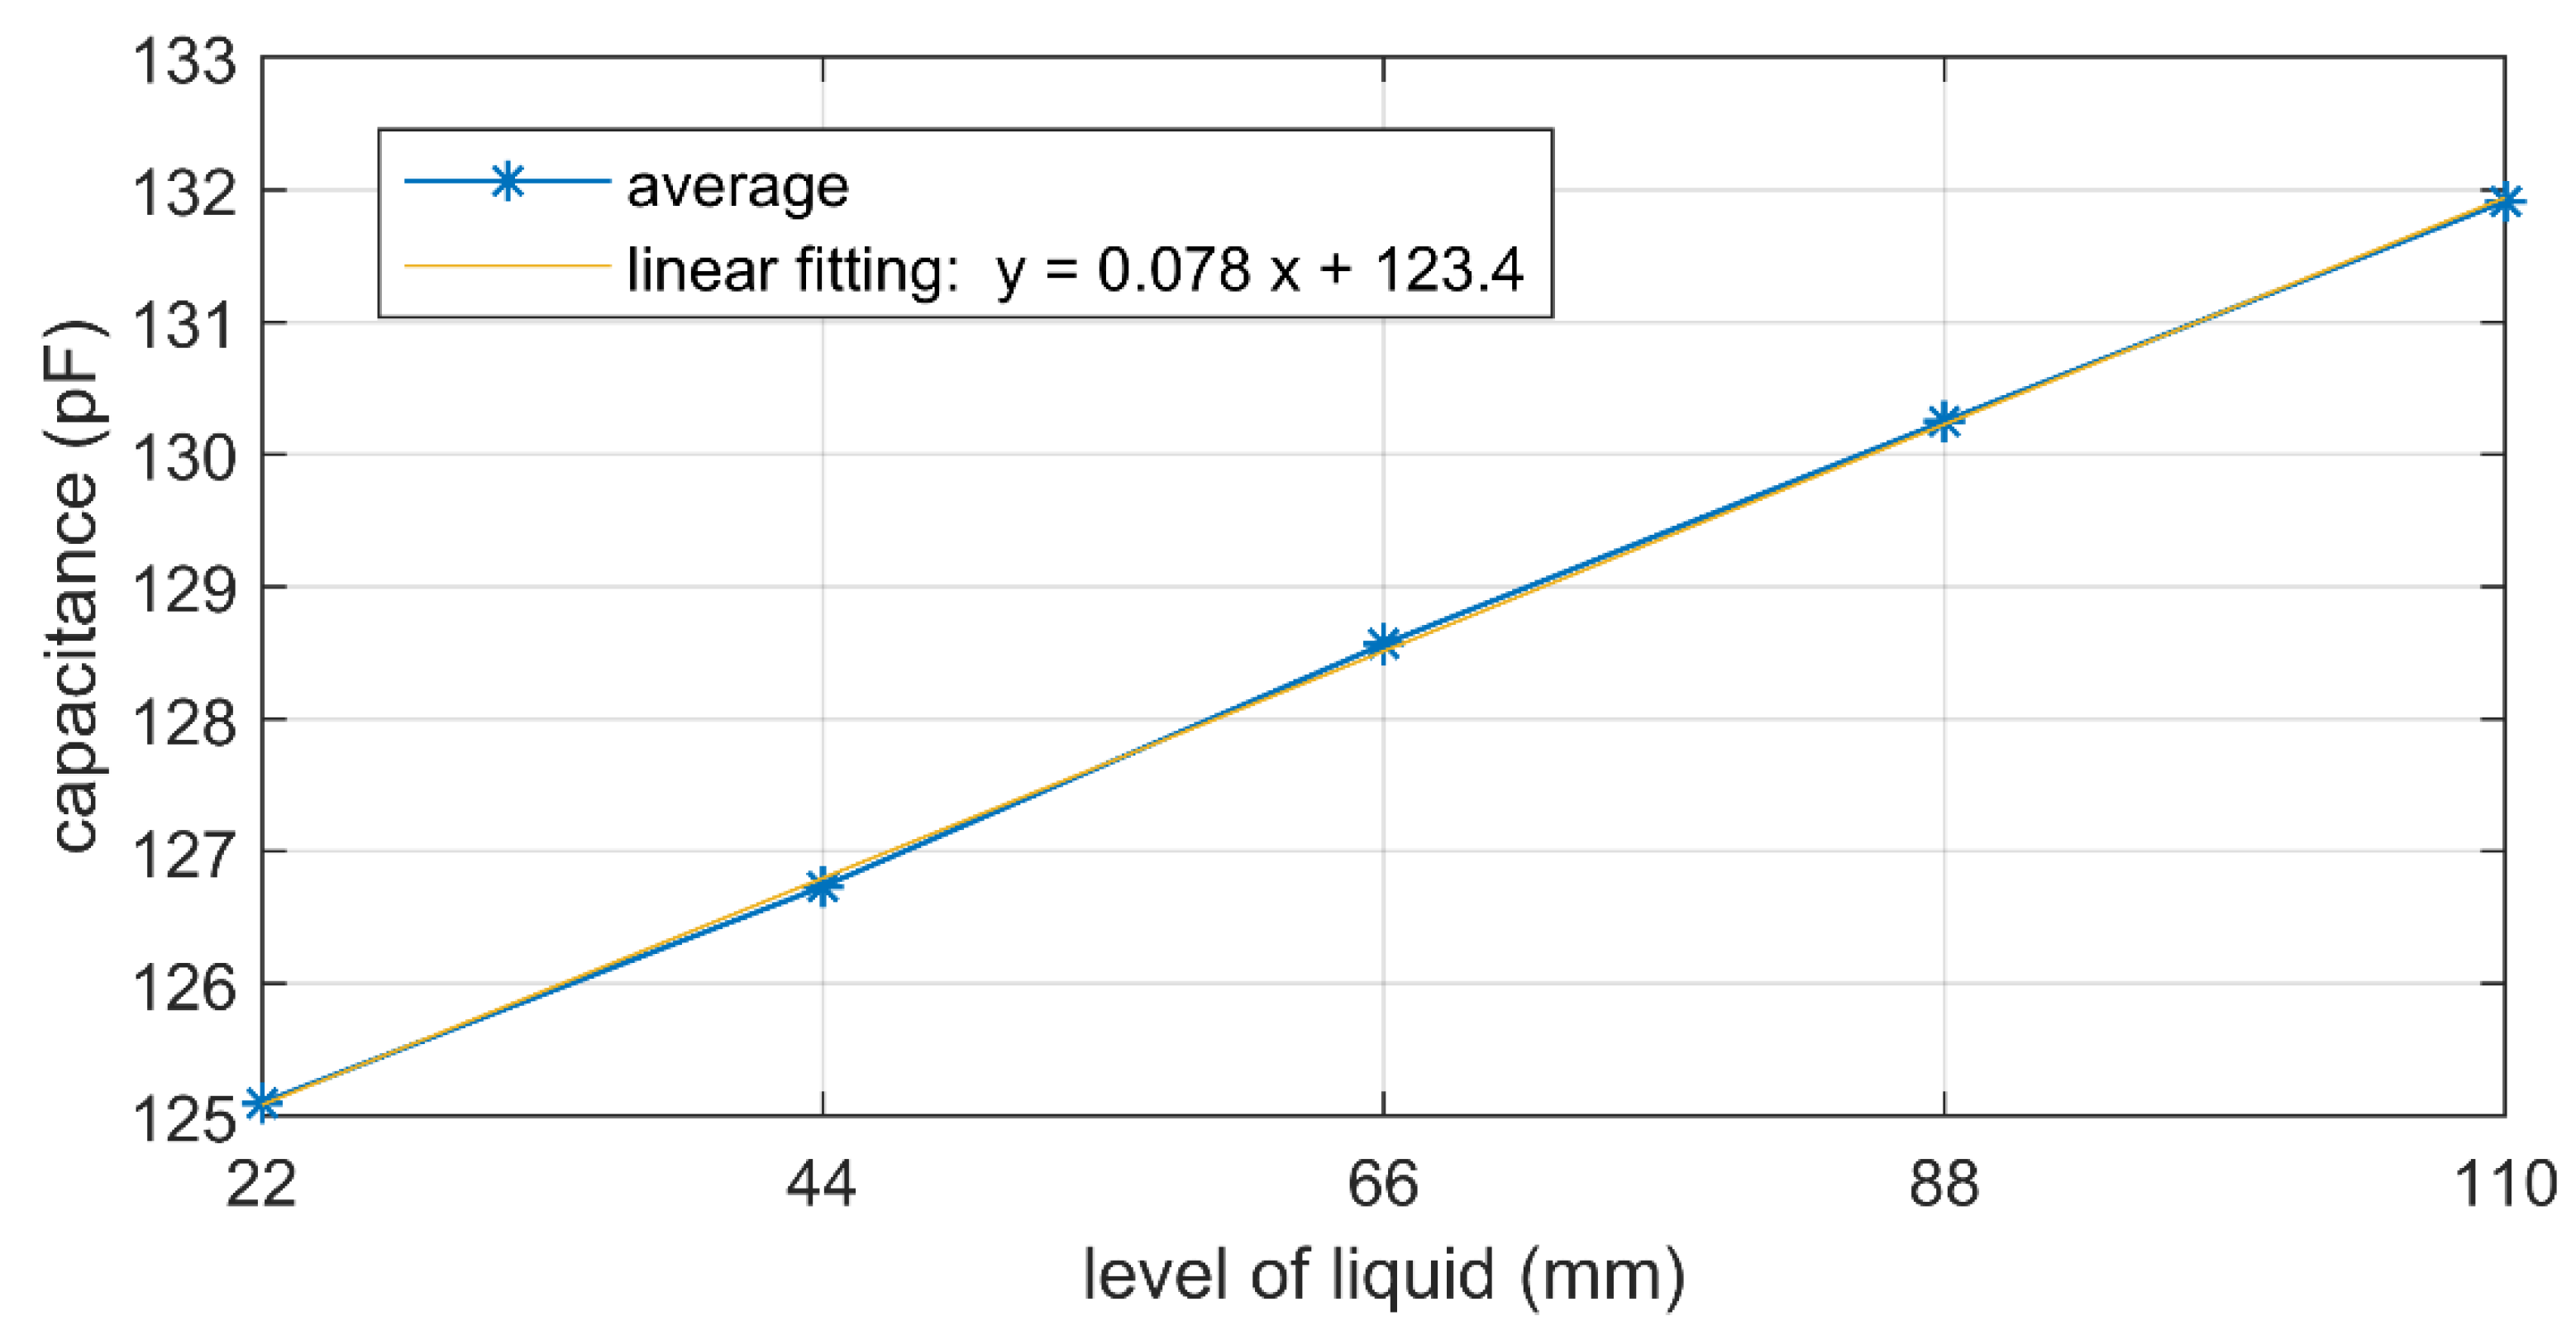
3.2.1. Sensitivity
3.2.2. Repeatability
- (1)
- Repeatability between consecutive cycles, due to sensor intrinsic repeatability. It was calculated by considering capacitance measurements indexed by: corresponding to liquid level ; temperature cycle (where is the number of cycles for a given liquid level); and temperature step . Each has been calculated as the mean of 100 consecutive capacitance readings taken just before the next temperature change (i.e., when temperature and capacitance is stable) in order to reduce noise (the aforementioned moving average). Therefore, repeatability for a given level of liquid , has been calculated as follows:where standard deviations are evaluated in sets corresponding to the same temperature step and liquid level, and different temperature cycles.
- (2)
- Noise contribution, due to the measurement process. It was calculated by considering capacitance STD , with the same meaning for indexes as above. Each was calculated as the STD of 100 consecutive capacitance readings taken just before the next temperature change:
3.2.3. Hysteresis
4. Discussion
5. Conclusions
- Sensitivity, hysteresis and repeatability have been analysed, and their effect on liquid level measurement have been quantified by means of error propagation. The main error contribution is due to random measurement noise, which can be reduced by averaging or by usage of a different capacitance measurement technique.
- The thermal characterization has produced a model relating capacitance with temperature and liquid level, showing a linear dependence on the liquid level and a quadratic dependence on the temperature, with its maximum at about 40.6 °C. The model fitted well to experimental data, providing a valuable tool to compensate errors due to temperature variations, after measuring liquid temperature by means of external or embedded sensors.
- The experiments have shown insensitivity of capacitance to bending stimuli. This may be exploited to develop wearable sensors, not for detecting body motion, but different variables such as temperature or presence of liquids.
Author Contributions
Funding
Institutional Review Board Statement
Informed Consent Statement
Data Availability Statement
Conflicts of Interest
References
- Khosravani, M.R.; Reinicke, T. 3D-printed sensors: Current progress and future challenges. Sens. Actuators A Phys. 2020, 305, 111916. [Google Scholar] [CrossRef]
- Schouten, M.; Wolterink, G.; Dijkshoorn, A.; Kosmas, D.; Stramigioli, S.; Krijnen, G. A Review of Extrusion-Based 3D Printing for the Fabrication of Electro- and Biomechanical Sensors. IEEE Sens. J. 2021, 21, 12900–12912. [Google Scholar] [CrossRef]
- Palmić, T.B.; Slavič, J.; Boltežar, M. Process Parameters for FFF 3D-Printed Conductors for Applications in Sensors. Sensors 2020, 20, 4542. [Google Scholar] [CrossRef]
- Stano, G.; Di Nisio, A.; Lanzolla, A.M.; Ragolia, M.; Percoco, G. Fused filament fabrication of commercial conductive filaments: Experimental study on the process parameters aimed at the minimization, repeatability and thermal characterization of electrical resistance. Int. J. Adv. Manuf. Technol. 2020, 111, 2971–2986. [Google Scholar] [CrossRef]
- Cardenas, J.A.; Tsang, H.; Tong, H.; Abuzaid, H.; Price, K.; Cruz, M.A.; Wiley, B.J.; Franklin, A.D.; Lazarus, N. Flash ablation metallization of conductive thermoplastics. Addit. Manuf. 2020, 36, 101409. [Google Scholar] [CrossRef]
- Dul, S.; Pegoretti, A.; Fambri, L. Fused Filament Fabrication of Piezoresistive Carbon Nanotubes Nanocomposites for Strain Monitoring. Front. Mater. 2020, 7, 1–13. [Google Scholar] [CrossRef] [Green Version]
- Arh, M.; Slavič, J.; Boltežar, M. Design principles for a single-process 3d-printed accelerometer—Theory and experiment. Mech. Syst. Signal Process. 2021, 152, 107475. [Google Scholar] [CrossRef]
- Hohimer, C.J.; Petrossian, G.; Ameli, A.; Mo, C.; Pötschke, P. 3D printed conductive thermoplastic polyurethane/carbon nanotube composites for capacitive and piezoresistive sensing in soft pneumatic actuators. Addit. Manuf. 2020, 34, 101281. [Google Scholar] [CrossRef]
- Christ, J.F.; Aliheidari, N.; Pötschke, P.; Ameli, A. Bidirectional and Stretchable Piezoresistive Sensors Enabled by Multimaterial 3D Printing of Carbon Nanotube/Thermoplastic Polyurethane Nanocomposites. Polymers 2018, 11, 11. [Google Scholar] [CrossRef] [Green Version]
- Stano, G.; Di Nisio, A.; Lanzolla, A.; Percoco, G. Additive manufacturing and characterization of a load cell with embedded strain gauges. Precis. Eng. 2020, 62, 113–120. [Google Scholar] [CrossRef]
- Romeo, L.; Petitti, A.; Marani, R.; Milella, A. Internet of Robotic Things in Smart Domains: Applications and Challenges. Sensors 2020, 20, 3355. [Google Scholar] [CrossRef] [PubMed]
- Mohiuddin, M.; Hoa, S. Temperature dependent electrical conductivity of CNT–PEEK composites. Compos. Sci. Technol. 2011, 72, 21–27. [Google Scholar] [CrossRef]
- Kwok, S.W.; Goh, K.H.H.; Tan, Z.D.; Tan, S.T.M.; Tjiu, W.W.; Soh, J.Y.; Ng, Z.J.G.; Chan, Y.Z.; Hui, H.K.; Goh, K.E.J. Electrically conductive filament for 3D-printed circuits and sensors. Appl. Mater. Today 2017, 9, 167–175. [Google Scholar] [CrossRef]
- Daniel, F.; Patoary, N.H.; Moore, A.L.; Weiss, L.; Radadia, A.D. Temperature-dependent electrical resistance of conductive polylactic acid filament for fused deposition modeling. Int. J. Adv. Manuf. Technol. 2018, 99, 1215–1224. [Google Scholar] [CrossRef]
- Verma, P.; Schiffer, A.; Kumar, S. Thermo-resistive and thermo-piezoresistive sensitivity of carbon nanostructure engineered thermoplastic composites processed via additive manufacturing. Polym. Test. 2021, 93, 106961. [Google Scholar] [CrossRef]
- Nanni, F.; Nacamulli, S.; De Francesco, R.; Petritoli, E. A new reliability approach for additive layers manufactured components: A preliminary investigation. In Proceedings of the 2017 IEEE International Workshop on Metrology for AeroSpace (MetroAeroSpace), Padua, Italy, 21–23 June 2017; pp. 287–290. [Google Scholar]
- Giarnetti, S.; De Francesco, E.; De Francesco, R.; Nanni, F.; Cagnetti, M.; Leccese, F.; Petritoli, E.; Spagnolo, G.S. A New Approach to define reproducibility of Additive Layers manufactured components. In Proceedings of the 2020 IEEE 7th International Workshop on Metrology for AeroSpace (MetroAeroSpace), virtual conference, 22–24 June 2020; pp. 529–533. [Google Scholar]
- Petritoli, E.; Leccese, F.; Ciani, L. Reliability and maintenance analysis of unmanned aerial vehicles. Sensors 2018, 18, 3171. [Google Scholar] [CrossRef] [Green Version]
- Catelani, M.; Ciani, L.; Venzi, M. RBD Model-Based Approach for Reliability Assessment in Complex Systems. IEEE Syst. J. 2019, 13, 2089–2097. [Google Scholar] [CrossRef]
- Kapoor, A.; McKnight, M.; Chatterjee, K.; Agcayazi, T.; Kausche, H.; Ghosh, T.; Bozkurt, A. Soft, flexible 3D printed fibers for capacitive tactile sensing. In Proceedings of the 2016 IEEE SENSORS, Orlando, FL, USA, 30 October–2 November 2016. [Google Scholar]
- Percoco, G.; Arleo, L.; Stano, G.; Bottiglione, F. Analytical model to predict the extrusion force as a function of the layer height, in extrusion based 3D printing. Addit. Manuf. 2021, 38, 101791. [Google Scholar] [CrossRef]
- Liu, H.; Zhang, H.; Han, W.; Lin, H.; Li, R.; Zhu, J.; Huang, W. 3D Printed Flexible Strain Sensors: From Printing to Devices and Signals. Adv. Mater. 2021, 33, 2004782. [Google Scholar] [CrossRef]
- Souri, H.; Banerjee, H.; Jusufi, A.; Radacsi, N.; Stokes, A.A.; Park, I.; Sitti, M.; Amjadi, M. Wearable and Stretchable Strain Sensors: Materials, Sensing Mechanisms, and Applications. Adv. Intell. Syst. 2020, 2, 2000039. [Google Scholar] [CrossRef]
- Yang, Q.; Yu, A.J.; Simonton, J.; Yang, G.; Dohrmann, Y.; Kang, Z.; Li, Y.; Mo, J.; Zhang, F.-Y. An inkjet-printed capacitive sensor for water level or quality monitoring: Investigated theoretically and experimentally. J. Mater. Chem. A 2017, 5, 17841–17847. [Google Scholar] [CrossRef]
- Yang, S.X.; Yang, W.Q. A portable stray-immune capacitance meter. Rev. Sci. Instrum. 2002, 73, 1958–1961. [Google Scholar] [CrossRef]
- Sebar, L.E.; Iannucci, L.; Angelini, E.; Grassini, S.; Parvis, M. Electrochemical Impedance Spectroscopy System Based on a Teensy Board. IEEE Trans. Instrum. Meas. 2021, 70, 1–9. [Google Scholar] [CrossRef]
- Ramanathan, P.; Ramasamy, S.; Jain, P.; Nagrecha, H.; Paul, S.; Arulmozhivarman, P.; Tatavarti, R. Low Value Capacitance Measurements for Capacitive Sensors—A Review. Sens. Transducers 2013, 148, 1–10. [Google Scholar]
- Hamidi, A.; Almubarak, Y.; Rupawat, Y.M.; Warren, J.; Tadesse, Y. Poly-Saora robotic jellyfish: Swimming underwater by twisted and coiled polymer actuators. Smart Mater. Struct. 2020, 29, 045039. [Google Scholar] [CrossRef]
- Almubarak, Y.; Punnoose, M.; Maly, N.X.; Hamidi, A.; Tadesse, Y. KryptoJelly: A jellyfish robot with confined, adjustable pre-stress, and easily replaceable shape memory alloy NiTi actuators. Smart Mater. Struct. 2020, 29, 075011. [Google Scholar] [CrossRef]


| Parameter | Value |
|---|---|
| Whole sensor length (mm) | 171 |
| Length of sensible part (mm) | 148.7 |
| Flexible substrate height (mm) | 0.4 |
| Electrodes height (mm) | 0.8 |
| Flexible top cover height (mm) | 0.4 |
| Electrodes spacing: s (mm) | 0.8 |
| Electrodes width: w (mm) | 0.5 |
| Number of electrodes pairs: N | 114 |
| Length of each electrode: l (mm) | 25 |
| Parameter | TPU95A | AlfaOhm |
|---|---|---|
| Printing temperature (°C) | 223 | 225 |
| Line width (mm) | 0.8 | 0.4 |
| Printing speed (mm/s) | 30 | 25 |
| Flow (%) | 106 | 110 |
| Fan Speed (%) | 50 | 25 |
| Support for Sensor Bending | |
|---|---|
| No bending | 124.8 |
| 45° | 124.8 |
| 60° | 124.7 |
| 120° | 124.7 |
| b1 | 124.8 |
| b2 | 124.7 |
| Oil Level index | Oil Level | Sensitivity | FSO (pF) | Hysteresis | Repeatability | ||||||
|---|---|---|---|---|---|---|---|---|---|---|---|
| (pF) | (% of FSO) | (pF) | (% of FSO) | ||||||||
| 1 | 0 | 0.24 | 10.44 | 0.43 | 4.1 | 2.34 | 0.23 | 0.23 | 22.4 | 2.2 | 2.2 |
| 2 | 76.2 | “ | 9.67 | 0.84 | 8.7 | 2.40 | 0.24 | 0.18 | 24.8 | 2.5 | 1.9 |
| 3 | 109 | “ | 11.79 | 0.41 | 3.5 | 2.57 | 0.26 | 0.15 | 21.8 | 2.2 | 1.3 |
| 4 | 147 | “ | 9.21 | 0.57 | 6.2 | 2.48 | 0.25 | 0.25 | 26.9 | 2.7 | 2.7 |
| Oil Level (mm) | Hysteresis | |||
|---|---|---|---|---|
| Temperature (°C) | Level (mm) | Temperature (°C) | Level (mm) | |
| 0 | 1.8 | 5.5 | 1.0 | 2.9 |
| 76.2 | 3.5 | 10.8 | 1.0 | 3.1 |
| 109 | 1.7 | 5.3 | 1.1 | 3.3 |
| 147 | 2.4 | 7.3 | 1.0 | 3.2 |
Publisher’s Note: MDPI stays neutral with regard to jurisdictional claims in published maps and institutional affiliations. |
© 2021 by the authors. Licensee MDPI, Basel, Switzerland. This article is an open access article distributed under the terms and conditions of the Creative Commons Attribution (CC BY) license (https://creativecommons.org/licenses/by/4.0/).
Share and Cite
Ragolia, M.A.; Lanzolla, A.M.L.; Percoco, G.; Stano, G.; Di Nisio, A. Thermal Characterization of New 3D-Printed Bendable, Coplanar Capacitive Sensors. Sensors 2021, 21, 6324. https://doi.org/10.3390/s21196324
Ragolia MA, Lanzolla AML, Percoco G, Stano G, Di Nisio A. Thermal Characterization of New 3D-Printed Bendable, Coplanar Capacitive Sensors. Sensors. 2021; 21(19):6324. https://doi.org/10.3390/s21196324
Chicago/Turabian StyleRagolia, Mattia Alessandro, Anna M. L. Lanzolla, Gianluca Percoco, Gianni Stano, and Attilio Di Nisio. 2021. "Thermal Characterization of New 3D-Printed Bendable, Coplanar Capacitive Sensors" Sensors 21, no. 19: 6324. https://doi.org/10.3390/s21196324
APA StyleRagolia, M. A., Lanzolla, A. M. L., Percoco, G., Stano, G., & Di Nisio, A. (2021). Thermal Characterization of New 3D-Printed Bendable, Coplanar Capacitive Sensors. Sensors, 21(19), 6324. https://doi.org/10.3390/s21196324