1. Introduction
Clustering algorithms classify data points into
C clusters (or categories) on the basis of their similarity. Its applications range from image processing [
1,
2] to biology [
3], sociology [
4], and business [
5]. Clustering algorithms mainly include partition-based clustering [
6,
7,
8,
9], density-based clustering [
10,
11], and graph-based clustering [
12,
13,
14], etc. In partition-based clustering algorithms, the mean (or median) of a cluster is viewed as the clustering center, and a data point is assigned to the nearest center. In density-based clustering algorithms, clusters are groups of data points characterized by the same local density, and a clustering center is the data point of which local density is higher. Graph-based clustering algorithms define a graph with vertices equal to the elements of a dataset, and edges are weighted by the similarity between pairs of data points in the dataset. Then the algorithms find an optimal partition of the graph such that the edges between different subgraph have a very low weight and the edges within a subgraph have high weight. There are several popular constructions to transform a dataset into a similarity graph, such as k-nearest neighbor (KNN) graph and mutual k-nearest neighbor (MKNN) graph [
12]. The commonly used graph cut criterions include min cut, ratio cut, normalized cut (Ncut) and Cheeger cut.
Clustering nonlinearly separable datasets is a challenging problem in clustering analysis. Many methods have been proposed to solve this problem. Kernel method maps a nonlinearly separable dataset into a higher-dimensional Hilbert space, and in the Hilbert space the dataset may be linearly separable. DBK clustering [
15] proposes a density equalization principle, and then based on this principle, they propose an adaptive kernel clustering algorithm. Multiple kernels clustering algorithms [
16,
17,
18,
19] use multiple kernel functions to enhance the performance of kernel clustering algorithms. Kernel K-means (or Kernel fuzzy K-means) algorithms with appropriate kernel functions are able to cluster nonlinearly separable datasets, but it is difficult to select appropriate kernel functions.
Spectral clustering, which is a famous graph-based clustering algorithm, firstly constructs a graph Laplacian matrix, and then computes eigenvalues and eigenvectors of the graph Laplacian matrix. It regards eigenvectors corresponding to the
k smallest eigenvalues as low-dimensional embeddings of the dataset, and finally uses some basic clustering algorithms (for example, K-means) to obtain a clustering result. Hyperplanes clustering method [
20] sets up a hyperplane framework to solve the Ncut problem. Sparse subspace clustering [
21] builds a similarity graph by sparse representation techniques, and then uses spectral clustering to compute clustering results. Subspace Clustering by Block Diagonal Representation (BDR) [
22] proposes a theory of block diagonal property, and is then based on the theory to build the similarity graph. Spectral clustering provides good clustering results for nonlinearly separable datasets, but it is complex to compute eigenvalues and eigenvectors.
In this article, a simple but effective clustering algorithm (called iterative min cut clustering) for nonlinearly separable datasets is proposed. The proposed method is based on graph cuts theory, and it does not require computing the Laplacian matrix, eigenvalues, and eigenvectors. The proposed iterative min cut clustering uses only one formula to map a nonlinearly separable dataset to a linearly separable one-dimensional representation. We demonstrate the performance of the proposed method on synthetic and real datasets.
The remainder of this article is organized as follows.
Section 2 introduces the proposed iterative min cut (IMC) algorithm.
Section 3 presents the experimental results on nonlinearly separable datasets. Finally, concluding remarks are given in
Section 4.
1.1. Related Works
Graph cuts clustering partitions a dataset into C clusters by constructing a graph and finding a partition of the graph such that vertexes (a data point is seen as a vertex of the graph) in same subgraph are similar to each vertex and vertexes in different subgraph are dissimilar from each vertex. The construction methods of transforming a data into a graph mainly include
- (1)
-neighborhood graph. It connects all vertexes (data points) whose pairwise distances are smaller than , and then obtains an undirected graph.
- (2)
K-nearest neighbor graphs. It connects a vertex and a vertex if is among the K-nearest neighbors of or if is among the K-nearest neighbors of (or if both is among the K-nearest neighbors of and is among the K-nearest neighbors of ).
- (3)
The fully connected graph. It connects all points, and then obtains a fully connected graph.
Graph cuts problem is an NP hard problem, and spectral clustering is the most popular method to solve this problem. The spectral clustering algorithm is detailed in Algorithm 1.
| Algorithm 1: Spectral clustering. |
| Input: |
| Do: |
| (1) Compute where is the similarity between and , |
| and is usually computed by |
| (2) Compute the Laplacian matrix where is the degree matrix, |
| and is computed by |
| (3) Compute the first k eigenvectors of , and these eigenvectors are seen as low |
| dimensiona embedding of the original dataset |
| (4) Using K-means to cluster the low dimensional embedding |
| Output: Clustering results of K-means |
Spectral clustering provides good clustering results for nonlinearly separable datasets, but it requires to compute eigenvectors and eigenvalues of the Laplace matrix . The cost of computing eigenvectors and eigenvalues is high without built-in tool.
2. Iterative Min Cut Clustering
In this section, we propose an iterative min cut clustering (IMC). The proposed IMC clustering algorithm partitions a dataset
into
C clusters by minimizing the following objective function
where
is the similarity (i.e., the edge weight) between
and
. For computational convenience, we normalize the data point
as follows. For any
,
The similarity
is computed by
We can use
-neighborhood graph or K-nearest neighbor graphs (shown in
Section 1.1) to select neighbors.
To solve (
1), we define a feature
f (
f is a scalar) for each data point. If two data points belong to the same cluster, then their
f values are the same. If two data points belong to the different cluster, then their
f values are different. Let
represent the feature of
.
if
and
belong to the same cluster, and
otherwise.
can be viewed as a one-dimensional embedding of the dataset
X. (
1) is equivalent to the following function
According to [
12], we get the relationship between (
4) and the Laplacian matrix
, i.e.,
The problem
is equivalent to
. By the Rayleigh–Ritz theorem [
23], eigenvectors and eigenvalues of the matrix
are approximately equal to those of
, so spectral clustering computes eigenvectors of
instead of computing eigenvectors of
. In this article, we use a novel solution to solve problem (
4).
According to (
4), we have for every
that
Equating all the previous partial derivatives to zero (i.e.,
), we obtain the following values of
, for every
According to variational method [
24], (
7) contains two
f, and we can view a
f as
, and view the other
f as
. The proposed ideal is from variational method. The variational method is well supported by the theory, so the proposed method is indirectly supported by the theory of variational method. The proposed method uses only one formula to solve the problem (
4) (Spectral clustering requires computing eigenvalues and eigenvectors to solve this problem, and computing eigenvalues and eigenvectors is complex). The initial
is initialized randomly. The proposed IMC algorithm is detailed in Algorithm 2.
| Algorithm 2: IMC algorithm. |
| Input: |
| compute by (3),
Randomly initialize |
| Repeat |
| Compute via |
| Until is less than a prescribed tolerance
or n is equal to the maximum |
| number of iterations |
| Output: |
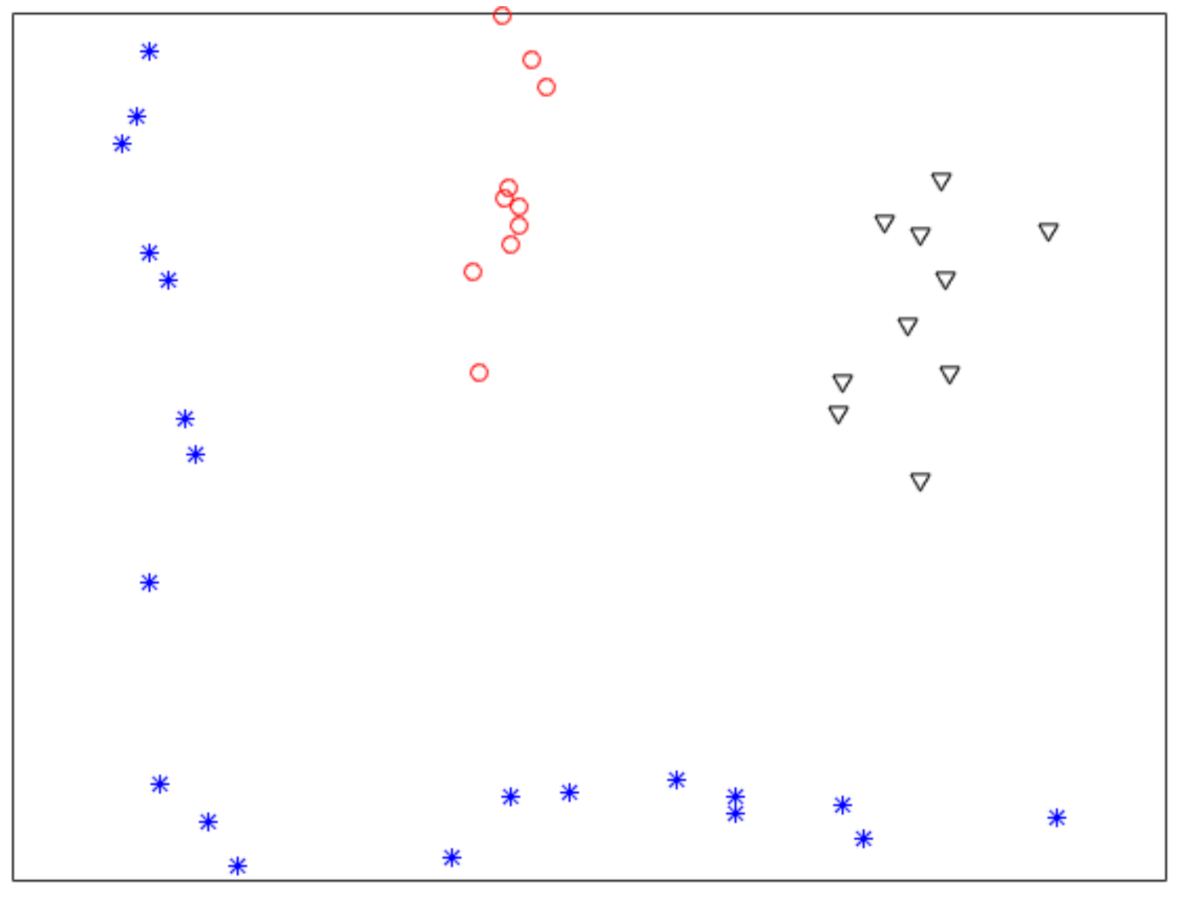
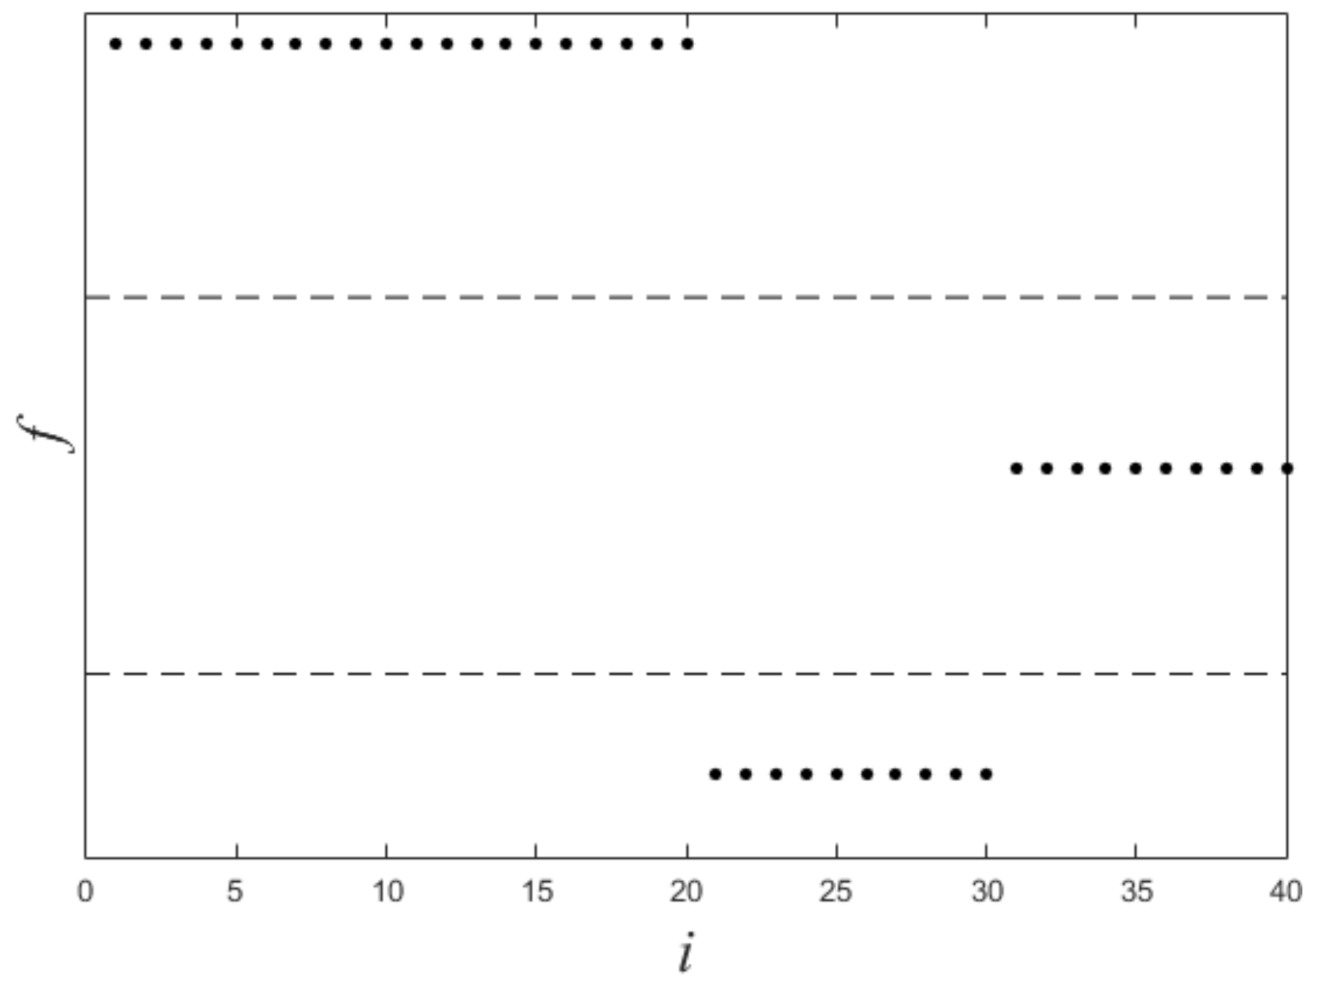
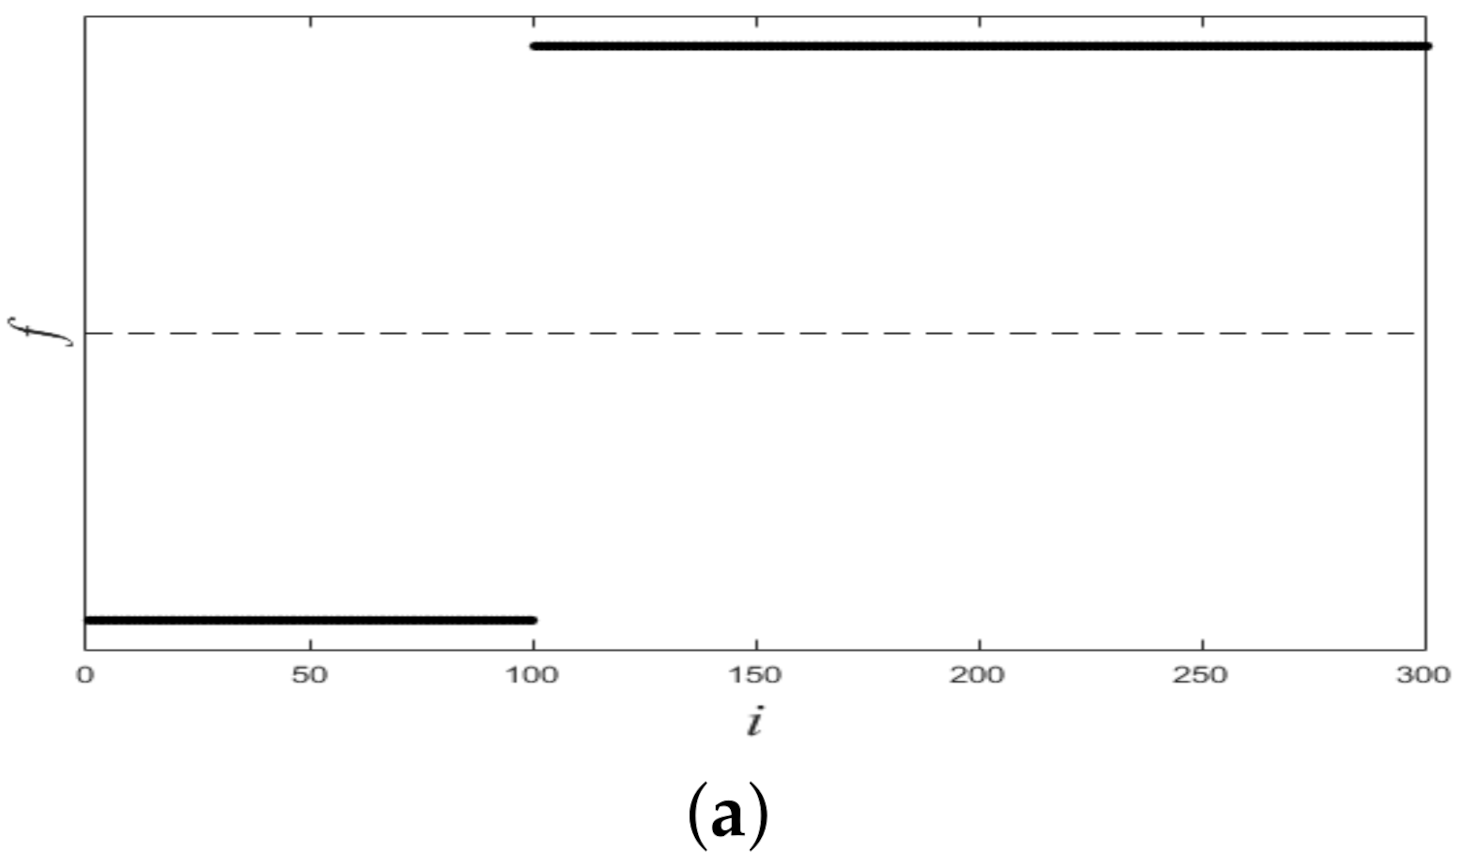
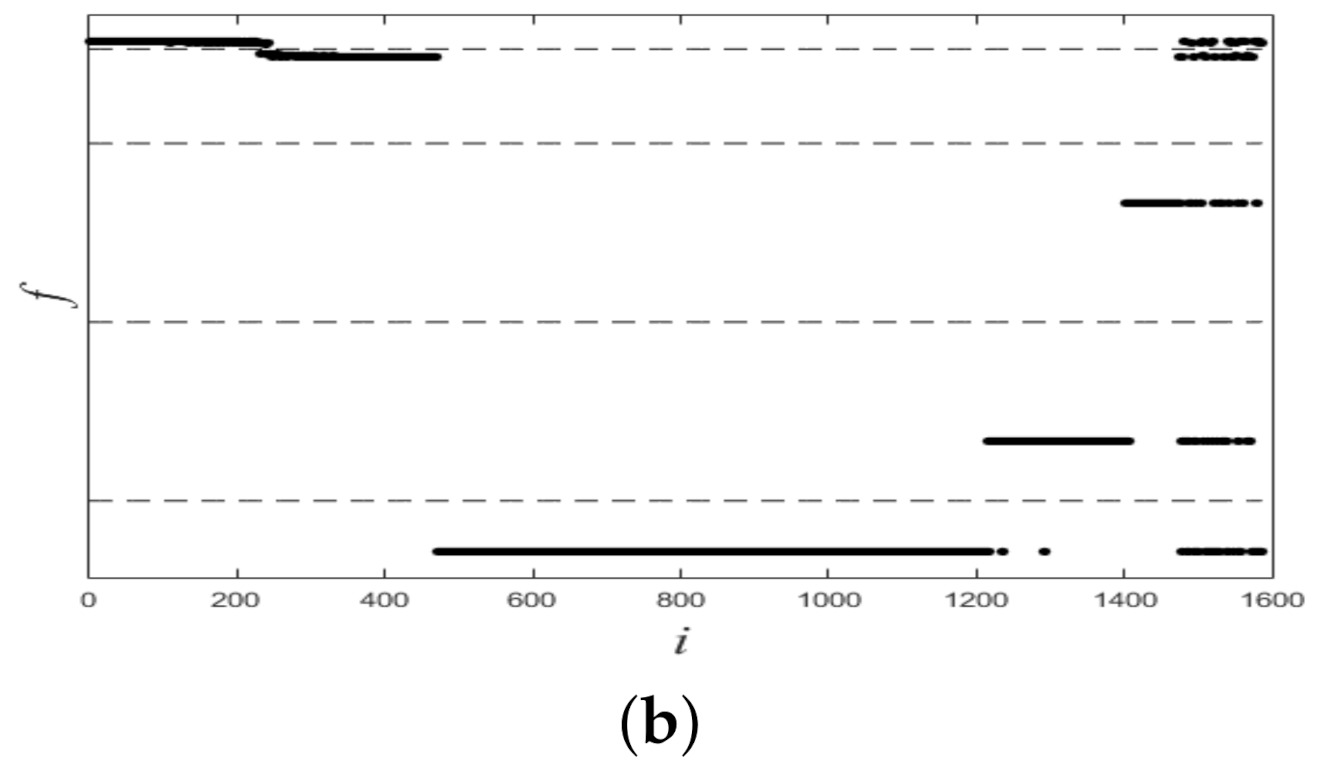
Figure 1 shows a nonlinearly separable dataset, and
Figure 2 shows its
computed by IMC. From
Figure 2 we can see that
is linearly separable, and we can partition it by using thresholding method.
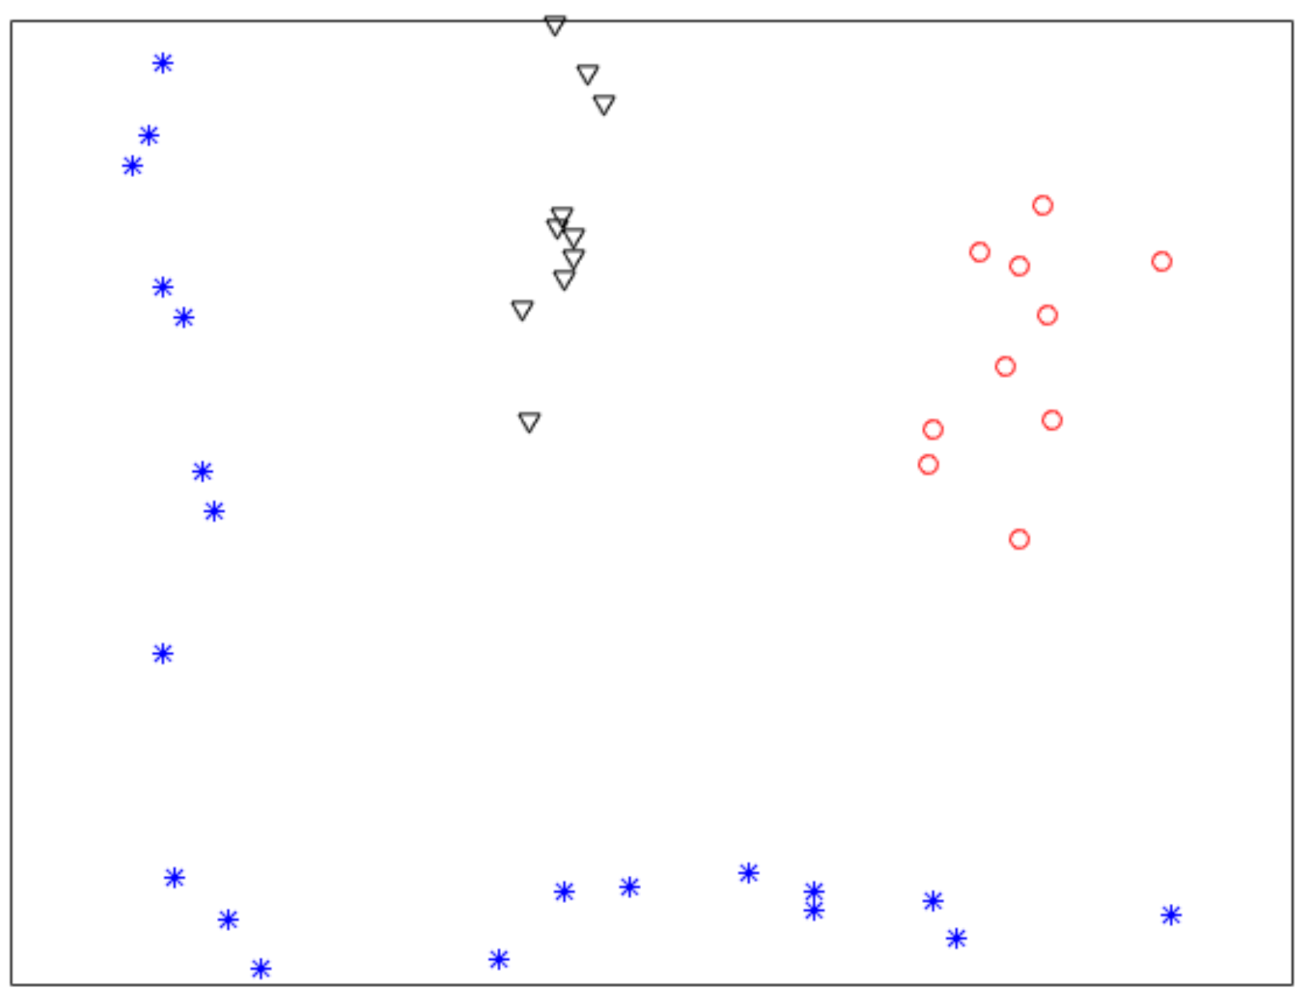
Figure 3 shows a final clustering result of IMC, and from it we can see that the clustering result is consistent with the dataset shown in
Figure 1.
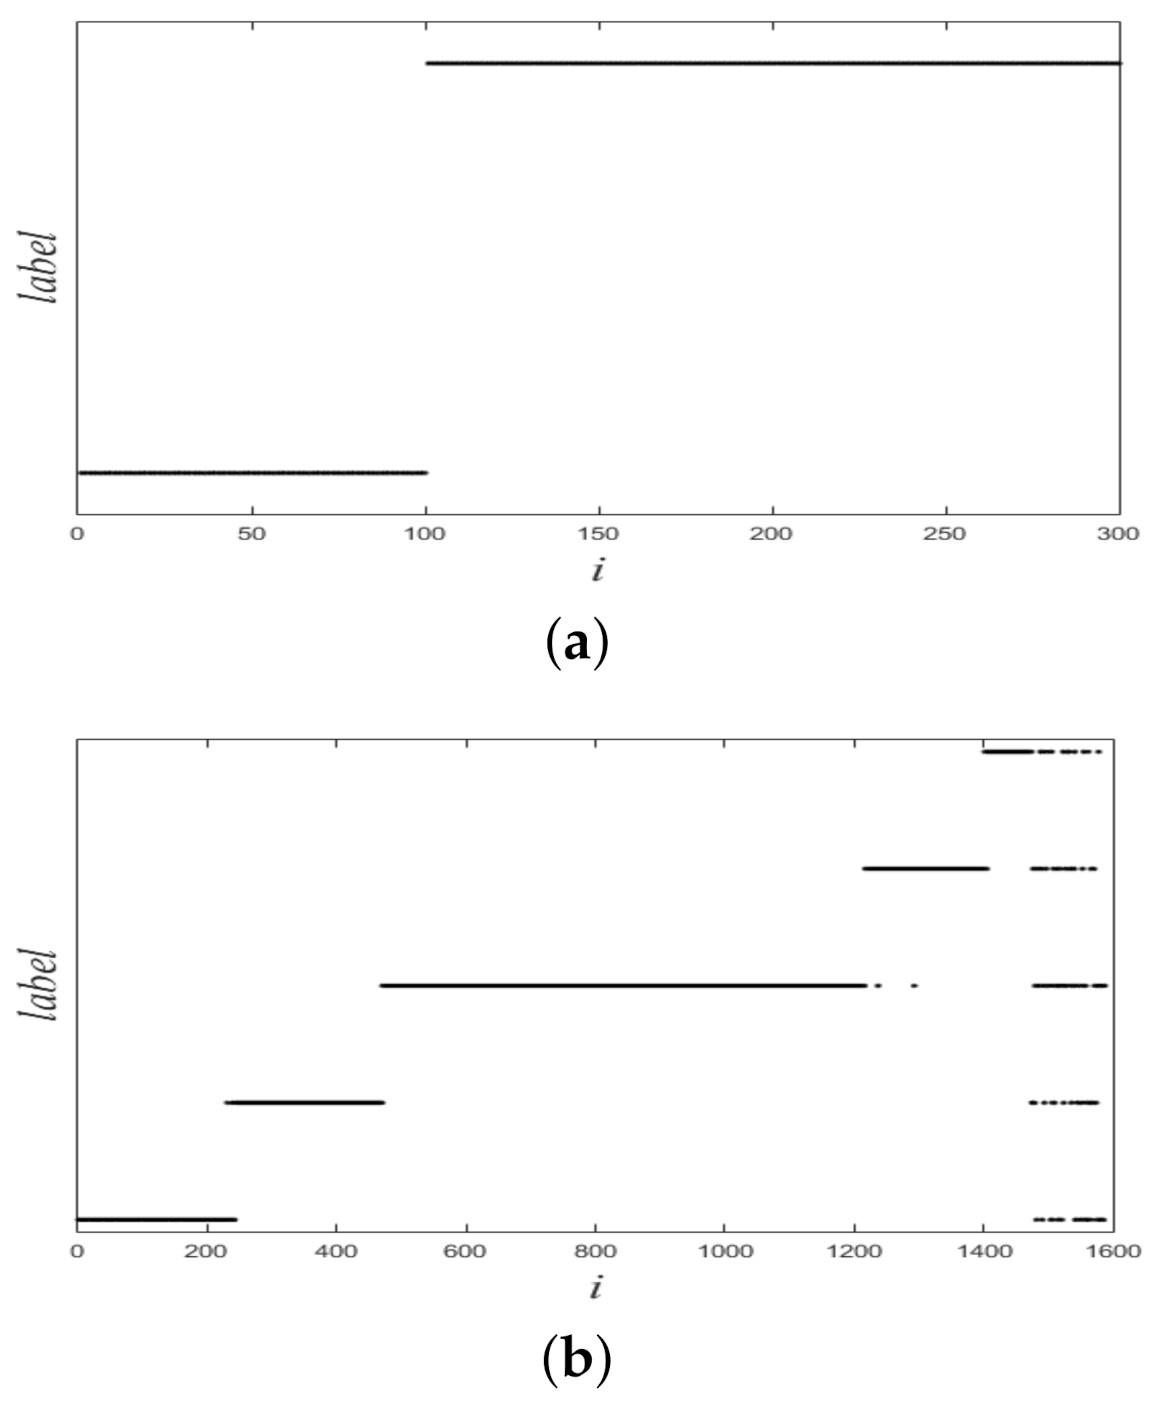
Next, we consider obtaining the final clustering results by one-dimensional vector
. We partition the one-dimensional vector
into
C categories by using some basic clustering algorithms (e.g., K-means) or thresholding method:
where
is the
c-th threshold.
4. Concluding Remarks
In this article, we propose a novel graph-based clustering algorithm called IMC for solving the clustering problem on nonlinearly separable datasets. We first compute similarities between pairs of data points. Then the proposed IMC maps a nonlinearly separable dataset to a one-dimensional vector by using only one formula. Finally, we use thresholding method or K-means to obtain final clustering results. We use experiments to evaluate the performance of the proposed method on synthetic nonlinearly separable datasets and real datasets, and we also use experiments to demonstrate the convergence of the proposed method. By experiments, on synthetic datasets and little real datasets, the proposed method can provide good clustering results.
We summarize the advantages of the proposed method from the following two aspects.
Theoretical view: (1) the proposed ideal is from variational method. The variational method is well supported by the mathematics theory, so the proposed method is indirectly supported by the theory of variational method; (2) it uses only one formula to solve the problem (spectral clustering requires to compute eigenvalues and eigenvectors to solve this problem, and computing eigenvalues and eigenvectors is complex).
Practical view: the proposed method can obtain good clustering results for synthetic nonlinearly separable datasets and some real datasets.
In the future, we will consider extending IMC by using other graph cut criteria. Moreover, we think one-dimensional data may not represent the structure of large datasets completely, but one-dimensional data is simple (It is both a strength and a weakness). We will consider how to solve this problem.


