Table 2 shows the accuracy and average F-score of our method and the baseline method. In the table, stdvgg16 represents the standard CNN model with the VGG structure and branchvgg16 represents the CNN model with the B-CNN branch added to the VGG structure. In this section, we first present the validation results on the effectiveness of the B-CNN model and then discuss the results. Afterward, we discuss the effects of different class hierarchies on the recognition performance of the B-CNN model and the search costs of class hierarchies. Then, based on the above two points, we evaluate the effectiveness of our method and analyze the class hierarchies created using our method.
5.1. Discussion on the Effectiveness of B-CNNs
5.1.1. Effectiveness of B-CNNs
Table 2 shows the experimental results of the std model and the B-CNN model on each dataset. For B-CNN, we compared three methods for creating the class hierarchy: the hand-crafted method, Jin et al.’s [
37] method and our method. In the hand-crafted method, a B-CNN is trained using class hierarchies that are manually designed by humans. The hand-crafted class hierarchy is described in detail in
Section 5.3.
Table 2 shows that the B-CNN model with the manually designed class hierarchy outperformed the std CNN model in terms of F-score on all datasets. In UniMib, the B-CNN model is inferior to the std model in terms of accuracy, but the difference is as small as 0.002. Therefore, the B-CNN model is not only effective in image recognition but also sensor-based activity recognition. Furthermore,
Figure 4 shows the change in accuracy when the number of subjects in
was increased by 10, from 10 to 50, in the HASC dataset. According to the results of the B-CNN with the manually designed class hierarchy, the B-CNN model outperformed the std model in terms of accuracy, even when the number of subjects was increased. However, as the number of subjects used for training increased, the difference in accuracy between the B-CNN and std models decreased. Thus, the B-CNN model is a particularly effective method when the number of training data is small.
5.1.2. A Study on the Effect of Backbone Architecture on the Recognition Performance of B-CNNs
B-CNNs can use any CNN architecture as the backbone. In the work by Zhu et al. [
7], a B-CNN with a VGG-like architecture as the backbone was used. However, their work did not discuss the effects of backbone CNNs on the recognition performance of B-CNNs. Therefore, in our work, we also examined the effects of the architecture and size of the backbone of B-CNNs on recognition performance.
In the validation, we compared B-CNNs with three different backbone architectures: VGG [
47], ResNet [
51] and LSTM-CNN [
15]. In the VGG architecture, we also compared four different models with different depths and different widths (the number of filters). The architecture of the LSTM-CNN was composed of simple CNNs following the two LSTMs, while the VGG16 was used as the simple CNN. The class hierarchy used in the B-CNN was designed manually. The same class hierarchy was used for all models. The branching position of the B-CNN was tuned for each architecture, which were VGG, ResNet and LSTM-CNN. Each model was validated using the HASC dataset using the same method as described in
Section 4.4.
The validation results are shown in
Table 3. In the table, VGG16-S represents the VGG16 model whose convolution filters were all halved and VGG16-W represents the VGG16 model whose convolution filters were all doubled. As the results show, in the VGG architecture, the accuracies of all models with a branching structure were higher than those of the models without a branching structure. The VGG16-S with a branching structure achieved the highest recognition performance, but the gain of recognition performance due to branching structure was the largest for the plain VGG16. The VGG19, which was deeper than the VGG16, and the VGG16-W, which was wider than the VGG16, had smaller improvements in recognition performance than the plain VGG16 due to the branching structure.
The recognition performance of ResNet and VGG models without branching structure was the same. However, in the ResNet architecture, unlike VGG, there was no performance improvement due to the branching structure. The most significant difference between ResNet and VGG was the presence of a skip connection. Therefore, it is considered that B-CNNs are less effective in architectures with the skip connection.
The recognition performance of the LSTM-CNN model without the branching structure was higher than the VGG and ResNet models without the branching structure. The recognition performance of the LSTM-CNN model was improved by using the branching structure. In addition, the recognition performance of LSTM-CNNs with branching structure and VGG16 with branching structure were equivalent. This result implies that the B-CNN has a particularly large effect on the CNN part of the LSTM-CNN and a small effect on the LSTM part.
5.1.3. A Study on the Effect of Different Class Hierarchies on the Recognition Performance of B-CNNs
We examine the relationship within the class hierarchy provided for B-CNNs and the recognition performance of the model. All possible class hierarchy creation patterns were attempted using the HASC dataset. Since the number of class hierarchies was extremely large (3230 patterns), we train and evaluated the model once for each class hierarchy and treated the evaluation result as the score of the class hierarchy.
Figure 5 shows a histogram of the accuracy of all trials. The blue vertical bar represents the frequency of each class and the red line represents the cumulative relative frequency. This result shows that the accuracies of all trials were distributed around 0.808 and the trials with an accuracy greater than or equal to 0.808 accounted for 50% of the total trials. Since the accuracy of the std model was 0.805, it is likely to achieve higher accuracy than the std model, even if the class hierarchy is created randomly. The minimum and maximum accuracies of the B-CNN model were 0.771 and 0.838, respectively. The recognition performance of B-CNNs varies significantly depending on the design of the class hierarchy.
Table 4 shows the class hierarchies with the maximum and minimum accuracy in all trials, respectively. In the class hierarchy with the highest accuracy, stay and skip were integrated in Level 2, whereas stay, skip, walk and skip were integrated in Level 1.
Figure 6 shows the percentage of integration of two different classes in Level 2 of the top 1% accuracy class hierarchy. According to this result, in the Level 2 hierarchy of the top 1%, the three classes walk, stup and stdown had the largest percentage of integration with each other. Furthermore, the percentage of integration between skip and stay, which was seen in the class hierarchy with the highest accuracy, was large. In Level 1, the percentage of two classes merged increased, compared to Level 2, but the trend was generally the same as in Level 2. When humans manually design class hierarchies, they consider stay and skip to be the classes with the least similarity to each other and assign them to different clusters, as well as assigning stay and a group of walk and stup to different clusters as stationary and non-stationary. This shows that the class hierarchies designed by humans are not necessarily the best class hierarchies for B-CNNs.
On the other hand, in the class hierarchy with the lowest accuracy, stay and jog, walk and stdown, and skip and stup were integrated in Level 2, while stay, jog, walk and stdown were integrated as one cluster in Level 1. In
Figure 7, the percentage of integration of two different classes in Level 2 of the lower 1% accuracy class hierarchy is shown. According to the results, the percentage of integration of stay and jog, stay and stup, skip and stup, and skip and stdown was large in the Level 2 hierarchy of the bottom 1% and, especially, stay and stup is a pattern that also appears in the lowest class hierarchy in
Table 4. This trend is similar to the Level 1 hierarchy. Since walk, stup and stdown are classes that are frequently misclassified with respect to each other, the integration of stay and stup in the lowest class hierarchy may have negatively affected the classification of walk, stup and stdown in the target classes, degrading the classification accuracy. In contrast, in the pattern where stay and skip are integrated, which is often seen in the top 1% accuracy class hierarchy, stay and skip are completely different activity classes. Therefore, it is considered that, even if a B-CNN model is optimized with stay and skip as the same class in the branched classifier, sufficient feature representation for activity classification can be obtained by optimizing the target classes.
5.1.4. Search Costs of Class Hierarchy
In
Section 5.1.1, we verify that B-CNN improves activity recognition performance. However, in
Section 5.1.3, it is shown that inappropriate class hierarchy degrades the recognition performance of the B-CNN model. Therefore, the design of the class hierarchy is an important factor of B-CNNs. One method for designing the class hierarchy is to manually design a class hierarchy based on humans’ prior knowledge. In this method, it is difficult to manually design the class hierarchy when the number of original classes is large. Here,
Figure 8 shows the number of patterns created for a class hierarchy of height 3, as shown in
Figure 2. According to the graph, the number of patterns of the class hierarchy increases exponentially as the number of the original classes increases. For example, when the original number of classes is 4, the number of patterns for creating a class hierarchy is 18. But, when the number of classes is 9, the number of patterns of the class hierarchy is as large as 7,226,538 and all searches are unrealistic.
Furthermore, the class hierarchy needs to be created considering a relationship among classes. For example, in the case of UniMib, the 17 activity classes can be semantically divided into two classes, daily activities and fall scenes. However, the activities of “lying down from a standing (layFS)” included in the daily activities and “falling backward (fallB)” included in the fall scenes may be similar in terms of body movements, regardless of whether they are falls or not. Thus, when manually designing a class hierarchy, it is necessary to consider the similarity of each activity in the analysis, which makes the manual design of a class hierarchy an extremely difficult task when there are many classes.
From the above discussion, a method for automatically designing a class hierarchy from data is useful, especially when the number of classes is large.
In this study, we use an automatic design of class hierarchies for training B-CNNs, but it can be also useful in interpreting the target task itself through the automatically designed class hierarchy.
5.2. Discussion of the Proposed Method for Automatic Construction of Class Hierarchies
In this subsection, based on the above discussion, we evaluate the effectiveness of our method.
Table 2 shows that our method outperforms the std model in both accuracy and F-score for all datasets. In addition, our method outperforms the B-CNN model with class hierarchies constructed by Jin et al.’s method [
37]. Comparing our method with the B-CNN model using manually designed class hierarchies, our method achieved a classification accuracy comparable to the model using manually designed class hierarchies for both accuracy and F-score metrics on HASC and WISDM. In UniMib, our method had the highest accuracy, but its F-score was 0.006 lower than that of the B-CNN model with a manually designed class hierarchy. Furthermore,
Figure 4 shows that our method outperformed the std model in terms of accuracy, even when the number of subjects used for training was increased; however, the difference in accuracy with the std model became smaller as the number of subjects increased. Our method had slightly lower accuracy than the B-CNN using the manually designed class hierarchy, regardless of the number of subjects used for training, but the difference became smaller as the number of subjects increased. Therefore, the effect of different class hierarchies on the B-CNN model was more pronounced when the number of training data was small.
These results show that class hierarchies manually designed by humans based on prior knowledge work well for B-CNNs. However, the performance of our method is comparable to that of the B-CNN model using manually designed class hierarchies. Therefore, our method is particularly effective when it is difficult to design class hierarchies that work well for B-CNNs with little prior knowledge.
5.3. Discussion on Class Hierarchy Designed Using the Proposed Method
We show the class hierarchies designed using our method in detail and evaluate them qualitatively. In
Table 5 and
Table 6, class hierarchies manually designed for each dataset and class hierarchies automatically designed using our method for a particular trial are shown.
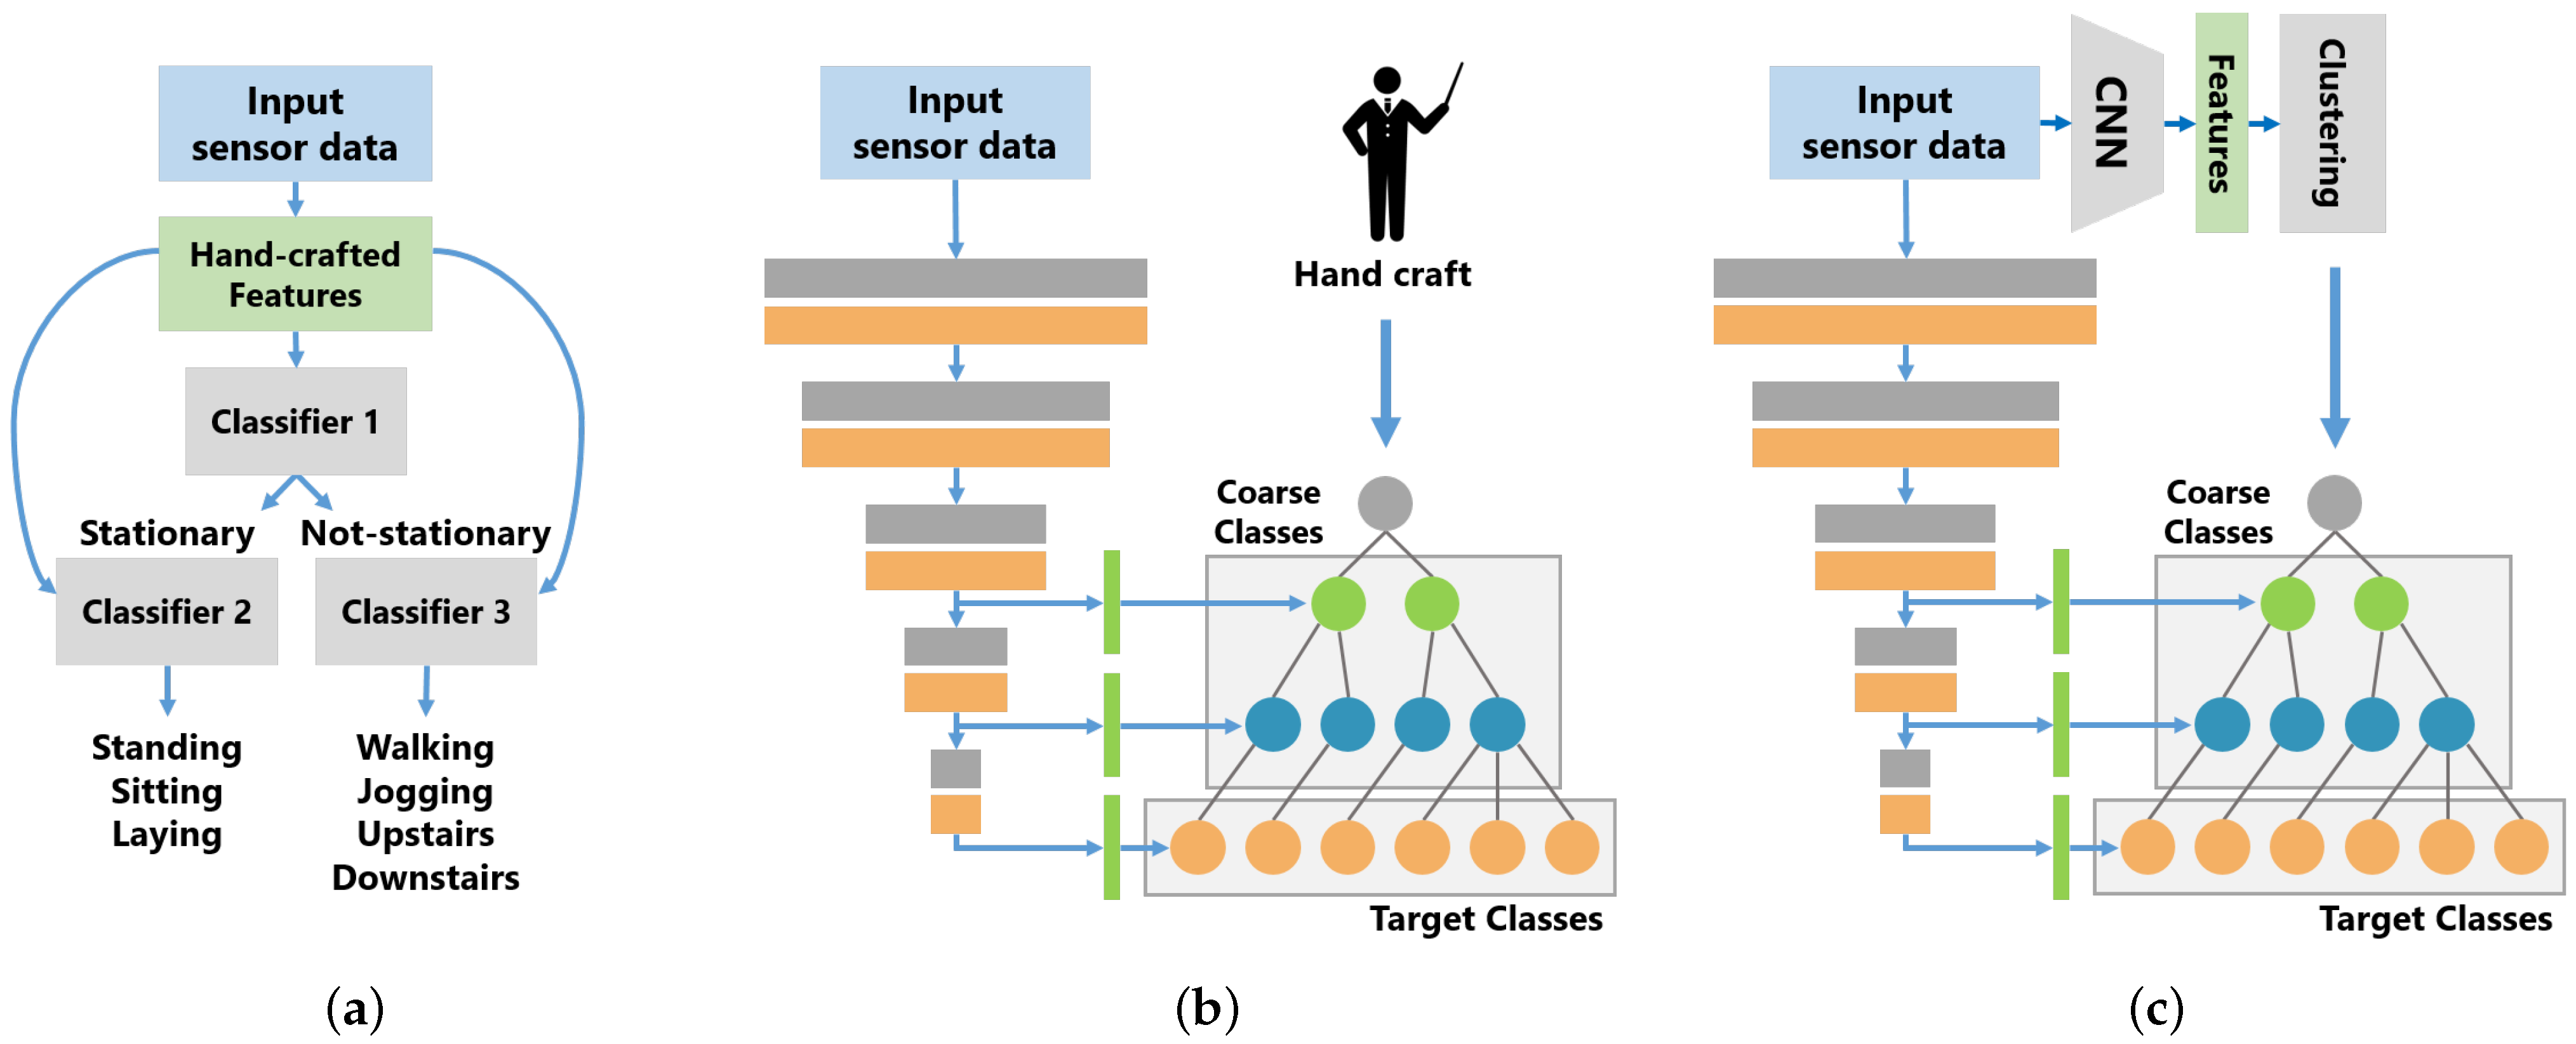
Table 6 shows the class hierarchy for the UniMib dataset, but, because the UniMib dataset has a large number of classes, the table is wrapped in the middle. In the table, Level 1 and Level 2 correspond to the coarse classes in
Figure 1c and Level 3 corresponds to the target classes.
According to the results of HASC, only walk and stup were integrated in Level 2, which is a reasonable result in terms of activity similarity. However, in Level 1, stay, walk, stup and stdown were integrated as one class. Even in other trials, there were many cases in which stay, walk, stup and stdown were integrated into one class. However, considering the similarity in the activities, the stay and walk groups (walk, stup and stdown) should be separated. Therefore, based on the discussion in
Section 5.1.3, it can be considered that this is the reason for the difference in recognition performance between our method and the B-CNN model with the manually designed class hierarchy.
In addition, it is thought that one of the reasons why the stay and walk groups (walk, stup and stdown) were merged into one class is the loss function used to train the std model. In our method, the distribution of each class in the feature space was designed by training the std model and the class hierarchy was created using the distribution of each class in the feature space. The designed feature space depends on the loss function that is optimized in training the std model and it is thought that the data of the walk group were distributed closer to the data of the stay than the data of the skip on the feature space designed by optimizing softmax cross-entropy loss used in this study. Therefore, it may be possible to create a more appropriate class hierarchy by examining the loss function used for training the std model and the training method for the std model.
In WISDM, the result for walk differs significantly from that of the manually designed class hierarchy. In the manually designed class hierarchy, walk was integrated into the same cluster as stup and stdown at Level 2 and was integrated with jog, stup and stdown at Level 1 in terms of the magnitude of the motion; however, in the class hierarchy created by our method, walk was not integrated with any class at Level 2 and was integrated with jog at Level 1. Both jog and walk move on a flat surface and their movements are similar, even though the magnitudes of the movements are different. It is considered that our method integrated walk and jog into one cluster and separated them from stup and stdown because of this similarity.
In UniMib, standFS, standFL, layFS and sit are stationary activities such as standing up and sitting down, whereas fallF, fallPS, fallR, fallL, fallB, fallBSC, hitO and syncope are grouped into one activity, classed as fall motion. It is difficult to distinguish among walk, jog, stup, jump and stdown, but it is considered that they are differentiated by the magnitude of body movement. stup and stdown are similar activities, but stdown is different from stup in that it moves toward gravity. Therefore, in stdown, the body moves faster than in stup when going up and down a staircase and the acceleration observed by the sensor becomes larger. This is a common term with jump, which has a large acceleration when jumping up, and it is thought that our method separated walk, jog and stup from jump and stdown by the magnitude of acceleration.
From the above discussion, it can be seen that, although the class hierarchies created using our method were different from that designed by a human, many of the class hierarchies were designed by capturing the similarity of activity from a perspective different from that of humans.
Table 2 also shows that the B-CNN model trained with class hierarchies created using our method achieved better recognition performance than the std model. However, based on the discussion in
Section 5.1.3, there may be more appropriate class hierarchies that can improve the recognition performance of B-CNN models and there is still room for improvement in our method.


