
Optimal Staffing for Vessel Traffic Service Operators: A Case Study of Yeosu VTS

Abstract
:1. Introduction
2. Related Works
3. Proposed Optimal VTS Operators Staffing Method
3.1. VTS Responsibilities
3.2. Preprocessing of AIS Sensor Data
3.3. Time Needed for INS
3.4. Time Needed for NAS
3.5. Time Needed for TOS
3.6. Optimal Number of Workstations
4. Case Study
4.1. Study Area and Data Preparation
4.2. Required Number of VTS Operators
5. Discussion
6. Conclusions
Author Contributions
Funding
Institutional Review Board Statement
Informed Consent Statement
Data Availability Statement
Conflicts of Interest
References
- Xie, Y. The Staffing Levels at VTS Centre: A Case Study of the Shenzhen VTS Centre. Master’s Thesis, World Maritime University, Malmö, Sweden, 2013. [Google Scholar]
- Wen, R.; Yan, W. Vessel Crowd Movement Pattern Mining for Maritime Traffic Management. LOGI Sci. J. Transp. Logist. 2019, 10, 105–115. [Google Scholar] [CrossRef] [Green Version]
- Schuett, T. Reducing VTS Operator Stress. In Proceedings of the IALA 2014 Conference, A Coruña, Spain, 26–31 May 2014. [Google Scholar]
- Uğurlu, Ö; Erol, S.; Başar, E. The analysis of life safety and economic loss in marine accidents occurring in the Turkish Straits. Marit. Policy Manag. 2015, 43, 356–370. [Google Scholar] [CrossRef]
- KMST. Marine Accident Statistics in 2020; Korea Maritime Safety Tribunal: Sejong, Korea, 2021; pp. 1–189.
- Harding, S.J. The ‘ALVA CAPE’ and the Automatic Identification System: The Use of VHF in Collision Avoidance at Sea. J. Navig. 2002, 55, 431–442. [Google Scholar] [CrossRef]
- Grifoll, M.; Martínez de Osés, F.X.; Castells, S.; Martin, M. Annual General Assembly: International Association of Maritime Universities (IAMU); International Center for Numerical Methods in Engineering (CIMNE): Barcelona, Spain, 2018; pp. 54–60. [Google Scholar]
- Jin, J.; Song, G. Bureaucratic Accountability and Disaster Response: Why Did the Korea Coast Guard Fail in Its Rescue Mission During the Sewol Ferry Accident? Risk, Hazards Crisis Public Policy 2017, 8, 220–243. [Google Scholar] [CrossRef] [Green Version]
- Kee, D.; Jun, G.T.; Waterson, P.; Haslam, R. A systemic analysis of South Korea Sewol ferry accident—Striking a balance between learning and accountability. Appl. Ergon. 2017, 59, 504–516. [Google Scholar] [CrossRef] [Green Version]
- Kim, Y.-S.; Park, Y.-S.; Jo, S.-H. A Study on Occupational Stress of the VTS Operators. J. Korean Navig. Port Res. 2014, 38, 615–621. [Google Scholar] [CrossRef] [Green Version]
- IALA. Available online: https://www.iala-aism.org/product/staffing-levels-for-vts-personnel-1045/ (accessed on 1 October 2021).
- Kum, S.; Furusho, M. Investigation on the the Factors of VTS Operators’ Mental Workload: Case of Japanese Operators. In Proceedings of the Asia Navigation Conference, Shanghai, China, 12–15 November 2008; pp. 242–255. [Google Scholar]
- Xu, G.; Chen, C.-H.; Li, F.; Qiu, X. AIS data analytics for adaptive rotating shift in vessel traffic service. Ind. Manag. Data Syst. 2020, 120, 749–767. [Google Scholar] [CrossRef]
- Techera, U.; Hallowell, M.; Littlejohn, R. Worker Fatigue in Electrical-Transmission and Distribution-Line Construction. J. Constr. Eng. Manag. 2019, 145, 04018119. [Google Scholar] [CrossRef]
- Kotkowska, D.; Marcjan, K. Identification of Errors Committed by Vessel Traffic Service Operators. Zesz. Nauk. Akad. Morsk. Szczec. 2021, 65, 61–71. [Google Scholar]
- Kim, K.-I.; Lee, K.M. Context-Aware Information Provisioning for Vessel Traffic Service Using Rule-Based and Deep Learning Techniques. Int. J. Fuzzy Log. Intell. Syst. 2018, 18, 13–19. [Google Scholar] [CrossRef]
- Mazaheri, A.; Goerlandt, F.; Montewka, J.; Kujala, P. A Decision Support Tool for VTS Centers to Detect Grounding Candidates. Int. J. Mar. Navig. Saf. Sea Transp. 2012, 6, 337–343. [Google Scholar]
- Su, C.-M.; Chang, K.-Y.; Cheng, C.-Y. Fuzzy Decision on Optimal Collision Avoidance Measures for Ships in Vessel Traffic Service. J. Mar. Sci. Technol. 2012, 20, 5. [Google Scholar] [CrossRef]
- Bukhari, S.A.C.; Tusseyeva, I.; Lee, B.-G.; Kim, Y.-G. An intelligent real-time multi-vessel collision risk assessment system from VTS view point based on fuzzy inference system. Expert Syst. Appl. 2013, 40, 1220–1230. [Google Scholar] [CrossRef]
- Wiersma, E.; Mastenbroek, N. Measurement of vessel traffic service operator performance. AI Soc. 1998, 12, 78–86. [Google Scholar] [CrossRef]
- Chen, H.C.; Lu, H.A.; Lee, H.H. An Assessment of Job Performance of Vessel Traffic Service Operators Using an Analytic Hierarchy Process and a Grey Interval Measure. J. Mar. Sci. Technol. 2021, 21, 4. [Google Scholar]
- Todorov, T.; Petrov, P. A study of sector configurations capacity for air traffic service. MATEC Web Conf. EDP Sci. 2017, 133, 1003. [Google Scholar] [CrossRef] [Green Version]
- De Prins, J.; Ledesma, R.G.; Mulder, M.; van Paassen, R. Literature review of air traffic controller modeling for traffic simulations. In Proceedings of the 2008 IEEE/AIAA 27th Digital Avionics Systems Conference, St. Paul, MN, USA, 26–30 October 2008; Volume 2008. [Google Scholar]
- Olba, X.B.; Daamen, W.; Vellinga, T.; Hoogendoorn, S.P. Network Capacity Estimation of Vessel Traffic: An Approach for Port Planning. J. Waterw. Port Coastal Ocean Eng. 2017, 143, 04017019. [Google Scholar] [CrossRef]
- Fang, Z.; Yu, H.; Ke, R.; Shaw, S.-L.; Peng, G. Automatic Identification System-Based Approach for Assessing the Near-Miss Collision Risk Dynamics of Ships in Ports. IEEE Trans. Intell. Transp. Syst. 2019, 20, 534–543. [Google Scholar] [CrossRef]
- Zhang, W.; Goerlandt, F.; Montewka, J.; Kujala, P. A method for detecting possible near miss ship collisions from AIS data. Ocean Eng. 2015, 107, 60–69. [Google Scholar] [CrossRef]
- IALA. IALA Guideline 1089 Provision of VTS Services (INS, TOS & NAS), 1st ed.; International Association of Marine Aids to Navigation and Lighthouse Authorities: Saint German en Laye, France, 2012; pp. 1–23. [Google Scholar]
- Sang, L.-Z.; Yan, X.-P.; Wall, A.; Wang, J.; Mao, Z. CPA Calculation Method based on AIS Position Prediction. J. Navig. 2016, 69, 1409–1426. [Google Scholar] [CrossRef]
- Brödje, A.; Lützhöft, M.; Dahlman, J. The What’s, When’s, Whys and How’s of VTS Operator Use of Sensor Information. In Proceedings of the International Conference on Human Performance at Sea, Glasgow, UK, 16–18 June 2010; pp. 161–172. [Google Scholar]
- Praetorius, G. Safety within the Vessel Traffic Service (VTS) Domain. Understanding the Role of the VTS for Safety within Maritime Traffic Management. Ph.D. Thesis, Chalmers University of Technology, Gothenburg, Sweden, 2012. [Google Scholar]
- Praetorius, G.; van Westrenen, F.; Mitchell, D.L.; Hollnagel, E. Learning Lessons in Resilient Traffic Management: A Cross-Domain Study of Vessel Traffic Service and Air Traffic Control. In Proceedings of the HFES Europe Chapter Conference Toulouse, Toulouse, France, 22–26 October 2012; pp. 277–287. [Google Scholar]
- Gantz, S.D.; Philpott, D.R. FISMA and the Risk Management Framework: The New Practice of Federal Cyber Security; Syngress: Rockland, MA, USA, 2012; pp. 1–551. [Google Scholar]
- Chen, J.; Lu, F.; Li, M.; Huang, P.; Liu, X.; Mei, Q. Optimization on Arrangement of Precaution Areas Serving for Ships’ Routeing in the Taiwan Strait Based on Massive AIS Data. In Proceedings of the Computer Vision, Las Vegas, NV, USA, 27–30 June 2016; pp. 123–133. [Google Scholar]
- Kim, K.-I.; Lee, K.M. Deep Learning-Based Caution Area Traffic Prediction with Automatic Identification System Sensor Data. Sensors 2018, 18, 3172. [Google Scholar] [CrossRef] [Green Version]
- Zhao, S.; Soares, C.G.; Zhu, H.; Suping, Z. A Bayesian network modelling and risk analysis on LNG carrier anchoring system. In Proceedings of the 2015 International Conference on Transportation Information and Safety (ICTIS), Wuhan, China, 25–28 June 2015; Volume 2015, pp. 432–436. [Google Scholar]
- Perkovič, M.; Gucma, L.; Przywarty, M.; Gucma, M.; Petelin, S.; Vidmar, P. Nautical Risk Assessment for LNG Operations at the Port of Koper. Stroj. Vestn. J. Mech. Eng. 2012, 58, 607–613. [Google Scholar] [CrossRef] [Green Version]
- Kim, S.J.; Ko, Y.K.; Paik, J.K.; Youssef, S.A. Collision Risk Assessment of a VLCC Class Tanker. In Proceedings of the SNAME Maritime Convention, Houston, TX, USA, 24–28 October 2017. [Google Scholar]
- Kopacz, Z.; Morgaś, W.; Urbański, J. An Attempt of the Specification of the Ship’s Navigation Process. Annu. Navig. 2001, 3, 91–109. [Google Scholar]
- Kim, J.-S.; Jeong, J.S.; Park, G.-K. Prediction Table for Marine Traffic for Vessel Traffic Service Based on Cognitive Work Analysis. Int. J. Fuzzy Log. Intell. Syst. 2013, 13, 315–323. [Google Scholar] [CrossRef] [Green Version]
- Kim, K.-I.; Jeong, J.S.; Lee, B.-G. Electronics and Telecommunications Research Institute Study on the Analysis of Near-Miss Ship Collisions Using Logistic Regression. J. Adv. Comput. Intell. Intell. Inf. 2017, 21, 467–473. [Google Scholar] [CrossRef]
- Debnath, A.K.; Chin, H.C. Navigational Traffic Conflict Technique: A Proactive Approach to Quantitative Measurement of Collision Risks in Port Waters. J. Navig. 2010, 63, 137–152. [Google Scholar] [CrossRef] [Green Version]
- Ventura, M. COLREGS-International Regulations for Preventing Collisions at Sea; Lloyd’s Register Rulefinder: London, UK, 2005; pp. 1–74. [Google Scholar]
- Kim, B.-H.; Park, Y.-S. A Study on the Effective VTS Communications Analysis by the Method of VCDF in Busan Port. J. Korean Soc. Mar. Environ. Saf. 2016, 22, 311–318. [Google Scholar] [CrossRef]


| Characteristics | Number | % | |
|---|---|---|---|
| Gender | Male | 18 | 90 |
| Female | 2 | 10 | |
| Age | 31–40 years | 12 | 60 |
| 41–50 years | 1 | 5 | |
| >51 years | 7 | 35 | |
| Merchant vessel officer experience | <3 years | 6 | 30 |
| 3–5 years | 12 | 60 | |
| 6–10 years | 2 | 10 | |
| VTS experience | <2 years | 6 | 30 |
| 2–5 years | 2 | 10 | |
| 6–10 years | 5 | 25 | |
| >10 years | 7 | 35 | |
| Type | LOA | Monitoring Weighting Factor |
|---|---|---|
| Cargo vessels | <75 m | 0.8 |
| 75–150 m | 1.0 | |
| 151–225 m | 1.3 | |
| >225 m | 1.6 | |
| Tankers | <75 m | 1.0 |
| 75–150 m | 1.4 | |
| 151–225 m | 1.8 | |
| >225 m | 2.2 | |
| Passenger vessels | <75 m | 0.9 |
| 75–150 m | 1.1 | |
| 151–225 m | 1.5 | |
| >225 m | 1.8 | |
| Towing vessels | <75 m | 1.0 |
| 75–150 m | 1.3 | |
| 151–225 m | 1.7 | |
| >225 m | 2.1 | |
| Small vessels | <75 m | 0.2 |
| Sub-Item Task | Detailed Task of a VTS Operator | Time Needed for a Detailed Task | Total Average Time Needed for a Sub-Item Task |
|---|---|---|---|
| * | Communication with vessels by VHF | 21–30 s | 80.5 s |
| Checking anchorage or wharf information | 11–20 s | ||
| Checking pilot scheduling | 6–10 s | ||
| Checking of safety situation of nearby vessels | 11–20 s | ||
| Tagging vessel name and symbol | 6–10s | ||
| Filling in VTS logbook | 6–10 s | ||
| * | Communication with vessels by VHF | 11–20 s | 23.5 s |
| Filling in VTS logbook | 6–10 s | ||
| * | Communication with vessels by VHF | 11–20 s | 39.0 s |
| Entering information into the harbor management system | 11–20 s | ||
| Filling in logbook | 6–10 s | ||
| * | Communication with vessels by VHF | 21–30 s | 80.0 s |
| Entering information into the harbor management system | 11–20 s | ||
| Checking wharf information | 11–20 s | ||
| Checking of safety situation of nearby vessels | 11–20 s | ||
| Filling in logbook | 6–10 s | ||
| * | Communication with vessels by VHF | 11–20 s | 39.0 s |
| Filling in logbook | 6–10 s | ||
| Adjustment order of pilot boarding and disembarkation | 11–20 s |
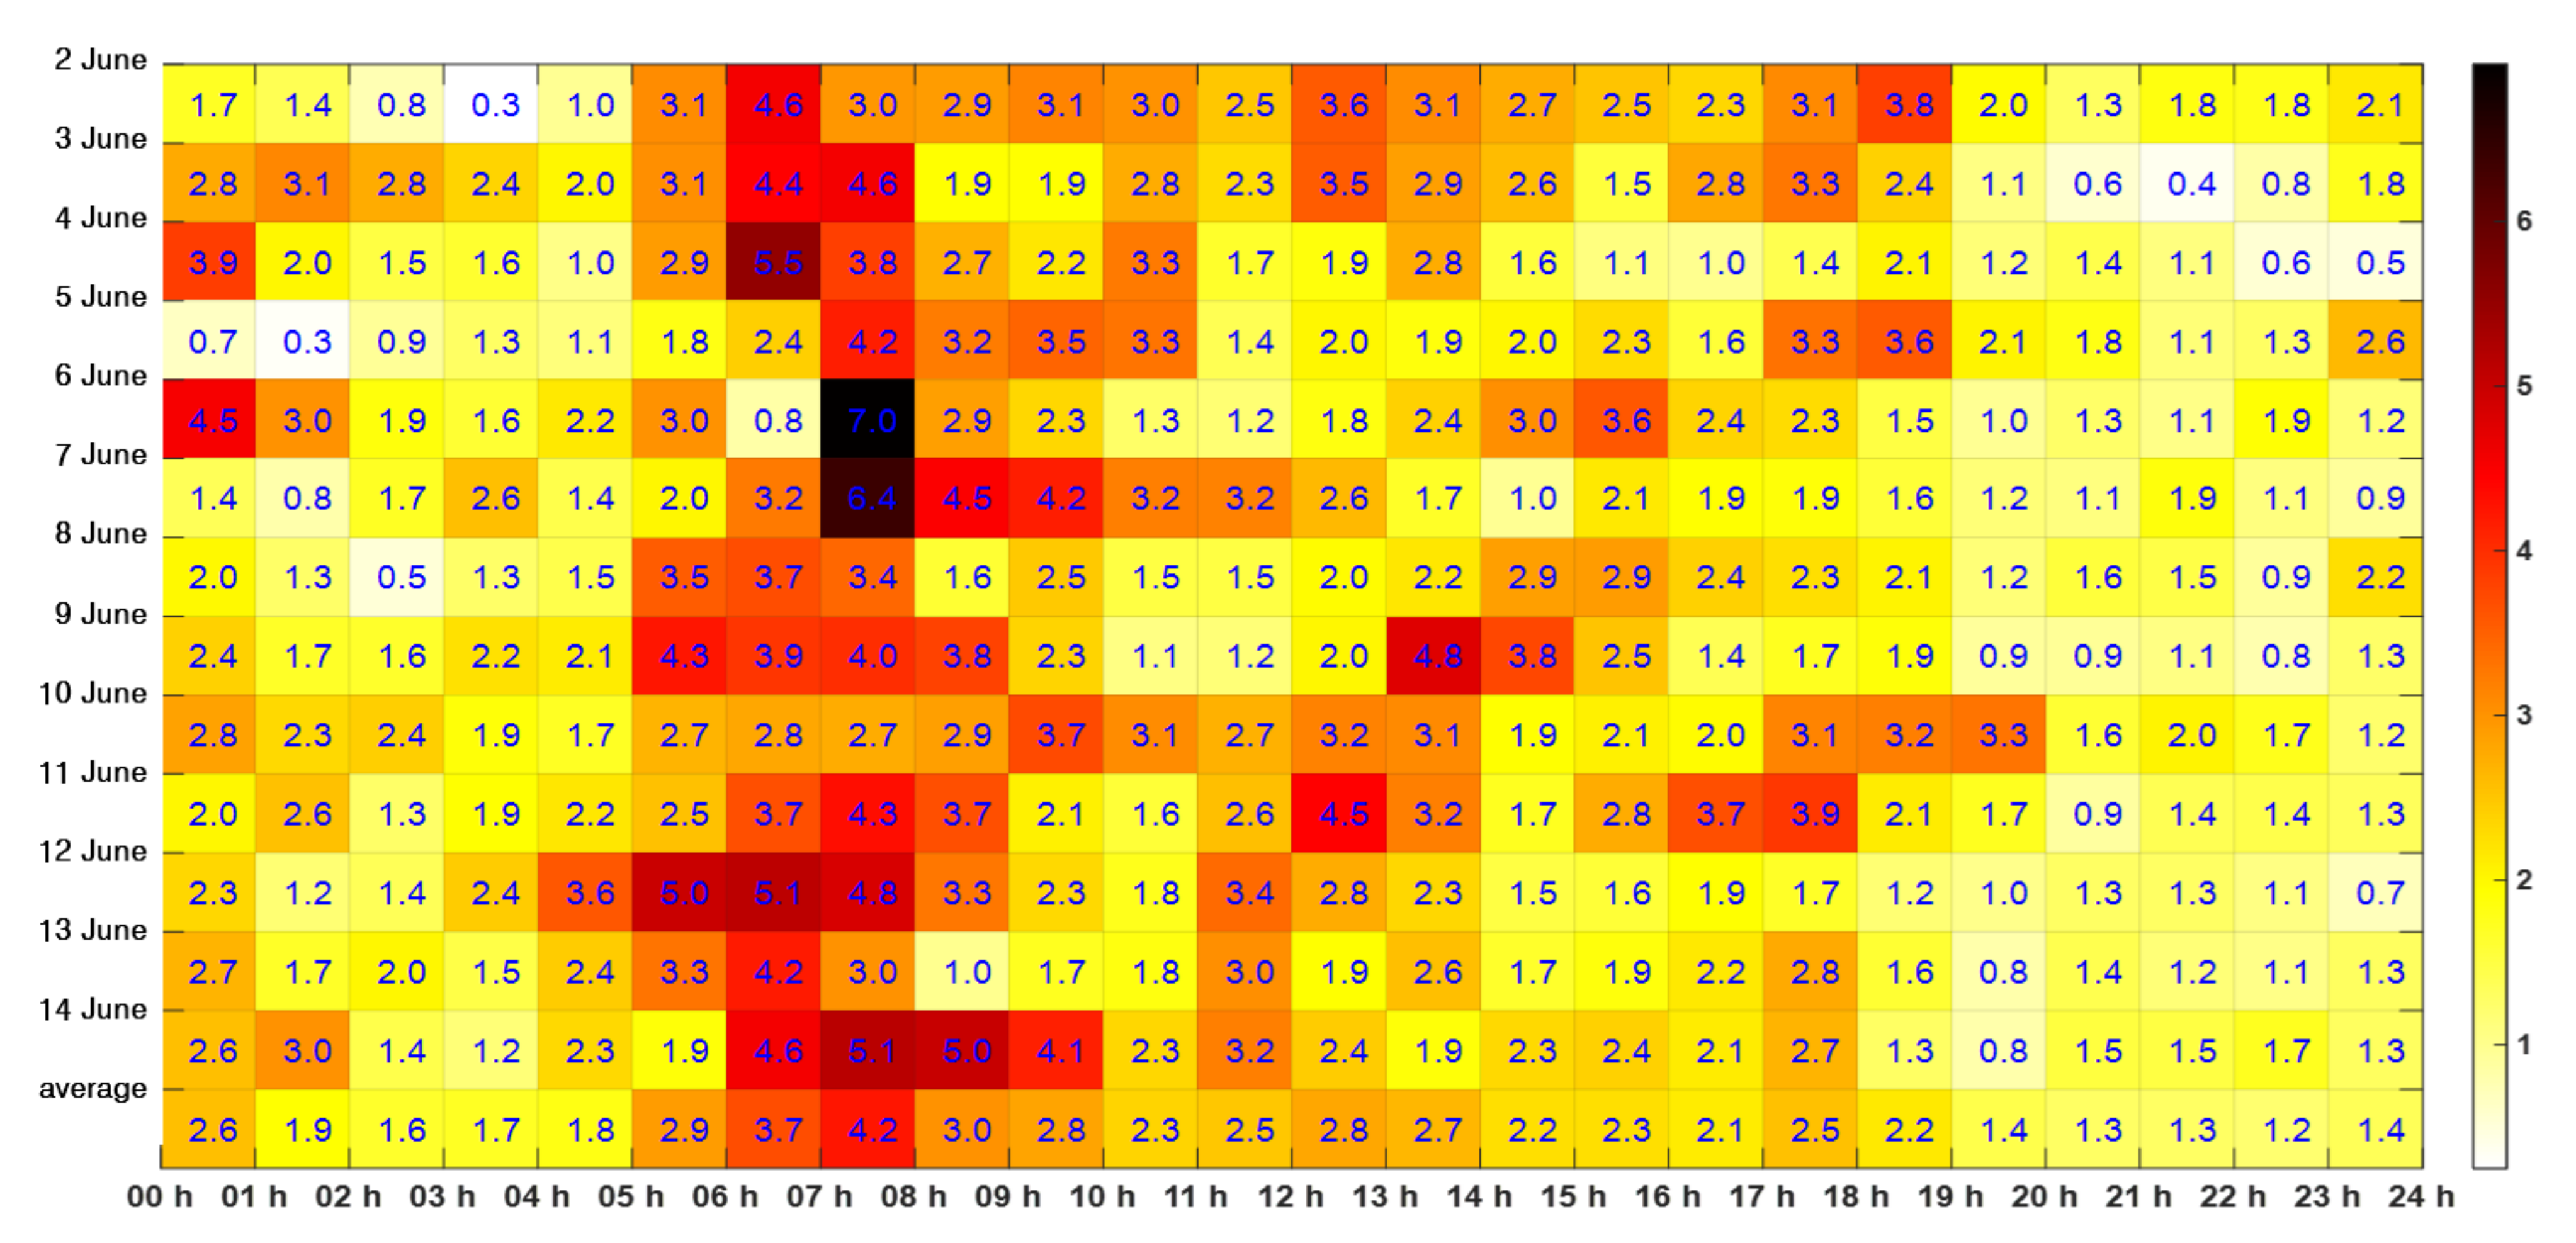
| Hours | |||
|---|---|---|---|
| 00–01 | 4.5 | 3.0 | 4.5 |
| 01–02 | 3.1 | 3.0 | 3.1 |
| 02–03 | 2.8 | 3.0 | 3.0 |
| 03–04 | 2.6 | 3.0 | 3.0 |
| 04–05 | 3.6 | 3.0 | 3.6 |
| 05–06 | 5.0 | 3.0 | 5.0 |
| 06–07 | 5.5 | 3.0 | 5.5 |
| 07–08 | 7.0 | 3.0 | 7.0 |
| 08–09 | 5.0 | 3.0 | 5.0 |
| 09–10 | 4.2 | 3.0 | 4.2 |
| 10–11 | 3.3 | 3.0 | 3.3 |
| 11–12 | 5.1 | 3.0 | 5.1 |
| 12–13 | 4.9 | 3.0 | 4.9 |
| 13–14 | 4.8 | 3.0 | 4.8 |
| 14–15 | 3.8 | 3.0 | 3.8 |
| 15–16 | 3.6 | 3.0 | 3.6 |
| 16–17 | 3.7 | 3.0 | 3.7 |
| 17–18 | 3.9 | 3.0 | 3.9 |
| 18–19 | 3.8 | 3.0 | 3.8 |
| 19–20 | 3.3 | 3.0 | 3.3 |
| 20–21 | 1.8 | 3.0 | 3.0 |
| 21–22 | 2.0 | 3.0 | 3.0 |
| 22–23 | 1.9 | 3.0 | 3.0 |
| 23–24 | 2.6 | 3.0 | 3.0 |
| 4.0 | |||
| Stage | Calculation |
|---|---|
| Stage 1: Actual hours per year | 8766 h = Hours per day (24 h) × Actual days per year (365.25 d) |
| Stage 2: Hours after deductions | 1911.1 h = Hours before deductions per year (40 h × 365.25 d/7 d)—Hours for leave, sickness, and training per year {8 h × (13 d + 3 d + 6 d)} |
| Stage 3: Hours lost per year | 477.7 h = Working days per year (1911.1 h/8 h) × Hours lost (break, meal) per working day (2 h) |
| Stage 4: Total duty hours per year | 1433.3 h = Hours after deductions (1911.1 h)—Hours lost (break, meal) per year (477.7 h) |
| Stage 5: Number of VTS operators per workstation | 6.1 = Actual hours per year (8766 h)/Total duty hours per year (1433.3 h) |
| Item | Calculation | Hour |
|---|---|---|
| Time needed for target identification and label | {(29,582 + 29,656 + 4050) × 20 s}/(365 × 3600 s) | 1.0 h |
| Time needed for replying shipping report | {(29,582 + 29,656 + 4050) × 20 s}/(365 × 3600 s) | 1.0 h |
| Time needed for tracking monitoring | {(29,582 + 29,656) × 0.1 × 38 nm}/(365 × 10 kt) (4050) × 0.1 × 9 nm}/12 kt | 62.5 h |
| Time needed for broadcasting safety information | (137,713 × 60 s)/(365 × 3600 s) | 6.3 h |
| Time needed for sail planning | (20,234 × 30 s)/(365 × 3600 s) | 0.5 h |
| Other business work time | (15,370 × 60 s)/(365 × 3600 s) | 0.7 h |
| Total | 71.9 h | |
| 3.0 |
Publisher’s Note: MDPI stays neutral with regard to jurisdictional claims in published maps and institutional affiliations. |
© 2021 by the authors. Licensee MDPI, Basel, Switzerland. This article is an open access article distributed under the terms and conditions of the Creative Commons Attribution (CC BY) license (https://creativecommons.org/licenses/by/4.0/).
Share and Cite
Yoo, S.-L.; Kim, K.-I. Optimal Staffing for Vessel Traffic Service Operators: A Case Study of Yeosu VTS. Sensors 2021, 21, 8004. https://doi.org/10.3390/s21238004
Yoo S-L, Kim K-I. Optimal Staffing for Vessel Traffic Service Operators: A Case Study of Yeosu VTS. Sensors. 2021; 21(23):8004. https://doi.org/10.3390/s21238004
Chicago/Turabian StyleYoo, Sang-Lok, and Kwang-Il Kim. 2021. "Optimal Staffing for Vessel Traffic Service Operators: A Case Study of Yeosu VTS" Sensors 21, no. 23: 8004. https://doi.org/10.3390/s21238004