Abstract
Very long baseline interferometry (VLBI) is the only technique in space geodesy that can determine directly the celestial pole offsets (CPO). In this paper, we make use of the CPO derived from global VLBI solutions to estimate empirical corrections to the main lunisolar nutation terms included in the IAU 2006/2000A precession–nutation model. In particular, we pay attention to two factors that affect the estimation of such corrections: the celestial reference frame used in the production of the global VLBI solutions and the stochastic model employed in the least-squares adjustment of the corrections. In both cases, we have found that the choice of these aspects has an effect of a few μas in the estimated corrections.
1. Introduction
The study of the nutation of the Earth is fundamental in two aspects: to infer the structure of the Earth’s interior and to determine the orientation of the Earth’s axis in the inertial frame. Very long baseline interferometry (VLBI) is the technique that allows the most regular and precise observations of the nutation of the Earth by means of the observations of extragalactic radio sources, although according to [1], lunar laser ranging (LLR) has also the potential to determine celestial pole offsets (CPOs) with an accuracy comparable to VLBI. The CPOs represent the mismatch between the IAU 2006/2000A precession–nutation model and the observations.
Several analysis centers (ACs) contribute to the International VLBI Service for Geodesy and Astrometry (IVS, [2]), providing EOP time series estimated from the analysis of VLBI observations. The IVS combination center combines the estimates from the different ACs to produce the combined solution [3]. Therefore, time series of CPOs can be extracted both from an individual AC’s solution and from the IVS combined solution. The IVS series of CPOs are later processed and compiled in the IERS long-term series [4] with the rest of the EOPs that are produced by means of other space geodesy techniques under the umbrella of the corresponding services (the International GNSS Service, IGS; the International Laser Ranging Service, ILRS; and the International DORIS Service, IDS).
Using the available series of CPOs as a starting point, it is possible to adjust amplitudes to several terms of the IAU 2006/2000A precession–nutation theory in order to identify signals that are not included in the model. In this sense, Ref. [5] used the CPO solutions from nine IVS ACs and three combinations to estimate corrections to the IAU 2006/2000A precession–nutation model. Additionally, they estimated supplementary terms accounting for the precession rate, the misalignment of the celestial reference frame and a retrograde circular term to subtract the effect of the free core nutation (FCN).
On the other hand, Ref. [6] studied the impact of frames, and other processing strategies, on the CPO estimates, using the resulting series of these tests to readjust the precession offset and rate and the main nutation amplitudes available in the IAU 2006/2000A model. More recently, Ref. [7] estimated corrections to the main nutation terms within the VLBI analysis process (direct approach) and compared the results to the ones obtained using CPO series (indirect approach). They found that the direct approach returned lower uncertainties, lower correlations between nutation correction estimates and, in some cases, significantly different results with respect to the indirect approach. Another contribution to this research topic is the work by [8], which estimated corrections of lunisolar nutation components from six sets of CPOs and used the remaining residuals for the study of the FCN signal.
The usual approach in the estimation of corrections to the main lunisolar nutation components is to take as input the latest available CPO series at the time, without taking into account their compatibility in terms of analysis configuration. This point was already noted by the authors of [5] when they found significant differences in the corrections derived from each solution. These differences were due to the analysis configuration or the software packages used by each AC. The authors highlighted the need to research the reasons that could explain the differences between the series. In this work, we assess the impact on the corrections to the main lunisolar nutation terms of one relevant factor in the configuration of VLBI analysis, which is the celestial reference frame. We complement this analysis with an assessment on the weighting of the CPO in the least-squares adjustment of the nutation corrections, following an approach that is different from [5]. This new approach is based on scaling the uncertainties of the CPO as a function of the network geometry of each VLBI session used in the analysis.
2. Methods
For the computation of the corrections to the IAU 2000A model, we adopted the lunisolar nutation terms used by the authors of [9] in their work. These terms consisted of 21 prograde and retrograde circular terms with known astronomical frequencies and phases. The corresponding harmonic terms and periods are listed in Table 1. Columns 2 to 6 correspond to the multiplier factor of the Delaunay arguments [10] and are detailed below:

Table 1.
Harmonic terms of the nutation model considered in the analysis.
- l: mean anomaly of the Moon,
- l’: mean anomaly of the Sun,
- F: mean longitude of the Moon minus mean longitude of the ascending node of the Moon,
- D: mean elongation of the Moon from the Sun,
- Ω: mean longitude of the ascending node of the Moon.
The mathematical model used for the computation of corrections to the main nutation terms of the IAU2000A model by means of a least-square harmonic fit is shown in Equation (1):
where (dX, dY) are the CPOs available from the VLBI series, (dXFCN, dYFCN) account for the effect of free core nutation, (ac,i, as,i) are the amplitudes of the corrections and ARGi are linear combinations of the fundamental arguments of the lunisolar nutation theory [10] listed in Table 1. In all the tests presented in the following sections, the corrections to the terms listed in Table 1 were computed after having removed the FCN signal using the B16 model [11].
3. Results
This section includes the results of the two tests performed for the computation of corrections to the IAU 2006/2000A precession–nutation model.
3.1. Test A: Different Celestial Reference Frame
The first test was to estimate the corrections using as input the series compatible with ICRF2 ([12]) and ICRF3 ([13]) for each of the AC considered in Table 2. Only those IVS ACs providing global solutions with both ICRF2 and ICRF3 were considered. The solutions for each AC were selected following the criteria of using the last available series compatible with ICRF2 and the first series obtained using ICRF3. The metadata of the solutions were reviewed to ensure that there were no other major changes in the configuration of the analysis; this was also the reason to use several solutions, in order to mitigate the potential differences in the processing between the two solutions of the same AC. The time span of the analysis was limited to 1993–2021, given that data before 1993 presented worse accuracy and lower temporal resolution than more recent data [11].

Table 2.
List of VLBI global solutions considered in Test A 1.
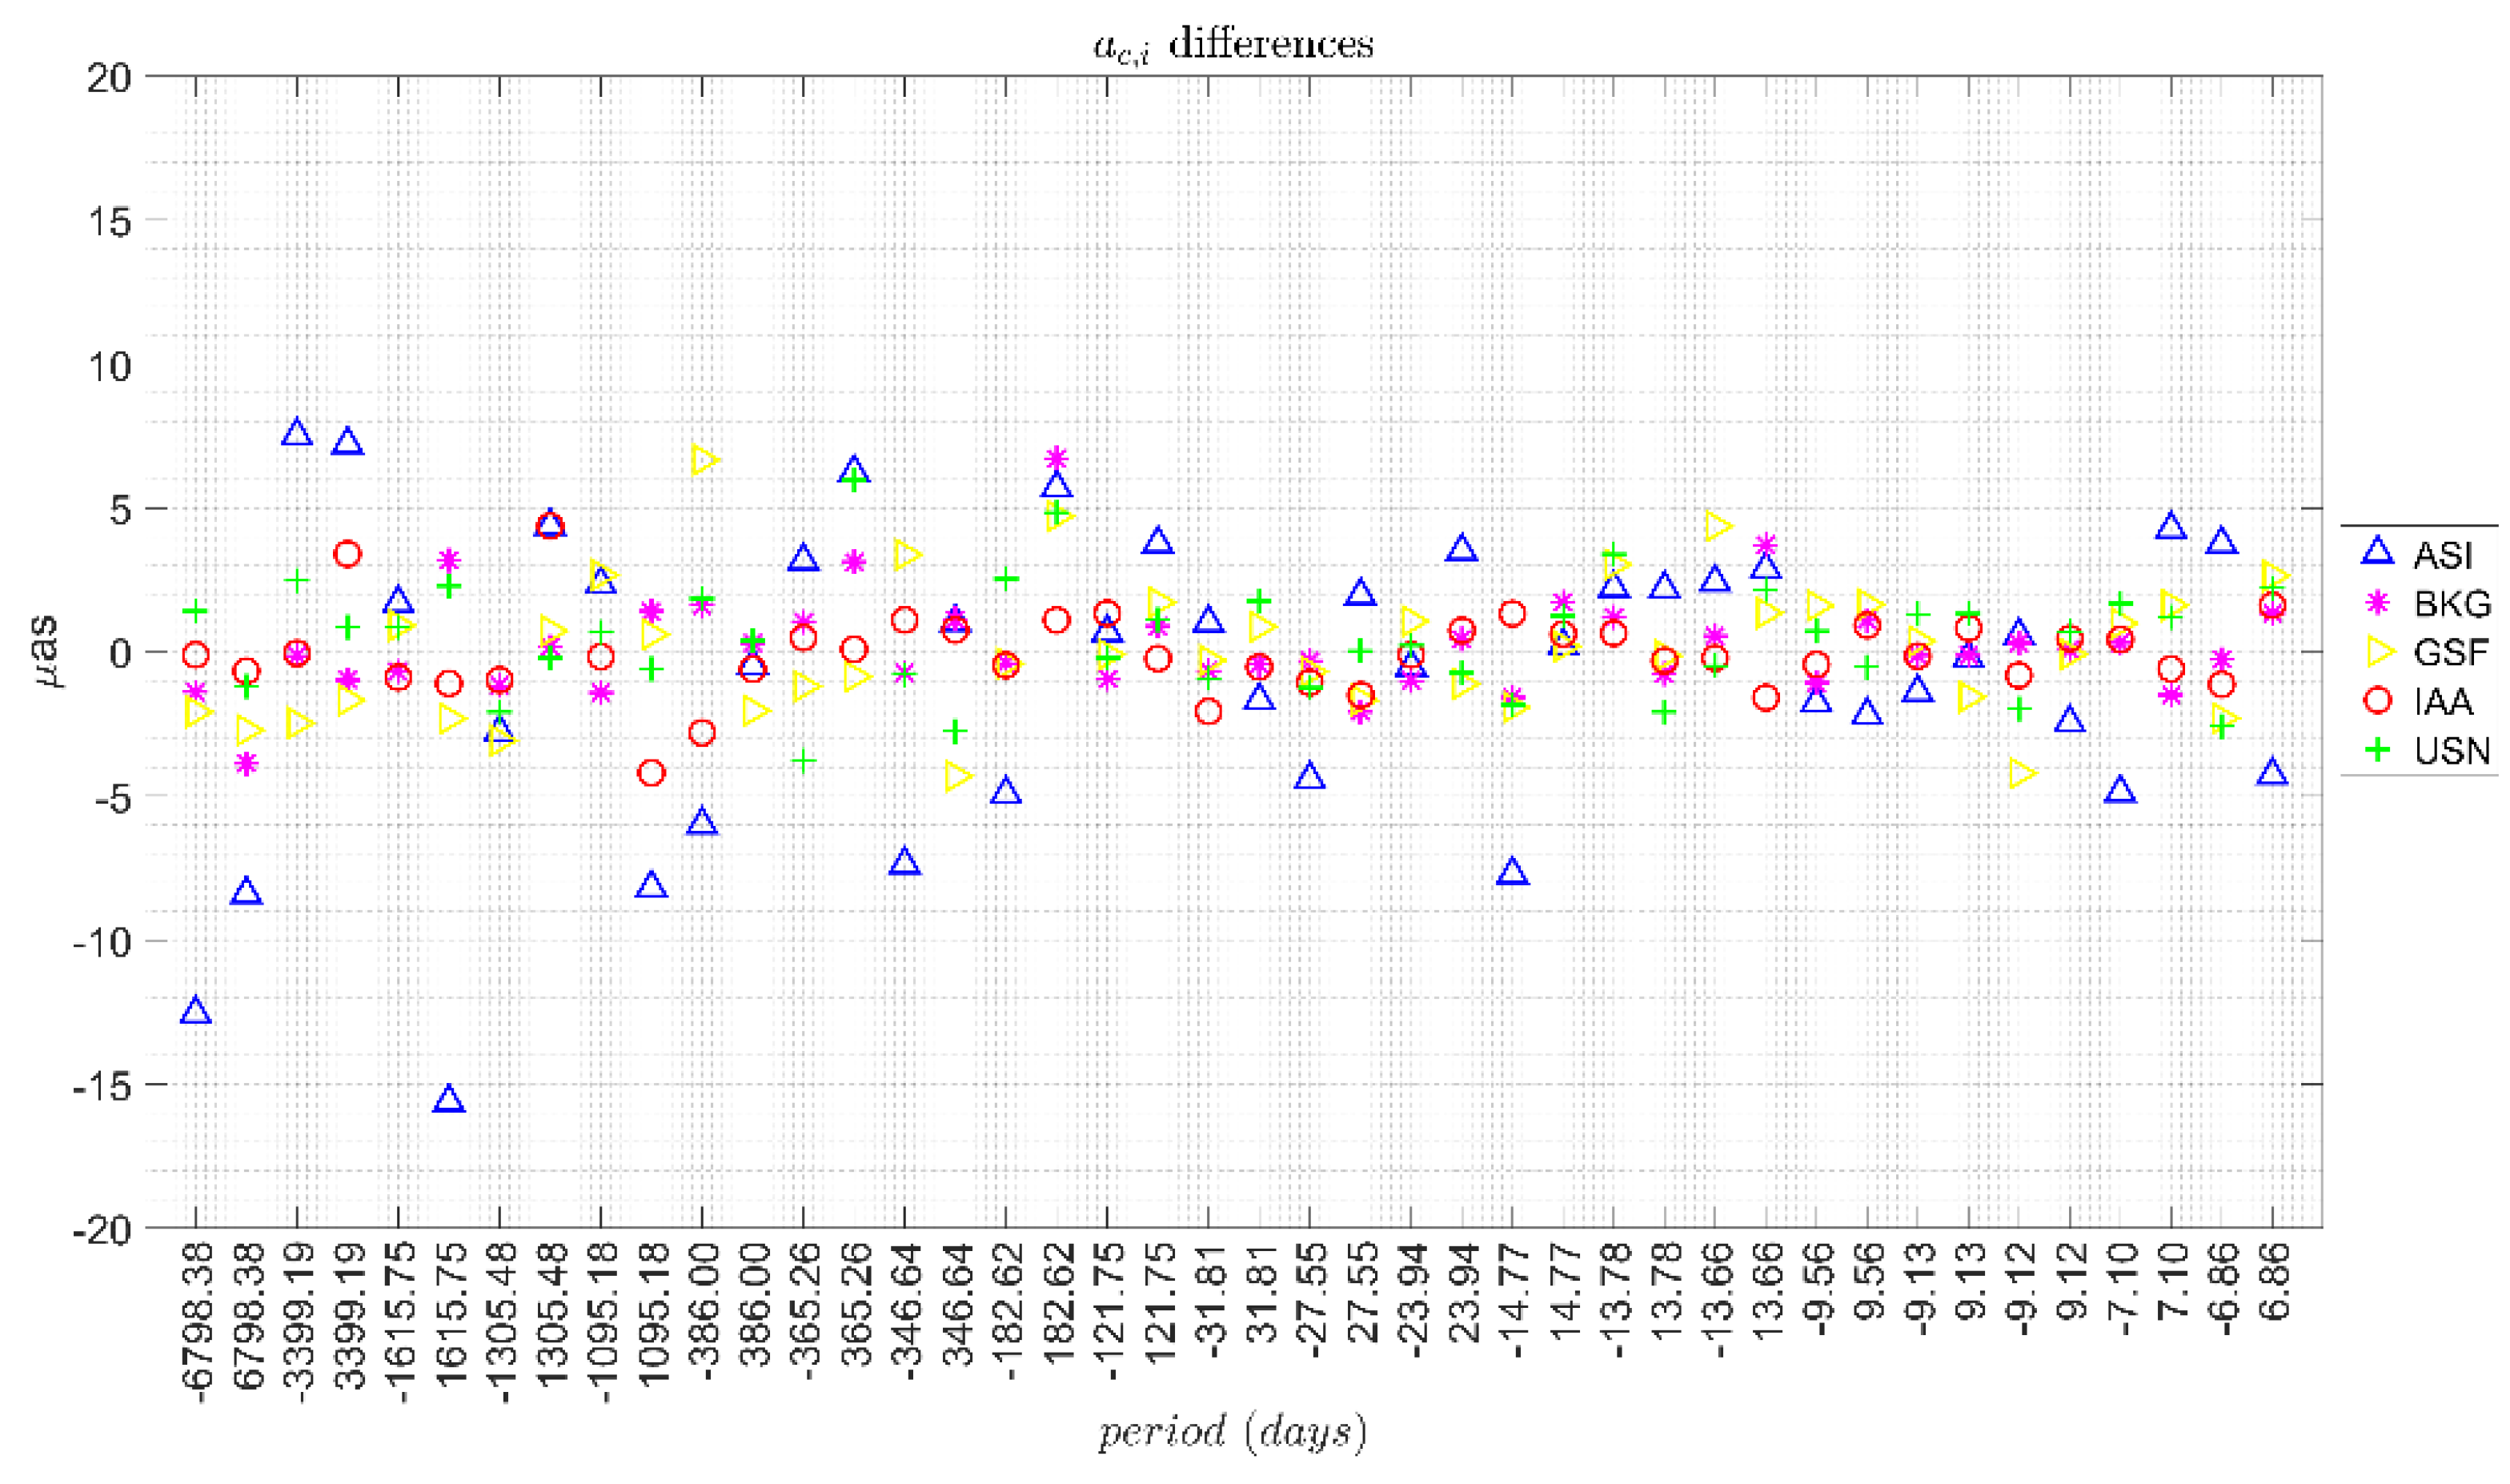
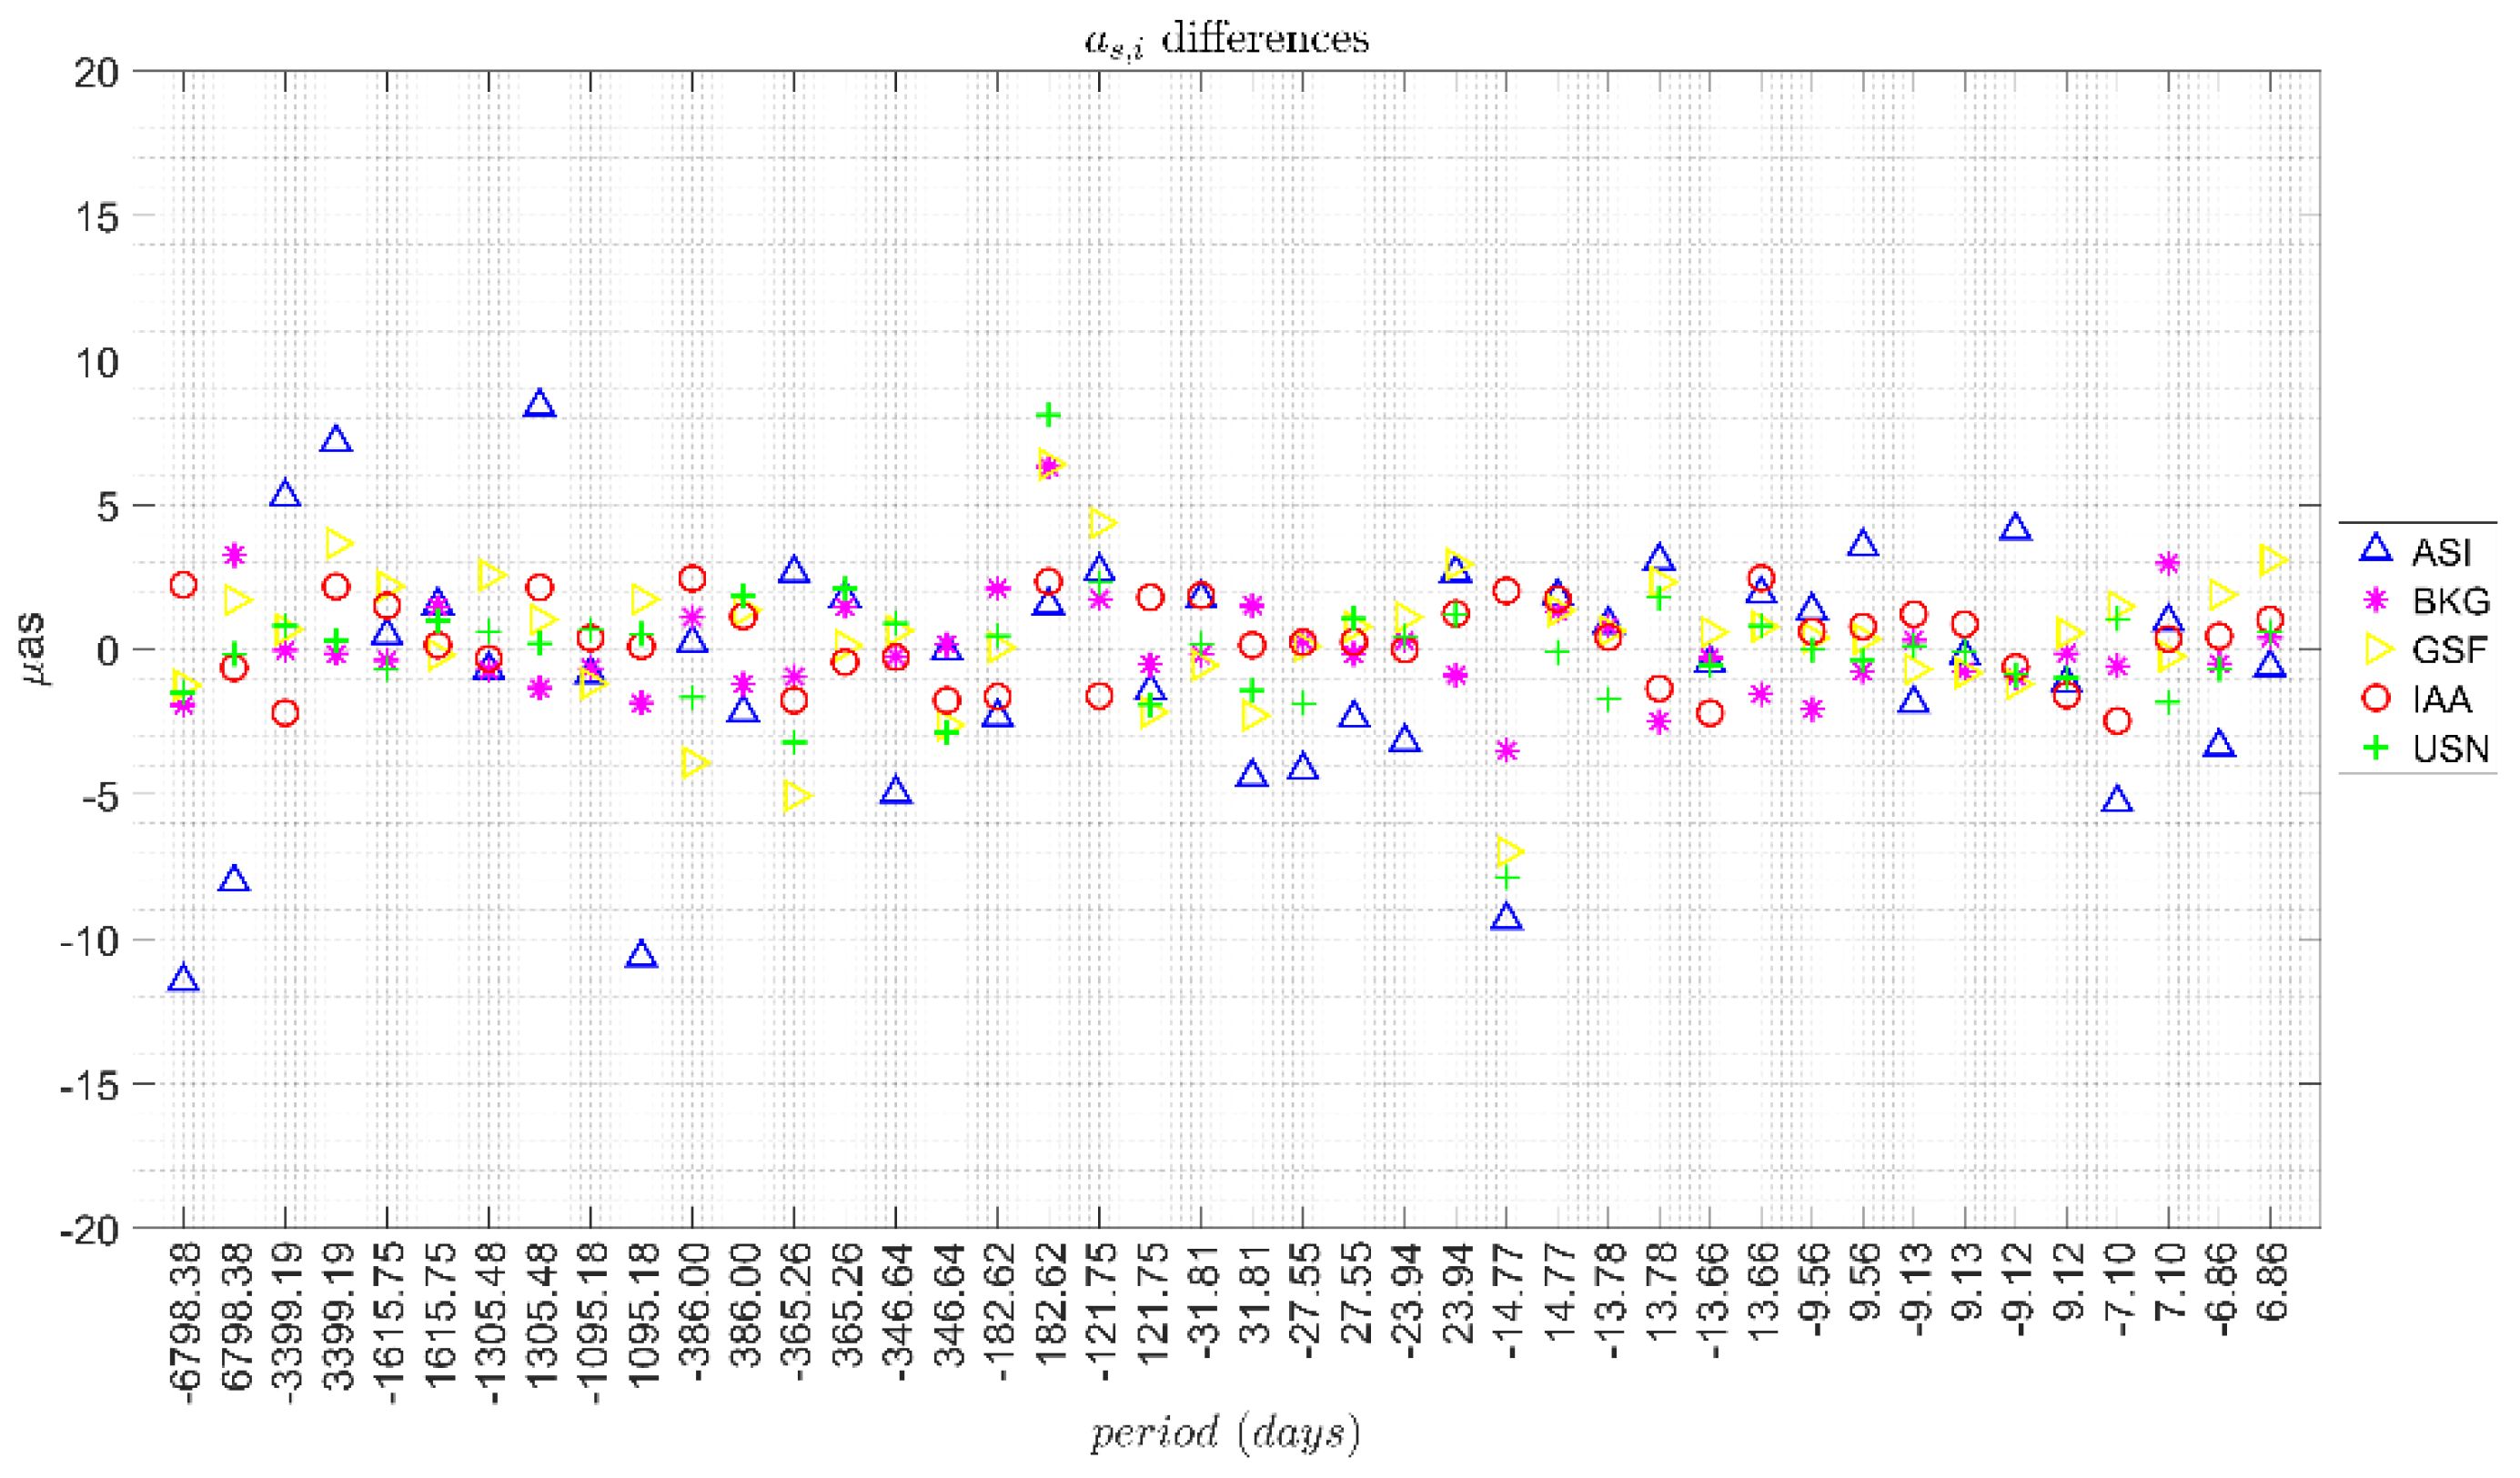
Figure 1 and Figure 2 show for each solution the differences between the corrections derived from the ICRF3 and ICRF2 series, for ac,i and as,i respectively.
Figure 1.
Differences in ac,i terms derived from the ICRF3 and ICRF2 series.
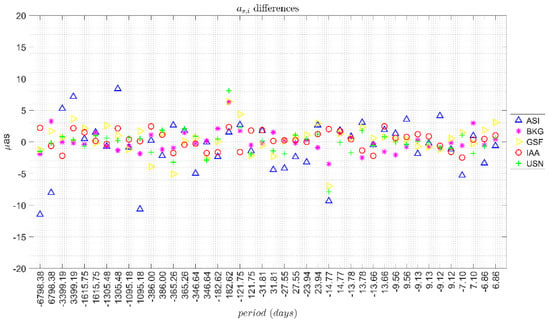
Figure 2.
Differences in as,i terms derived from the ICRF3 and ICRF2 series.
In general, the differences were in a band of ±5 μas for all the periods, except for the ASI solution which showed a more scattered behaviour. Table 3 includes the range of the corrections for each AC together with the mean formal error of the residuals in brackets. It also includes the solution (ICRF2 and ICRF3) and the median and standard deviation (STD) of the differences between the corrections estimated with the series associated to each ICRF.

Table 3.
Test A: statistics of the corrections to the main lunisolar nutation terms (units: μas).
The median values of the corrections presented a similar behaviour regardless of the ICRF used. The median value of the range (i.e., the difference between the highest correction and the smallest correction with their sign for the 42 terms) for the ac,i amplitudes was 22.3 μas for ICRF2 and 26.1 μas for ICRF3. For the as,i amplitudes, the median value was 26.7 μas for ICRF2 and 28.0 μas for ICRF3. The analysis of the range of the corrections was aimed at noting the magnitude of the estimated corrections and also at pointing out the consistency between the different AC solutions.
The differences between the corrections had a median value of −0.1 μas and standard deviation of 2.0 μas for ac,i amplitudes and a median of 0.4 μas with standard deviation of 1.7 μas for as,i amplitudes. Finally, it should be noted that the use of ICRF3 did not improve the formal error of each computed correction. The mean formal error over all the AC solutions was 2.2 μas for both ICRF2 and ICRF3. In addition, no significant difference was found between the solutions of the different ACs.
From these results it can be concluded that the difference between using ICRF2 or ICRF3 was in the level of a few μas (band of ±5 μas) whereas the estimated values of lunisolar nutation corrections were in the order of a few tens of μas. Therefore, the choice of ICRF for the estimation of corrections to the nutation model had an impact of one order of magnitude less than the magnitude of such corrections.
3.2. Test B: Different CPO Weigthing
In the results presented in the previous section, no stochastic model was used in the least-squares adjustment to estimate the corrections to the nutation model, whereas [5,6] used weights taken as the inverse of the squared formal errors from the VLBI series. Additionally, Ref. [5] estimated a scale factor and an error floor together with the fitting of the corrections in order to account for the differences in the observation geometry between VLBI sessions.
One of the main factors that impacts VLBI estimates of EOPs is the network geometry, and this fact can be taken into consideration in the estimation of corrections to the IAU 2000A model from VLBI-based CPO series [14]. For this purpose, the CPO precision as a function of the network of the corresponding VLBI session needs to be rescaled and this information can be used to build a stochastic model.
The relationship between network geometry and EOP precision was already addressed by [14]. Following an analysis of the VLBI series from June 1996 to February 2007, the authors found that the volume of network (V) could be used as an indicator of the uncertainties in EOP estimation. In order to have consistent uncertainties between sessions, they should be reduced to the unit volume of the network as follows:
where σm is the modified uncertainty, σ is the original uncertainty, V is the volume of the network and c is a parameter that relates EOP precision and network volume. This value can be fitted using long-term series of VLBI EOP estimates, as will be detailed later.
In order to have consistent uncertainties to build an appropriate stochastic model, we have followed the same methodology as [14], extending the analyzed period to fit a new model that relates network volume and uncertainty. As a proof of concept, we used GSF series (gsf2020a.eoxy) in the period 1993–2021. The reason for using only one solution was that in this case the factor under analysis was the geometry of the observing network, which was not AC dependent. The geometry of the sessions was the same for all ACs.
The following computations were carried out based on [14]:
1. For each session of the series, the tetrahedron mesh corresponding to the network polyhedron was defined by means of the Delaunay triangulation. The list of stations in each session was extracted from the EOP series, which included the two-letter IVS station identifiers. The Delaunay triangulation was computed using MATLAB [15].
2. Computation of the volume of each tetrahedron (vi):
where ri is the geocentric station vector. Sessions that had less than four stations were not considered in the analysis.
3. Computation of the total network volume (V) as the sum of the volumes of all the tetrahedrons computed in the previous step.
4. The EOP series were binned in nine groups based on the total network volume in Mm3
5. For each group, the average network volume ( and average CPO uncertainties (, ) were computed, obtaining the values in Table 4.

Table 4.
Average network volume, number of sessions and CPO uncertainties per volume group.
6. Least-squares fitting of a power model relating CPO precision (σ) and network volume (V) with the following form:
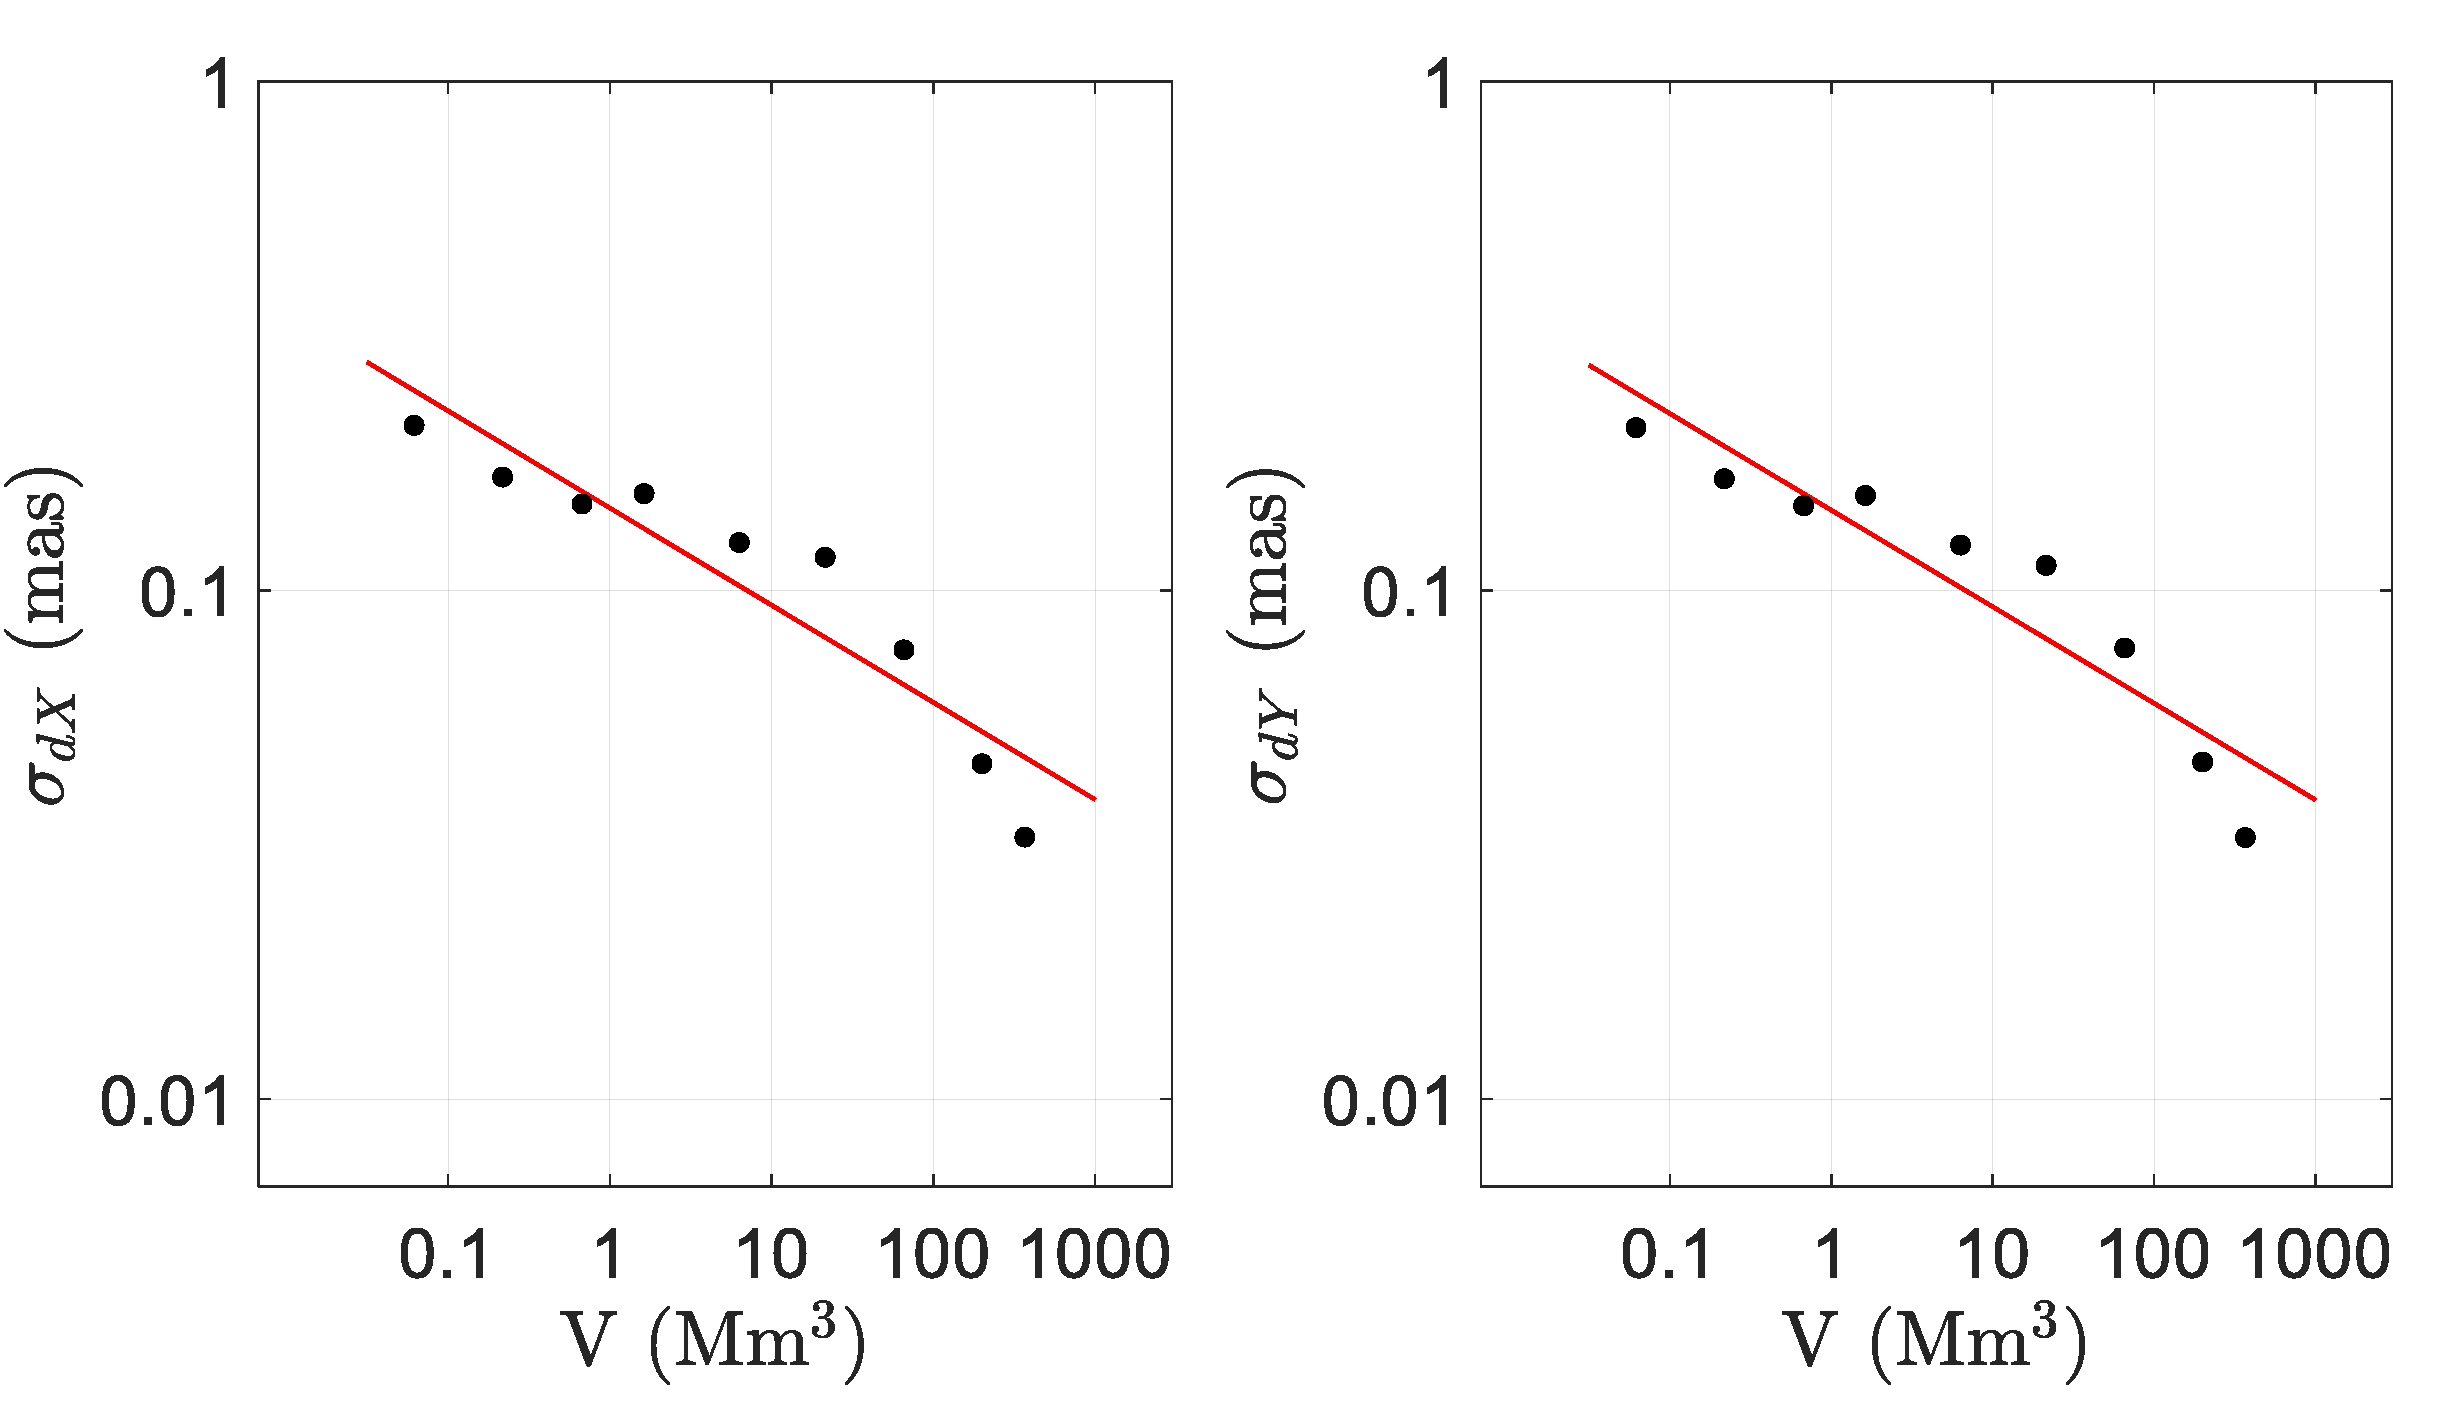
where b and c are the parameters to be estimated. This fitting was applied for dX and dY separately, and the results are shown in Table 5. The value of c was within the same order of magnitude as the one obtained by [14] for a shorter period of analysis (−0.238). The difference in the b value ([14] reported −0.772 for dX and −0.772 for dY) could be due to the number of sessions considered in the analysis (1440 in [14] and 2268 in this work).

Table 5.
Estimated coefficients of the power model relating precision and network volume.
Figure 3 shows the relationship between CPO precision and network volume. Dots correspond to the logarithmic values of Table 4 and the solid line is the fitted model. Logarithmic scales were used on both axes. This figure was similar to the one obtained by [14] for a shorter period of analysis and it also showed a clear relationship between CPO precision and network volume.
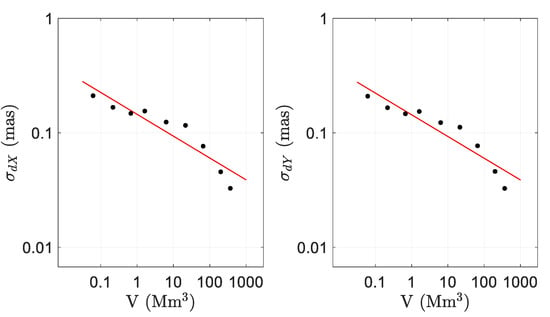
Figure 3.
Relationship between the CPO precision and the VLBI network volume.
It was possible to perform a comparison of the effect of the three different stochastic models in the weighted least-squares adjustment to estimate corrections to the nutation model. The three scenarios analysed were the following:
- Test B.1: no stochastic model.
- Test B.2: original uncertainties from the series. In this case, the elements of the weight matrix were:where σ0 is the a priori variance factor and σi is the uncertainty available in the original series. σ0 was set to the mean value of the uncertainties in the original series.
- Test B.3: Modified uncertainties. In this case, the elements of the weight matrix were:
Two statistical criteria were used in order to compare the results of the different strategies evaluated on the CPO weighting:
- A posteriori variance factor (): quotient between the sum of each weighted residual square and the number of degrees of freedom of the least-squares fitting.
- χ2 value quotient between the a posteriori variance and the a priori variance factor. Values of χ2 close to one indicated a realistic adjustment in terms of a priori weights.
The results obtained in the three scenarios analysed are shown in Table 6, where it can be seen that the test in which the modified uncertainties were used to build the stochastic model brought the smallest a posteriori variance factor and the χ2 value closest to 1. Therefore, it can be stated that this was the most suitable stochastic model to be used in the weighted least-squares adjustment to estimate corrections to the nutation model. The improvement in the formal error of the corrections is below μas when using this approach.

Table 6.
Statistical indicators of the solutions obtained using different stochastic models for the fitting of corrections to the IAU 2000A model.
Finally, Table 7 includes the statistics of the differences in the corrections considering the best option (Test B.3) with respect the other two tests performed on the CPO weighting. From these results, it can be concluded that the choice of the stochastic model produced significant differences in the corrections since they were in the μas level, which was the level of the accuracy of the IAU 2000A nutation model

Table 7.
Test B: statistics of the differences in the corrections (units: μas).
The corrections computed in Test B.3 (modified uncertainties) presented median differences with respect to the other two tests in level of 1 μas or below, standard deviation between 4–5 μas and a range in differences of a few tens of μas. This range was computed as the difference between the highest correction difference and the smallest correction difference with their sign.
4. Conclusions
In this paper we studied the influence of the celestial reference frame and the stochastic model of the least-squares fitting in the estimation of empirical corrections to the main lunisolar nutation terms of the IAU 2006/2000A precession–nutation model. As a starting point, we used CPOs derived from global VLBI solutions.
For the study of the influence of the celestial reference frame, we considered the ICRF2 and ICRF3 compatible solutions of five IVS ACs, finding that the median values of the differences in the corrections computed with each frame were in a band of ±5 μas for all the periods considered except for one of the solutions that presented a more scattered behaviour. These differences were one order of magnitude smaller than the magnitude of the estimated corrections to the nutation terms, which were in the order of a few tens of μas.
Regarding the stochastic model of the least-squares adjustment, we found that using modified uncertainties based on the VLBI network volume brought the smallest a posteriori variance factor with the χ2 value closest to one. We concluded that this approach was the most suitable stochastic model to be used in the weighted least-squares adjustment to estimate corrections to the IAU 2000A model, instead of using the original uncertainties or not considering the stochastic model in the least-squares adjustment. We compared the corrections obtained with each stochastic model and we concluded that the choice of the stochastic model could have an effect of a few factors of μas in the estimated corrections, which were significant given that they were in the level of the accuracy of the IAU 2000A nutation model.
Author Contributions
Conceptualization, V.P. and M.F.; methodology, V.P.; software, V.P.; validation, V.P.; formal analysis, V.P. and M.F.; investigation, V.P. and M.F.; resources, V.P.; data curation, V.P.; writing—original draft preparation, V.P.; writing—review and editing, M.F.; visualization, V.P.; supervision, M.F. All authors have read and agreed to the published version of the manuscript.
Funding
The research was partially supported by the Spanish Project PID2020-119383GB-I00 (AEI/FEDER, UE).
Institutional Review Board Statement
Not applicable.
Informed Consent Statement
Not applicable.
Data Availability Statement
The datasets analysed in this study are freely available at the IVS servers.
Acknowledgments
We are grateful to the International VLBI Service for Geodesy and Astrometry for their effort to provide high quality geodetic data and products and to the reviewers of the manuscript for their valuable comments.
Conflicts of Interest
The authors declare no conflict of interest.
References
- Cheng, Y.-T.; Liu, J.-C.; Zhu, Z. Analyses of celestial pole offsets with VLBI, LLR, and optical observations. Astron. Astrophys. 2019, 627, A81. [Google Scholar] [CrossRef] [Green Version]
- Nothnagel, A.; Artz, T.; Behrend, D.; Malkin, Z. International VLBI service for geodesy and astrometry-delivering high-quality products and embarking on observations of the next generation. J. Geod. 2017, 91, 711–721. [Google Scholar] [CrossRef]
- Bachmann, S.; Bloßfeld, M.; Glomsda, M.; Thaller, D. BKG/DGFI-TUM Combination Center Biennial Report 2017+2018. In International VLBI Service for Geodesy and Astrometry 2017+2018 Biennial Report; 2020; pp. 196–198. NASA/TP-2020-219041. Available online: https://ivscc.gsfc.nasa.gov/publications/br2017+2018/acbkg-dgfi.pdf (accessed on 6 December 2021).
- Bizouard, C.; Lambert, S.; Gattano, C.; Becker, O.; Richard, J.Y. The IERS EOP 14C04 solution for Earth orientation parameters consistent with ITRF 2014. J. Geod. 2018, 93, 621–633. [Google Scholar] [CrossRef]
- Gattano, C.; Lambert, S.; Bizouard, C. Observation of the Earth’s nutation by the VLBI: How accurate is the geophysical signal. J. Geod. 2017, 91, 849–856. [Google Scholar] [CrossRef] [Green Version]
- Belda, S.; Heinkelmann, R.; Ferrándiz, J.M.; Karbon, M.; Nilsson, T.; Schuh, H. An Improved Empirical Harmonic Model of the Celestial Intermediate Pole Offsets from a Global VLBI Solution. Astron. J. 2017, 154, 166. [Google Scholar] [CrossRef] [Green Version]
- Nurul Huda, I.; Lambert, S.; Bizouard, C.; Ziegler, Y. Nutation terms adjustment and implication for the Earth rotation resonance parameters. Geophys. J. Int. 2020, 220, 759–767. [Google Scholar] [CrossRef]
- Zhu, P.; Triana, A.S.; Rekier, J.; Trinh, A.; Dehant, V. Quantification of corrections for the main lunisolar nutation components and analysis of the free core nutation signal remaining in the nutation residuals. J. Geod. 2021, 95, 57. [Google Scholar] [CrossRef]
- Mathews, P.M.; Herring, T.A.; Buffett, B.A. Modeling of nutation and precession: New nutation series for nonrigid Earth, and insights into the Earth’s interior. J. Geophys. Res. 2002, 107, ETG 3-1–ETG 3-26. [Google Scholar] [CrossRef]
- Petit, G.; Luzum, B. Technical Report 36. In IERS Conventions 2010; Verlag des Bundesamts fur Kartographie und Geodasie: Frankfurt am Main, Germany, 2010. [Google Scholar]
- Belda, S.; Ferrándiz, J.M.; Heinkelmann, R.; Nilsson, T.; Schuh, H. Testing a new Free Core Nutation empirical model. J. Geodyn. 2016, 94, 59–67. [Google Scholar] [CrossRef] [Green Version]
- Fey, A.L.; Gordon, D.; Jacobs, C.S.; Ma, C.; Gaume, R.; Arias, E.F.; Bianco, G.; Boboltz, D.A.; Boeckmann, S.; Bolotin, S.; et al. The second realization of the International Celestial Reference Frame by Very Long Baseline Interferometry. Astron. J. 2015, 150, 58. [Google Scholar] [CrossRef] [Green Version]
- Charlot, P.; Jacobs, C.S.; Gordon, D.; Lambert, S.; de Witt, A.; Böhm, J.; Fey, A.L.; Heinkelmann, R.; Skurikhina, E.; Titov, O.; et al. The third realization of the international celestial reference frame by very long baseline interferometry. Astron. Astrophys. 2020, 644, A159. [Google Scholar] [CrossRef]
- Malkin, Z. On comparison of the Earth orientation parameters obtained from different VLBI networks and observing programs. J. Geod. 2009, 83, 547–556. [Google Scholar] [CrossRef] [Green Version]
- Puente, V. Study of the Nutation of the Earth by VLBI and GNSS Data Analysis. Ph.D. Thesis, Complutense University of Madrid, Madrid, Spain, August 2021. [Google Scholar]
Publisher’s Note: MDPI stays neutral with regard to jurisdictional claims in published maps and institutional affiliations. |
© 2021 by the authors. Licensee MDPI, Basel, Switzerland. This article is an open access article distributed under the terms and conditions of the Creative Commons Attribution (CC BY) license (https://creativecommons.org/licenses/by/4.0/).

