
Development of a Novel Methodology for Remaining Useful Life Prediction of Industrial Slurry Pumps in the Absence of Run to Failure Data


Abstract
:1. Introduction
2. Methodology Adopted for Predicting the RUL of Slurry Pumps
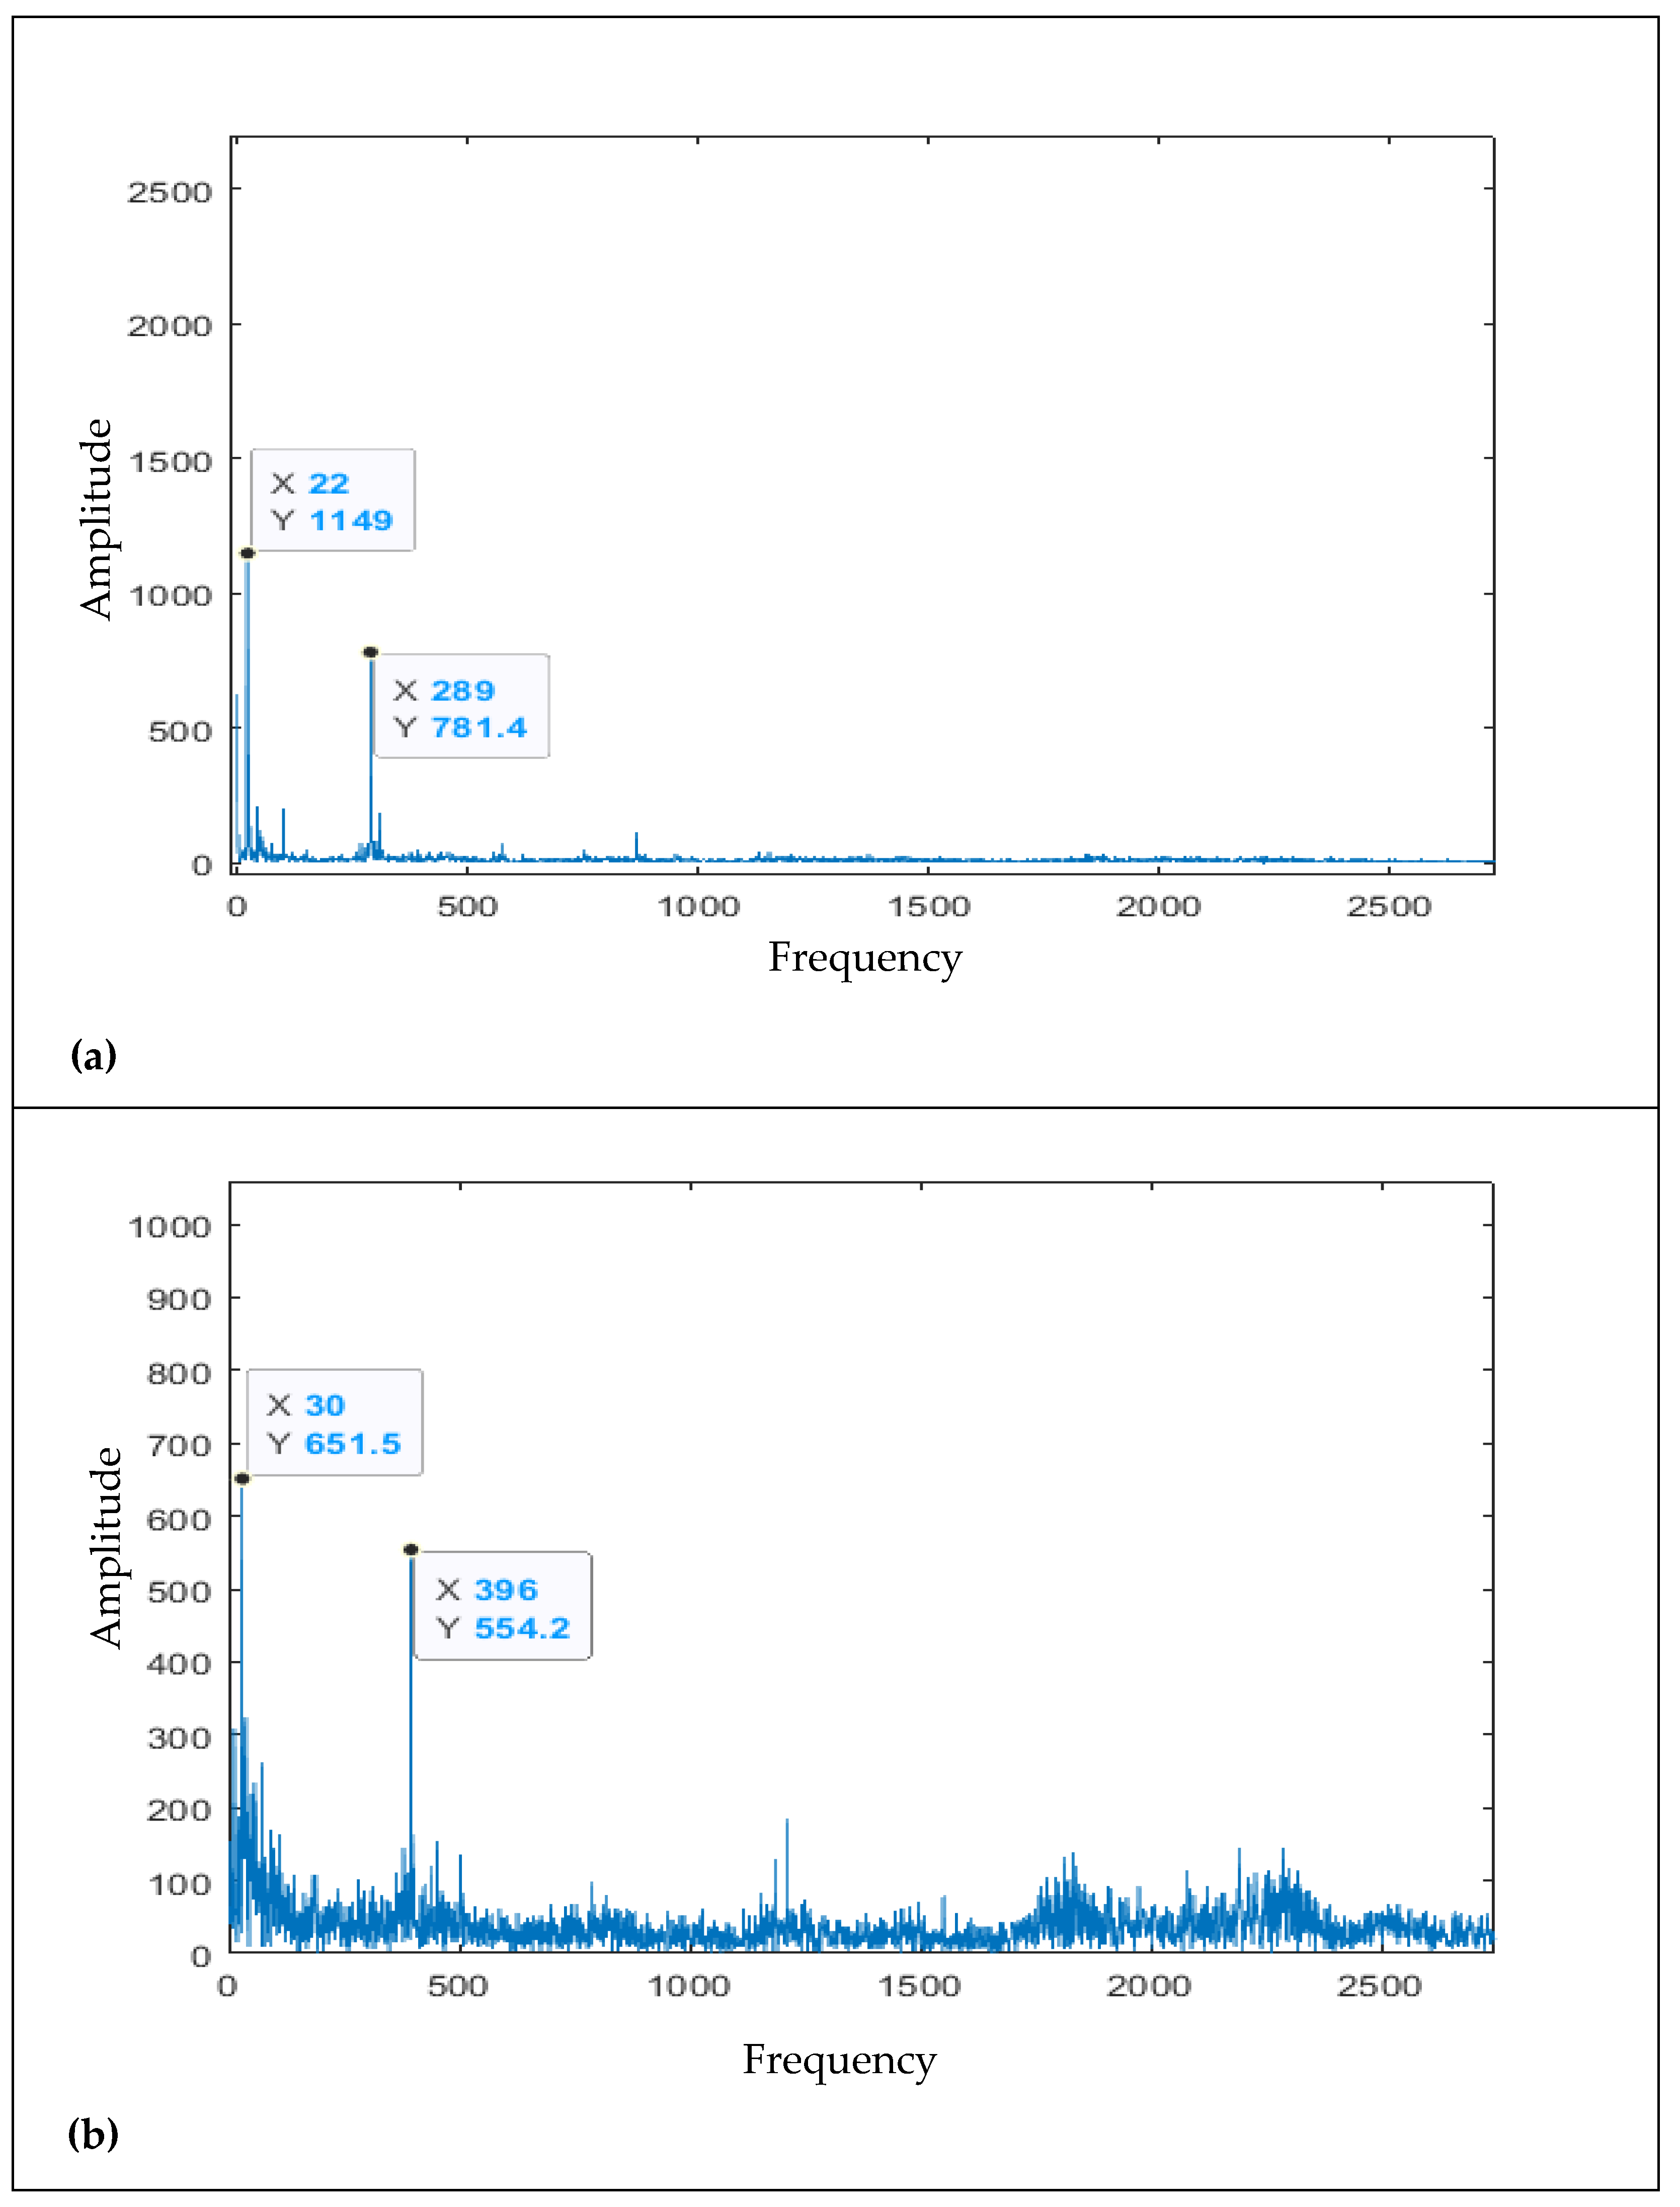
2.1. Data Collection and the Determination of Valid Data Sets
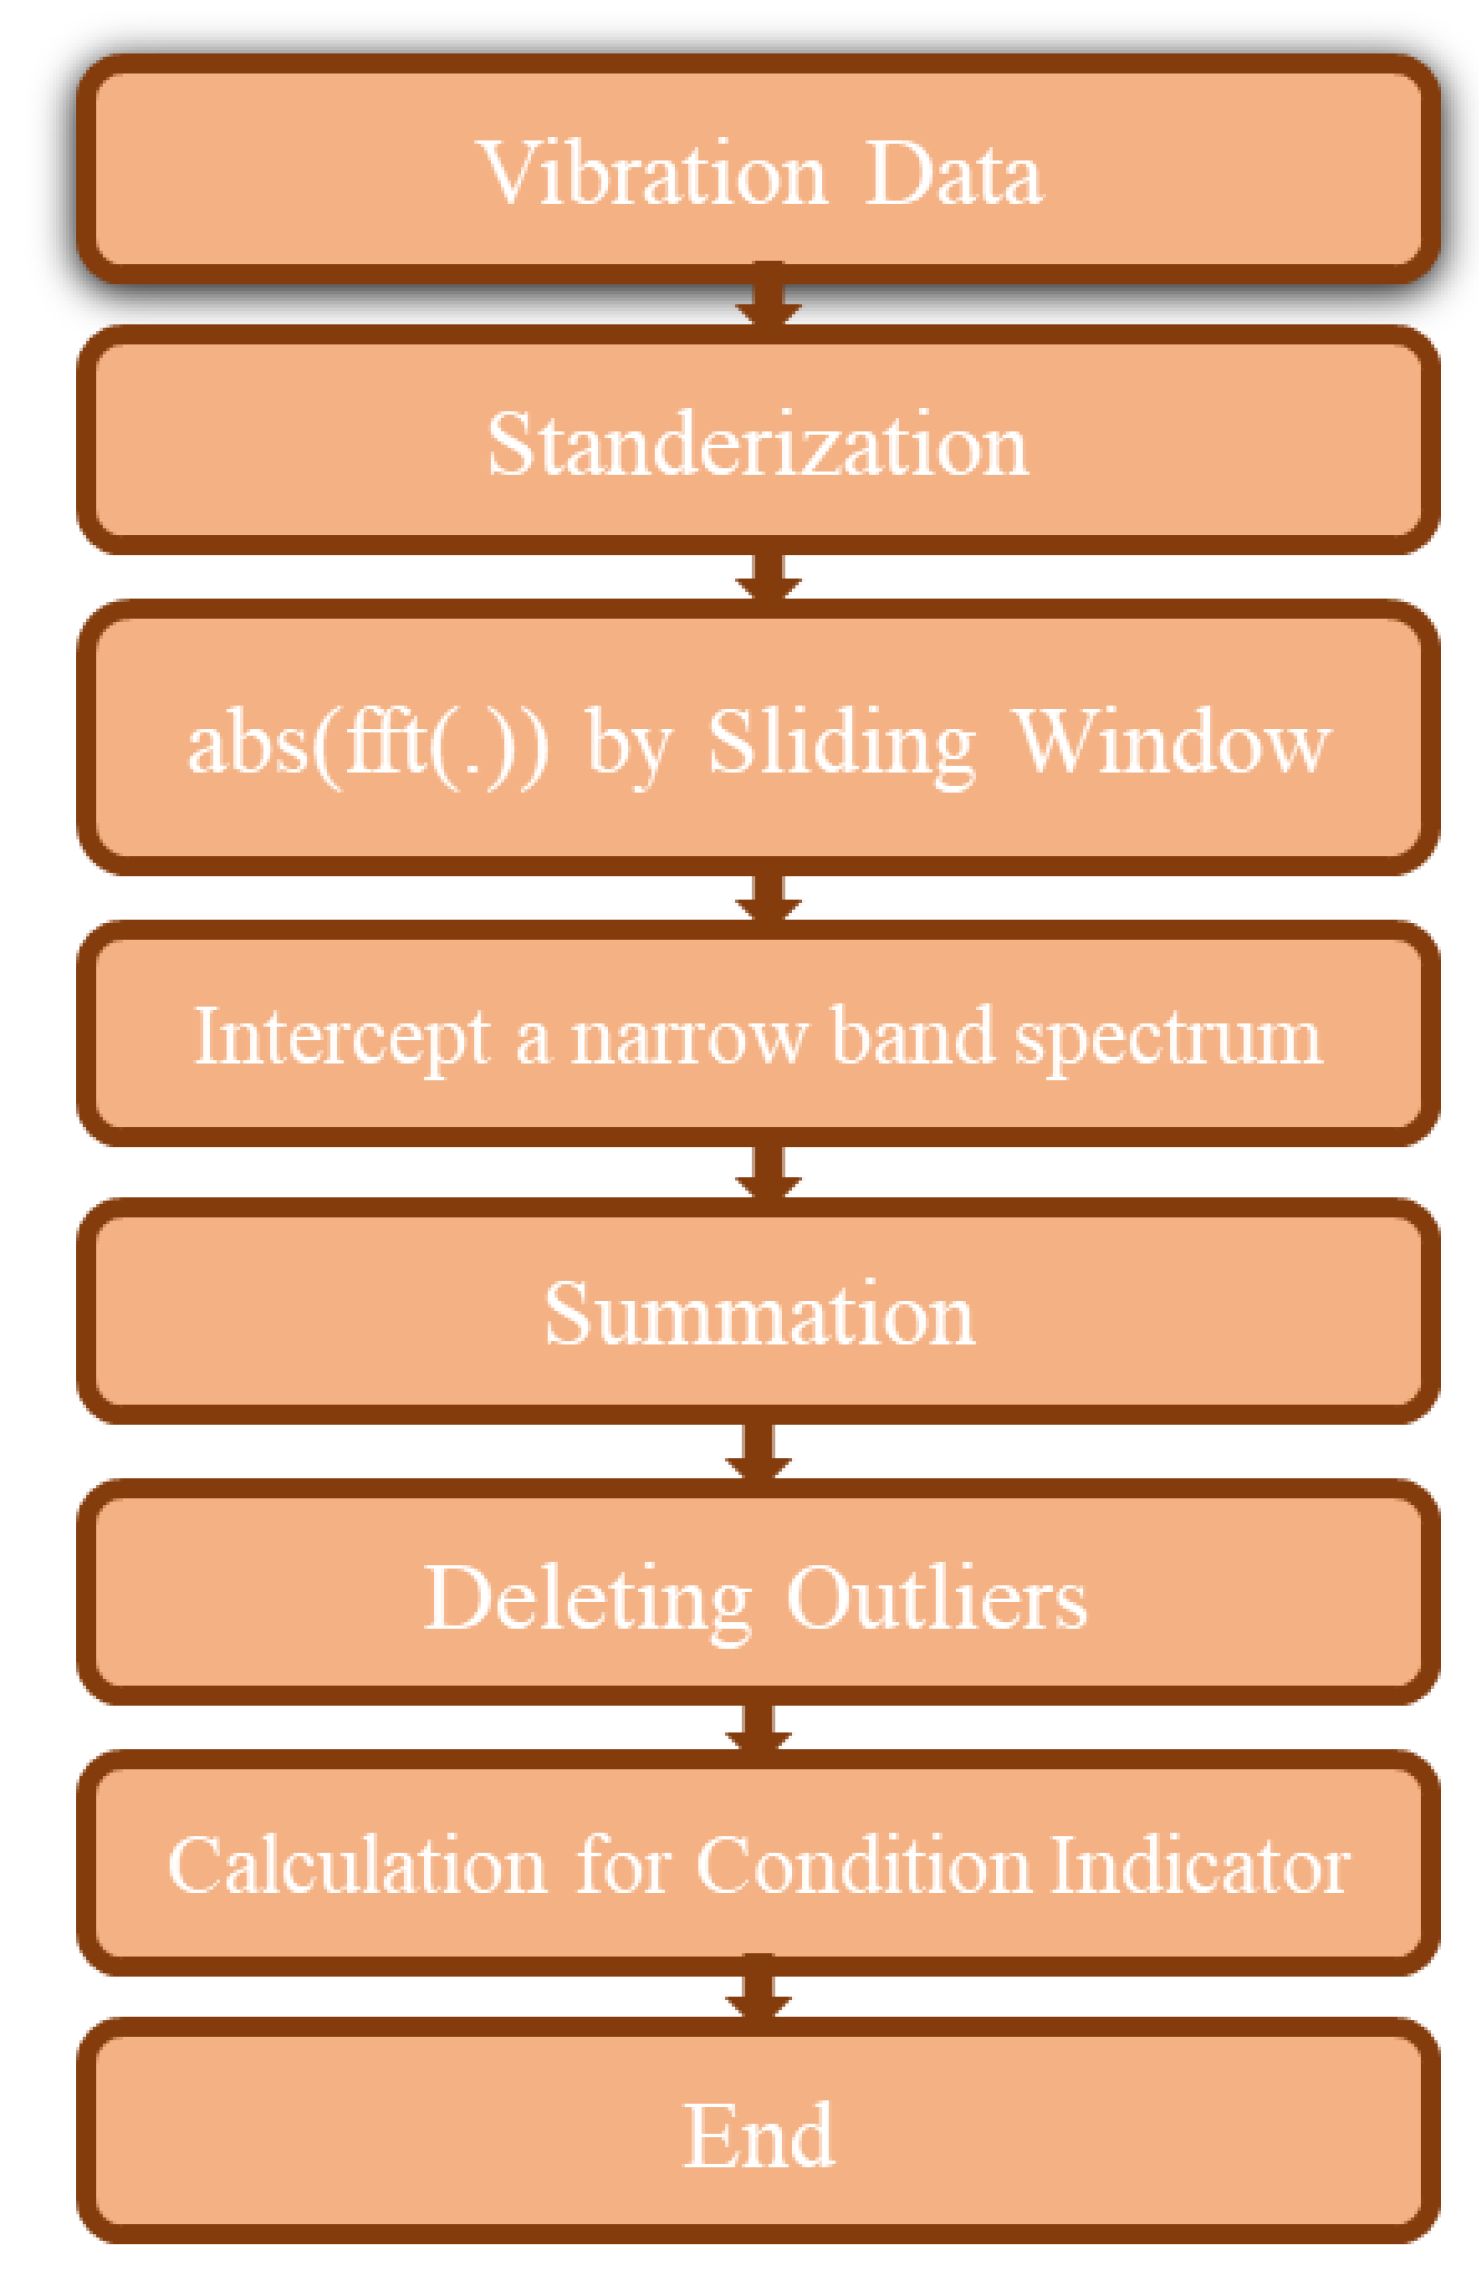
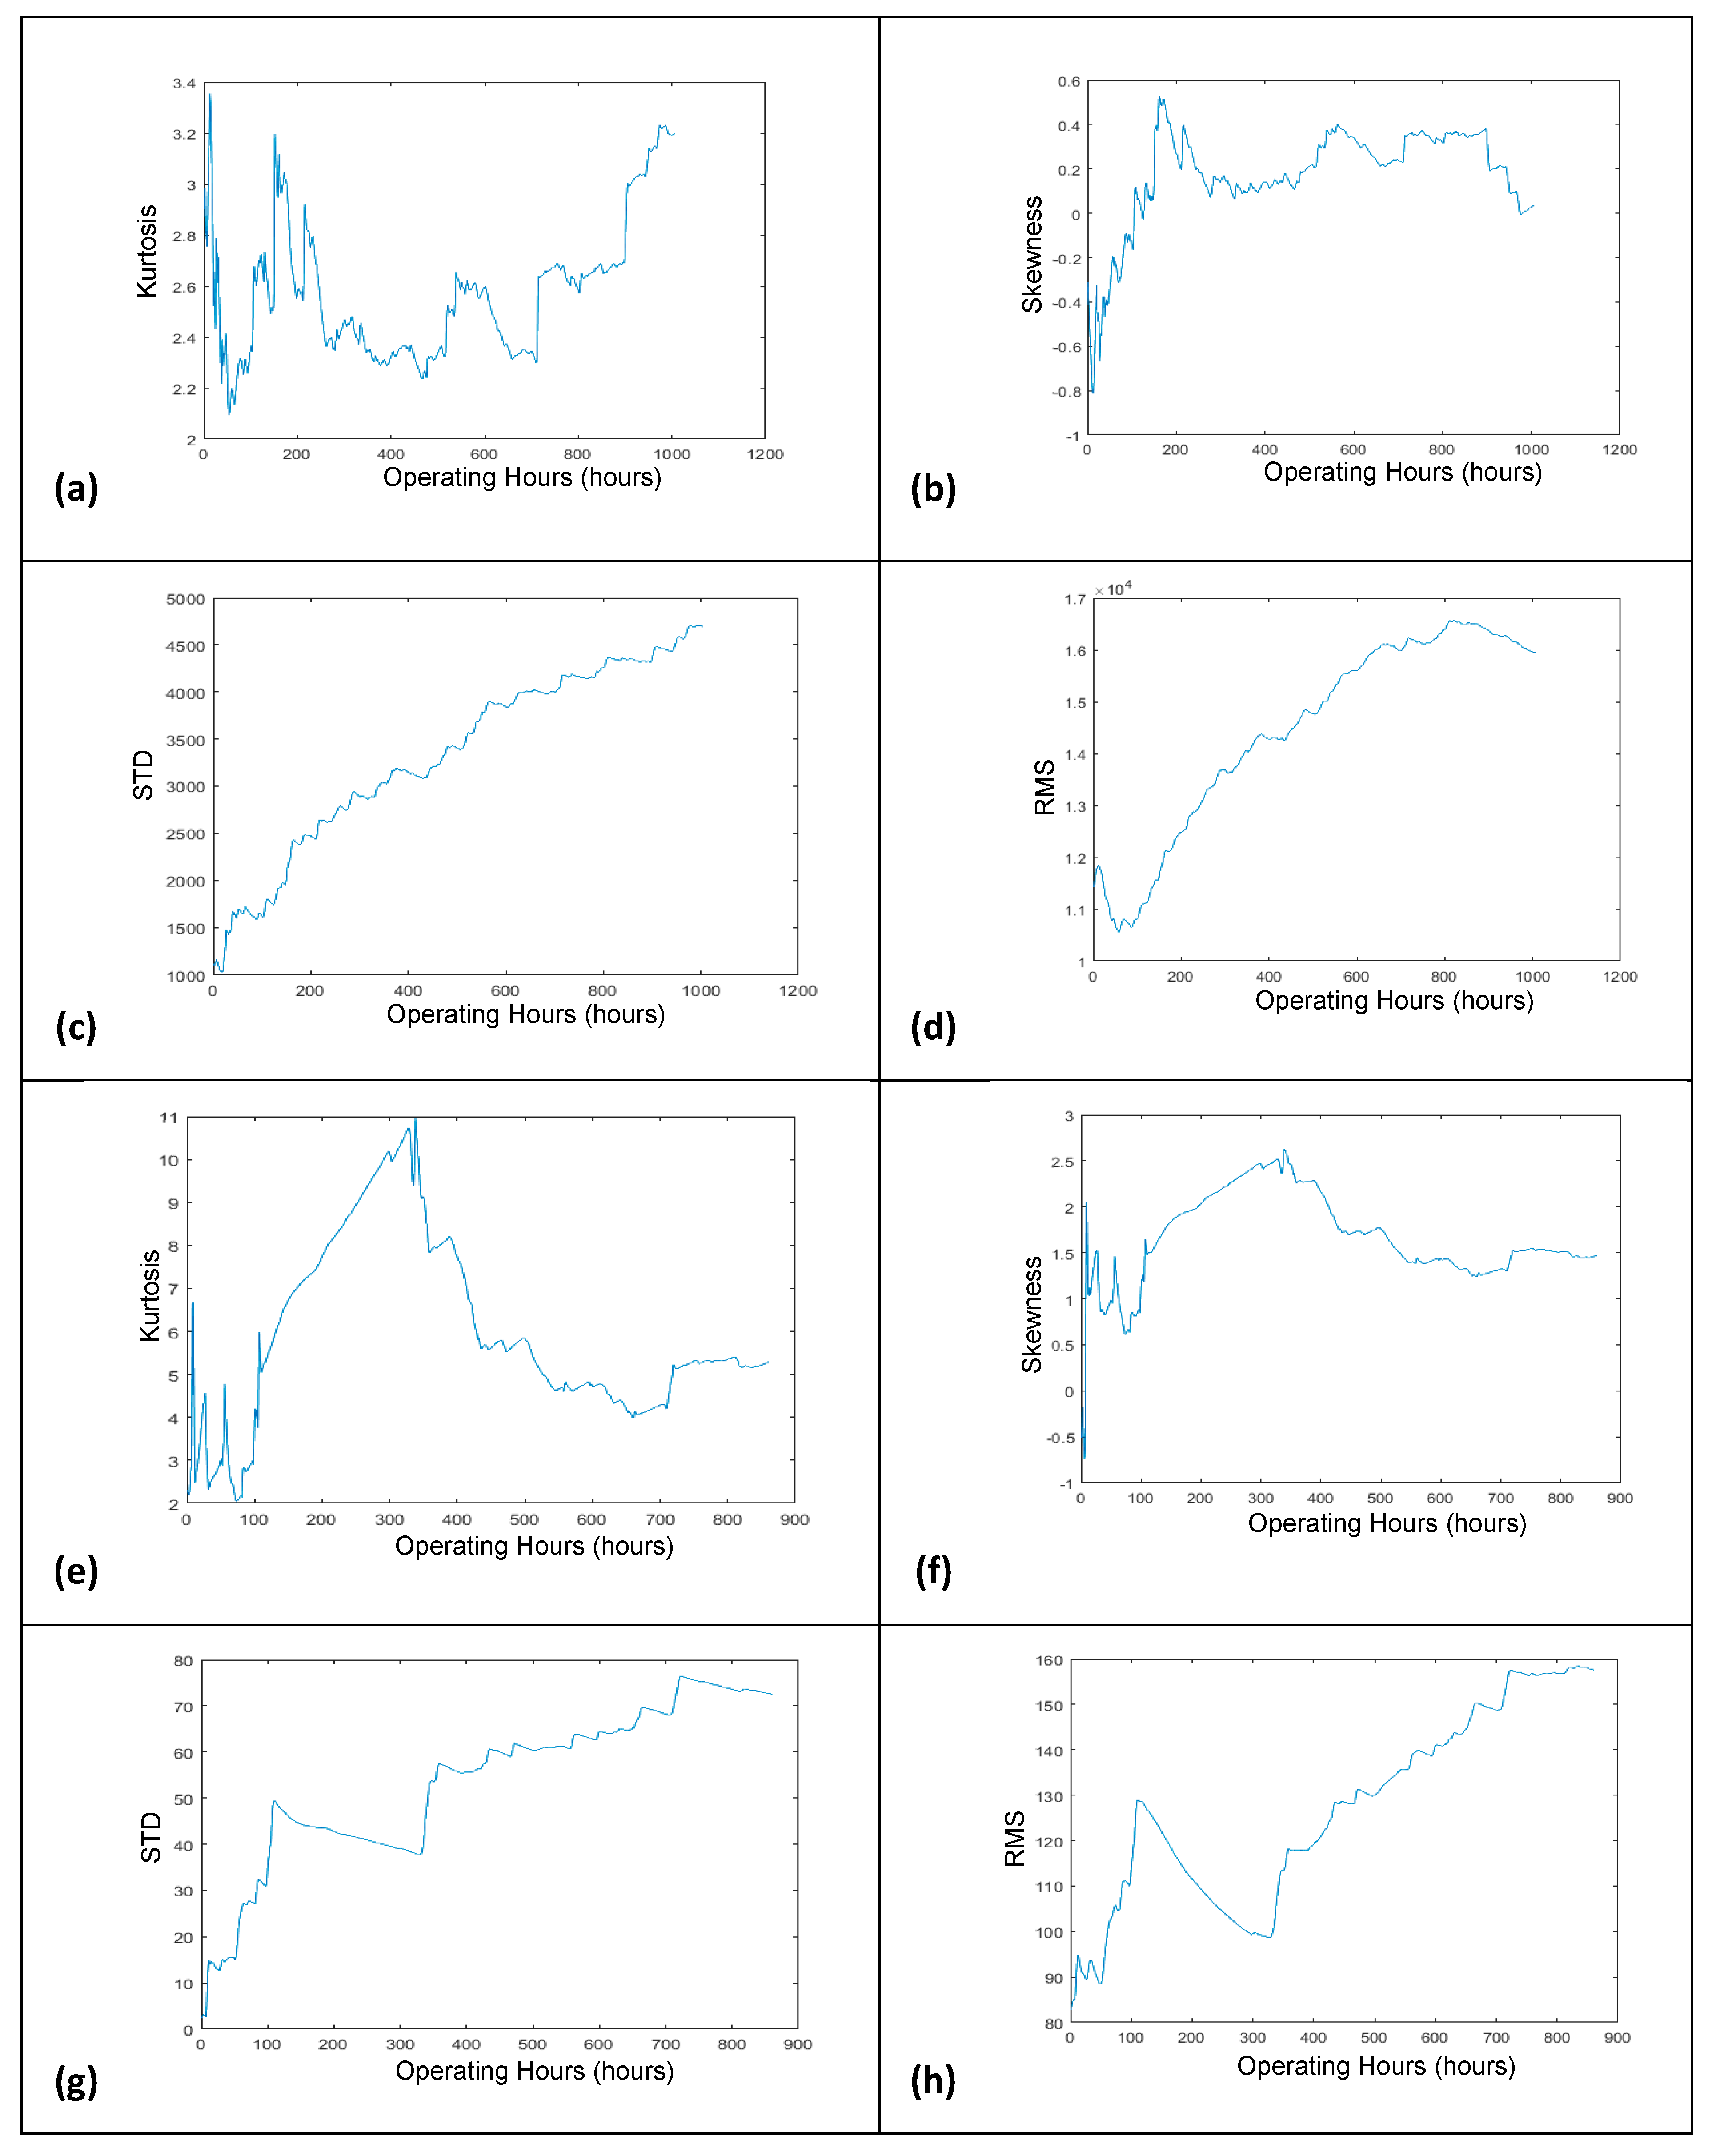
2.2. Development of Vibration-Based Degradation Trends
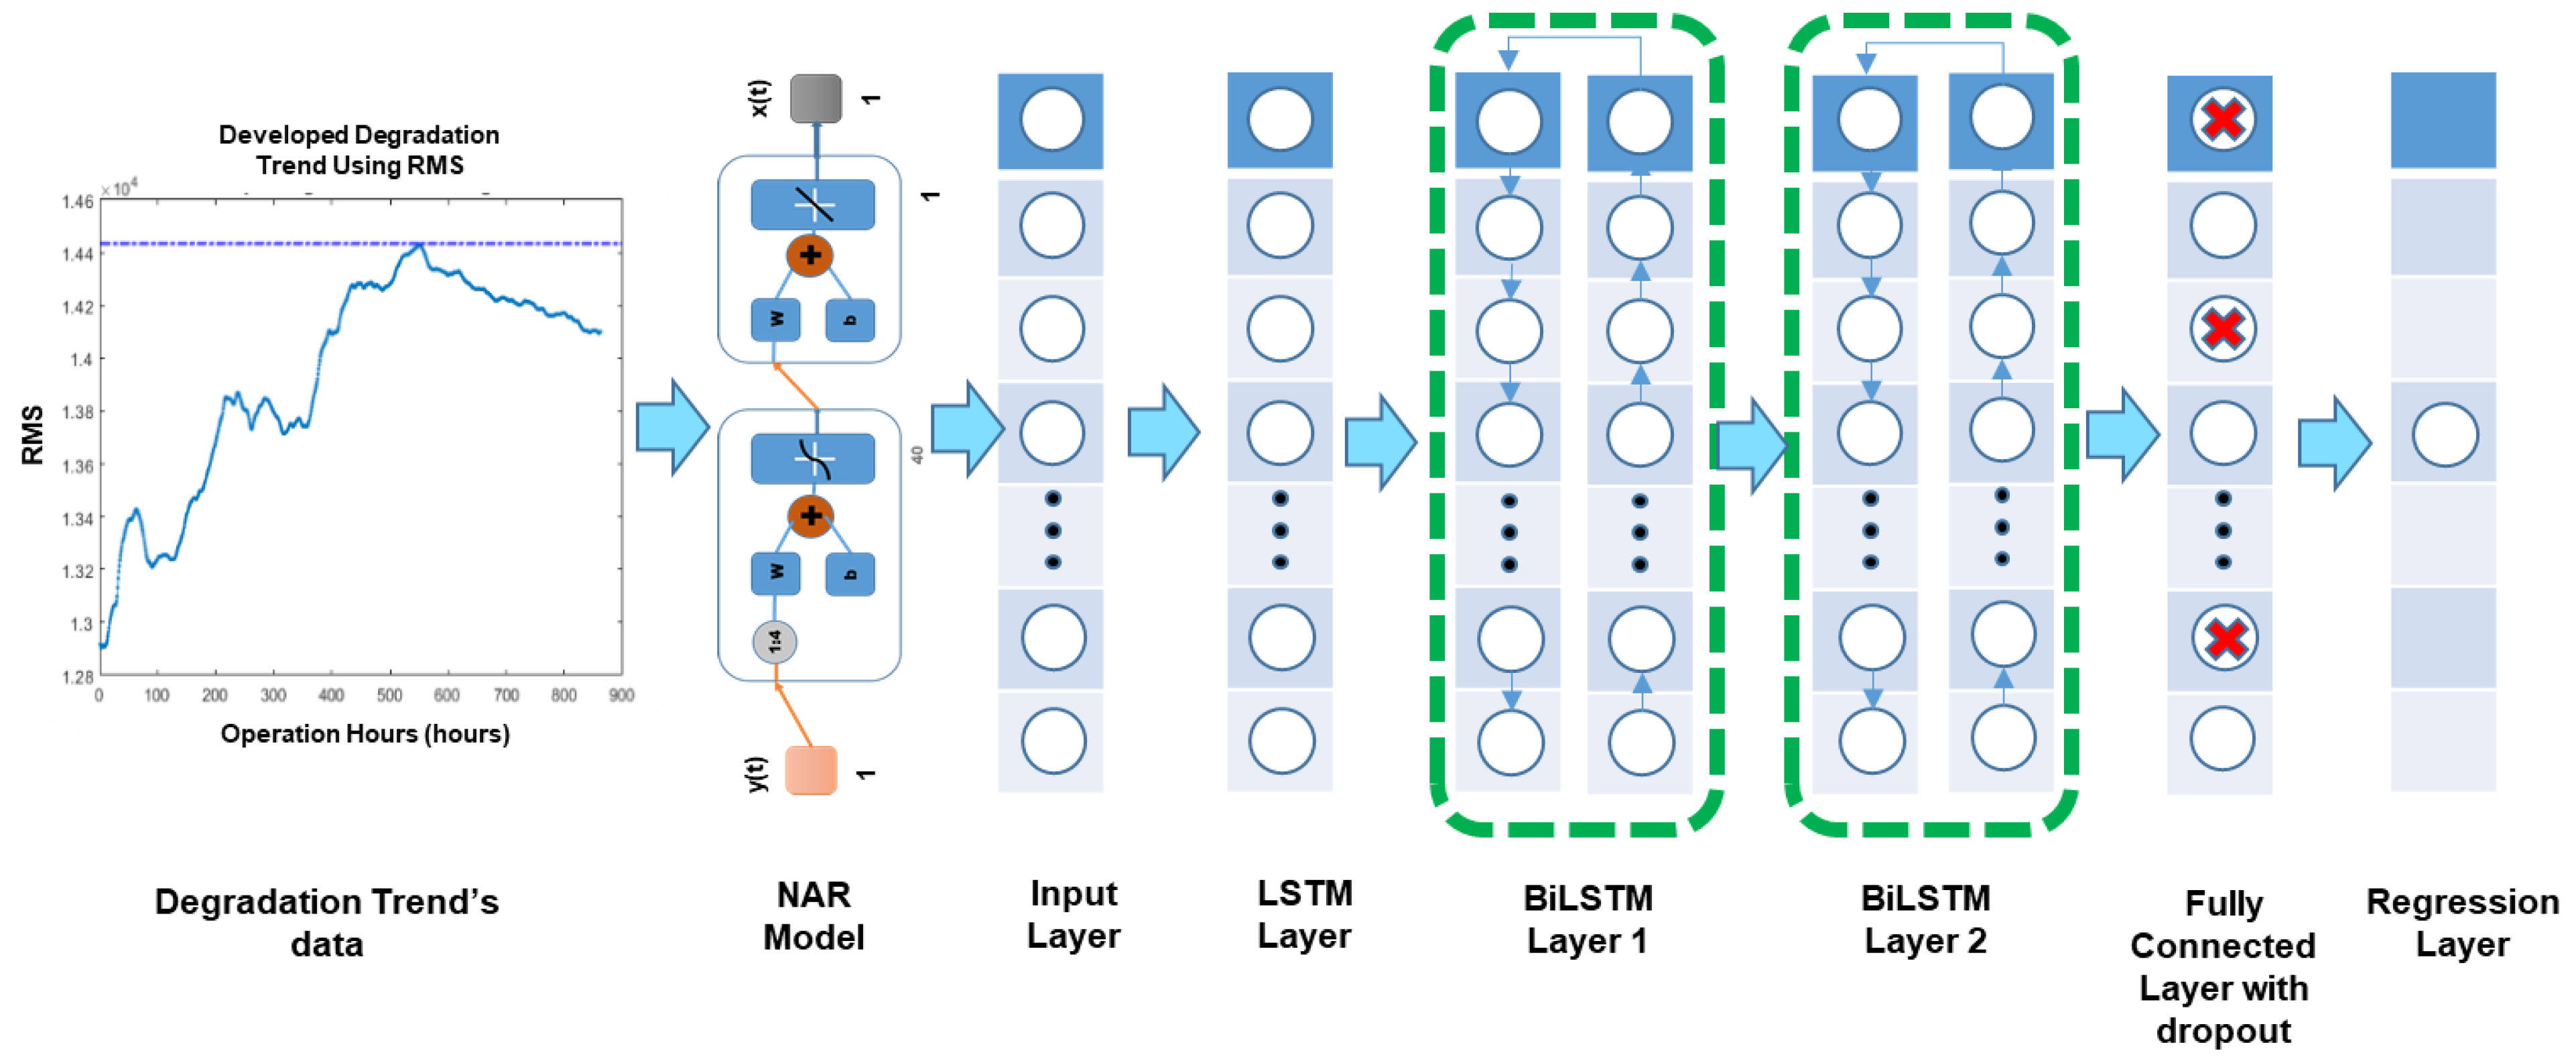
2.3. Design and the Working Mechanism of the Developed Model
3. Results and Discussion
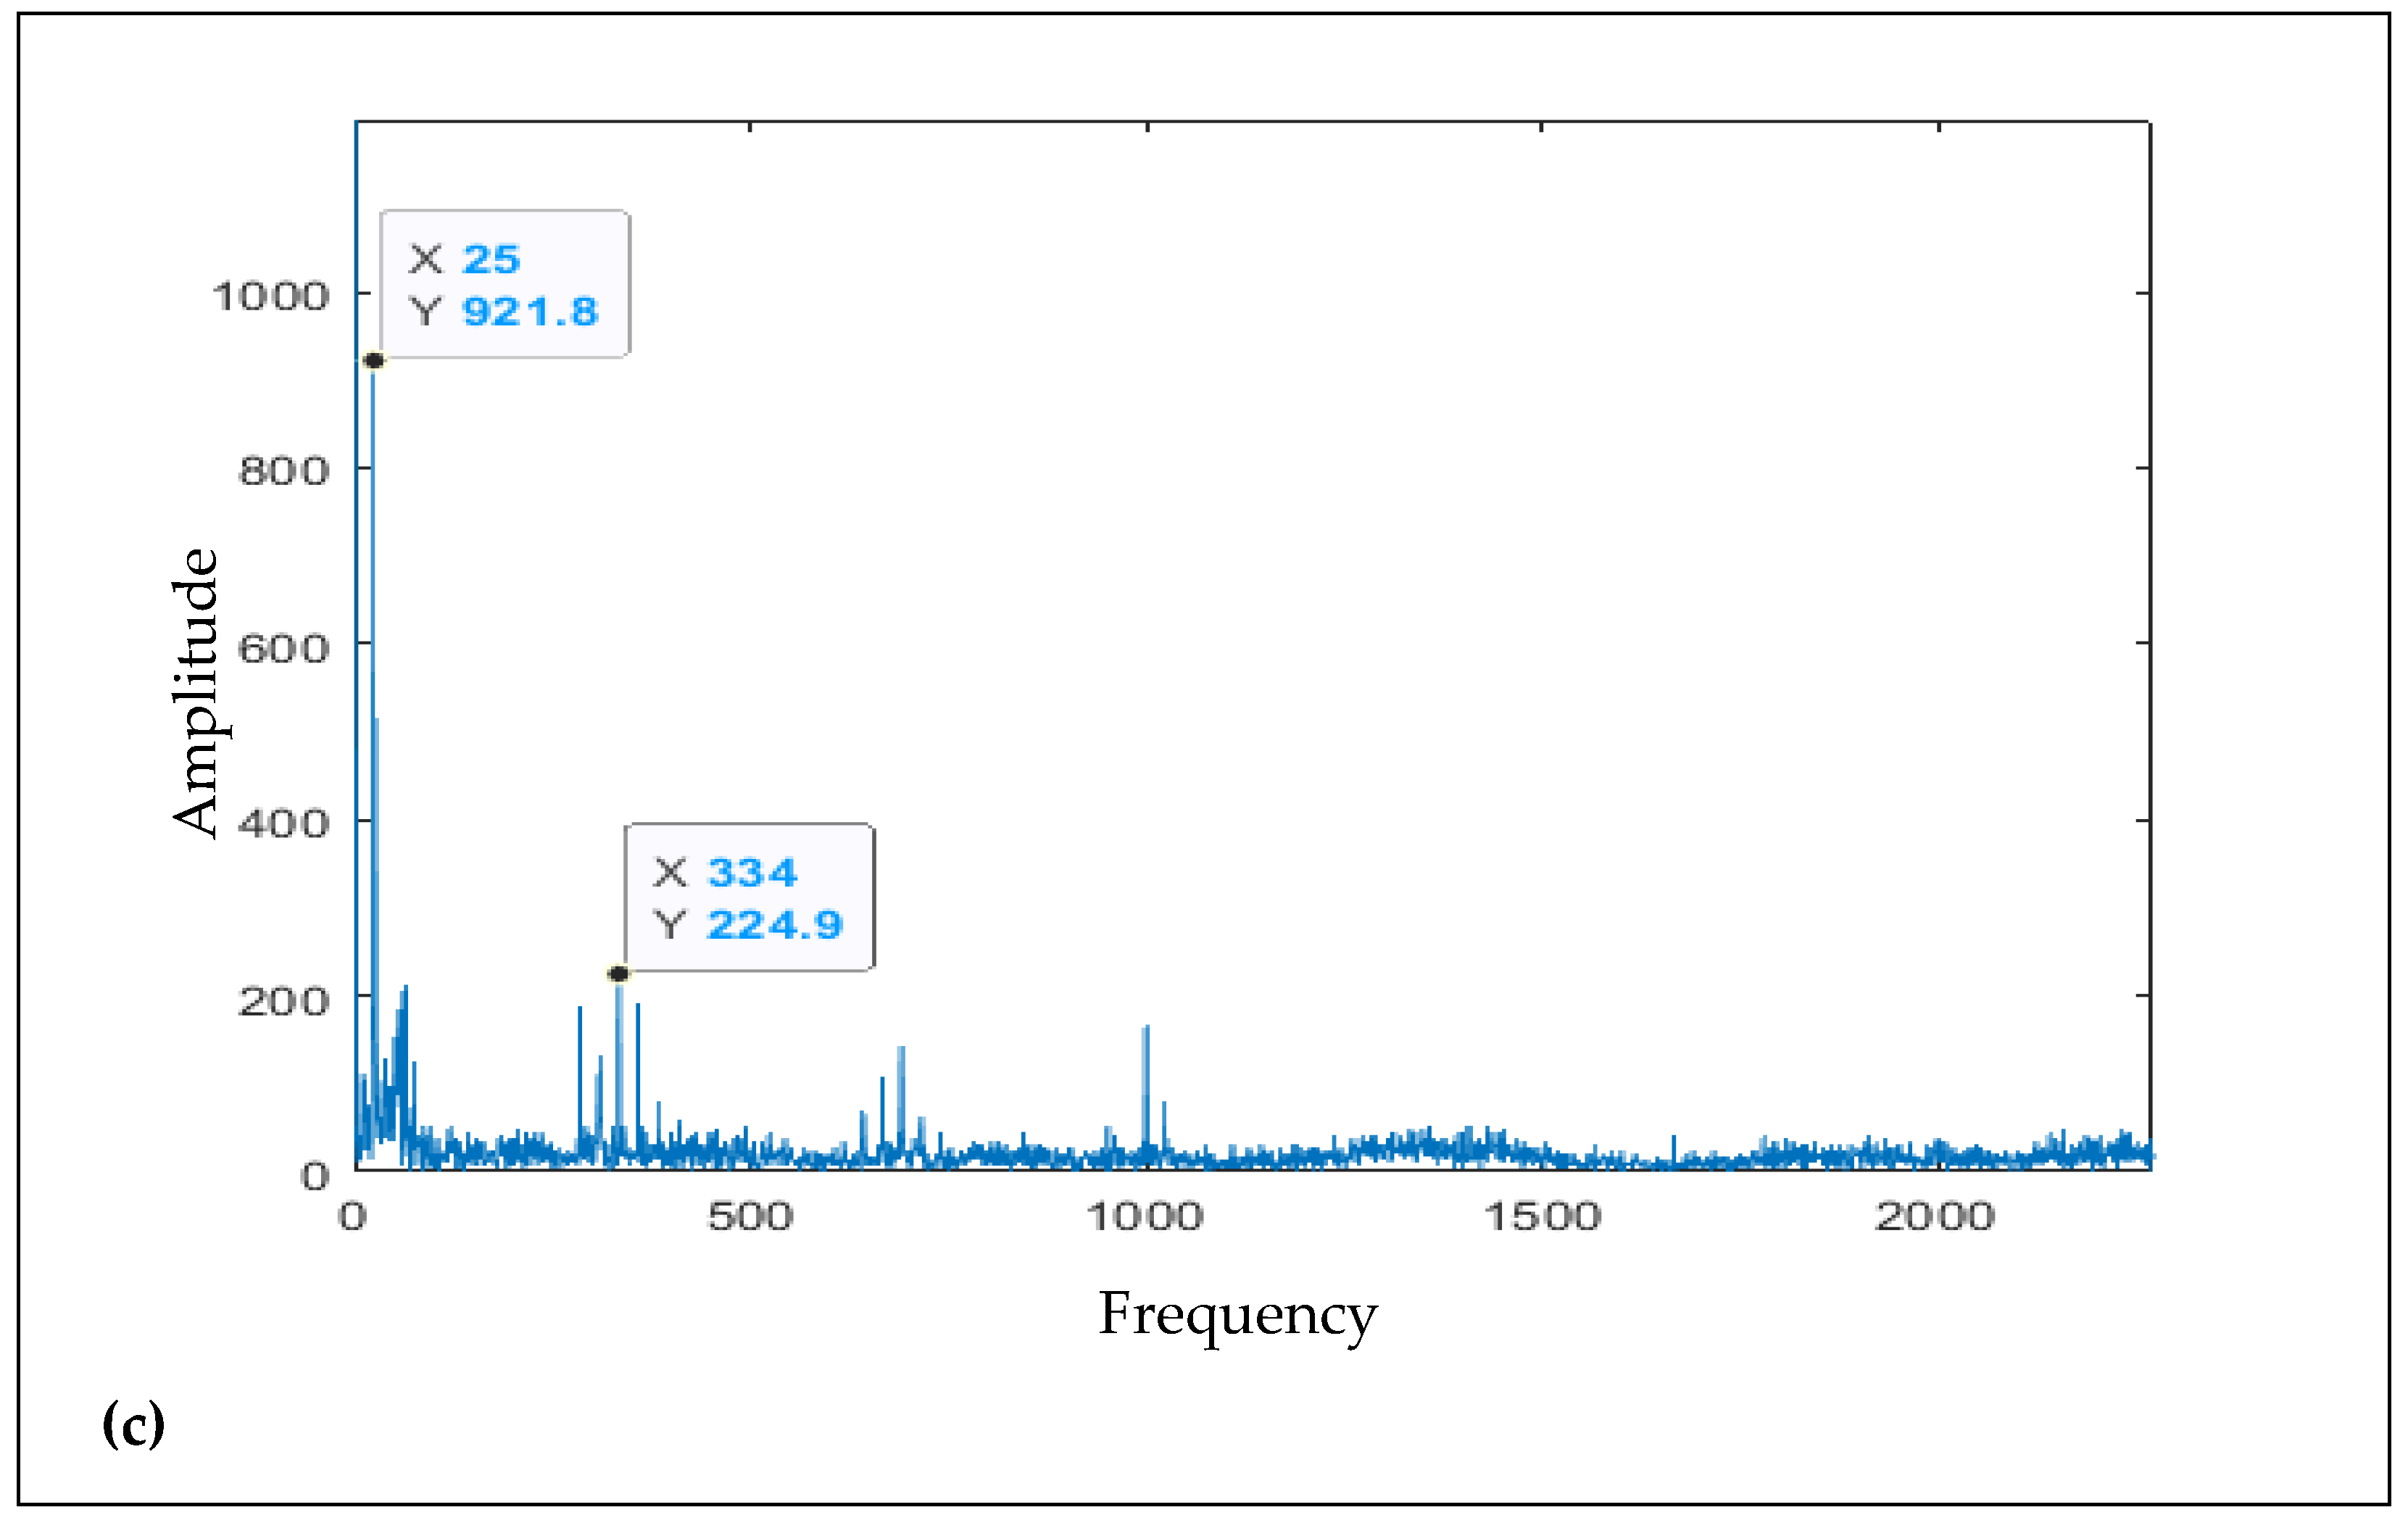
3.1. Validation of the Developed Methodology Using Other Channels
3.2. Validation of the Developed Methodology Using C-MAPSS Dataset
4. Conclusions
- (I)
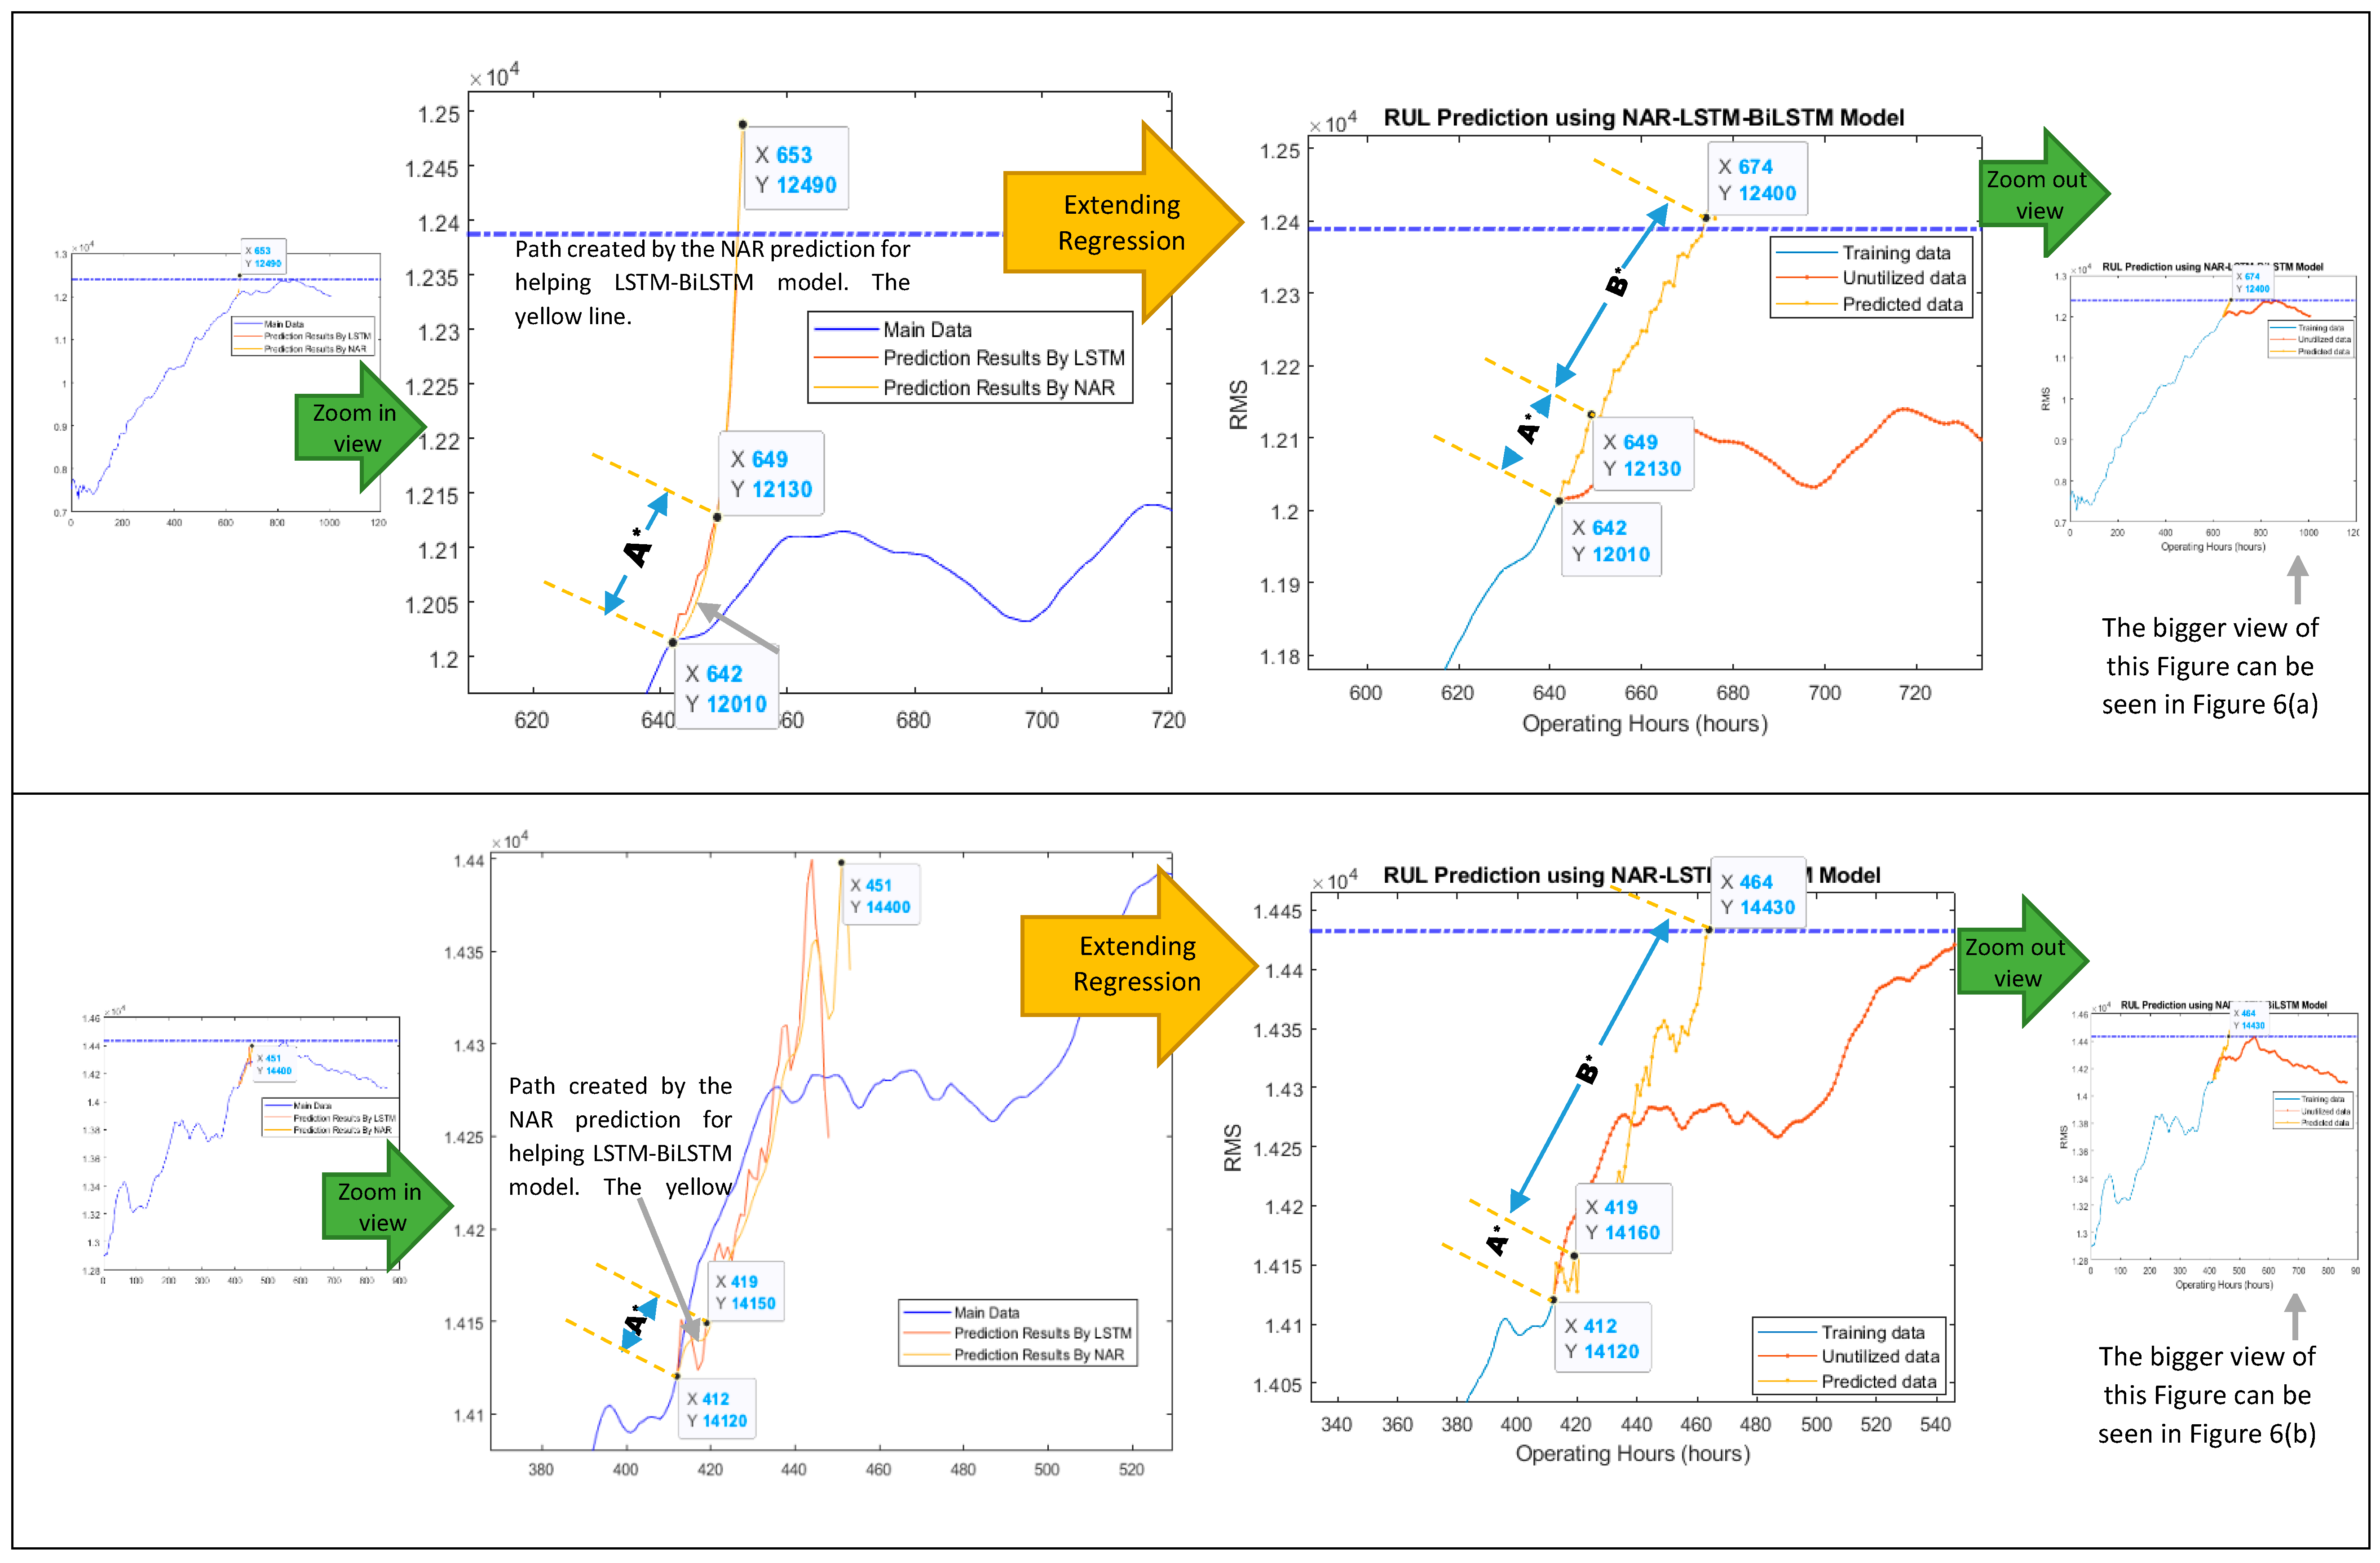
- Initially, the data was analyzed and, an FFT-based method that can produce the performance degradation trends of the monitored slurry pumps was presented. Then, the architecture of a novel hybrid NAR-LSTM model for predicting the RUL of the deteriorating slurry pumps was designed. Since the NAR model has an exploding gradient problem while the LSTM network is slow, along with the problem of wrong progression direction of prediction points, the proposed model was developed, which took advantage of (i) the fast simulation speed of the NAR model for getting a correct direction, i.e., towards the threshold line and (ii) long term memory power of the LSTM-BiLSTM network for avoiding exploding gradient problem. Initial prediction points of the NAR model were utilized as the “path to be followed” by the LSTM-BiLSTM model for providing its own prediction points, which were ultimately meeting the threshold line. The RUL prediction results yielded by the developed model also dominated over the results generated by the other online RUL prediction techniques.
- (II)
- Existing RUL prediction models available in the literature are only working for the slurry pumps, which have very smooth degradation trends. The developed model is a robust model which is predicting the RUL of the slurry pumps satisfactorily either the degradation trend is progressing in a smooth way, or it has many deep crest and trough-like structures. Similarly, the existing methods are only predicting the overall RUL, while the developed model is also estimating the short-term RULs along with the overall RUL of the slurry pumps with acceptable accuracy.
- (III)
- This research has also reflected a novel aspect and usage of the C-MAPSS dataset for predicting the online RULs of the individual turbofan jet engines via utilizing only their run to prior failure data. It is anticipated that if more amount of data like 80% or 90% of degradation trend’s data will be utilized for training of the developed model, the results will be more accurate. However, at the same time, it will also increase the risk of the breakdown of the considered slurry pump or engine.
Supplementary Materials
Author Contributions
Funding
Data Availability Statement
Acknowledgments
Conflicts of Interest
References
- Zhao, X.; Zuo, M.J.; Patel, T.H. Generating an indicator for pump impeller damage using half and full spectra, fuzzy preference-based rough sets and PCA. Meas. Sci. Technol. 2012, 23, 045607. [Google Scholar] [CrossRef]
- Jinfei, H. Effective Fault Diagnostic and Prognostic Methods Tailor-Made for Field Operating Oil-Sand Pumps; City University of Hong Kong: Hong Kong, China, 2014. [Google Scholar]
- Tse, P.W.; Shen, C. Remaining useful life estimation of slurry pumps using the health status probability estimation provided by support vector machine. Lect. Notes Mech. Eng. 2015, 19, 87–98. [Google Scholar] [CrossRef]
- Tse, Y.L.; Cholette, M.E.; Tse, P.W. A multi-sensor approach to remaining useful life estimation for a slurry pump. Meas. J. Int. Meas. Confed. 2019, 139, 140–151. [Google Scholar] [CrossRef]
- Hu, J.; Tse, P.W. A relevance vector machine-based approach with application to oil sand pump prognostics. Sensors 2013, 13, 12663–12686. [Google Scholar] [CrossRef] [PubMed] [Green Version]
- Wang, D.; Tse, P.W. Prognostics of slurry pumps based on a moving-average wear degradation index and a general sequential Monte Carlo method. Mech. Syst. Signal Process. 2015, 56, 213–229. [Google Scholar] [CrossRef]
- Bross, S.; Addie, G. Prediction of impeller nose wear behaviour in centrifugal slurry pumps. Exp. Therm. Fluid Sci. 2002, 26, 841–849. [Google Scholar] [CrossRef]
- Tse, P.W.; Wang, D. Enhancing the abilities in assessing slurry pumps’ performance degradation and estimating their remaining useful lives by using captured vibration signals. J. Vib. Control. 2017, 23, 1925–1937. [Google Scholar] [CrossRef]
- Sun, S.; Tse, P.W.; Tse, Y.L. An enhanced factor analysis of performance degradation assessment on slurry pump impellers. Shock Vib. 2017, 2017, 1524840. [Google Scholar] [CrossRef]
- Kisvari, A.; Lin, Z.; Liu, X. Wind power forecasting—A data-driven method along with gated recurrent neural network. Renew. Energy 2021, 163, 1895–1909. [Google Scholar] [CrossRef]
- Ma, J.; Ding, Y.; Cheng, J.C.P.; Tan, Y.; Gan, V.J.L.; Zhang, J. Analyzing the leading causes of traffic fatalities using XGBoost and grid-based analysis: A city management perspective. IEEE Access 2019, 7, 148059–148072. [Google Scholar] [CrossRef]
- Cheng, H.; Ding, X.; Zhou, W.; Ding, R. A hybrid electricity price forecasting model with Bayesian optimization for German energy exchange. Int. J. Electr. Power Energy Syst. 2019, 110, 653–666. [Google Scholar] [CrossRef]
- Chen, Z.; Xia, T.; Li, Y.; Pan, E. A hybrid prognostic method based on gated recurrent unit network and an adaptive Wiener process model considering measurement errors. Mech. Syst. Signal Process. 2021, 158, 107785. [Google Scholar] [CrossRef]
- Ibrahim, M.; Jemei, S.; Wimmer, G.; Hissel, D. Nonlinear autoregressive neural network in an energy management strategy for battery/ultra-capacitor hybrid electrical vehicles. Electr. Power Syst. Res. 2016, 136, 262–269. [Google Scholar] [CrossRef]
- Goswami, S. Building energy prediction using artificial neural networks (LSTM). Am. Soc. Mech. Eng. Power Div. Power 2020, 2020, 111718. [Google Scholar] [CrossRef]
- Ellefsen, A.L.; Bjørlykhaug, E.; Æsøy, V.; Ushakov, S.; Zhang, H. Remaining useful life predictions for turbofan engine degradation using semi-supervised deep architecture. Reliab. Eng. Syst. Saf. 2019, 183, 240–251. [Google Scholar] [CrossRef]


| 2014 Datasets | ||||
|---|---|---|---|---|
| Training Data (%) | RUL Predicted (Days) | Actual RUL (Days) | Accuracy of Predicted RUL (%) | |
| Overall RUL | ||||
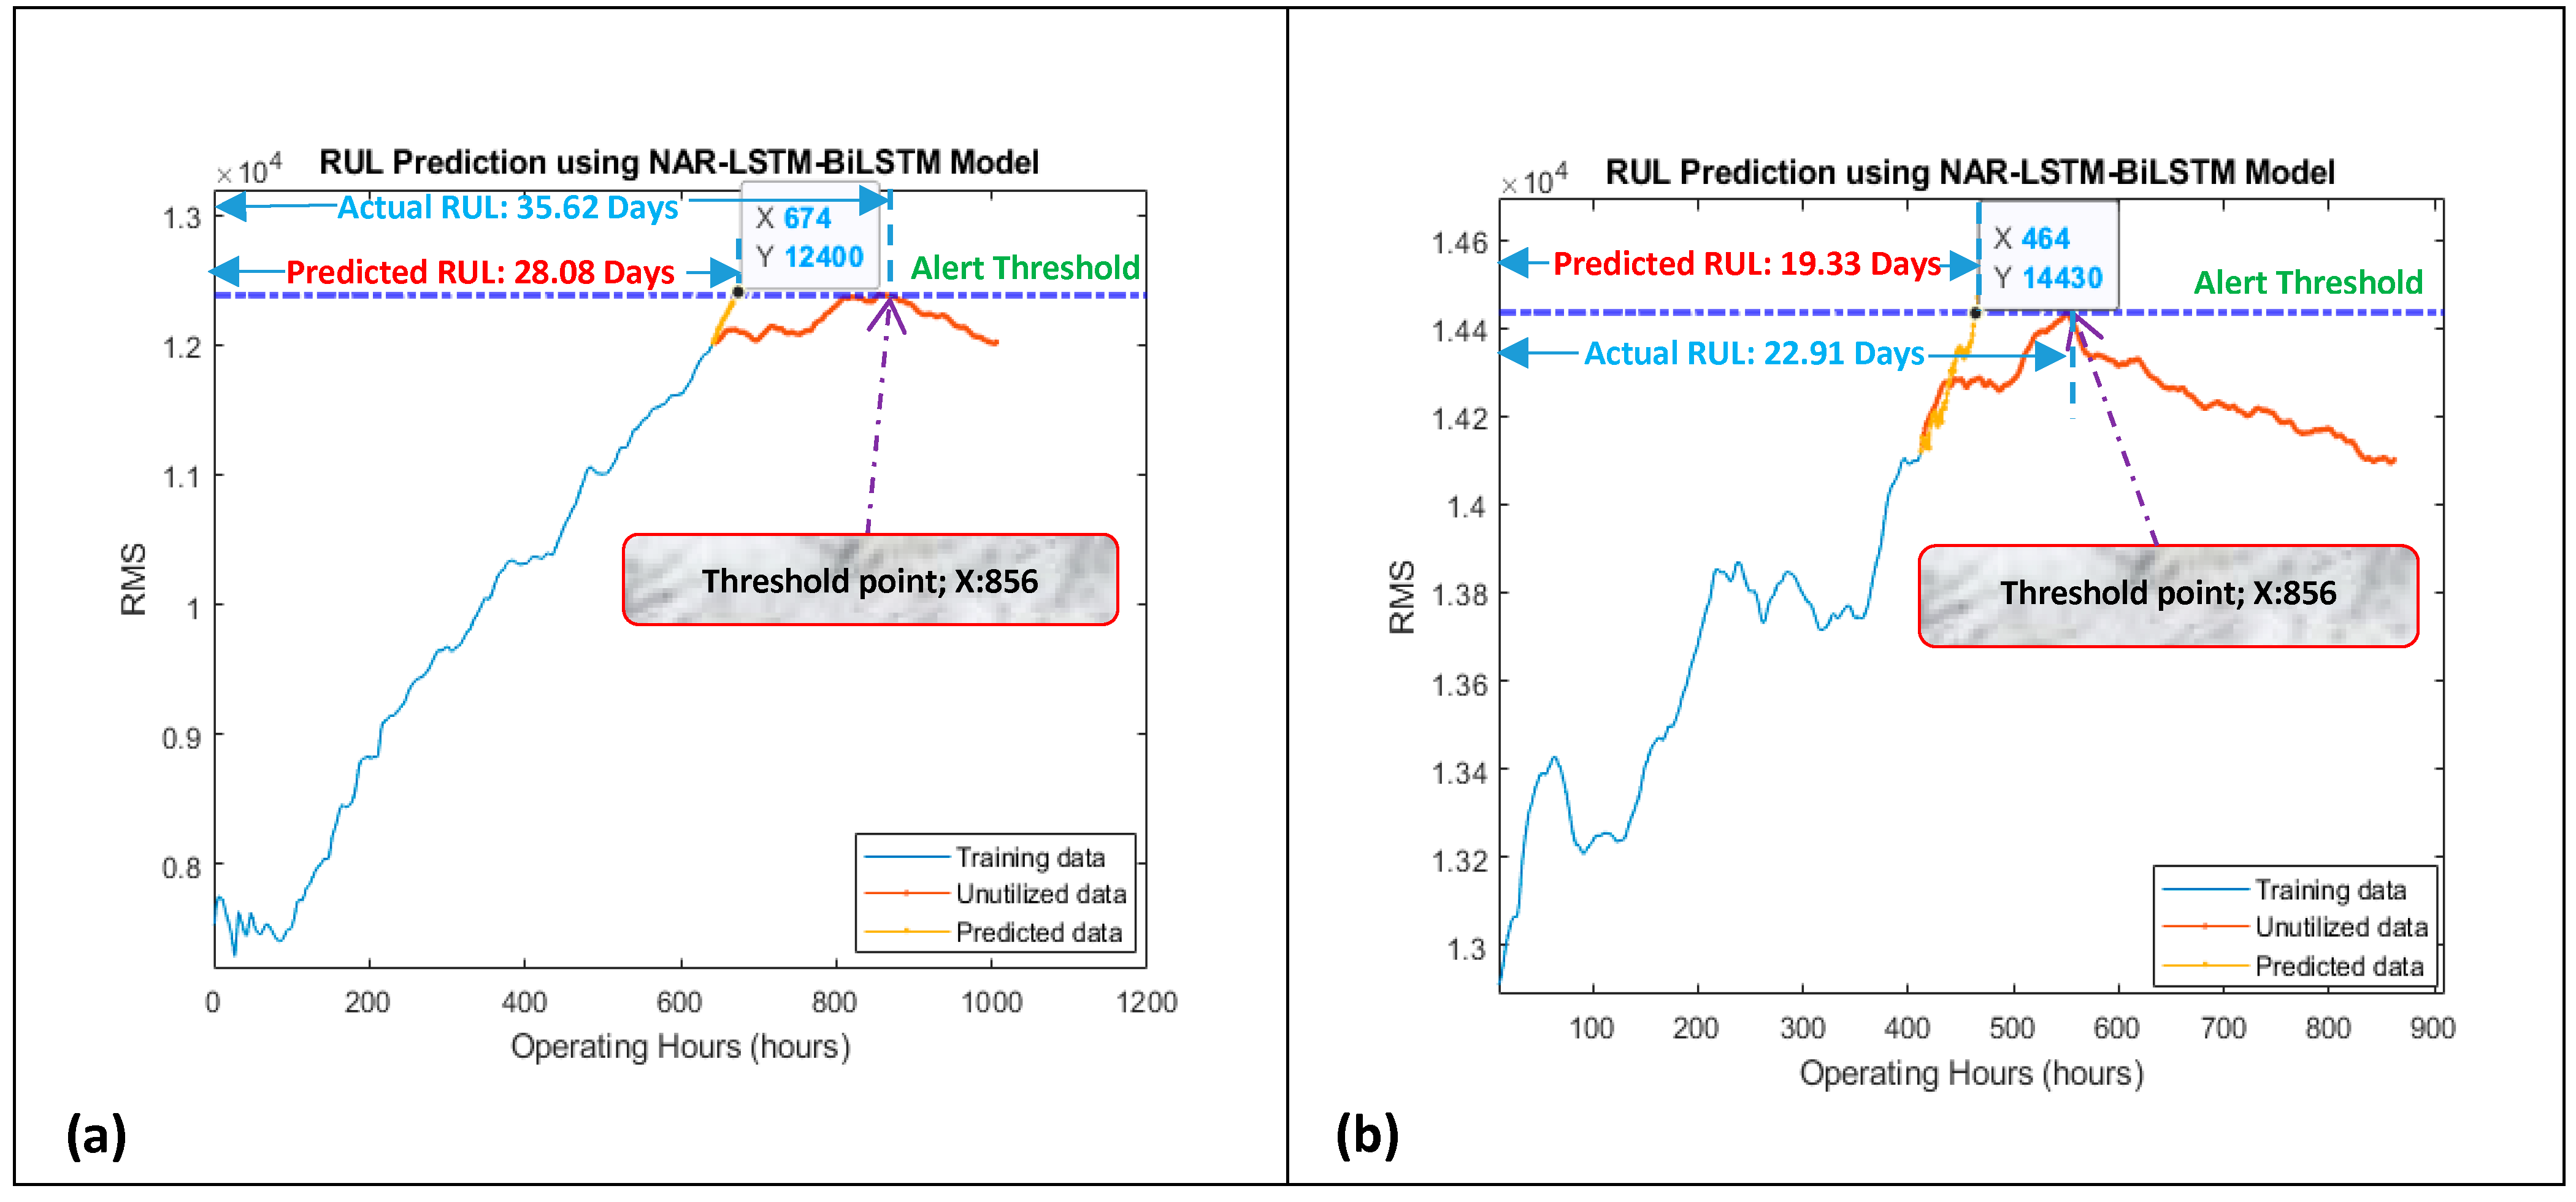
| Proposed Method | 75 | 28.08 | 35.62 | 78.83 |
| NARX | 75 | 27.10 | 35.62 | 76.08 |
| Short-term RUL | ||||
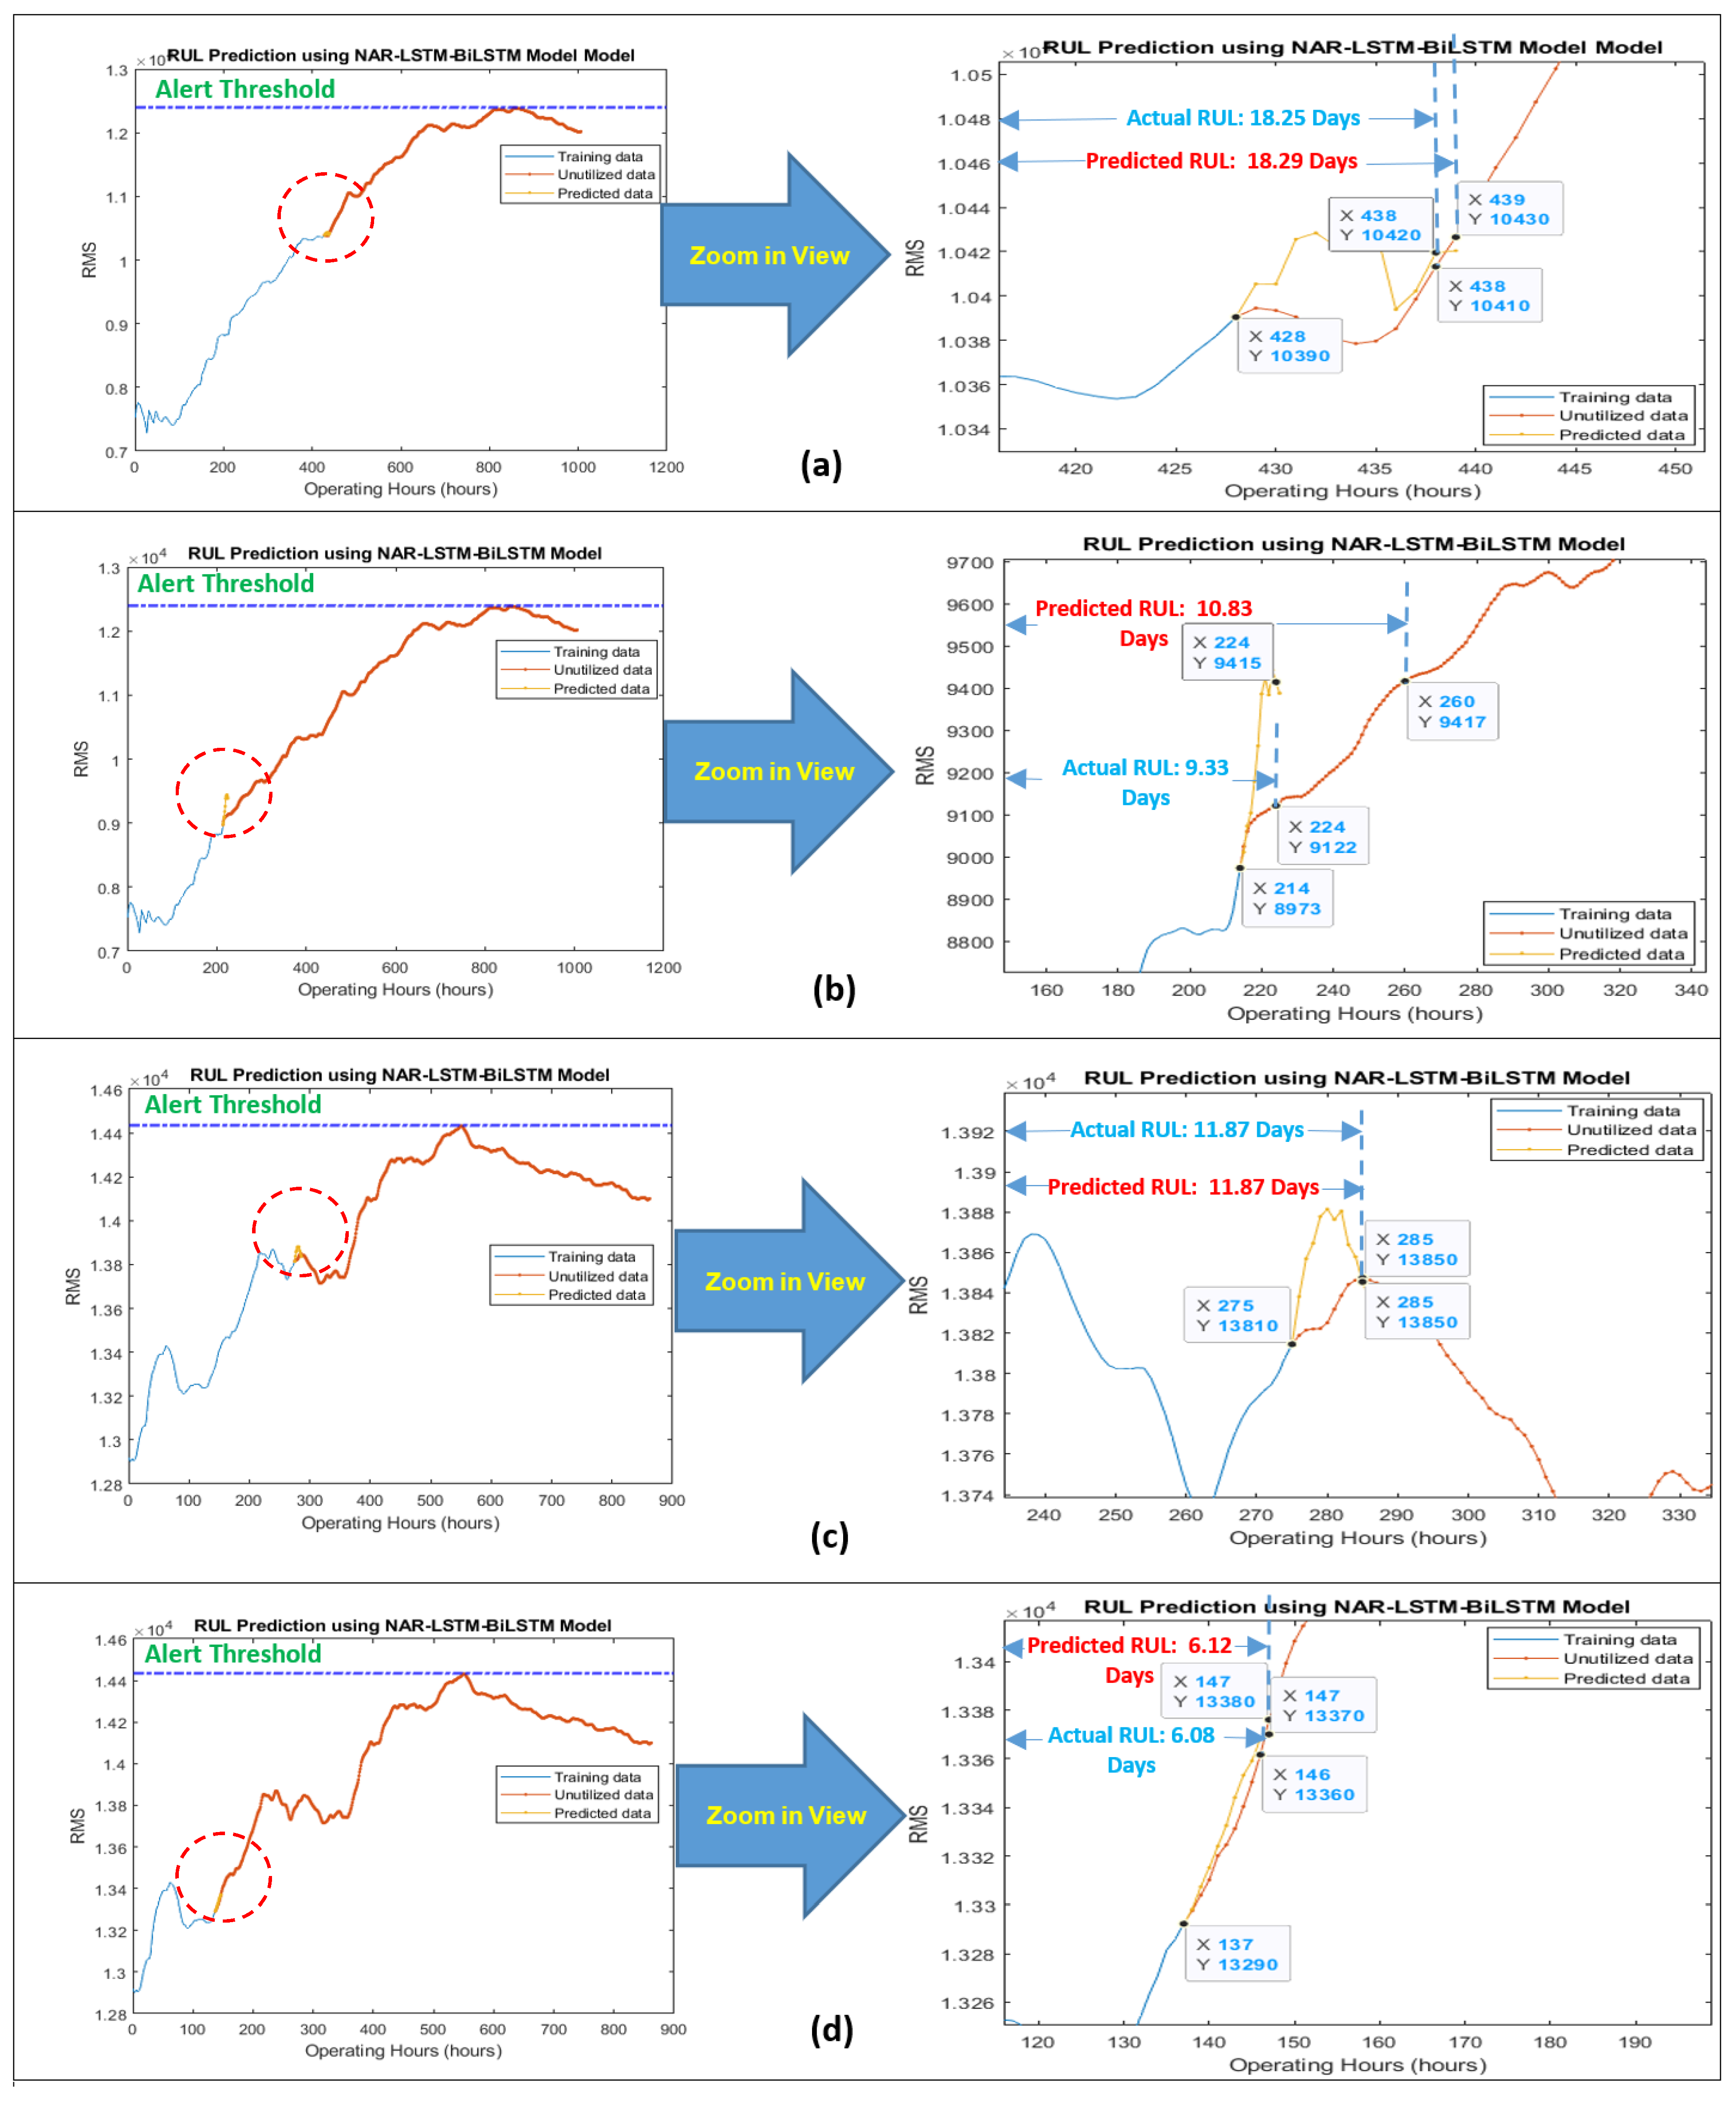
| Proposed Method | 50 | 18.29 | 18.25 | 99.78 |
| NARX | 50 | 17.23 | 18.25 | 94.41 |
| Proposed Method | 25 | 10.83 | 9.33 | 83.92 |
| NARX | 25 | 11.01 | 9.33 | 81.99 |
| 2017 Datasets | ||||
| Overall RUL | ||||
| Proposed Method | 75 | 19.33 | 22.91 | 84.37 |
| NARX | 75 | Not applicable | 22.91 | - |
| Short-term RUL | ||||
| Proposed Method | 50 | 11.87 | 11.87 | 100 |
| NARX | 50 | 11.34 | 11.87 | 95.53 |
| Proposed Method | 25 | 6.12 | 6.08 | 99.34 |
| NARX | 25 | 5.64 | 6.08 | 92.76 |
| 2014 Datasets | ||||
|---|---|---|---|---|
| Training Data (%) | RUL Predicted (Days) | Actual RUL (Days) | Accuracy of Predicted RUL (%) | |
| Overall RUL | ||||
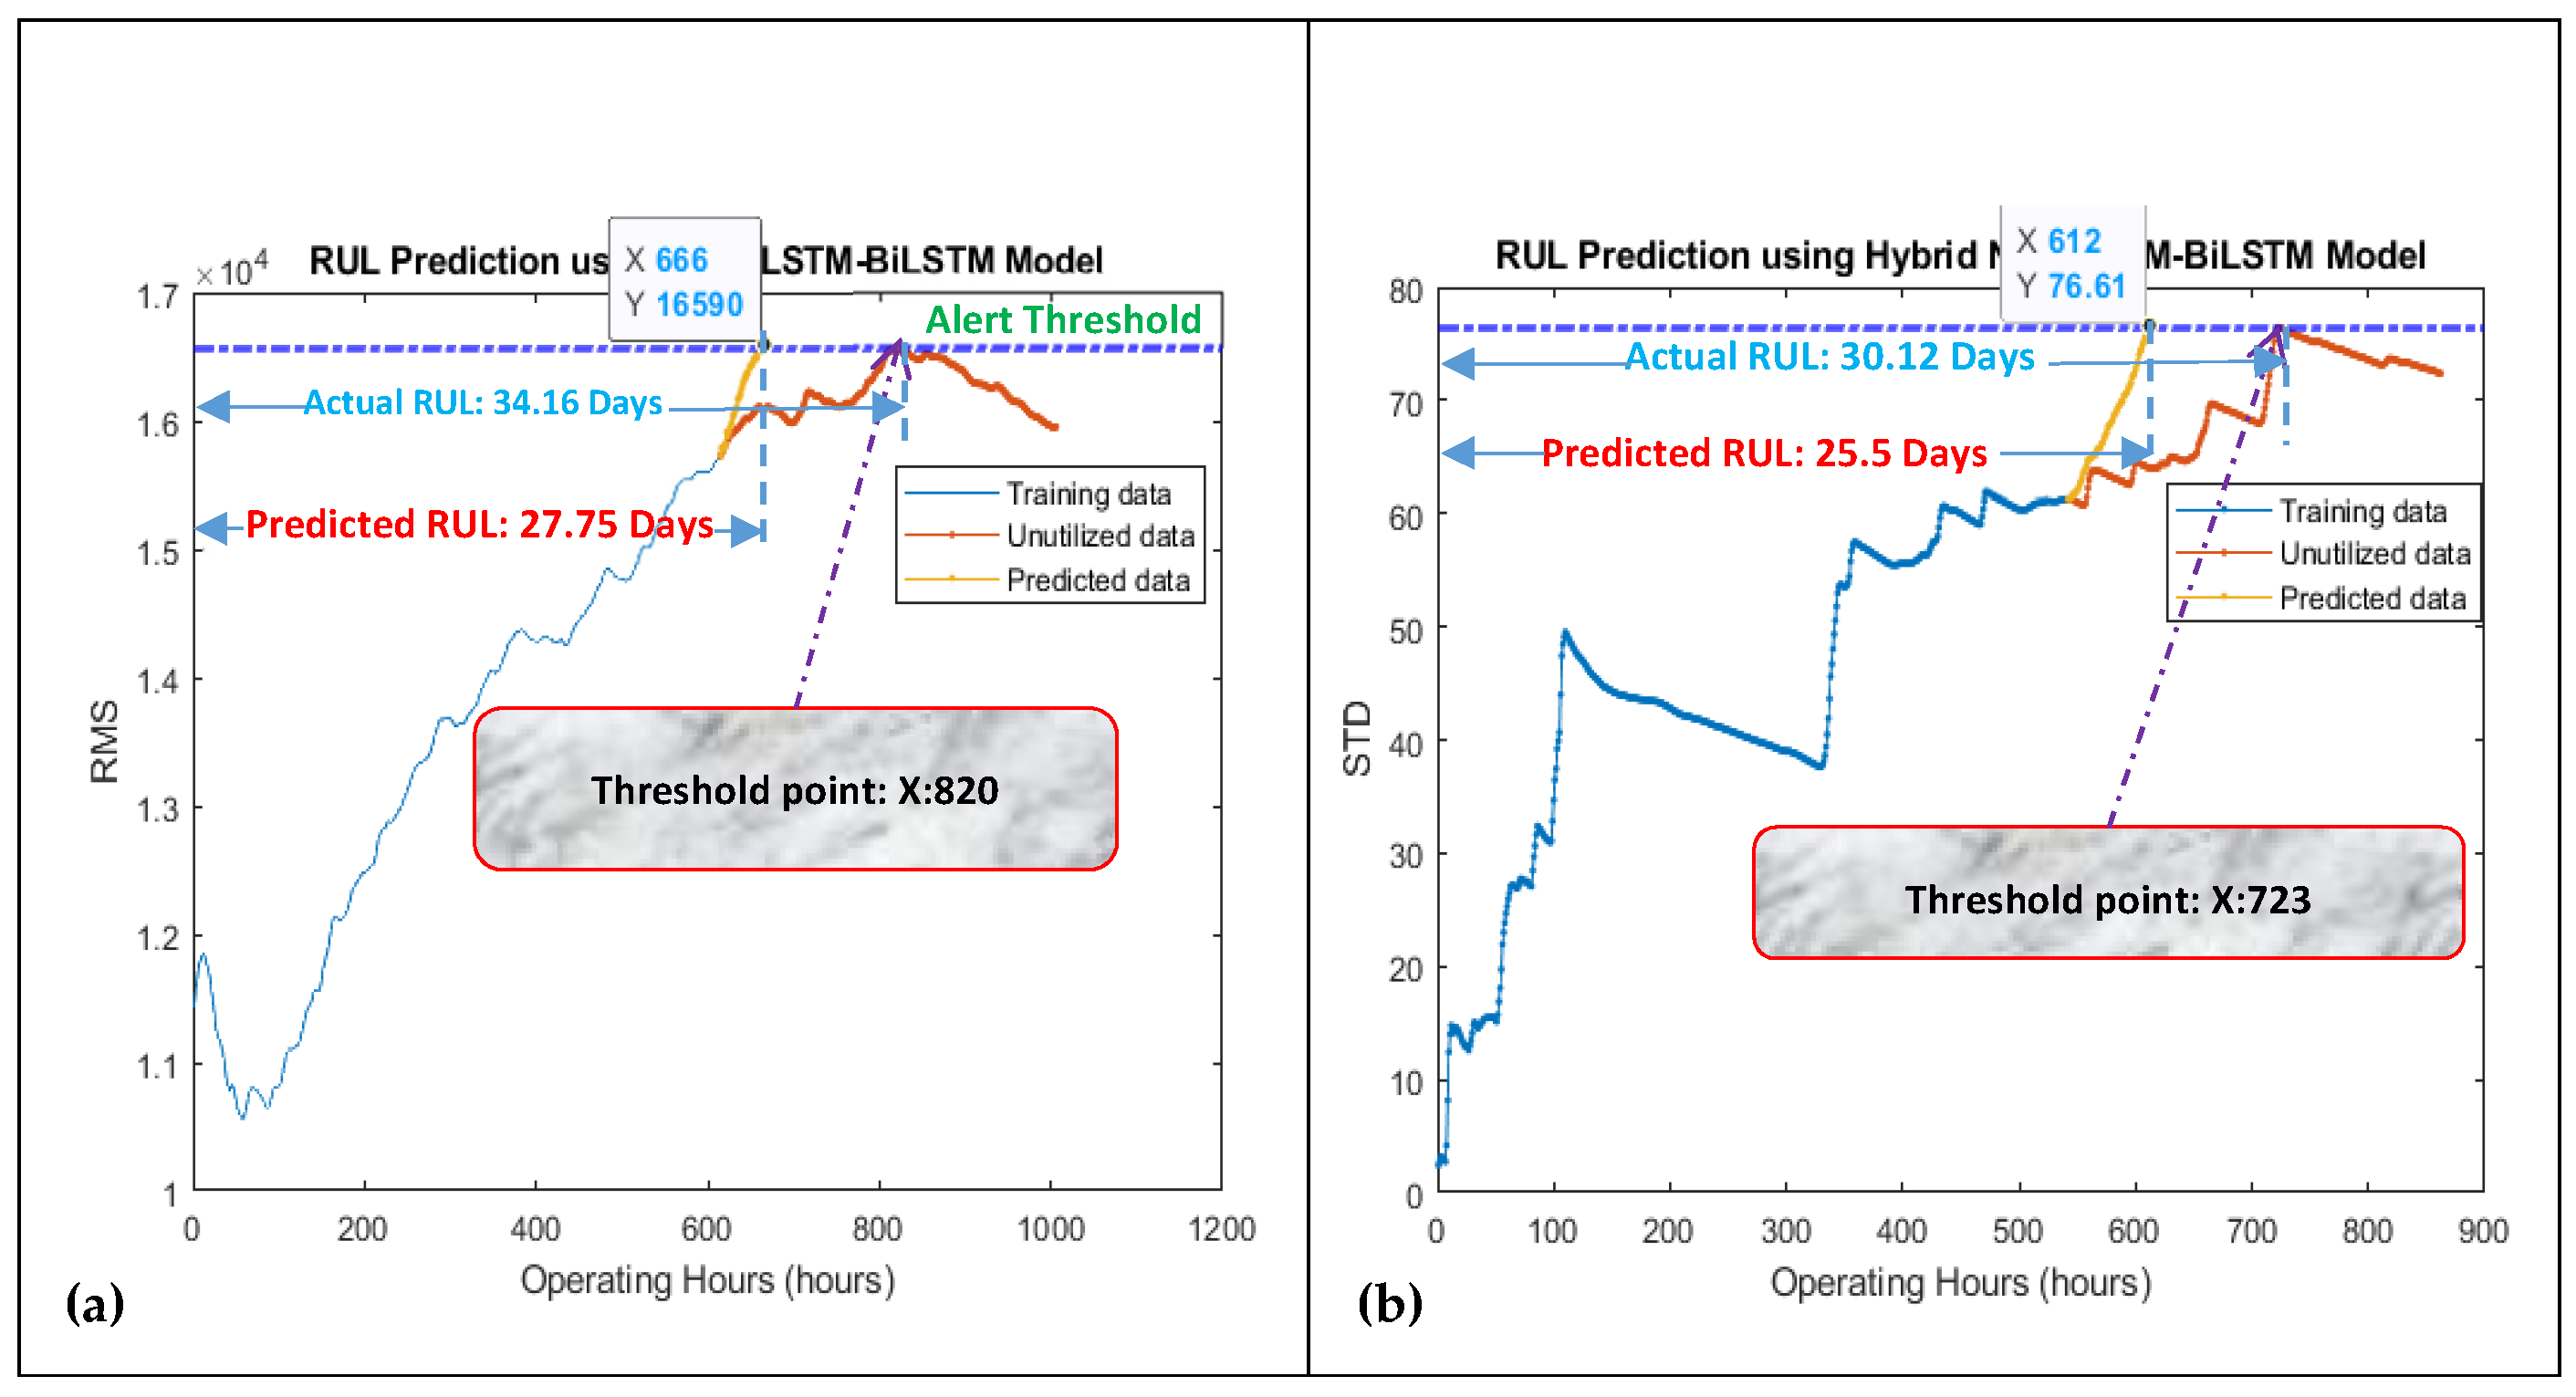
| Proposed Method | 75 | 27.75 | 34.16 | 81.23 |
| NARX | 75 | 26.60 | 34.16 | 77.86 |
| Short-term RUL | ||||
| Proposed Method | 50 | 17.5 | 18.45 | 94.85 |
| NARX | 50 | 17.40 | 18.45 | 94.25 |
| Proposed Method | 25 | 8.91 | 8.95 | 99.55 |
| NARX | 25 | 8.68 | 8.95 | 96.98 |
| 2017 Datasets | ||||
| Overall RUL | ||||
| Proposed Method | 75 | 25.5 | 30.12 | 84.66 |
| NARX | 75 | Not applicable | 30.12 | - |
| Short-term RUL | ||||
| Proposed Method | 50 | 15.70 | 15.45 | 98.38 |
| NARX | 50 | 15.76 | 15.45 | 97.99 |
| Proposed Method | 25 | 7.91 | 7.91 | 100 |
| NARX | 25 | 7.90 | 7.91 | 99.87 |
| Engine No. 140 from Sub-Dataset FD002 | ||||
|---|---|---|---|---|
| Training Data (%) | RUL Predicted (Cycles) | Actual RUL (Cycles) | Accuracy of Predicted RUL (%) | |
| Overall RUL | ||||
| Proposed Method | 75 | 288 | 361 | 79.77 |
| NARX | 75 | 274 | 361 | 75.90 |
| LSTM | 75 | Not applicable | 361 | - |
| Short-term RUL | ||||
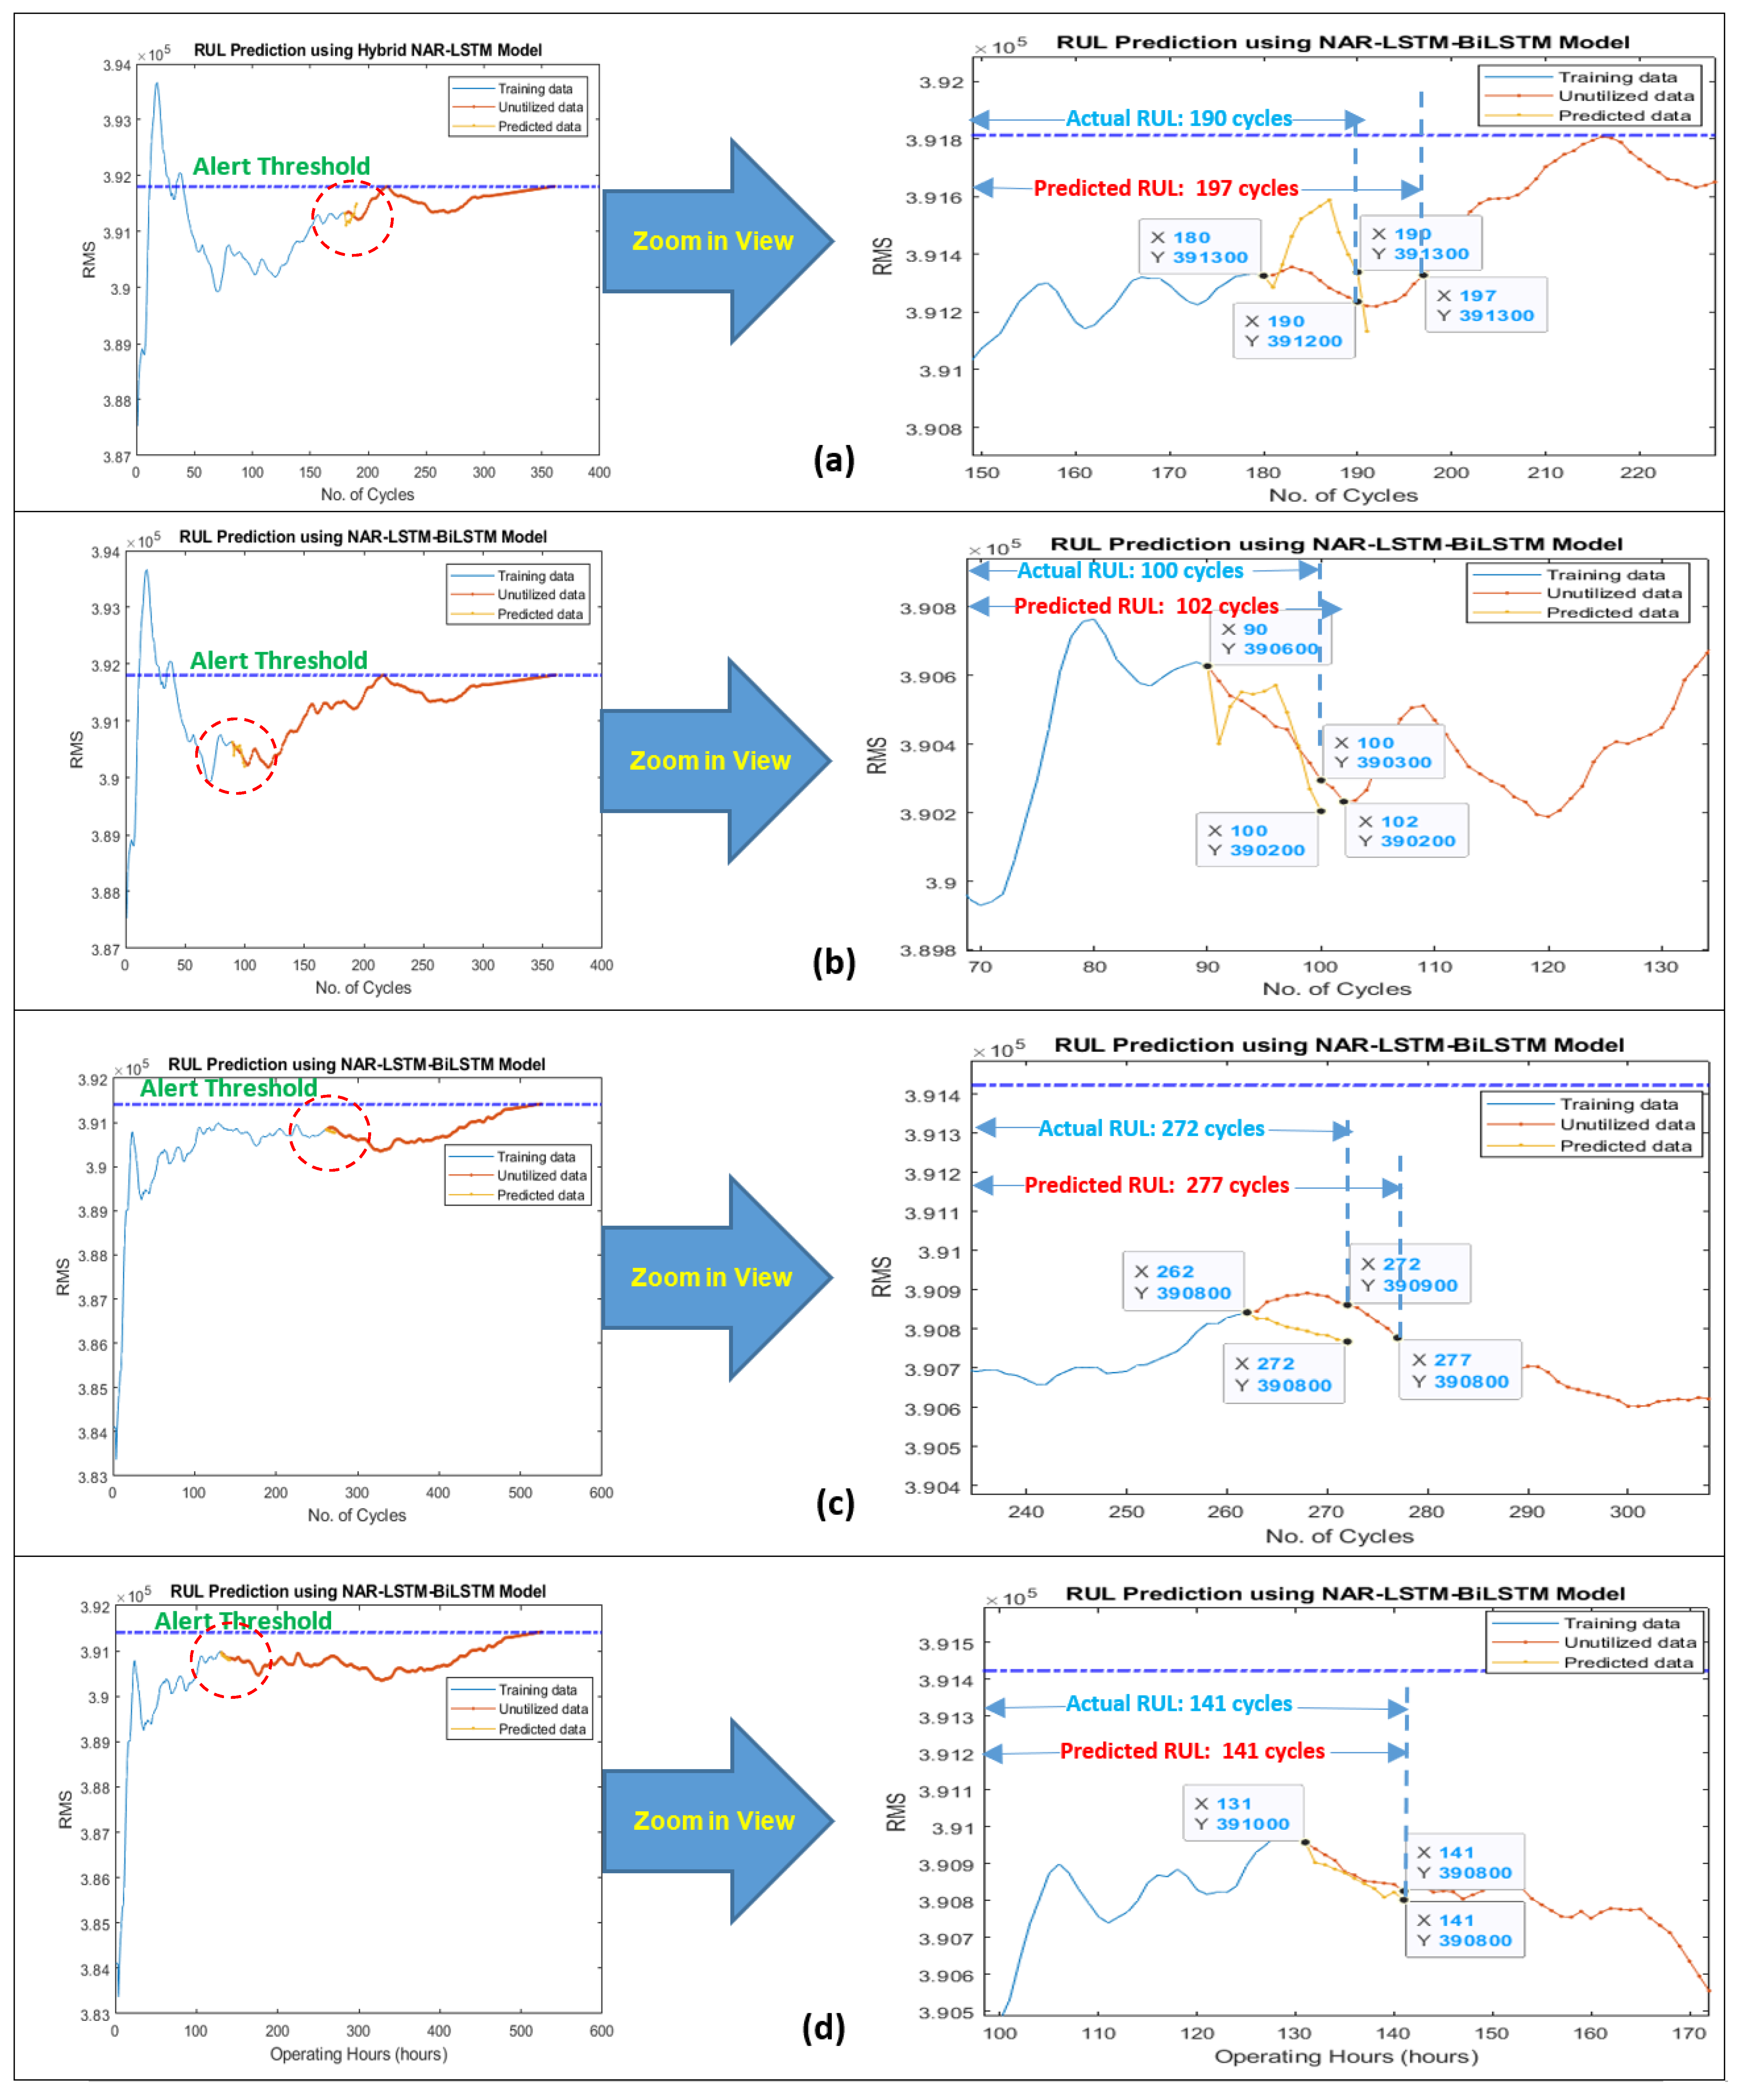
| Proposed Method | 50 | 197 | 190 | 96.31 |
| NARX | 50 | 200 | 190 | 94.73 |
| LSTM | 50 | 196 | 190 | 96.93 |
| Proposed Method | 25 | 102 | 100 | 98.00 |
| NARX | 25 | 104 | 100 | 96.00 |
| LSTM | 25 | 103 | 100 | 97.08 |
| Engine No. 25 from sub-dataset FD004 | ||||
| Overall RUL | ||||
| Proposed Method | 75 | 427 | 525 | 81.33 |
| NARX | 75 | Not applicable | 525 | - |
| LSTM | 75 | Not applicable | 525 | - |
| Short-term RUL | ||||
| Proposed Method | 50 | 277 | 272 | 98.16 |
| NARX | 50 | 280 | 272 | 97.05 |
| LSTM | 50 | 278 | 272 | 97.84 |
| Proposed Method | 25 | 141 | 141 | 100 |
| NARX | 25 | 146 | 141 | 96.45 |
| LSTM | 25 | 144 | 141 | 97.91 |
Publisher’s Note: MDPI stays neutral with regard to jurisdictional claims in published maps and institutional affiliations. |
© 2021 by the authors. Licensee MDPI, Basel, Switzerland. This article is an open access article distributed under the terms and conditions of the Creative Commons Attribution (CC BY) license (https://creativecommons.org/licenses/by/4.0/).
Share and Cite
Khan, M.M.; Tse, P.W.; Trappey, A.J.C. Development of a Novel Methodology for Remaining Useful Life Prediction of Industrial Slurry Pumps in the Absence of Run to Failure Data. Sensors 2021, 21, 8420. https://doi.org/10.3390/s21248420
Khan MM, Tse PW, Trappey AJC. Development of a Novel Methodology for Remaining Useful Life Prediction of Industrial Slurry Pumps in the Absence of Run to Failure Data. Sensors. 2021; 21(24):8420. https://doi.org/10.3390/s21248420
Chicago/Turabian StyleKhan, Muhammad Mohsin, Peter W. Tse, and Amy J. C. Trappey. 2021. "Development of a Novel Methodology for Remaining Useful Life Prediction of Industrial Slurry Pumps in the Absence of Run to Failure Data" Sensors 21, no. 24: 8420. https://doi.org/10.3390/s21248420
APA StyleKhan, M. M., Tse, P. W., & Trappey, A. J. C. (2021). Development of a Novel Methodology for Remaining Useful Life Prediction of Industrial Slurry Pumps in the Absence of Run to Failure Data. Sensors, 21(24), 8420. https://doi.org/10.3390/s21248420