This section presents and discusses three points: Firstly, we present the results of the proposed AFD-Obj system for detecting AF sequences in Arabic and English speech using three variations of the YOLOv3-tiny detector. Secondly, we show the performance of the proposed PD-Obj system for detecting the Arabic phoneme sequence. Thirdly, both system performances are compared to state-of-the-art methods.
4.4.1. Results of AFD-Obj for Detecting AFs in Arabic Corpus
Table 4 shows the GM and F-measure for the Arabic AF detection using the proposed AFD-Obj system with the three proposed YOLO models (i.e., YOLOv3-tiny-1S, YOLOv3-tiny-2S, and YOLOv3-tiny-3S). For all AFs, the systems achieved a GM greater than 80%, except for labiodental. For the F-measure of all AFs, the systems achieved accuracies greater than 80%, except for labiodental, which had an F-measure of 72.1%, 77.6%, and 72.9% using YOLOv3-tiny-1S, YOLOv3-tiny-2S, and YOLOv3-tiny-3S, respectively, and interdental, which had an F-measure of 77.5% using YOLOv3-tiny-1S. In general, we achieved GM and F-measure average accuracies of 96.5% and 94.1% for the YOLOv3-tiny-1S model, 96.4% and 94.3% for the YOLOv3-tiny-2S model, and 96.4% and 94.5% for the YOLOv3-tiny-3S model. These results are better than those of state-of-the-art results [
3], where approximately 45% of the AFs obtained less than 80% for GM and approximately 61% obtained less than 80% for the F-measure using their best model (i.e., DBN–DNN). We achieved our results using a single network for all AFs, while Ref. [
3] used a different network for each AF. Moreover, our testing input is a whole utterance without time boundary information, while theirs was speech phonemes. We also detected the time boundaries of each AF; therefore, we can calculate the accuracy at the frame level.
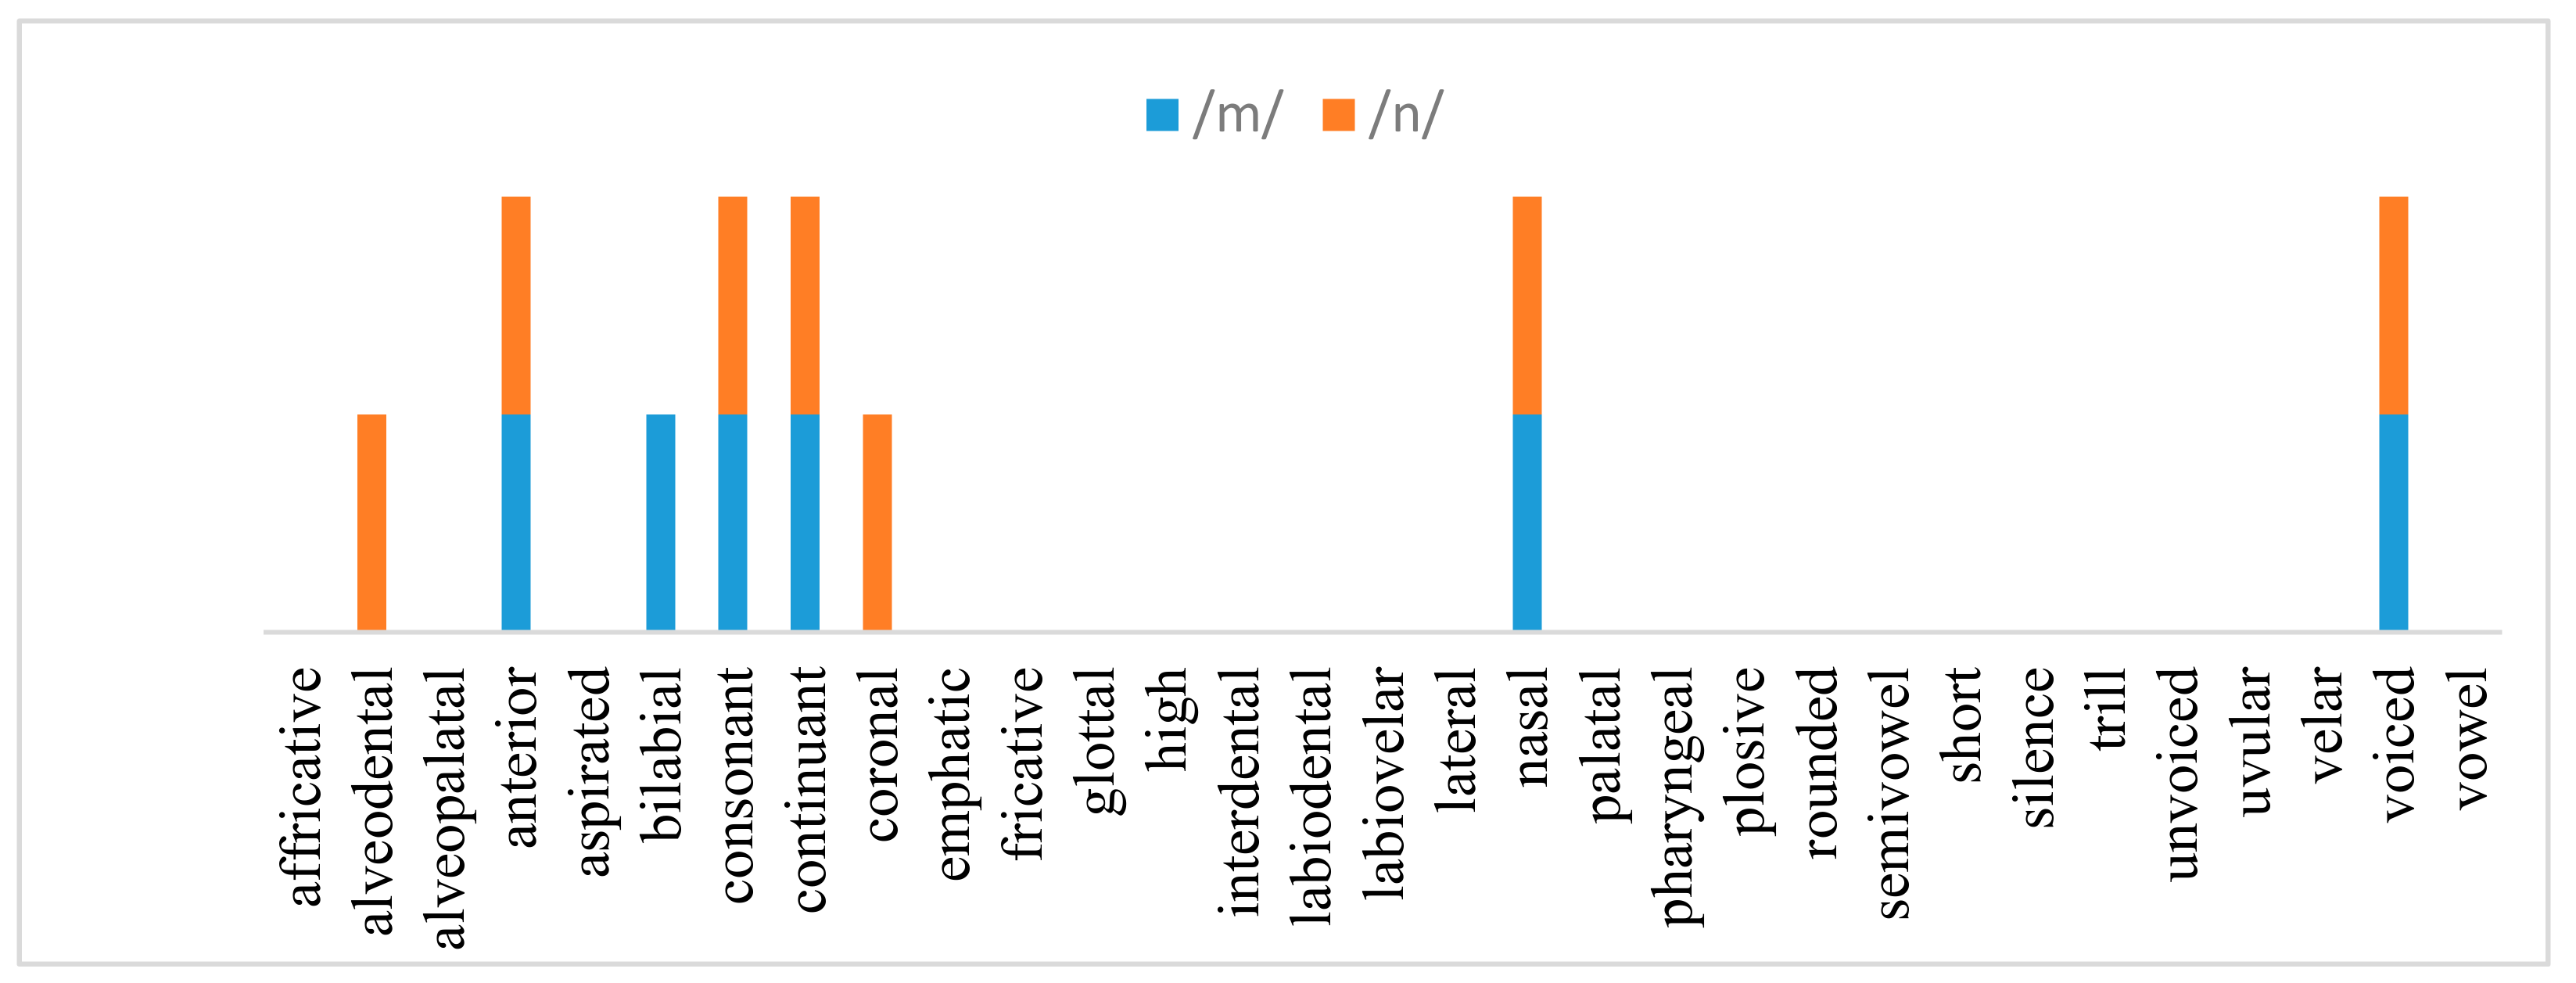
Each phoneme has a unique vector representing the existences or absences of each AF; thus, we can detect the phonemes and their boundary from the AF vectors of each frame. We used the lookup table provided in Ref. [
3] to produce the corresponding phoneme from the vectors of the detected AFs. Ref. [
3] used the correct matching rate metrics for their evaluation. However, the output of our proposed system is a sequence of AFs; hence, the length of the output sequence is not uniform with the canonical form, and we calculated the correction rate and the PER by applying the sequence alignment between the matching output of the detected vectors and the canonical phonemes.
Figure 10 shows an example of recognizing the phonemes from the detected AF vectors and calculating the correction rate.
We considered only the phonemes when there is an exact match (i.e., ideal case) of 100% similarity between the predicted AF vector and the reference vector, which might yield substitution errors, using zero hamming distance and ignored the invalid output. Ref. [
3] reported the result for a 3-bit difference between the detected AFs and the lookup table, which amounted to approximately 90% similarity between the predicted and actual vectors. We compared the correction rate of our proposed method and that of [
3] using the 100% and 90% similarities in
Table 5. For our best model (i.e., YOLOv3-tiny-1S), we outperformed the matching rate of their best classifier (i.e., DBN–DNN) by almost 40% at 100% similarity and outperformed the matching rate of their classifier by approximately 4% at 90% similarity [
3]. Using 100% similarity, we achieved correction rates of 86.04%, 88.06%, and 89.35% for YOLOv3-tiny-3S, YOLOv3-tiny-2S, and YOLOv3-tiny-1S, respectively, compared to 64% (matching rate) for the model in Ref. [
3]. These values increased to 91.16%, 92.38%, and 92.59%, respectively, when using 90% similarity for all three models compared to 89% for that in [
3]. This increase can be attributed to the fact that the correction rate measure ignored the insertion errors; hence, we ignored many insertion errors when using only 90% similarity.
For 100% similarity, our models obtained PERs of 14.13%, 12.09%, and 10.84%, respectively, which increased to 20.1%, 15.53%, and 12.57%, respectively, for 90% similarity (
Table 5). Reference [
3] did not provide the PER result. Another point to highlight is that these observations confirmed our postulation for not needing the second and third scales of the YOLO detector in the AF detection and phoneme recognition. The PER results also illustrate that using 90% similarity during AF matching to generate the corresponding phonemes is not acceptable because more wrong phonemes can be recognized as correct.
Figure 11 shows the confusion matrix of the Arabic phonemes of the KAPD corpus generated from the detected AF vectors using our best model, YOLOv3-tiny-1S, with 100% similarity. We can clearly see from the confusion matrix that most phonemes were recognized correctly, and most of the confusion occurred between the phonemes with almost similar AF vectors. For example, phoneme /fs10/ was wrongly recognized for 4 times as /vs10/. Both phonemes had a similar AF vector, differing only in three elements:/vs10/ is coronal, interdental, and not labiodental, while /fs10/ is labiodental, not coronal, and not interdental. Our system also wrongly recognized phoneme /as10/ as /is10/ for 63 times. The AF vector for these phonemes showed that the two phonemes differed only in two AFs: phoneme /as10/ is coronal, and /is10/ is not; /is10/ is anterior, and /as10/ is not.
Another interesting observation is that the number of confusion is high for the short vowels (i.e.,/as10/,/is10/,/us10/) as highlighted by the red box in the
Figure 11. Most of the confusion occur between these three phonemes. For example, /as10/ is wrongly recognized 63 times as /is10/ and 37 times as /us10/. This is expected since vowels are near to each other than other phonemes. The high number of confusions for these short vowels is due to their high number in testing data compared to other phonemes, except (/sil/ and /zs10/). Another observation is that the confusion of those vowel phoneme is very small with the non-vowel phonemes. For examples, /as10/ phoneme is wrongly recognized 6 times as non-vowel phonemes which represent around (1%) of all /as10/ detection.
In addition, we can see that the number of the deletion errors is high compared to insertion and substitution errors. We attribute this to our requirement of 100% similarity matching which resulted in ignoring a lot of the detected AFs resulting in high number of deletions.
4.4.2. Results of the AFD-Obj System for Detecting AFs in the English Corpus
This section presents the results of applying our proposed system for detecting the English AFs using the TIMIT corpus. We used accuracy at the frame level, by considering the bounding box coordinates as the start and end frames, as our evaluation metric, which is calculated as shown in
Figure 8. We then compared the results of the proposed system with that of the state-of-art published work in AFs detection using TIMIT [
40], called LAS-MTL-M. We consider for our comparison the results of LAS-MTL-M which were reported at frame level. Authors of [
40] used the TIMIT segments markup (time boundaries) to calculate the accuracies of the column “markup frames” and the DTW algorithm to convert soft attention to hard attention to calculate the accuracies of the “frames” column in
Table 6. In both cases, they dealt with the different number of predicted and target frames by taking the minimum length of target and prediction, as shown in the code provided. For better comparison, we calculated the accuracy of our proposed system using the coordinates of the detected bounding boxes as markup frames, after taking the minimum length of the predicted and target frames. This result is presented in the column “bounding box coord.” of
Table 6. We also used another measure to deal with the problem of the difference in length between the predicted and target frames, where we used HResults analysis tool to align the predicted and target frames, then we calculate the accuracy. Moreover, HResults accuracy is more precise because it considers the insertion errors. This accuracy is presented in column “HResult align.” of
Table 6. We also show the results with those in [
16], which worked on detecting only some AFs in TIMIT.
Table 6 presents the result of our proposed system AFD-Obj with the three models. The table shows that our system achieved results comparable to the published result for all TIMIT AFs. Our models had an average accuracy (with bounding box coord.) of 94.29%, 95.04%, and 95.13%, and average accuracy (using HResult) of 93.23%, 93.47%, and 93.66% for YOLOv3-tiny-3S, YOLOv3-tiny-2S, and YOLOv3-tiny-1S, respectively, while the phones-las-frames model had an average detection accuracy of 95.5% using markup-frames. Since the test results of the “markup-frames” of [
40] depend on segmenting the speech into markup frames, while our system doesn’t depend on any segmentation, hence we think fair comparison should be with the result of the “frames” column of [
40].
An important observation from
Table 6 is that our models detected silence within the utterance with a high accuracy compared to the phone-las models [
40], which achieved only 63% and 80% for frames and markup frames, respectively. This high performance in detecting silence in continuous speech is very promising and can be looked at as an important achievement by itself. YOLOv3-tiny-1S had the best average detection accuracy (95.13%), while our model YOLOv3-tiny-2S had almost the same average detection accuracy (95.04%). The average detection accuracy of YOLOv3-tiny-3S was 94.29%. These results reinforce our previous assumption for not needing the second and third scales of YOLO detection for our specific application.
4.4.3. Results of PD-Obj for the Phoneme Recognition in the Arabic Corpus
Table 7 presents the results of investigating the proposed PD-Obj system for phoneme recognition using the KAPD corpus. Our proposed system using the YOLOv3-tiny-2S model achieved the lowest PER of 5.63%, while the YOLOv3-tiny-1S and YOLOv3-tiny-3S models achieved 5.79% and 6.29% PER, respectively. These results are remarkable and show that our proposed system has an excellent potential compared to the recent state-of-the-art systems on this corpus [
49] (last row,
Table 7). Reference [
49] used the HMM for the Arabic phoneme recognition using the DPF elements. The results also reinforced our previous assumption for not needing the second and third scales of the YOLO detection for our specific application.
We observe from
Table 7 that the PD-Obj system obtained better results than the system based on the AFD-Obj. However, detecting the AFs is important in many applications such as, pronunciation error correction and diagnosis. And the AFs are universal between many languages. An interesting point for future work is to see how to improve the accuracy of the system that performs phoneme recognition based on the detected AFs.
We also calculated the correction rate of each phoneme for the YOLOv3-tiny-1S model (
Figure 12). Note that 79% of the Arabic phonemes had a correction rate greater than 80%, while 44% had a correction rate greater than 90%.
KAPD corpus is imbalanced as shown in
Table 2. In particular, the samples for /sil/, which is not a phoneme, and phoneme /zs1/ represent around half of the training and testing samples. To deal with imbalance the GM and F-measure for each phoneme are calculated from confusion matrix and are shown in
Figure 13, after excluding the insertions and deletions. When we analyzed the performance of the proposed method in
Figure 13 with the total number of samples of each phoneme, we observed that there is no direct relationship between the number of samples and the GM and F-measure. For example, we achieved a GM of 99% for /rs10/ and /ws10/ and 94% for /as10/ while the total number of samples is 168, 167, and 2352 for the phonemes /rs10/, /ws10/, and /as10/, respectively.
Table 8 shows the performance for the speech of each speakers from the test set of the KAPD corpus. The test set consists of the speech of the two speakers (M and Y) from each group (C and G), as presented in [
37]. The total number of utterances and phonemes of the test sets are 1360 and 8138, respectively. We can notice from the results of
Table 8 that our proposed system achieved excellent results. The best PER (lower) was obtained for speaker/subset Y/C, which is 4.4 with correction rate of 95.8%. The average and standard deviation of PER of all speakers are 5.8 and 1.2, respectively.
Moreover, we reported in our previous study [
13] that our proposal of using object detection techniques for phoneme recognition achieved excellent results in phoneme recognition using TIMIT. These results were comparable to all and better than those of some state-of-the-art techniques.


