
Intense L-Band Solar Radio Bursts Detection Based on GNSS Carrier-To-Noise Ratio Decrease over Multi-Satellite and Multi-Station


Abstract
1. Introduction
2. Effect of SRBS on GPS Receiver Noise Floor
3. Methodology
- The solar elevation angle of all the IGS stations is calculated to select the stations close to the subsolar point.
- The data of improperly working receivers are excluded, such as some stations with incomplete data.
- The data type of is set to an integer to eliminate the impact of the differences in the data precision of various types of receivers on the results.
- The elevation mask angle is set to 10°. Note that the elevation mask angle is lower than normal to increase the amount of observation data. Due to the fact that GPS L5 and GALILEO E5 include few satellites that can be observed at the same time from the data provided by the IGS. In addition, multipath cannot lead to a simultaneous decrease in the values of multiple satellites over a large area close to the subsolar point. Hence, the proposed method can prevent the impact of multipath to some extent, which is reflected in the low false alarm rate in the subsequent experiments.
3.1. Detection of a Single Satellite
3.1.1. Determination of the ‘‘Falling Moments’’ and ‘‘Rising Moments’’
3.1.2. Determination of the Valley Period
- The time of the rising moment is higher than the falling moment.
- The at any time in this period is less than the smaller of that at the falling moment and that at the rising moment.
3.2. Intersection of Different Satellites at the Same Monitoring Station
3.3. Intersection of Multiple Monitoring Stations
4. Results and Discussion
4.1. Detection of a Single Satellite
4.2. Analysis of Multiple Stations
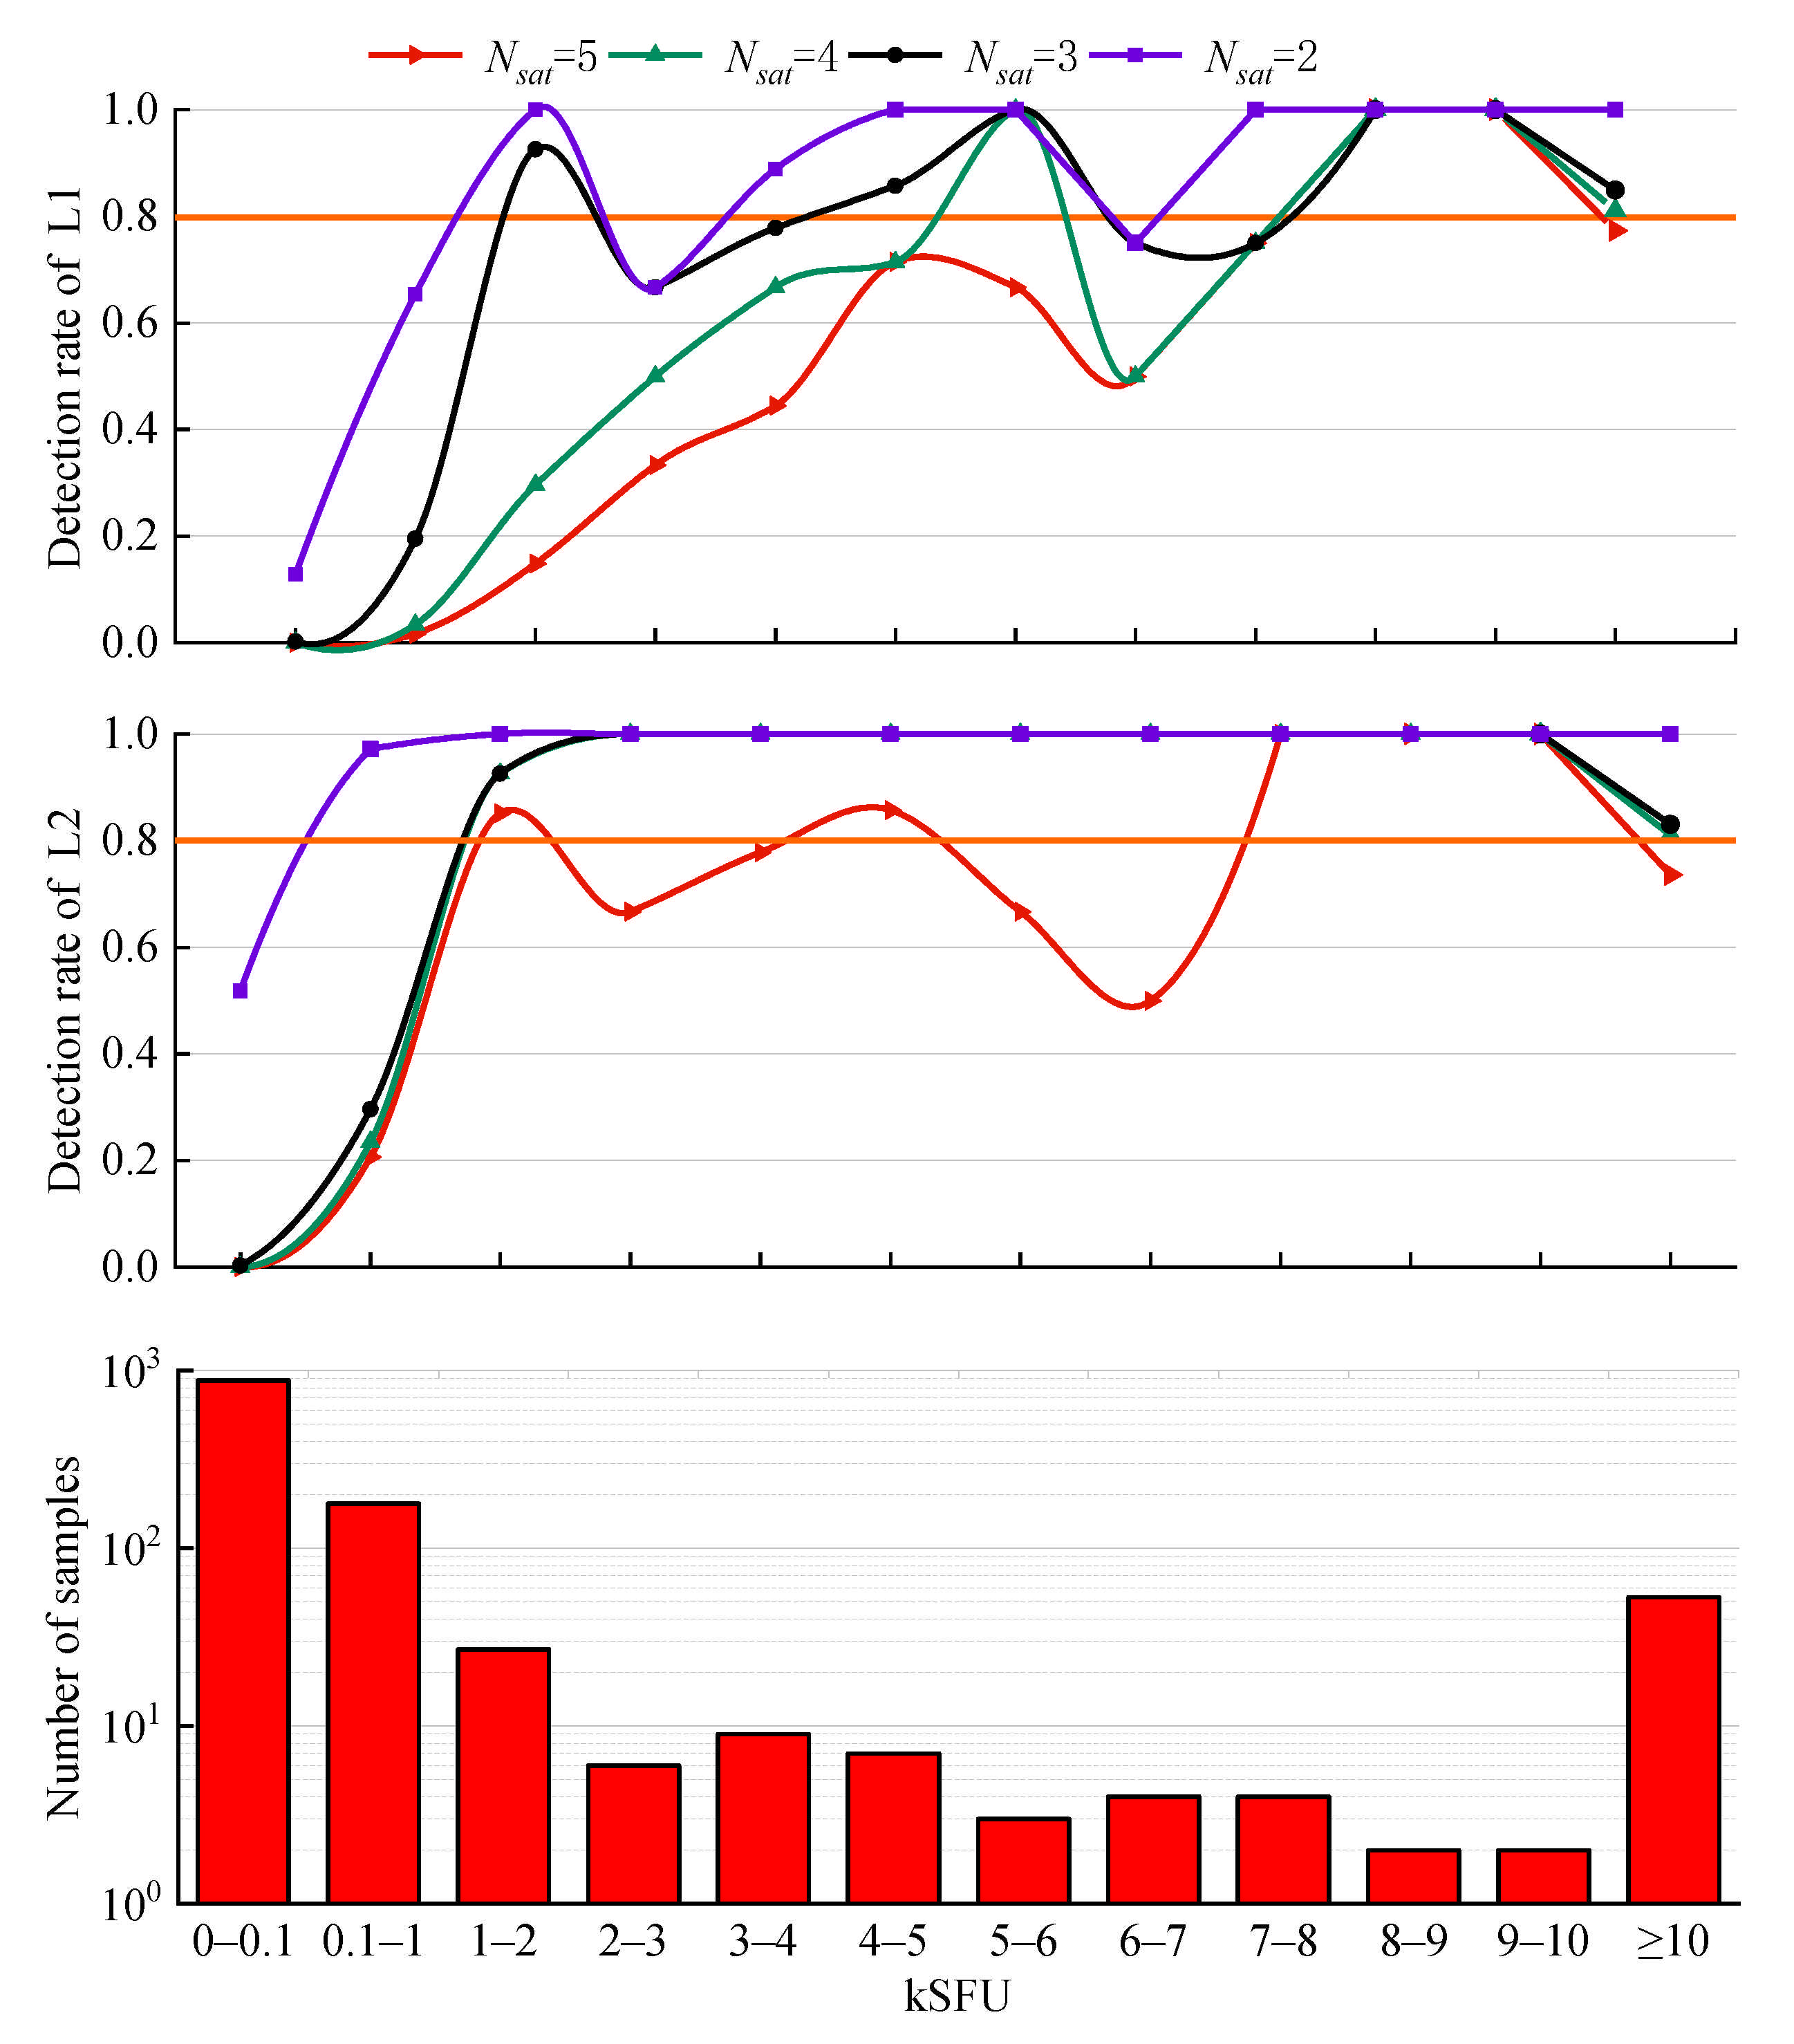
4.3. Influence of Satellite Distribution on the Detection Rate
- For a single station, the intersection of the valley periods of two near-satellites (distant-satellites) is taken.
- For each SRB event, the valley period common to at least two stations is judged as the final detection result.
5. Conclusions
- The detection rate of intense L-band SRBs reaches more than 80% for the flux density above 800 SFU at the L2 frequency of GPS.
- The detection results of GPS L2 and GLONASS G2 are better than those of GPS L1 L5, GLONASS G1 and Galileo E1 E5.
- The distribution of the satellites relative to the Sun has no impact on the overall detection rate.
- Statistically, the proposed detection algorithm is proven to have high reliability, with a false alarm rate of approximately 0% for historical SRB events detection with the optimal and .
Author Contributions
Funding
Institutional Review Board Statement
Informed Consent Statement
Data Availability Statement
Conflicts of Interest
References
- Schmidt, E.; Akopian, D.; Pack, D.J. Development of a real-time software-defined GPS receiver in a labview-based instrumentation environment. IEEE Trans. Instrum. Meas. 2018, 67, 2082–2096. [Google Scholar] [CrossRef]
- Tang, X.H.; Chen, X.; Xiu, J.C.; Chen, X.Y. Comparison on different tracking configurations in GNSS receivers. J. Chinese Inertial Tech. 2018, 26, 623–628. [Google Scholar]
- Zimmermann, F.; Schmitz, B.; Klingbeil, L.; Kuhlmann, H. GPS multipath analysis using fresnel zones. Sensors 2019, 19, 25. [Google Scholar] [CrossRef]
- Li, Q.; Xia, L.; Chan, T.O.; Xia, J.; Geng, J.; Zhu, H.; Cai, Y. Intrinsic Identification and Mitigation of Multipath for Enhanced GNSS Positioning. Sensors 2021, 21, 188. [Google Scholar] [CrossRef] [PubMed]
- Marques, H.A.; Aquino, M.; Veettil, S.V.; Monico, J.F. Accuracy assessment of precise point positioning with multi-constellation GNSS data under ionospheric scintillation effects. J. Space Weather Space Clim. 2018, 8, 1–14. [Google Scholar] [CrossRef]
- Schmidt, E.; Ruble, Z.; Akopian, D.; Pack, D.J. Software-Defined radio GNSS instrumentation for spoofing mitigation: A review and a case study. IEEE Trans. Instrum. Meas. 2019, 68, 2768–2784. [Google Scholar] [CrossRef]
- Shafiee, E.; Mosavi, M.R.; Moazedi, M. Detection of spoofing attack using machine learning based on multi-layer neural network in single-frequency GPS receivers. J. Navig. 2018, 71, 169–188. [Google Scholar] [CrossRef]
- Singh, D.; Raja, K.S.; Subramanian, P.; Ramesh, R.; Monstein, C. Automated detection of solar radio bursts using a statistical method. Sol. Phys. 2019, 294, 1–14. [Google Scholar] [CrossRef]
- Carrano, C.S.; Bridgwood, C.T.; Groves, K.M. Impacts of the December 2006 solar radio bursts on the performance of GPS. Radio Sci. 2009, 44, 1–12. [Google Scholar] [CrossRef]
- Chen, Z.; Gao, Y.; Liu, Z. Evaluation of solar radio bursts’ effect on GPS receiver signal tracking within International GPS service network. Radio Sci. 2005, 40, 1–11. [Google Scholar] [CrossRef]
- Cerruti, A.P.; Kintner, P.M.; Gary, D.E.; Mannucci, A.J. Effect of intense December 2006 solar radio bursts on GPS receivers. Space Weather 2008, 6, 1–10. [Google Scholar] [CrossRef]
- Demyanov, V.V.; Afraimovich, E.L.; Jin, S. An evaluation of potential solar radio emission power threat on GPS and GLONASS performance. GPS Solut. 2012, 16, 411–424. [Google Scholar] [CrossRef]
- Yue, X.; Schreiner, W.S.; Kuo, Y.H.; Zhao, B.Q. The effect of solar radio bursts on the GNSS radio occultation signals. Space Phys. 2013, 118, 5906–5918. [Google Scholar] [CrossRef]
- Sreeja, V.; Aquino, M.; Kees, D.J. Impact of the 24 September 2011 solar radio burst on the performance of GNSS receivers. Space Weather 2013, 11, 306–312. [Google Scholar] [CrossRef]
- Sreeja, V.; Aquino, M.; Kees, D.J.; Hans, V. Effect of the 24 September 2011 solar radio burst on precise point positioning service. Space Weather 2014, 12, 143–147. [Google Scholar] [CrossRef]
- Muhammad, B.; Alberti, V.; Valentina, A.; Marassi, A.; Ernestina, C. Performance assessment of GPS receivers during the September 24, 2011 solar radio burst event. J. Space Weather Space Clim. 2015, 5, 1–16. [Google Scholar] [CrossRef]
- Giersch, O.D.; Kennewell, J.; Lynch, M. Solar radio burst statistics and implications for space weather effects: Solar radio burst statistics. Space Weather 2017, 15, 1511–1522. [Google Scholar] [CrossRef]
- Huang, W.G.; Ercha, A.; Shen, H. Impact of intense L-band solar radio burst on GNSS performance and positioning accuracy. Chin. J. Radio Sci. 2018, 33, 1–7. [Google Scholar]
- Berdermann, J.; Kriegel, M.; Banys, D.; Frank, H. Ionospheric response to the X9.3 flare on 6 September 2017 and its implication for navigation services over Europe. Space Weather 2018, 16, 1604–1615. [Google Scholar] [CrossRef]
- Linty, N.; Minetto, A.; Dovis, F.; Luca, S. Effects of phase scintillation on the GNSS positioning error during the September 2017 storm at Svalbard. Space Weather 2018, 16, 1317–1329. [Google Scholar] [CrossRef]
- Sato, H.; Jakowski, N.; Berdermann, J.; Karel, J. Solar radio burst events on September 6, 2017 and its impact on GNSS signal frequencies. Space Weather 2019, 17, 816–826. [Google Scholar] [CrossRef]
- Huang, W.G.; Ercha, A.; Shen, H. Statistical study of GNSS L-band solar radio bursts. GPS Solut. 2018, 22, 1–9. [Google Scholar] [CrossRef]
- Ma, L.; Chen, Z.; Xu, L.; Yan, Y.H. Multimodal deep learning for solar radio burst classification. Pattern Recognit. 2016, 61, 573–582. [Google Scholar] [CrossRef]
- Chen, S.; Xu, L.; Ma, L.; Zhang, W.Q. Convolutional neural network for classification of solar radio spectrum. In Proceedings of the IEEE International Conference on Multimedia & Expo Workshops (ICMEW), Hong Kong, China, 10–14 July 2017; pp. 198–201. [Google Scholar]
- Zhang, P.J.; Wang, C.B.; Ye, L. A type III radio burst automatic analysis system and statistic results for a half solar cycle with Nancay Decameter Array data. Astron. Astrophys. 2018, 1, 618–637. [Google Scholar] [CrossRef]
- Salmane, H.; Weber, R.; Meraim, K.A.; Klein, K.L.; Bonnin, X. A method for the automated detection of solar radio bursts in dynamic spectra. J. Space Weather Space Clim. 2018, 8, 1–18. [Google Scholar] [CrossRef]
- Kaplan, E.D.; Hegarty, C.J. Antennas. In Understanding GPS / GNSS: Principles and Applications, 3rd ed.; Kaplan, E.D., Hegarty, C.J., Eds.; Artech House: Norwood, MA, USA, 2017. [Google Scholar]


| Elevation Angle, β° | ||
|---|---|---|
| Elevation Angle, β° | ||
|---|---|---|
| Rate of the Solar Radio Emission Flux (k), SFU | ||||||
|---|---|---|---|---|---|---|
| 1 | 102 | 103 | 104 | 105 | 106 | |
| −187.1 | −167.1 | −157.1 | −147.1 | −137.1 | −127.1 | |
| ID | Latitude/° | Longitude/° | Country |
|---|---|---|---|
| ISPA | 110 W | 27 S | Chile |
| AREQ | 72 W | 16 S | Peru |
| BOGT | 75 W | 4 N | Colombia |
| MDO1 | 105 W | 30 N | USA |
| CHPI | 45 W | 22 S | Brazil |
| CRO1 | 65 W | 17 N | USA |
| KOUR | 53 W | 5 N | Guyana |
| NNOR | 116 E | 31 S | Australia |
| PERT | 115 E | 31 S | Australia |
| SUNM | 153 E | 27 S | Australia |
| TIDB | 148 E | 35 S | Australia |
| PIMO | 121 E | 14 N | Philippines |
| CCJM | 142 E | 27 N | Japan |
| KUNM | 102 E | 25 N | China |
| GUAM | 144 E | 13 N | Guam |
| USUD | 138 E | 36 N | Japan |
| TSKB | 140 E | 36 N | Japan |
| DARW | 131 E | 12 S | Australia |
| TOW2 | 147 E | 19 S | Australia |
| RABT | 7 W | 33 N | Morocco |
| MAS1 | 16 W | 27 N | Spain |
| SFER | 7 W | 36 N | Spain |
| VILL | 4 W | 40 N | Spain |
| YEBE | 4 W | 40 N | Spain |
| KOKB | 160 W | 22 N | USA |
| TLSE | 1 E | 43 N | France |
| MBAR | 30 E | 0 N | Uganda |
| HARB | 27 E | 25 S | Africa |
| EBRE | 0 E | 40 N | Spain |
| MATE | 14 E | 40 N | Italy |
| MAT1 | 14 E | 40 N | Italy |
| Date | Period | RSTN Station | Peak Time | IGS Station ID and Solar Incident Angle/(°) | ||||||
|---|---|---|---|---|---|---|---|---|---|---|
| 06.12.06 | 12:11–20:24 | Sagamore-Hill | 19:30 | ISPA: 83.5 | AREQ: 58.3 | BOGT: 50.6 | MDO1: 37.6 | CHPI: 34.8 | CRO1: 34.5 | KOUR: 32.3 |
| 13.12.06 | 00:00–10:00 | Learmonth | 03:30 | NNOR: 77.1 | PERT: 76.3 | SUNM: 66.6 | TIDB: 68.5 | PIMO: 52.4 | CCJM: 38.0 | KUNM: 36.0 |
| 15.02.11 | 02:04–10:45 | Learmonth | 03:00 | PIMO: 75.8 | GUAM: 80.0 | USUD: 72.6 | TSKB: 72.2 | DARW: 59.0 | KUNM: 58.8 | TOW2: 50.4 |
| 24.09.11 | 11:00–22:00 | Sagamore-Hill | 13:00 | RABT: 56.2 | MAS1: 63.0 | CHPI: 53.4 | SFER: 53.2 | KOUR: 51.7 | VILL: 48.8 | YEBE: 48.8 |
| Station | Sun | Distant-Satellites | Near-Satellites | |||||
|---|---|---|---|---|---|---|---|---|
| Az/° | El/° | SVID | Az/° | El/° | SVID | Az/° | El/° | |
| NNOR | 80.9 | 77.1 | G13 | 272 | 45 | G11 | 5 | 52 |
| G23 | 215 | 66 | G20 | 140 | 65 | |||
| PERT | 78.9 | 76.3 | G13 | 275 | 45 | G11 | 7 | 52 |
| G23 | 217 | 66 | G20 | 140 | 65 | |||
| SUNM | 279.8 | 66.6 | G25 | 145 | 45 | G20 | 210 | 60 |
| G31 | 140 | 35 | G23 | 230 | 32 | |||
| TIDB | 301.2 | 68.5 | G25 | 135 | 47 | G20 | 220 | 70 |
| G31 | 135 | 40 | G23 | 243 | 45 | |||
| PIMO | 169.9 | 52.4 | G19 | 20 | 29 | G11 | 210 | 80 |
| G27 | 305 | 70 | G13 | 230 | 20 | |||
| CCJM | 196.3 | 38.0 | G03 | 50 | 40 | G11 | 230 | 50 |
| G19 | 10 | 55 | G16 | 120 | 30 | |||
| KUNM | 151.8 | 36.0 | G08 | 325 | 50 | G11 | 135 | 60 |
| G28 | 310 | 28 | G27 | 300 | 80 | |||
Publisher’s Note: MDPI stays neutral with regard to jurisdictional claims in published maps and institutional affiliations. |
© 2021 by the authors. Licensee MDPI, Basel, Switzerland. This article is an open access article distributed under the terms and conditions of the Creative Commons Attribution (CC BY) license (http://creativecommons.org/licenses/by/4.0/).
Share and Cite
Yang, F.; Zhu, X.; Chen, X.; Lin, M. Intense L-Band Solar Radio Bursts Detection Based on GNSS Carrier-To-Noise Ratio Decrease over Multi-Satellite and Multi-Station. Sensors 2021, 21, 1405. https://doi.org/10.3390/s21041405
Yang F, Zhu X, Chen X, Lin M. Intense L-Band Solar Radio Bursts Detection Based on GNSS Carrier-To-Noise Ratio Decrease over Multi-Satellite and Multi-Station. Sensors. 2021; 21(4):1405. https://doi.org/10.3390/s21041405
Chicago/Turabian StyleYang, Fan, Xuefen Zhu, Xiyuan Chen, and Mengying Lin. 2021. "Intense L-Band Solar Radio Bursts Detection Based on GNSS Carrier-To-Noise Ratio Decrease over Multi-Satellite and Multi-Station" Sensors 21, no. 4: 1405. https://doi.org/10.3390/s21041405
APA StyleYang, F., Zhu, X., Chen, X., & Lin, M. (2021). Intense L-Band Solar Radio Bursts Detection Based on GNSS Carrier-To-Noise Ratio Decrease over Multi-Satellite and Multi-Station. Sensors, 21(4), 1405. https://doi.org/10.3390/s21041405