Communication

Measurement of Atmospheric CO2 Column Concentrations Based on Open-Path TDLAS

1
Laser Institute, Qilu University of Technology (Shandong Academy of Sciences), Qingdao 266100, China
2
Ocean Remote Sensing Institute, Ocean University of China, Qingdao 266003, China
3
The First Institute of Oceanography, Ministry of Natural Resources of China, Qingdao 266061, China
*
Author to whom correspondence should be addressed.
Sensors 2021, 21(5), 1722; https://doi.org/10.3390/s21051722
Submission received: 24 January 2021 / Revised: 25 February 2021 / Accepted: 25 February 2021 / Published: 2 March 2021
(This article belongs to the Section Remote Sensors)

Abstract

:
Monitoring of CO2 column concentrations is valuable for atmospheric research. A mobile open-path system was developed based on tunable diode laser absorption spectroscopy (TDLAS) to measure atmospheric CO2 column concentrations. A laser beam was emitted downward from a distributed feedback diode laser at 2 μm and then reflected by the retroreflector array on the ground. We measured the CO2 column concentrations over the 20 and 110 m long vertical path. Several single-point sensors were distributed at different heights to provide comparative measurements for the open-path TDLAS system. The results showed that the minimum detection limit of system was 0.52 ppm. Some similarities were observed in trends from the open-path TDLAS system and these sensors, but the average of these sensors was more consistent with the open-path TDLAS system values than the single-point measurement. These field measurements demonstrate the feasibility of open-path TDLAS for measuring the CO2 column concentration and monitoring carbon emission over large areas.

1. Introduction

Global warming has become an urgent environmental issue in the world. Anthropogenic emissions of greenhouse gases (GHGs) have a significant impact on global warming, and carbon dioxide (CO2) and methane (CH4) account for 66% and 16% of radiative forcing, respectively [1,2,3]. During the last decade (2009–2019), CO2 concentrations increased at the fastest observed decadal rate of change (2.4 ppm/year), which is higher than that during of any previous decade since direct atmospheric concentration measurements began in 1958 [4,5]. Measurement of the atmospheric CO2 column concentrations is valuable for understanding regional carbon emissions, sources, and sinks [6,7,8,9,10,11]. Therefore, it is crucial to measure CO2 column concentrations accurately to support ongoing efforts to reduce CO2 emissions.
Optical spectroscopy techniques have advantages of high sensitivity, good selectivity, continuous real-time detection, and the noninvasive nature of the measurement [12,13,14,15]. Since the 1990s, optical spectroscopy techniques based on open-path have been employed to measure trace gas column concentrations, such as Fourier transform infrared (FTIR) spectroscopy and differential optical absorption spectroscopy (DOAS). With sunlight, a lamp, or LEDs as the light source, researchers have developed FTIR and DOAS systems for measuring column concentrations of various trace gases simultaneously [16,17,18,19]. However, the broadband light source is disadvantageous to the improvement of spectral resolution, which limits gas detection sensitivity. FTIR and DOAS systems are complex and bulky and thus are not convenient for mobile measurement experiments.
By utilizing low-cost and robust distributed feedback (DFB) laser diodes that offer narrow spectral resolutions, tunable diode laser absorption spectroscopy (TDLAS) has the potential to achieve high sensitivities [20,21,22,23,24]. Open-path TDLAS offers a flexible, cost-effective sensing technology for measuring selected target gases in complex mixtures associated with evolving modern industrial applications [25,26]. Zimmerman et al. (2014) reported the construction and deployment of an open-path TDLAS sensor for pipeline and wellhead monitoring at a carbon capture and storage site [27]. The TDLAS sensor was used to measure CO2 concentrations along a fixed 100-m path and proved to be effective for use as an alarm-type system intended for personnel safety. Bailey et al. (2017) have developed an open-path TDLAS instrument with a DFB laser centered near 1572 nm [28]. They reported CO2 absorption measurements over a 200-m-long horizontal path to a retroreflector and compared the measurements with that from a single-point sensor at the field site; similar trends in diurnal cycles of CO2 concentration were observed. Xia et al. (2019) presented measurements of CO2 and CH4 over a 2.6-km-long horizontal path using an open-path TDLAS instrument [29]. The sensitivities of the instrument for CO2 and CH4 were evaluated as 20 ppm and 20 ppb, respectively. In addition, several other researchers have measured the average concentration of gases over a horizontal path. However, until now, open-path TDLAS was rarely used to measure the column concentration of trace gases along the vertical direction. Considering the advantages of open-path TDLAS, it is of great significance to apply it to the measurement of atmospheric CO2 column concentration for the long-term monitoring of CO2 over a large area. In the future, it can be used for all-day monitoring of CO2 column concentration through the appropriate meteorological observation stations and to analyze the spatial and temporal variation of CO2 in the regional atmosphere. Furthermore, it also helps us to control the CO2 emissions within a region, and even understand the climate change of the region. Therefore, measurement of CO2 column concentration in a large number of regions based on open-path TDLAS is valuable for improving climate warming.
In this paper, we present measurements of atmospheric CO2 column concentrations with an open-path TDLAS system that operates on a 2002.51 nm line. Direct absorption was further verified and was simpler and lower-cost than wavelength modulation spectroscopy, while achieving essentially calibration-free measurements. Hence, it was applied to establish the open-path TDLAS system. Atmospheric CO2 column concentrations over the 21 and 110 m long vertical path were measured. The signal-to-noise ratio (SNR) and minimum detection limit of the system were calculated to be 880 and 0.52 ppm. During the monitoring period, several single-point sensors were used to estimate the average concentration over the vertical path and compared with the open-path TDLAS system.

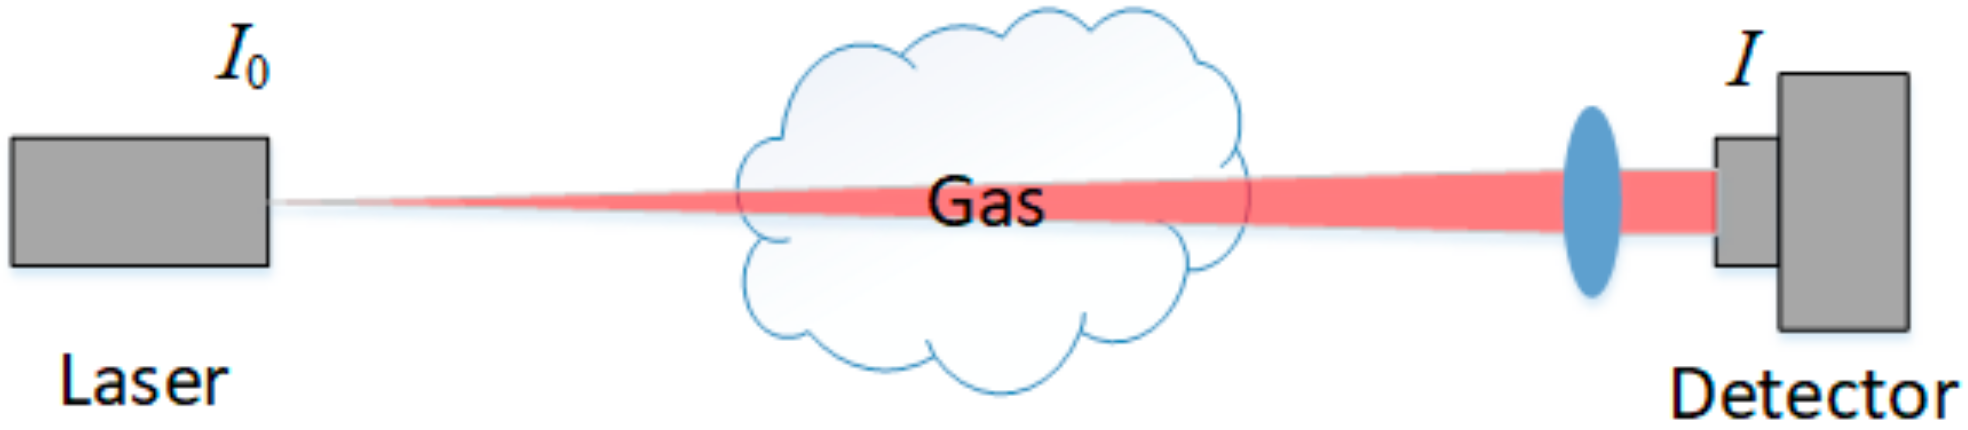
2. Theoretical Principle

When a laser beam passes through the gas medium, the intensity (I0) of the incident laser will decay exponentially due to the absorption of gas (Figure 1). The intensity (I) of the received laser on the detector can be described by the Lambert–Beer law.
I ( v ) = I 0 e k ( v ) L
where k(v) [cm−1] is the spectral absorption coefficient, expressed as
k ( v ) = P S ( T ) f ( v ) C
where P [atm] is the gas pressure; S(T) [cm−2atm−1] is the absorption line strength; f(v) [cm] is the line shape function, which can be normalized after modulated by a low frequency ramp voltage, i.e., + f ( v ) d v = 1 ; C [ppm] is the gas concentration. Therefore, we can obtain the integral absorbance, τ [cm−1], which can be expressed as
τ = + ln I 0 I d v = P S ( T ) L C
We can get S (T) [cm/molecule] in the HITRAN database, and it can be converted to S (T) [cm−2atm−1] as shown in Equation (4). By calculating the integrated absorbance (τ), the absorption line intensity (S (T)), the gas pressure (P), and the optical path (L), we can obtain the concentration of CO2 as follows.
S T cm - 2 · atm - 1 = S T cm / molecule · 7.34 × 10 21 molecule · K T K cm 3 · atm
C = τ P S ( T ) L
The direct absorption signal measurement method is simple and well verified, and it does not require to be calibrated with standard gas at different concentrations. Therefore, it can readily be applied in an open-path TDLAS experimental system.

3. Experimental Configuration

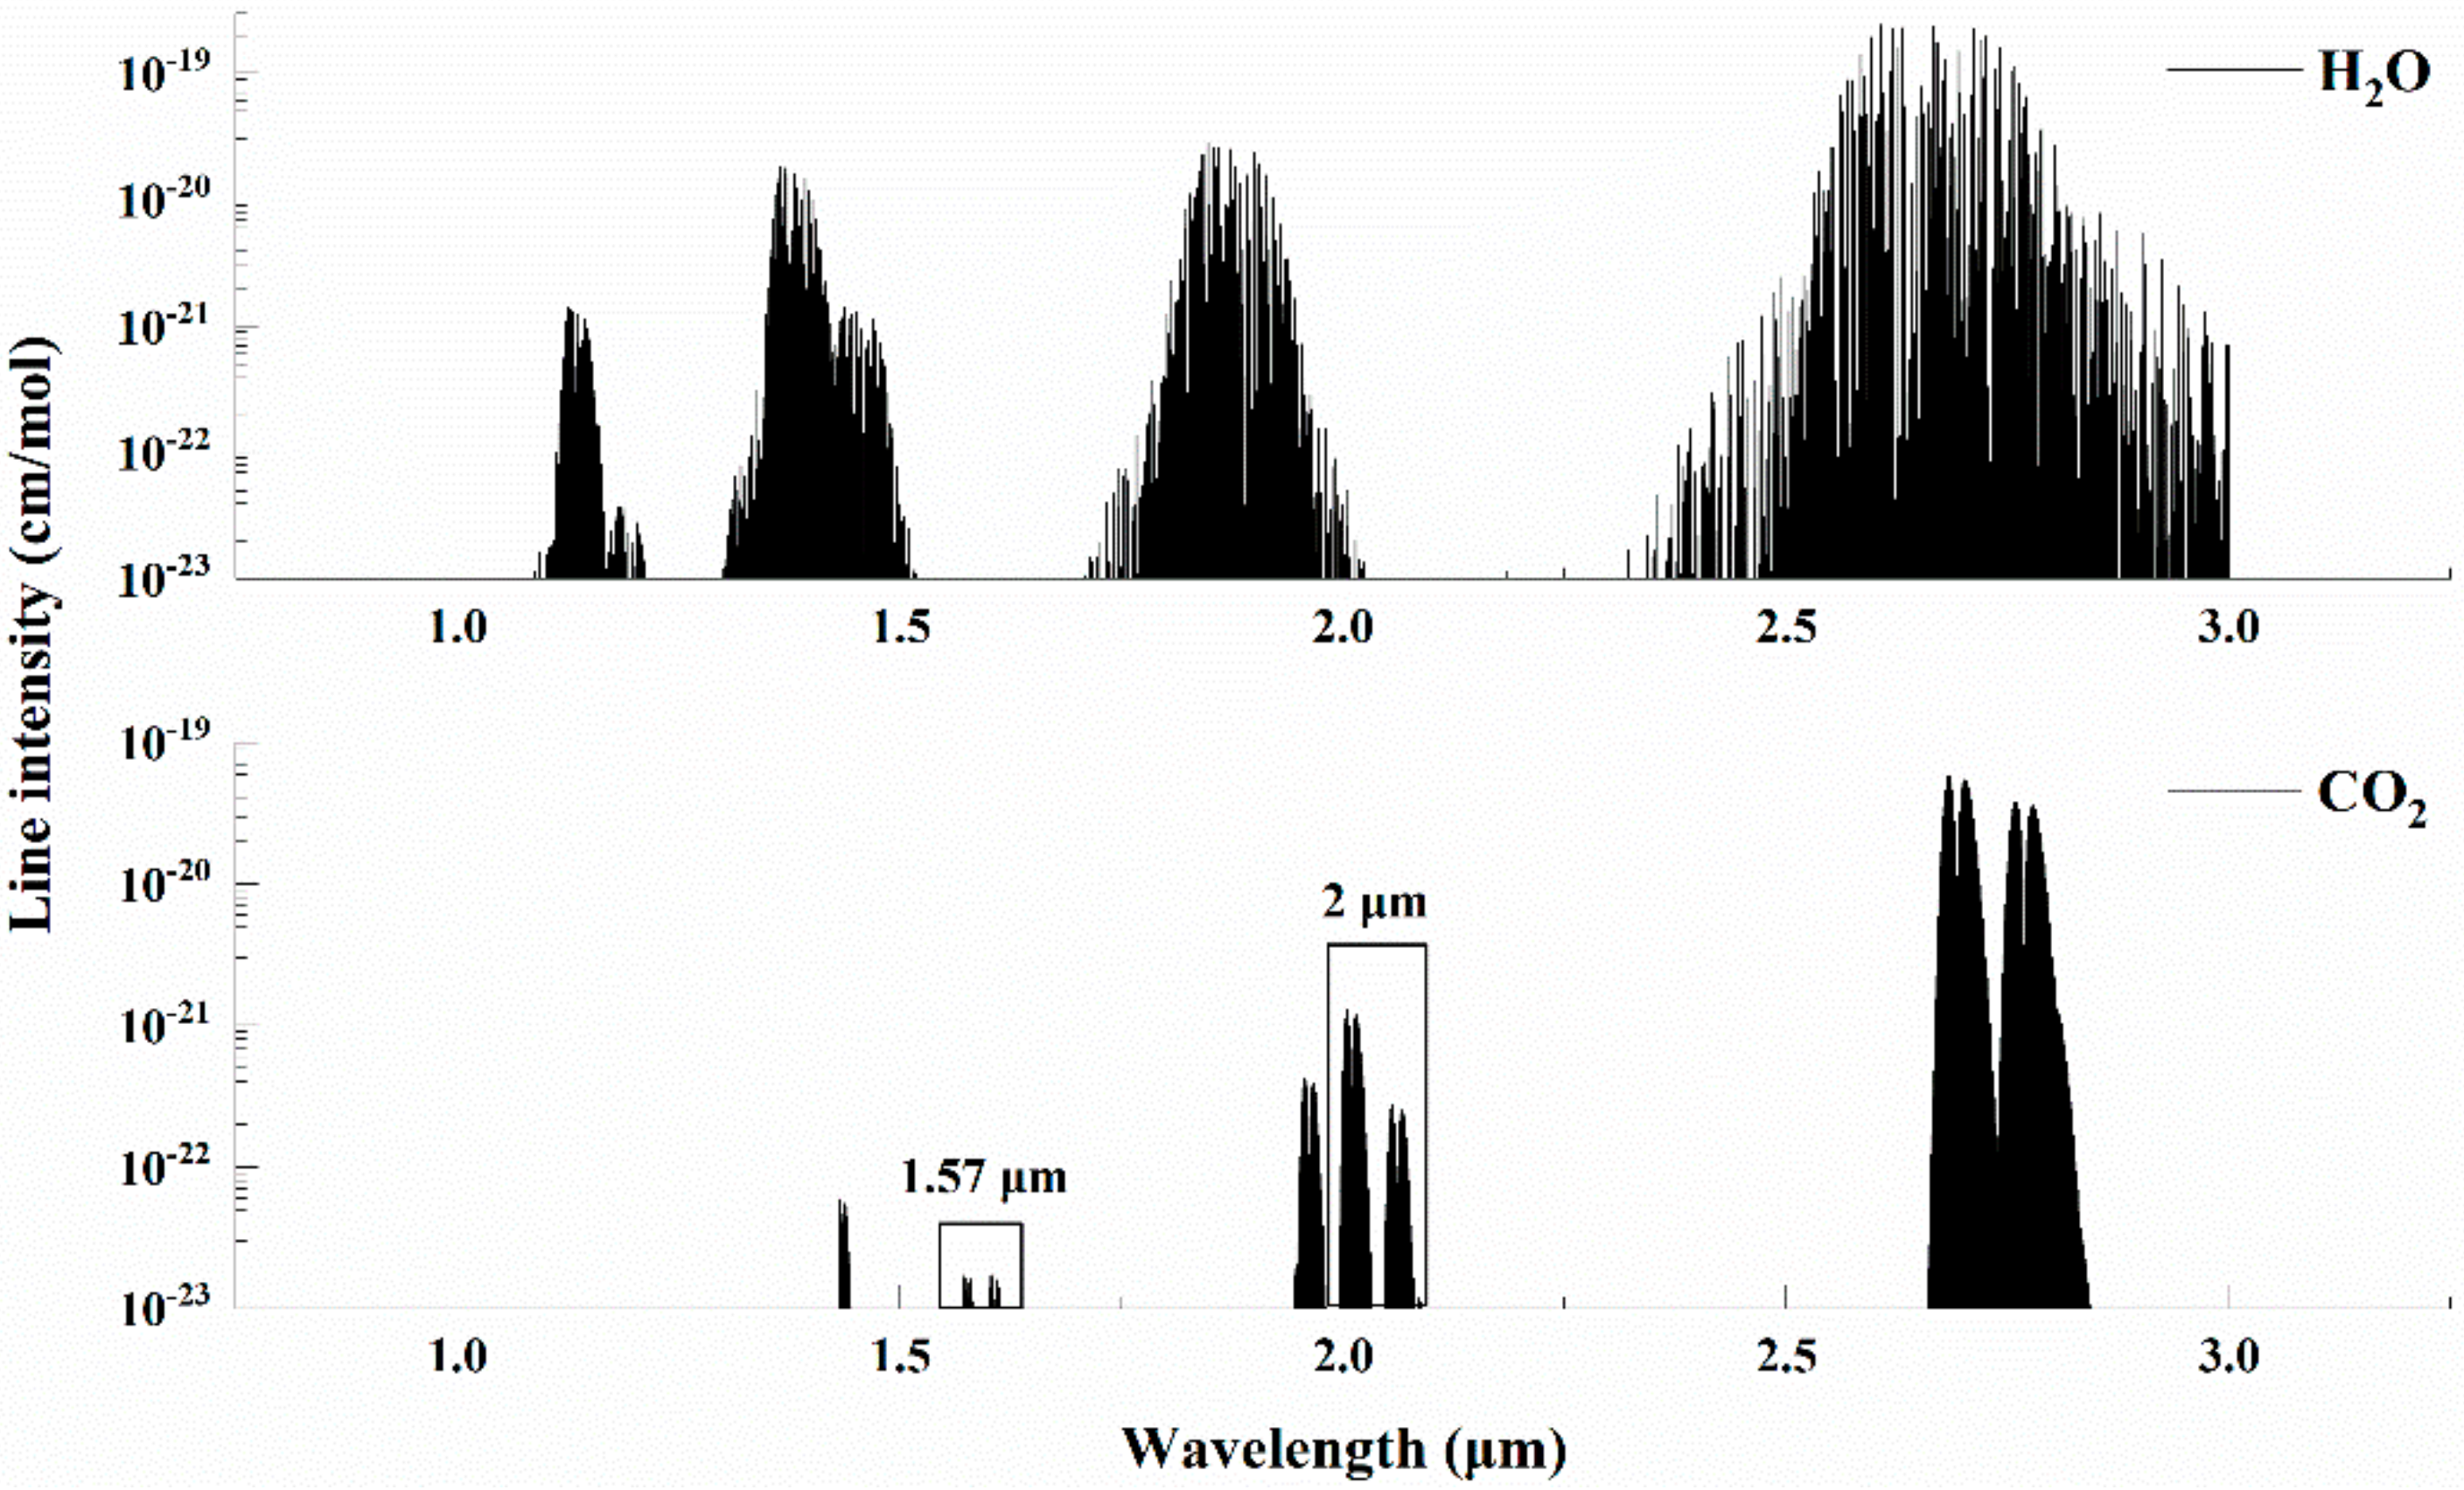
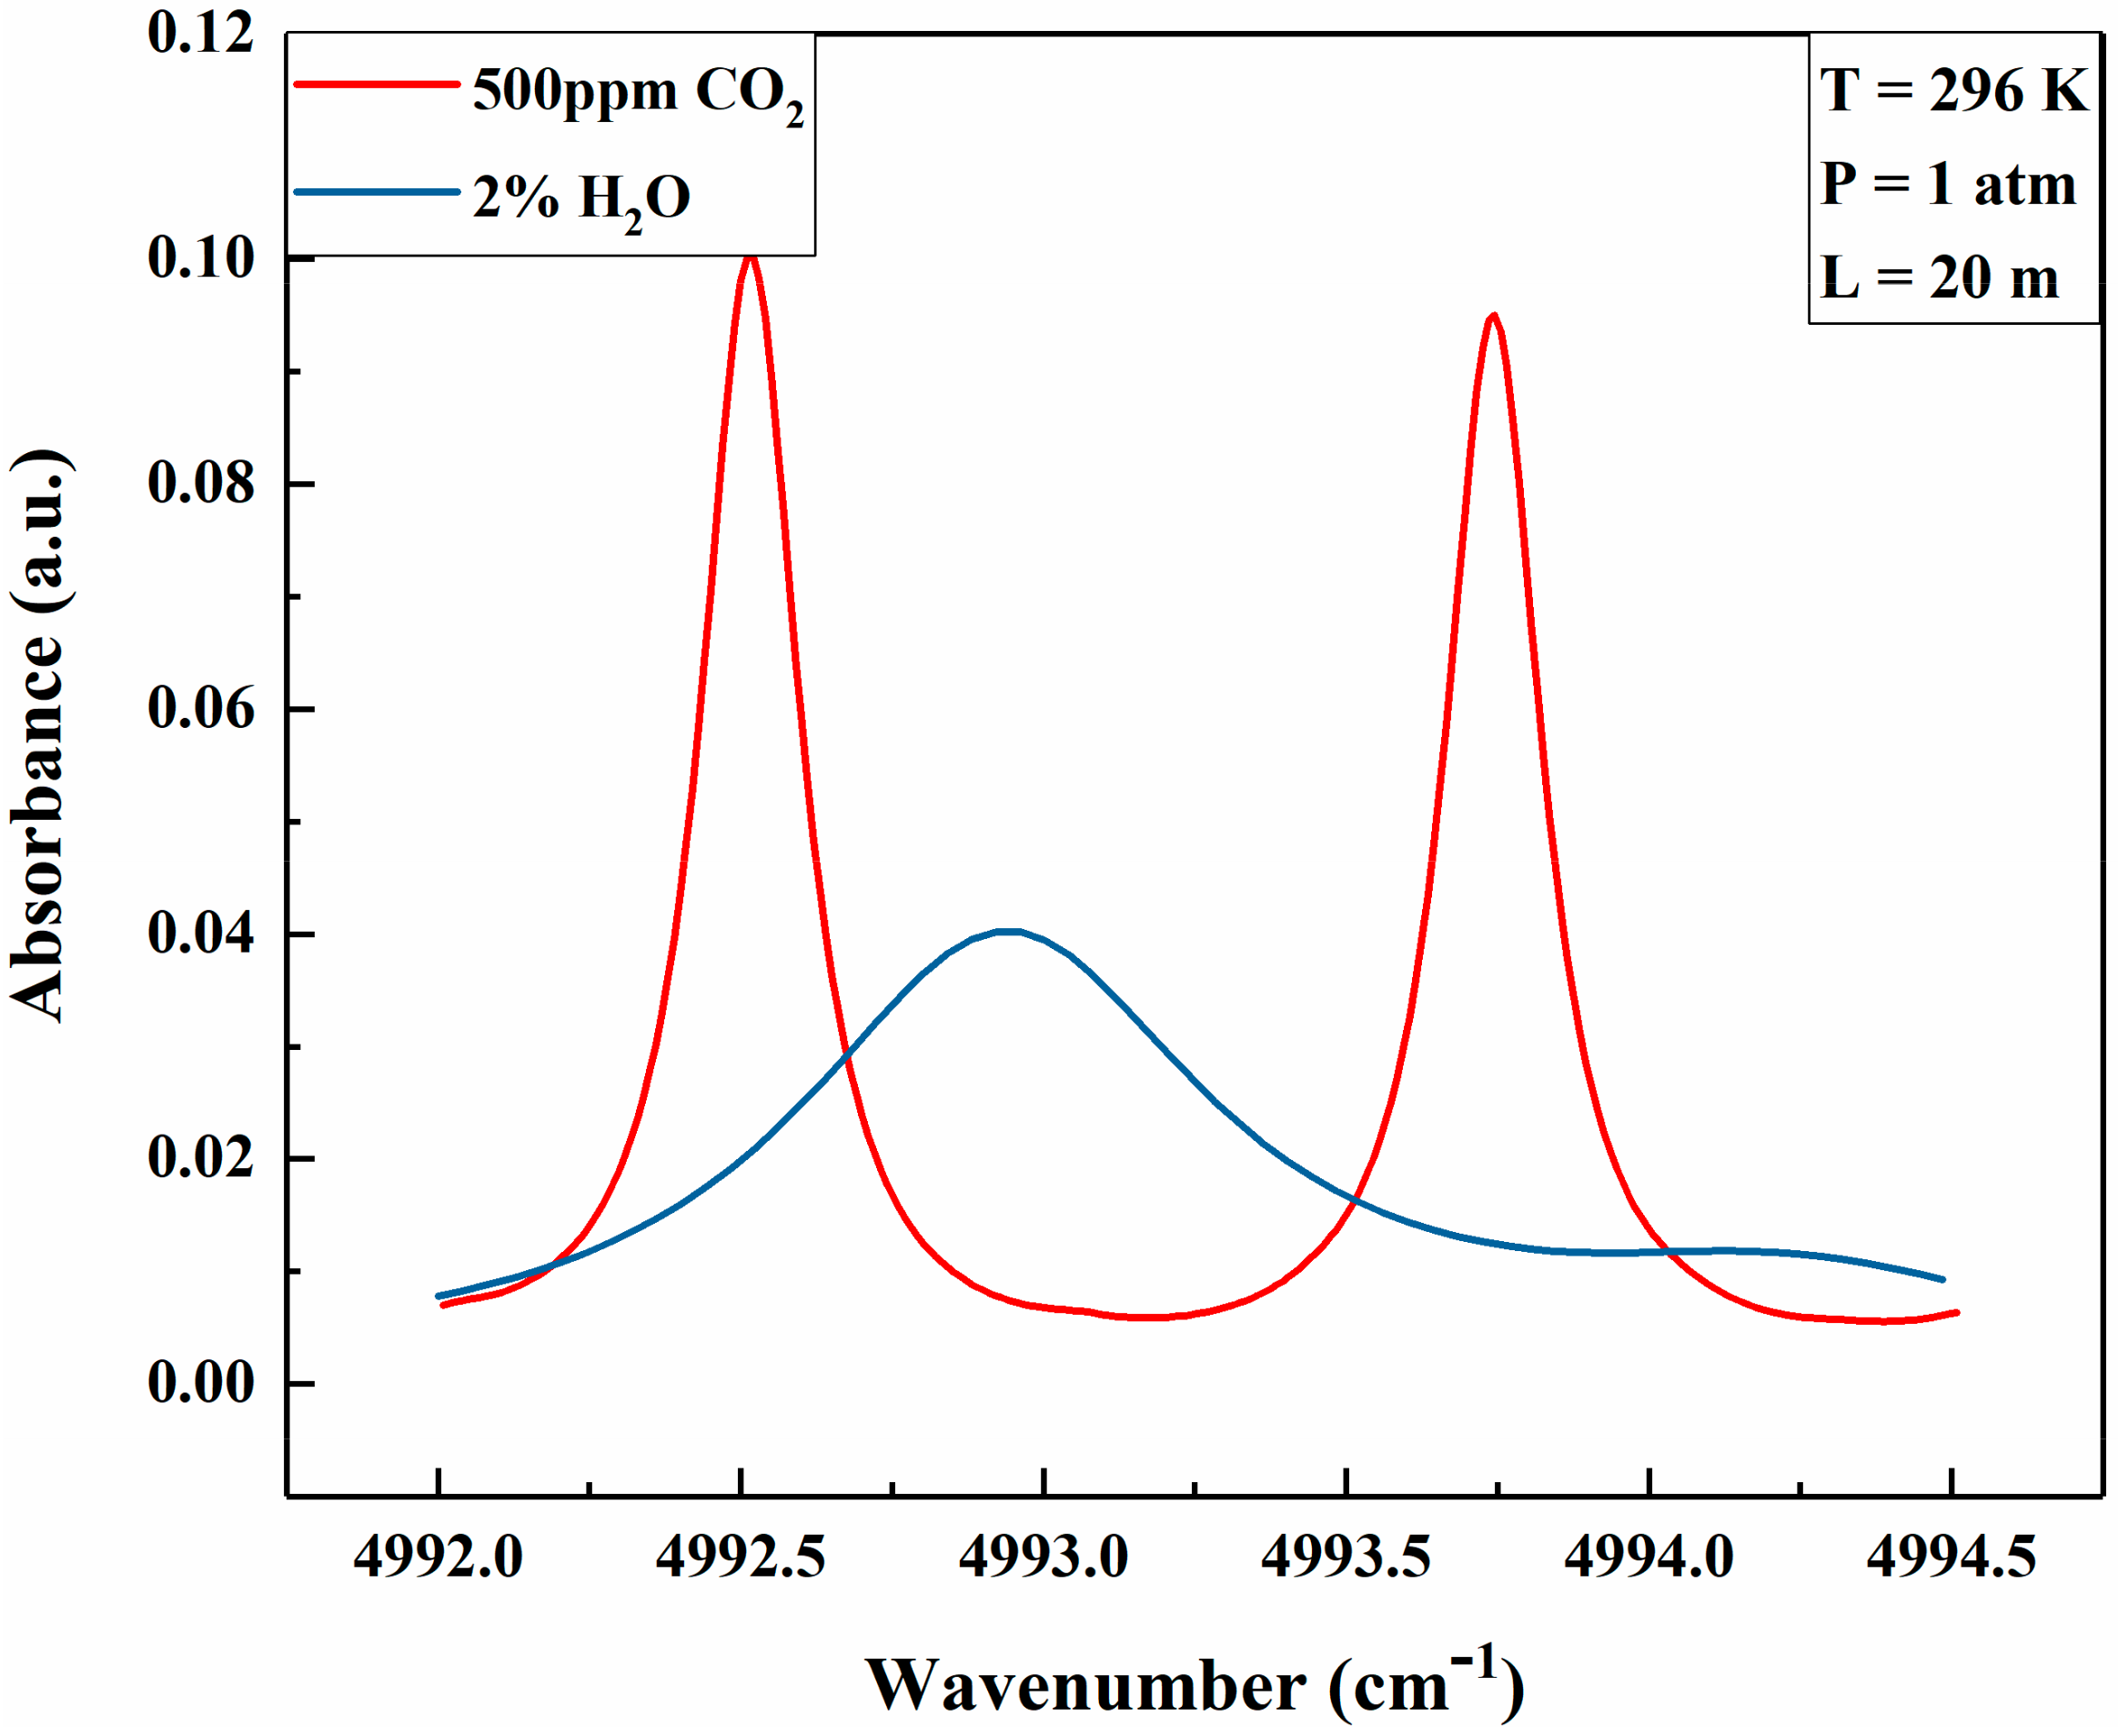
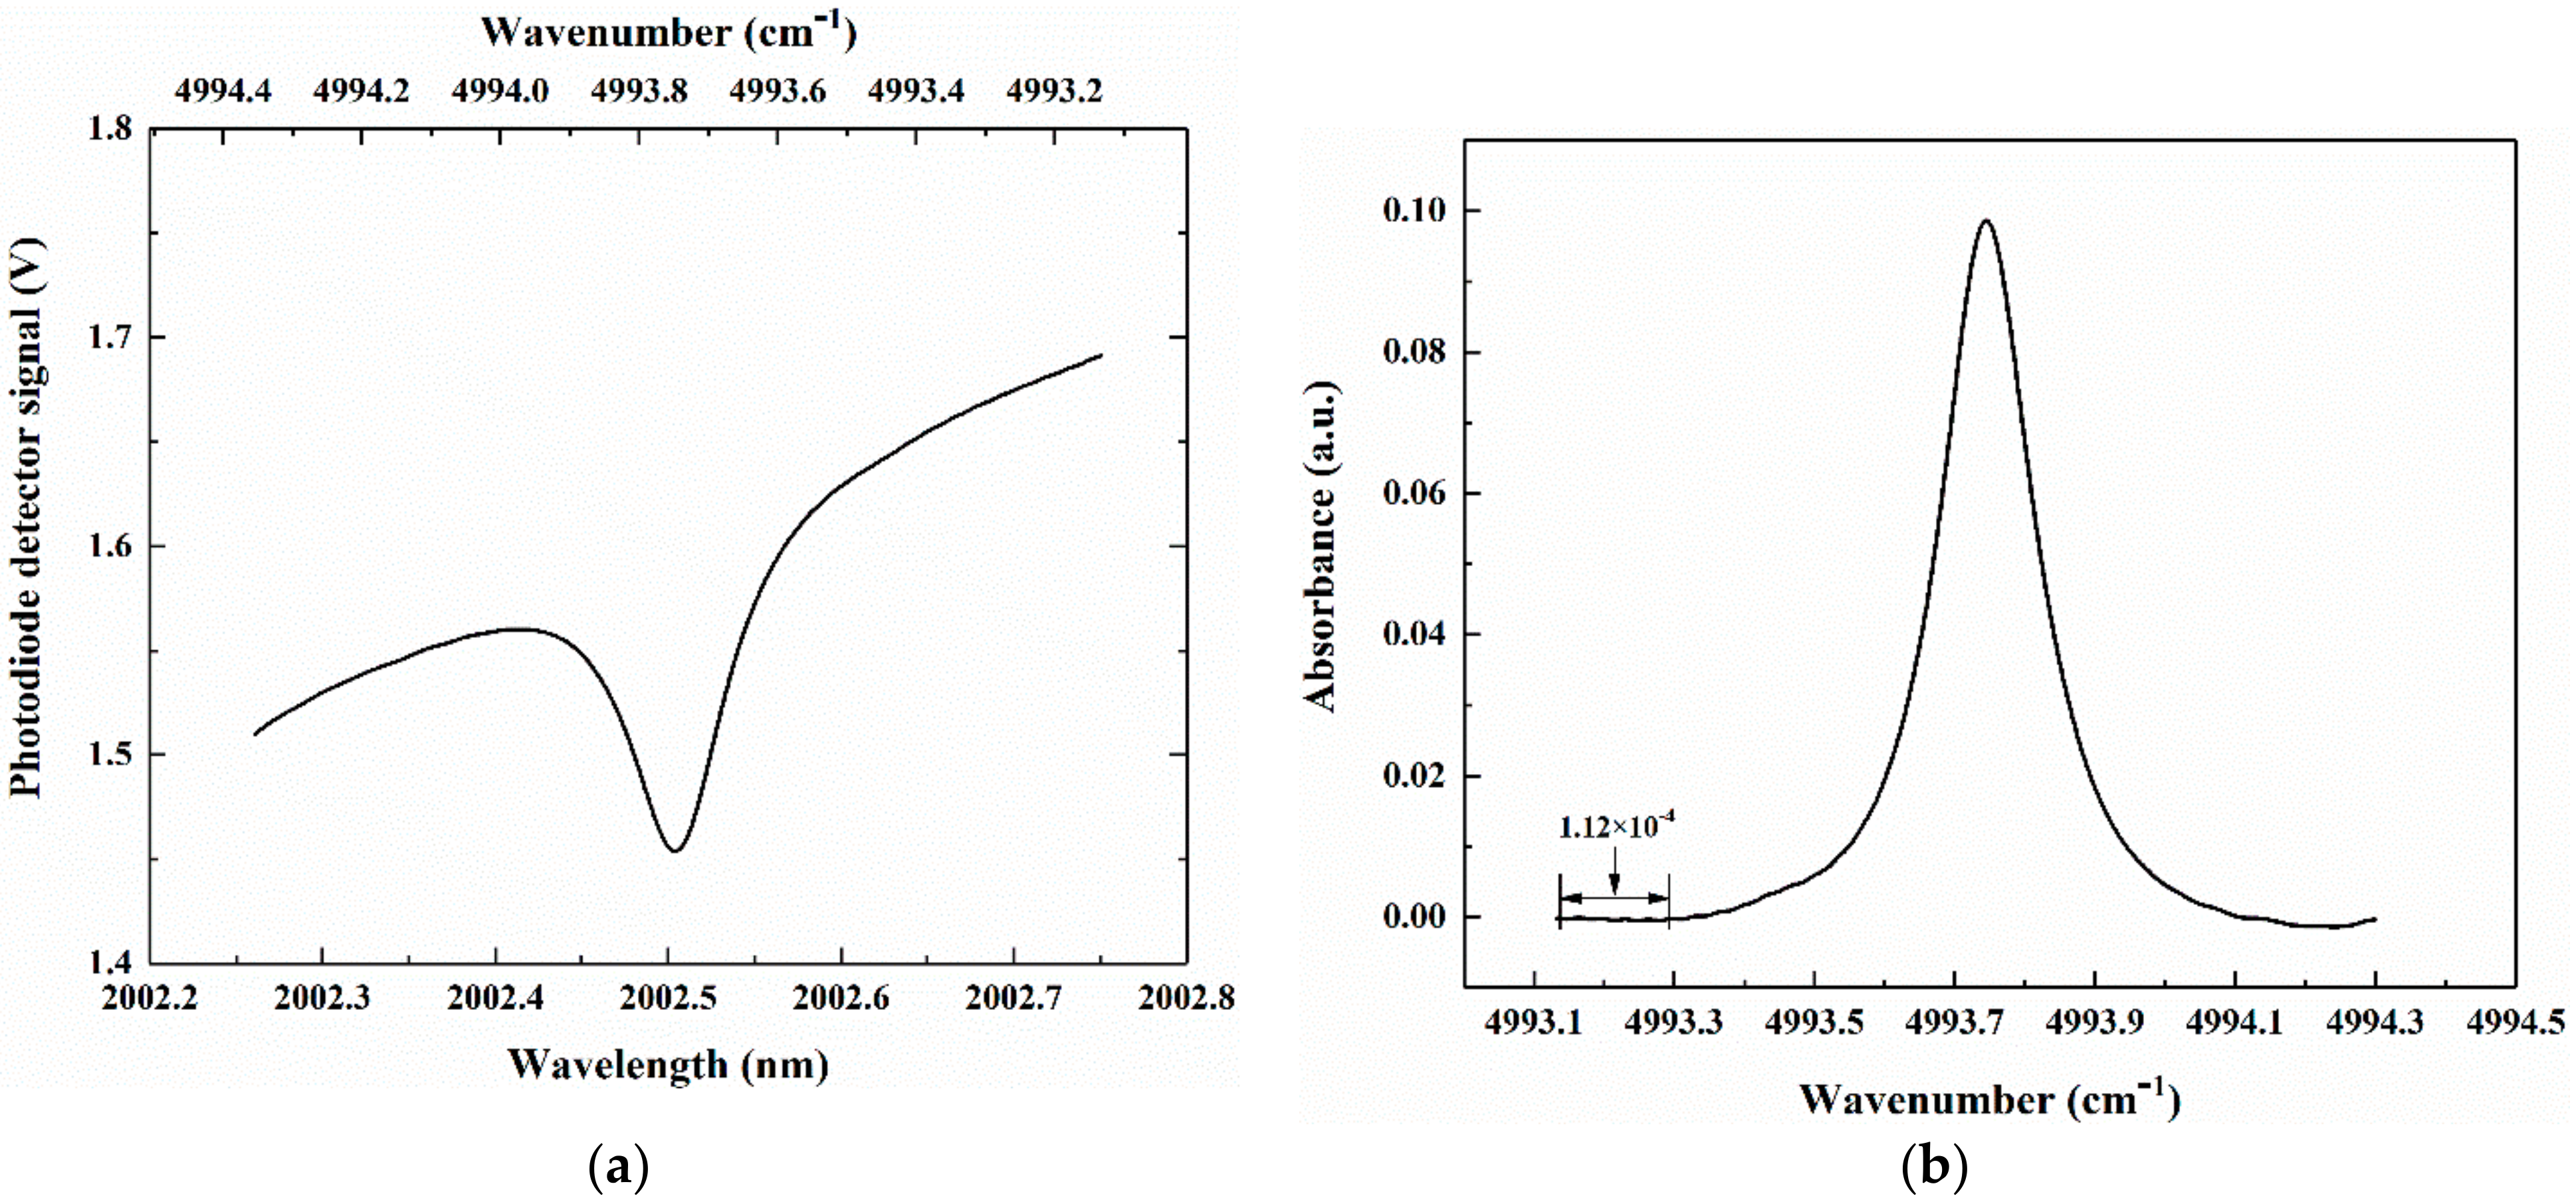
3.1. Selection of Carbon Dioxide Absorption Bands

The absorption band of CO2 was selected by considering the absorption line intensity and minimal interference from other species in the ambient air. Figure 2 shows the absorption bands of CO2 and H2O in the IR region based on the HITRAN2012 database [30]. As can be seen from Figure 2, CO2 absorption bands near 1.57 μm and 2 μm are free of H2O interference and can be used for measurements of CO2. However, the absorption line intensity of CO2 near 2 μm is at the level of 10−21 cm/mol, which is 2 orders larger than that of 1.57 μm, and thus is suitable for the direct absorption spectroscopy. The simulated absorbance of H2O and CO2 for a temperature of 296 K, 1 atm pressure, and 20 m optical path-length with fractional volumes of 2% of H2O and 500 ppm of CO2 (typical for ambient air) in the range of 4992 cm−1 to 4994.5 cm−1 were calculated with the HITRAN database, as shown in Figure 3. It was found that the absorbance located at 4992.52 cm−1 (2003.00 nm) and 4993.74 cm−1 (2002.51 nm) were close to each other, but the absorption line located at 4993.74 cm−1 had less overlap with H2O than that of 4992.52 cm−1. Therefore, the absorption line of CO2 centered at 4993.74 cm−1 (2002.51 nm) was selected in this research.

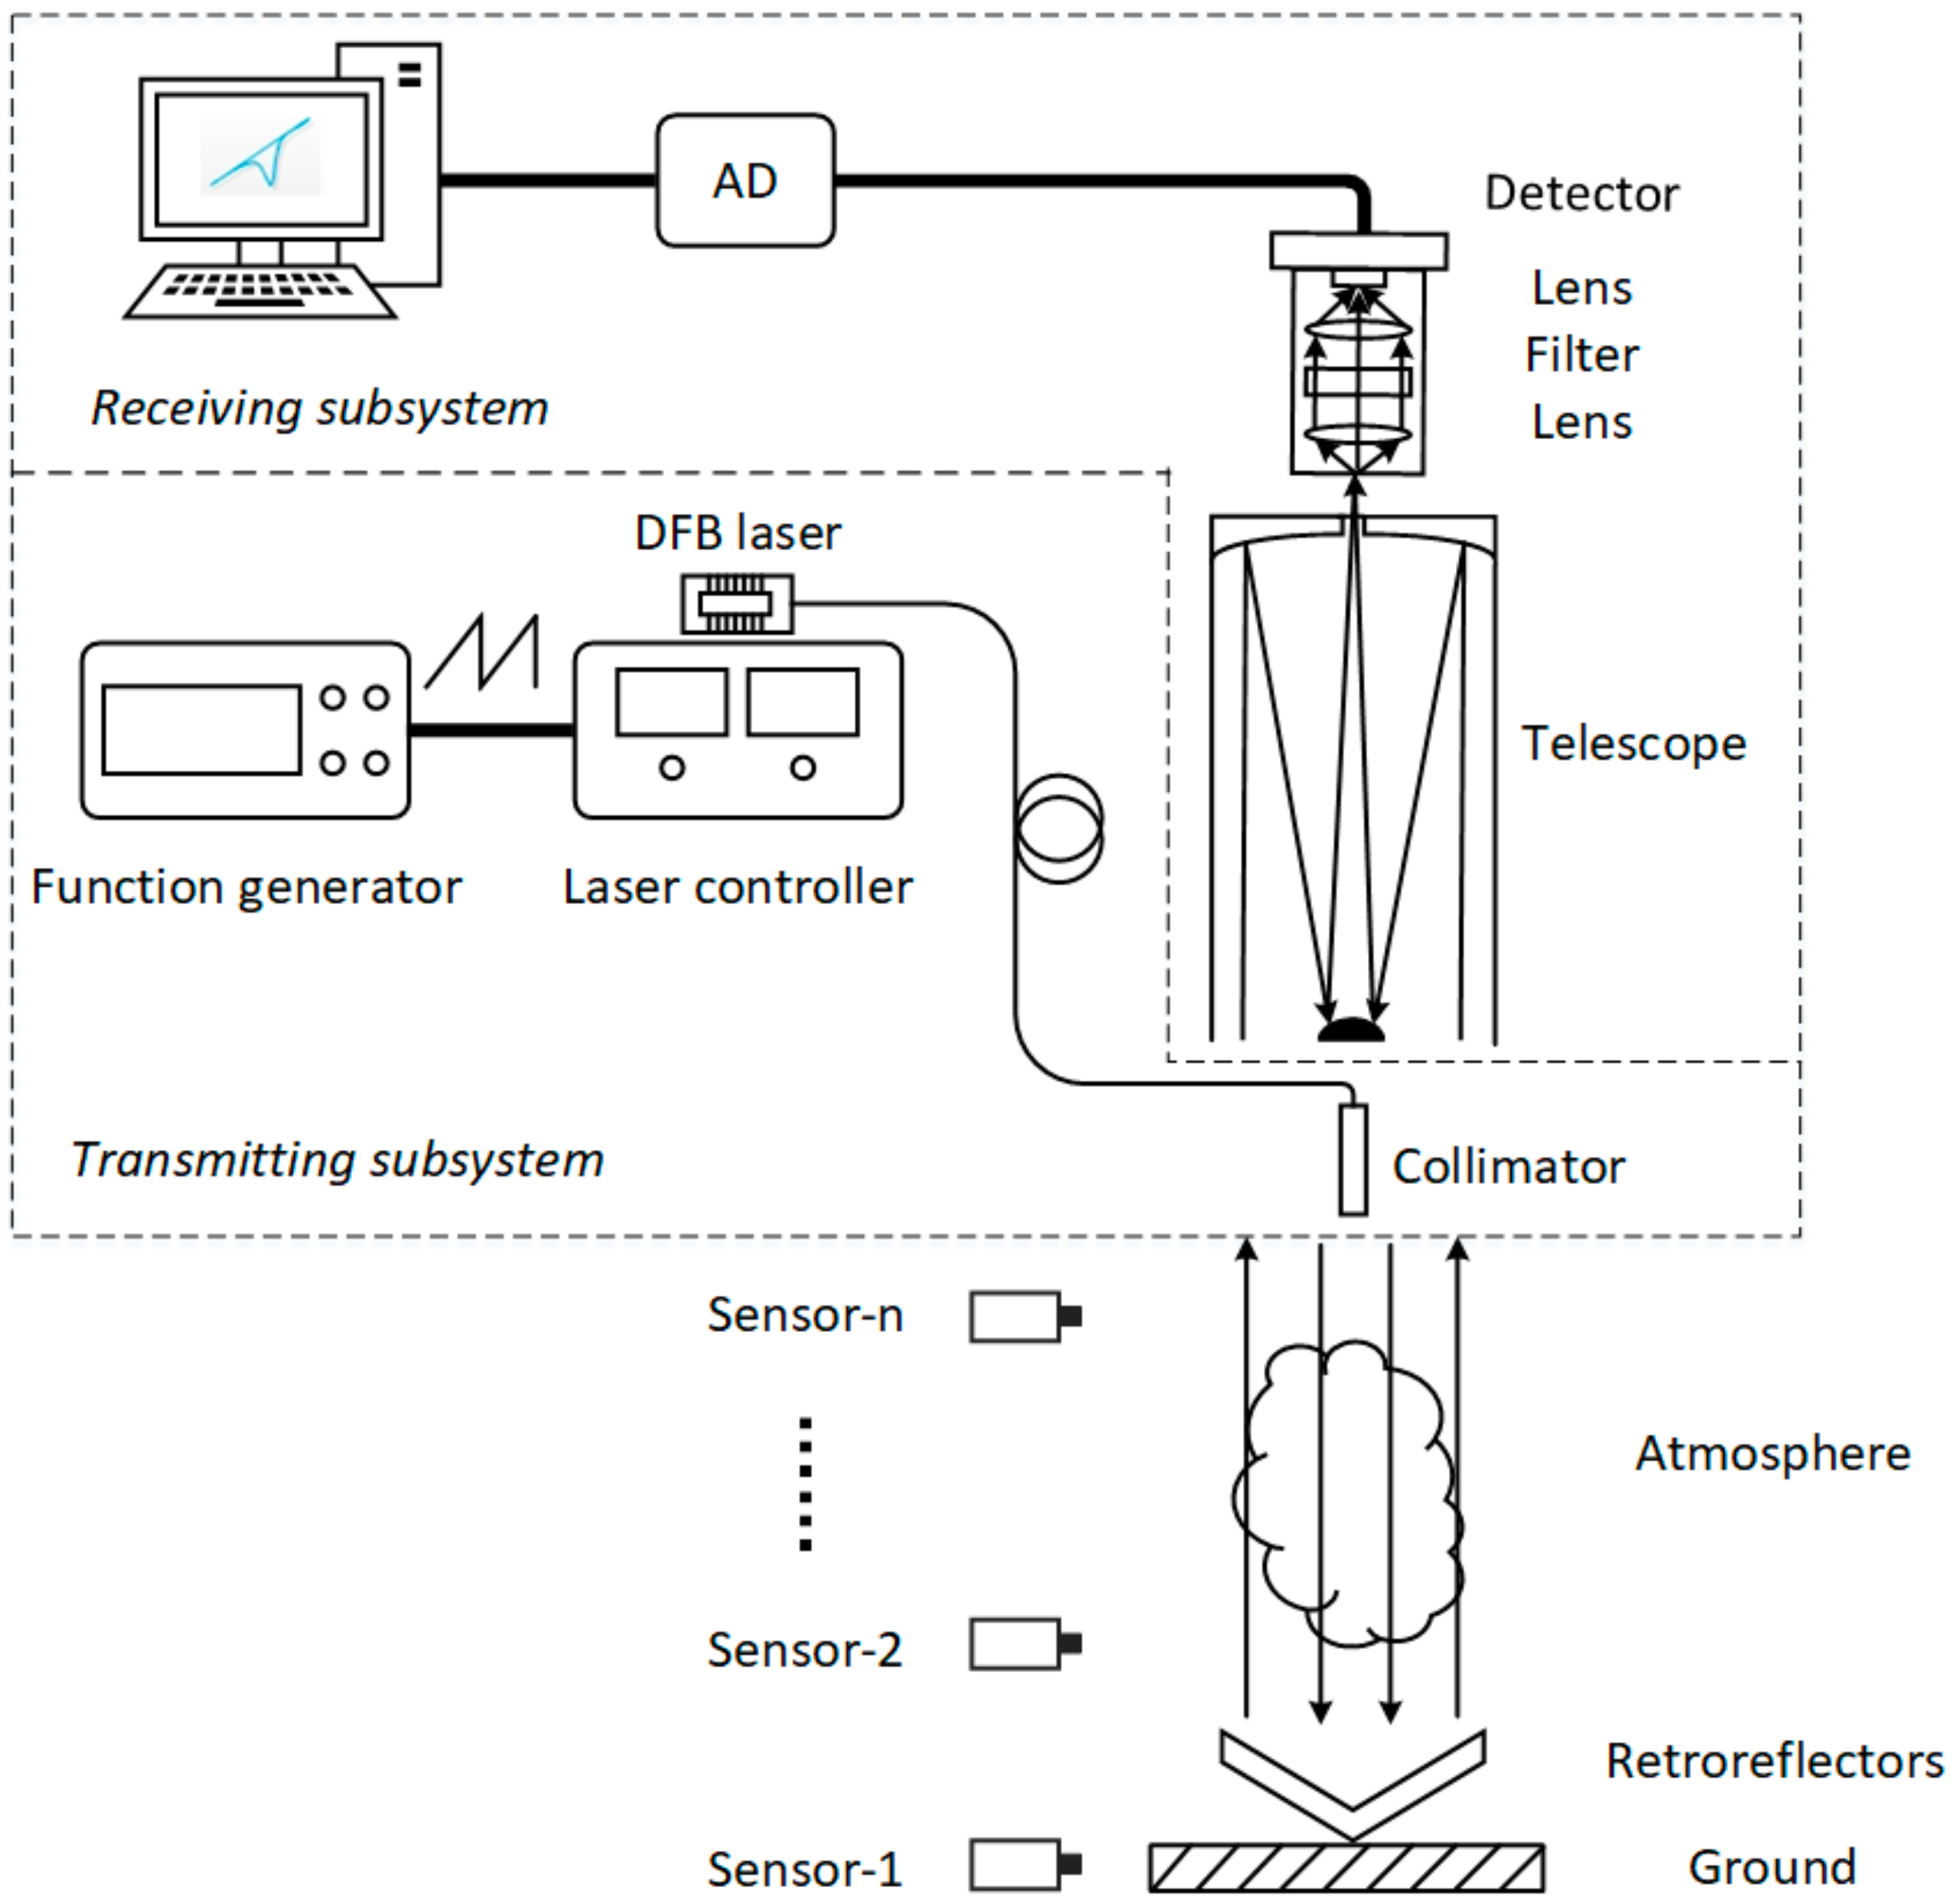
3.2. Experimental Set-Up

The schematic diagram of the open-path TDLAS system is shown in Figure 4. A single-mode continuous DFB laser (Nanosystems and Technologies GmbH, Gerbrunn, Germany) with a fiber tail was selected as the laser source, with a wavelength of ≈2 μm corresponding to the absorption spectrum of carbon dioxide; the output power was 5.8 mW. A commercial laser diode controller (LDC-3724C, ILX Lightwave, Monroeville, AL USA) was selected as the laser driver to control the temperature and current of laser with high stability and low noise. After it was tuned by a ramp signal from a function generator, the laser beam was emitted downward to the retroreflector array on the ground, which was composed of seven same-size retroreflectors of 64 mm in diameter. The reflected laser beam was received by a telescope before passing through a lens and a bandpass filter with a 10 nm spectral width and focused by a lens on a PIN photodiode detector (PDA10D-EC, Thorlabs Corp., Newton, NJ, USA). The detector converted the received optical signal into an electrical signal. The electrical signal was acquired by an AD acquisition card (NI 9215, National Instruments, Roscoe, IL, USA) at 16-bit, and CO2 concentration was obtained after processing the data. To assess the accuracy of CO2 concentrations in a vertical open-path measured by the TDLAS system and the differences of atmospheric CO2 concentrations at different heights, several single-point sensors were placed at different locations along the vertical path.

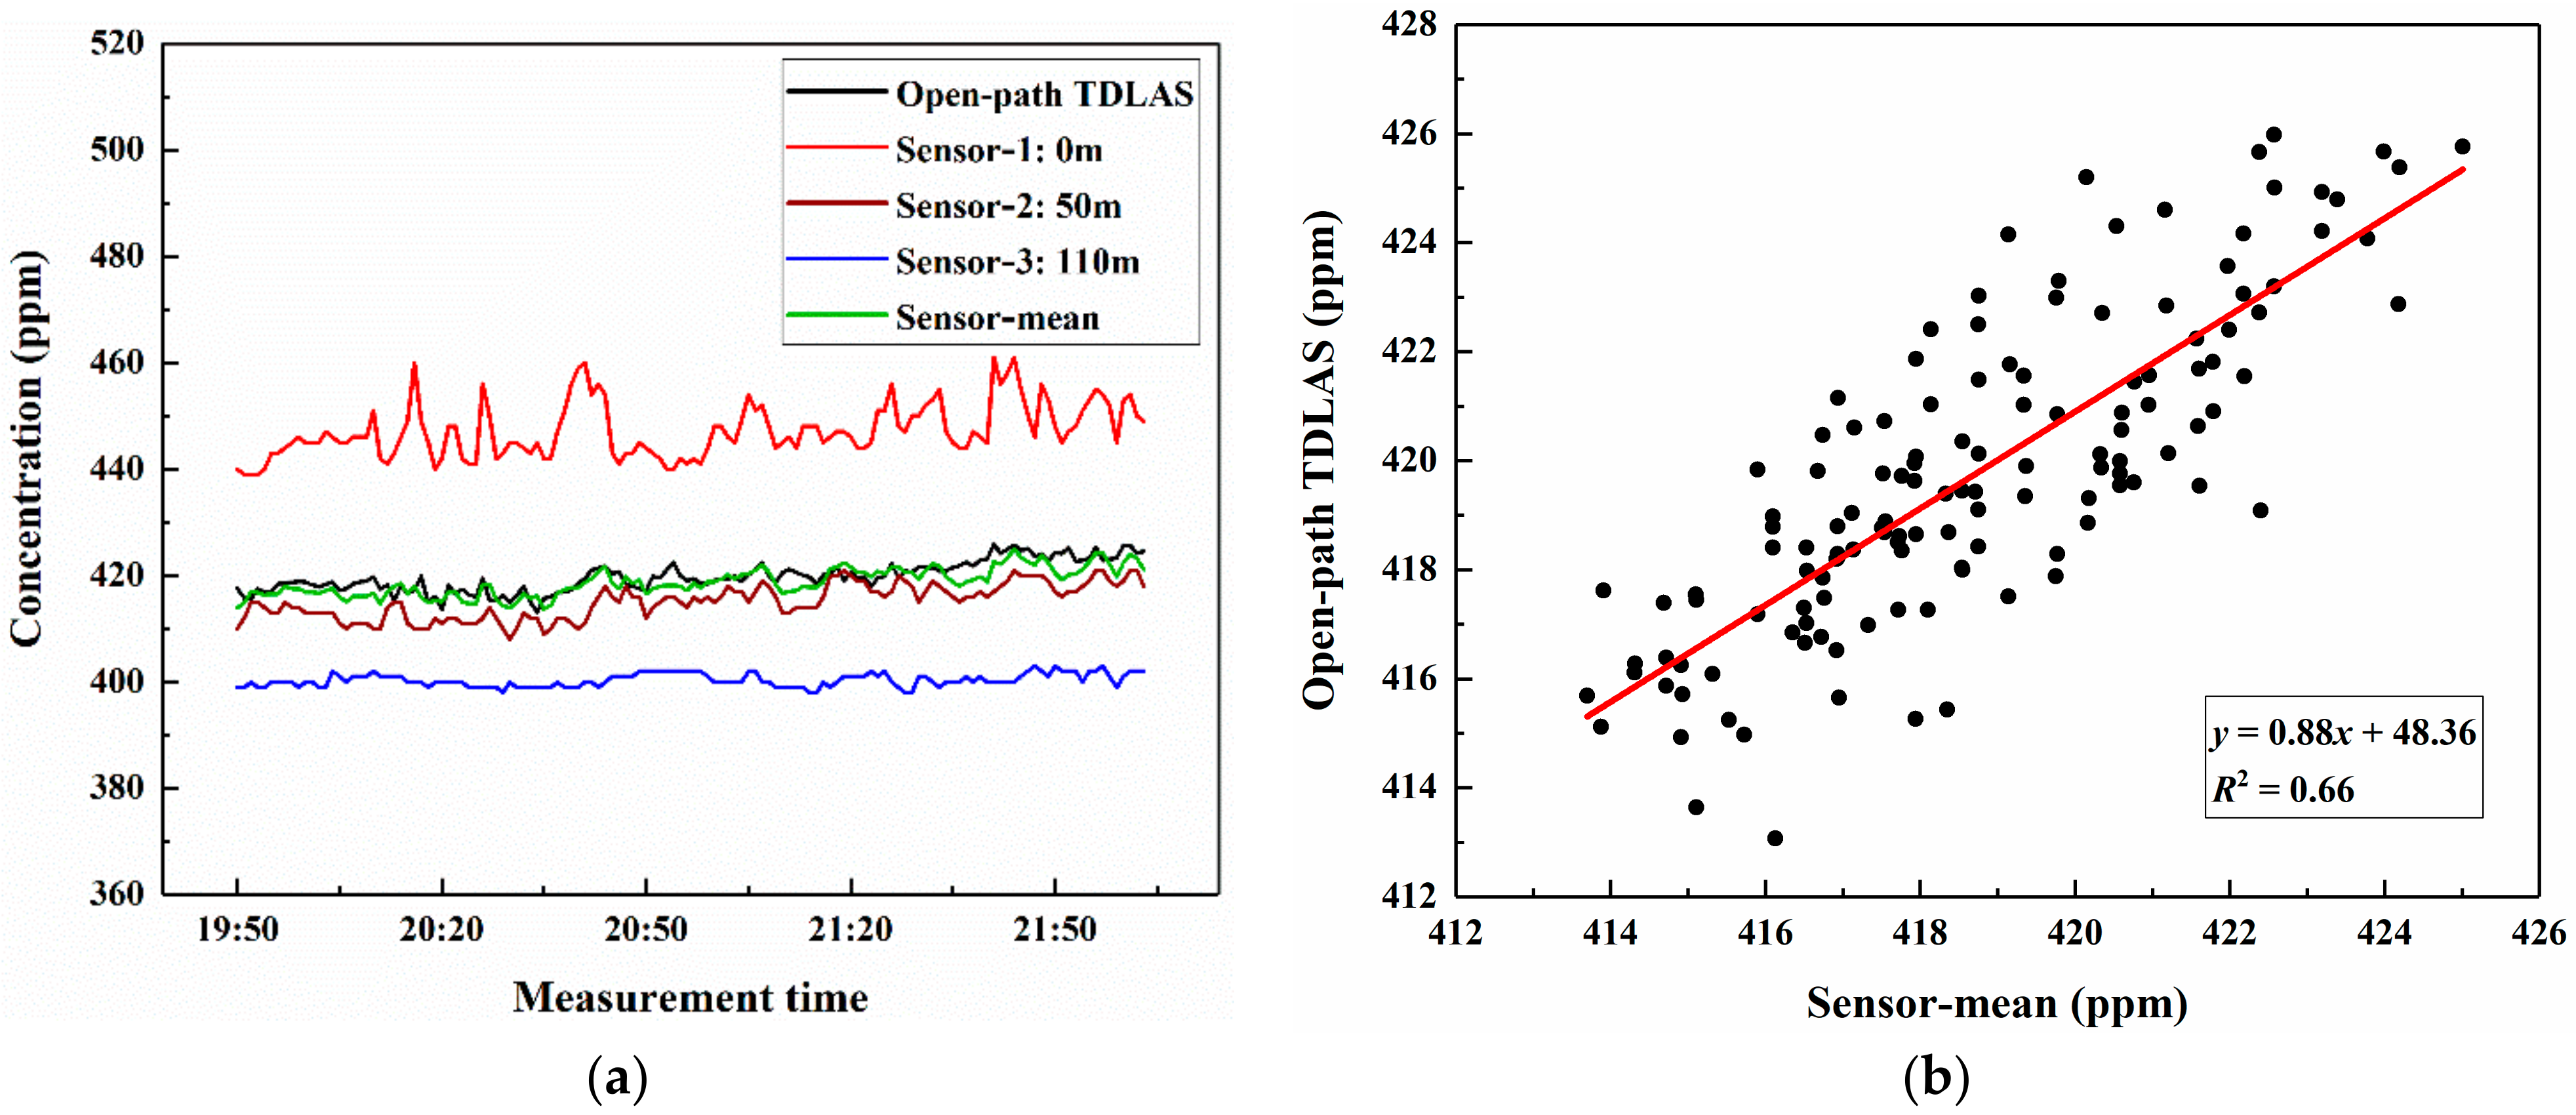
4. Measurements and Results

The open-path TDLAS system transmitted a laser vertically toward the ground through the window of a laboratory located at Ocean University of China, Yushan campus (36.0685° N, 120.3435° E). The path length measured with a laser rangefinder was 21 m. Two handheld non-dispersive infrared single-point sensors (AZ-7752, AZ Instrument Corp., Taipei, Taiwan) were used to measure CO2 concentrations at different heights. One was placed on the ground and the other was placed around the system, which were called sensor-1 and sensor-2, respectively. To ensure the accuracy of measurement results, a commercial gas analyzer (UGGA, Los Gatos Research, San Hose, CA, USA) was used to calibrate each AZ7752 sensor based on off-axis integration cavity output spectroscopy (OA-ICOS). Results of the calibration experiment can be found in the author’s previous study [31]. The numerical deviation between two sensors was within 3 ppm, as shown in Figure 5.
The temperature and current of the laser were controlled to be 31.4 °C and 90 mA, respectively. The ramp voltage amplitude varied from −350 mV to 500 mV, so that the absorption line of CO2 that was centered at 4993.74 cm−1 occurred in the range of the scan, as shown in the signal received using the photodiode detector (Figure 6). The 1-σ background noise was determined to be 1.12 × 10⁻⁴, by calculating the standard deviation of the non-absorption wing of measured CO2 absorbance. The SNR of 880 was determined based on the ratio of the maximal amplitude of measured CO2 absorbance to the 1-σ background noise. In addition, the integral absorbance (τ) was obtained to be 2.5 × 10⁻², and CO2 concentration was calculated to be 458.89 ppm, according to Equation (5). Therefore, the minimum detection limit was 0.52 ppm, which confirms that the system can be used to measure the atmospheric CO2 concentration.
The measured CO2 concentrations over the 21-m-long vertical path were presented in Figure 7a. During the measurement time, the outdoor weather was fine and there was no rain or snow and other bad weather. The temperature was in the range of 31.1 °C to 30.2 °C, and the atmospheric pressure was stable at 100.1 kPa. The results showed that the measured concentration of the open-path TDLAS system and the two sensors have a consistent variation trend, but there were some differences in the values. Under the influence of atmospheric diffusion, CO2 molecules were not uniformly distributed in the vertical direction. As the height increases, CO2 concentration was less affected by ground emission sources. Therefore, the concentration measured by sensor-2 located at 21 m height was lower than that measured by sensor-1 on the ground. The results of the TDLAS system were larger than the average atmospheric value (≈410 ppm) because CO2 concentration is susceptible to human activities and vegetation on campus within the 21-m-long vertical measurement path. These values varied between 455 ppm and 475 ppm, which were similar to the average values (sensor-mean) of the two sensors’ measurements. Correlation analysis was conducted between the TDLAS system and sensor-mean, and the determination coefficient (R2) was 0.8, as shown in Figure 7b, which indicates that the concentration measured by them has good consistency.
To estimate the atmospheric CO2 column concentration over a large area, we carried out an experiment over a 110-m-long vertical path. The open-path TDLAS system was moved to a residential building located in the Binhai Garden community (36.0693° N, 120.3888° E). The collimated laser was transmitted vertically downward through a window on the 33rd floor. In addition to the sensors on the ground and at the top of the vertical path, an AZ7752 sensor was placed on the 15th floor to measure the atmospheric CO2 concentration at a 50 m height. The weather was fine, with temperature and pressure stable at 24.2 °C and 100.8 kPa, respectively. As shown in Figure 8a, the CO2 column concentration measured by the TDLAS system was about 420 ppm and remained almost constant, showing smaller relative variations compared to that over the 21-m-long vertical path. The results indicated that the values of the TDLAS system were markedly different from that of the three sensors. Due to interference by passing cars and pedestrians, some sharp spikes occurred in the results of sensor-1. However, as shown by sensor-2 and sensor-3, CO2 concentration and its fluctuation amplitude decreased with the increase of height, so the results of each sensor were not representative of the average concentration over the large area. Furthermore, the column concentrations measured by the TDLAS system were close to the average values of the three sensors in this experiment, and the determination coefficient (R2) was also calculated with a value of 0.66, as depicted in Figure 8b.

5. Discussion

Through the above two groups of CO2 column concentration measurements with vertical paths of different length, the continuous monitoring of CO2 concentration over different scales were carried out for a few hours. The results of previous open-path techniques research and our work are summarized in Table 1. The minimum detection limit of the system was calculated to be 0.52 ppm, which is better than previous research, indicating that the feasibility of detecting CO2 concentration along the vertical direction based on open-path TDLAS. In addition, we will increase detection distance to measure CO2 concentration over larger areas.
The average of multiple single-point sensors located at different heights was applied to denote CO2 concentrations in the region approximately. Compared with the results of each sensor, the average of these sensors was more consistent with the column concentration measured by the TDLAS system. The determination coefficient between TDLAS and sensor-mean over the 110-m-long vertical path was not as good as that over the 21-m-long vertical path. Partially, the three sensors may not adequately represent the average CO2 concentration over the large area. In the future, we will use more point sensors and do more work on monitoring CO2 concentration over large areas based on open-path TDLAS.

6. Conclusions

In this paper, an open-path measurement system was built to measure atmospheric CO2 column concentrations based on TDLAS. The minimum detection limit was evaluated to be 0.52 ppm, indicating the feasibility of open-path TDLAS system. The atmospheric CO2 column concentrations over a 21-m-long vertical path and a 110-m-long vertical path were monitored within a few hours, respectively. The results showed that the column concentration over the 110-m-long path was more stable than that over the 20-m-long path, meeting the average value of atmospheric CO2. Several single-point sensors were placed in different positions of the vertical path to carry out the comparative experiment. The difference of these sensors’ readings indicates the non-uniformity of CO2 concentrations in the vertical direction. The average of several sensors was consistent with the result of the TDLAS system, and the determination coefficients were 0.8 and 0.66 in the two sets of experiments. Their correlation can be improved by increasing the number of sensors for future experiment over large areas. The developed open-path TDLAS system provides a convenient way of measuring the CO2 column concentration in the regional atmosphere and the possibility for monitoring CO2 emission over a large area.

Author Contributions

Conceptualization, F.X. and J.G.; methodology, F.X. and J.L.; validation, J.G. and Z.L.; formal analysis, J.L.; investigation, F.X.; data curation, F.X. and J.L.; writing—original draft preparation, F.X.; writing—review and editing, F.X., J.L., J.G., D.Y., Y.W., and Q.T.; project administration, F.X. and J.L.; funding acquisition, J.L., J.G., and Z.L. All authors have read and agreed to the published version of the manuscript.

Funding

This research was funded by the Natural Science Foundation of China (NSFC) (21703124), the Natural Science Foundation of Shandong Province (ZR2018BF031, ZR2018BF032), the Youth Fund Project of Shandong Academy of Sciences (2020QN006, 2019QN0027), and the program of Impact and Response of Antarctic Seas to Climate Change (IRASCC2020-2022).

Institutional Review Board Statement

Not applicable.

Informed Consent Statement

Not applicable.

Data Availability Statement

Data sharing not applicable.

Acknowledgments

We would like to thank Jinbao Xia for his help over the course of the experiment. We are grateful to the reviewers for their suggestions and comments, which significantly improved the quality of this paper.

Conflicts of Interest

The authors declare no conflict of interest.

References

  1. Pachauri, R.; Reisinger, A. Climate Change 2014: Synthesis Report. Contribution of Working Groups I, II and III to the Fifth Assessment Report of the Intergovernmental Panel on Climate Change. J. Rom. Stud. 2014, 4, 85–88. [Google Scholar]
  2. Pelletier, C.; Rogaume, Y.; Dieckhoff, L.; Bardeau, G.; Pons, M.; Dufour, A. Effect of combustion technology and biogenic CO2 impact factor on global warming potential of wood-to-heat chains. Appl. Energy 2019, 235, 1381–1388. [Google Scholar] [CrossRef]
  3. Petit, J.-R.; Raynaud, D. Forty years of ice-core records of CO2. Nat. Cell Biol. 2020, 579, 505–506. [Google Scholar] [CrossRef] [PubMed] [Green Version]
  4. Butler, H.; Montzka, S. The NOAA Annual Greenhouse Gas Index (AGGI). Updated: Spring 2020. Available online: https://www.esrl.noaa.gov/gmd/aggi/aggi.html (accessed on 23 January 2021).
  5. Bowen, J.; Ward, C.; Kling, G.; Cory, R. Arctic Amplification of Global Warming Strengthened by Sunlight Oxidation of Permafrost Carbon to CO2. Geophys. Res. Lett. 2020, 47, 1–8. [Google Scholar] [CrossRef]
  6. Abshire, J.; Riris, H.; Weaver, C.; Mao, J.; Allan, G.; Hasselbrack, W.; Browell, E. Airborne measurements of CO2 column absorption and range using a pulsed direct-detection integrated path differential absorption lidar. Appl. Opt. 2013, 52, 4446–4461. [Google Scholar] [CrossRef]
  7. Qin, X.; Nakayama, T.; Matsumi, Y.; Kawasaki, M.; Ono, A.; Hayashida, S.; Imasu, R.; Lei, L.; Murata, I.; Kuroki, T.; et al. Ground-based measurement of column-averaged mixing ratios of methane and carbon dioxide in the Sichuan Basin of China by a desktop optical spectrum analyzer. J. Appl. Remote Sens. 2017, 12, 012002. [Google Scholar] [CrossRef]
  8. Shibata, Y.; Nagasawa, C.; Abo, M. Development of 1.6 μm DIAL using an OPG/OPA transmitter for measuring atmospheric CO2 concentration profiles. Appl. Opt. 2017, 56, 1194–1201. [Google Scholar] [CrossRef]
  9. Ma, X.; Zhang, H.; Han, G.; Xu, H.; Shi, T.; Gong, W.; Ma, Y.; Li, S. High-Precision CO2 Column Length Analysis on the Basis of a 1.57-μm Dual-Wavelength IPDA Lidar. Sensors 2020, 20, 5887. [Google Scholar] [CrossRef]
  10. Zhu, Y.; Liu, J.; Chen, X.; Zhu, X.; Bi, D.; Chen, W. Sensitivity analysis and correction algorithms for atmospheric CO2 measurements with 1.57-µm airborne double-pulse IPDA LIDAR. Opt. Express 2019, 27, 32679–32699. [Google Scholar] [CrossRef]
  11. Ramanathan, A.K.; Nguyen, H.M.; Sun, X.; Mao, J.; Abshire, J.B.; Hobbs, J.M.; Braverman, A. A singular value decomposition framework for retrievals with vertical distribution information from greenhouse gas column absorption spectroscopy measurements. Atmos. Meas. Tech. 2018, 11, 4909–4928. [Google Scholar] [CrossRef] [Green Version]
  12. Lauwers, T.; Glière, A.; Basrour, S. An all-Optical Photoacoustic Sensor for the Detection of Trace Gas. Sensors 2020, 20, 3967. [Google Scholar] [CrossRef]
  13. Brown, D.; Brown, A.; Edwards, P.; Liu, Z.; Philbrick, C. Measurement of atmospheric oxygen using long-path supercontinuum absorption spectroscopy. J. Appl. Remote Sens. 2014, 8, 83557. [Google Scholar] [CrossRef] [Green Version]
  14. Elia, A.; Franco, C.D.; Spagnolo, V.; Lugarà, P.M.; Scamarcio, G. Quantum Cascade Laser-Based Photoacoustic Sensor for Trace Detection of Formaldehyde Gas. Sensors 2009, 9, 2697–2705. [Google Scholar] [CrossRef] [Green Version]
  15. Queißer, M.; Burton, M.; Fiorani, L. Differential absorption lidar for volcanic CO₂ sensing tested in an unstable atmosphere. Opt. Express 2015, 23, 6634–6644. [Google Scholar] [CrossRef] [PubMed]
  16. Griffith, D.; Pöhler, D.; Schmitt, S.; Hammer, S.; Vardag, S.; Platt, U. Long open-path measurements of greenhouse gases in air using near-infrared Fourier transform spectroscopy. Atmos. Meas. Tech. 2018, 11, 1549–1563. [Google Scholar] [CrossRef] [Green Version]
  17. Butz, A.; Guerlet, S.; Hasekamp, O.; Schepers, D.; Galli, A.; Aben, I.; Frankenberg, C.; Hartmann, J.; Tran, H.; Kuze, A.; et al. Toward accurate CO2 and CH4 observations from GOSAT. Geophys. Res. Lett. 2011, 38, 130–137. [Google Scholar] [CrossRef] [Green Version]
  18. Ohyama, H.; Kawakami, S.; Tanaka, T.; Morino, I.; Uchino, O.; Inoue, M.; Sakai, T.; Nagai, T.; Yamazaki, A.; Uchiyama, A.; et al. Observations of XCO2 and XCH4 with ground-based high-resolution FTS at Saga, Japan, and comparisons with GOSAT products. Atmos. Meas. Tech. 2015, 8, 5263–5276. [Google Scholar] [CrossRef] [Green Version]
  19. Christoph, K.; Sebastian, T.; Bernhard, R.; Ulrich, P. Applicability of light-emitting diodes as light sources for active differential optical absorption spectroscopy measurements. Appl. Opt. 2006, 45, 2077–2088. [Google Scholar]
  20. Avetisov, V.; Bjoroey, O.; Wang, J.; Geiser, P.; Paulsen, K.G. Hydrogen Sensor Based on Tunable Diode Laser Absorption Spectroscopy. Sensors 2019, 19, 5313. [Google Scholar] [CrossRef] [Green Version]
  21. Li, C.; Dong, L.; Zheng, C.; Tittel, F.K. Compact TDLAS based optical sensor for ppb-level ethane detection by use of a 3.34 μm room-temperature CW interband cascade laser. Sens. Actuators B Chem. 2016, 232, 188–194. [Google Scholar] [CrossRef] [Green Version]
  22. Hartmann, A.; Strzoda, R.; Schrobenhauser, R.; Weigel, R. CO2 sensor for mainstream capnography based on TDLAS. Appl. Phys. B 2014, 116, 1023–1026. [Google Scholar] [CrossRef]
  23. Guo, X.; Zheng, F.; Li, C.; Yang, X.; Li, N.; Liu, S.; Wei, J.; Qiu, X.; He, Q. A portable sensor for in-situ measurement of ammonia based on near-infrared laser absorption spectroscopy. Opt. Laser Eng. 2019, 115, 243–248. [Google Scholar] [CrossRef]
  24. Xia, J.; Zhu, F.; Zhang, S.; Kolomenskii, A.; Schuessler, H. A ppb level sensitive sensor for atmospheric methane detection. Infrared Phys. Techn. 2017, 86, 194–201. [Google Scholar] [CrossRef]
  25. Seidel, A.; Wagner, S.; Ebert, V. TDLAS-based open-path laser hygrometer using simple reflective foils as scattering targets. Appl. Phys. B 2012, 109, 497–504. [Google Scholar] [CrossRef]
  26. Yao, L.; Liu, W.; Liu, J.; Kan, R.; Xu, Z.; Ruan, J.; Dai, Y. Research on Open-Path Detection for Atmospheric Trace Gas CO Based on TDLAS. Chin. J. Lasers 2015, 42, 305–312. [Google Scholar]
  27. Zimmerman, J.; Ii, R.; Blakley, C.; Frish, M.; Laderer, M.; Wainner, R. Tunable Diode Lase Absorption Spectrometers for CO2 Wellhead and Pipeline Leakage Monitoring: Experiences from Prototype Testing at the Illinois Basin—Decatur Project, USA. Energy Procedia 2014, 63, 4083–4094. [Google Scholar] [CrossRef] [Green Version]
  28. Bailey, D.; Adkins, E.; Miller, J. An open-path tunable diode laser absorption spectrometer for detection of carbon dioxide at the Bonanza Creek Long-Term Ecological Research Site near Fairbanks, Alaska. Appl. Phys. B 2017, 123, 245. [Google Scholar] [CrossRef]
  29. Xia, J.; Zhu, F.; Zhang, S.; Kolomenskii, A.; Dong, J.; Okada, K.; Strohaber, J.; Schuessler, H. Probing greenhouse gases in turbulent atmosphere by long-range open-path wavelength modulation spectroscopy. Opt. Laser Eng. 2019, 117, 21–28. [Google Scholar] [CrossRef]
  30. Rothman, L.S.; Gordon, I.E.; Babikov, Y.; Barbe, A.; Benner, D.C.; Bernath, P.F.; Campargue, A. The HITRAN2012 molecular spectroscopic database. J. Quant. Spectrosc. Radiat. Transf. 2013, 130, 4–50. [Google Scholar] [CrossRef] [Green Version]
  31. Xin, F.; Guo, J.; Sun, J.; Li, J.; Zhao, C.; Liu, Z. Research on atmospheric CO2 remote sensing with open-path tunable diode laser absorption spectroscopy and comparison methods. Opt. Eng. 2017, 56, 066113. [Google Scholar] [CrossRef]
Figure 1. Laser absorption spectroscopy concept.
Sensors 21 01722 g001
Figure 2. The absorption spectrum of CO2 and H2O between 1.0 μm and 3.0 μm.
Sensors 21 01722 g002
Figure 3. Simulated absorbance of CO2 and H2O with the HITRAN database.
Sensors 21 01722 g003
Figure 4. Schematic diagram of the open-path tunable diode laser absorption spectroscopy (TDLAS) system for measuring atmospheric CO2 column concentration.
Sensors 21 01722 g004
Figure 5. AZ7752 Sensors calibration results with UGGA gas analyzer.
Sensors 21 01722 g005
Figure 6. Received signal from photodiode detector (a) and measured absorbance of CO2 (b).
Sensors 21 01722 g006
Figure 7. Atmospheric CO2 concentrations over the 21-m-long vertical path (a) and comparison of open-path TDLAS with the average values of two sensors (b).
Sensors 21 01722 g007
Figure 8. Atmospheric CO2 concentrations over the 110-m-long vertical (a) and comparison of open-path TDLAS with the average values of three sensors (b).
Sensors 21 01722 g008
Table 1. Comparisons with previous open-path spectroscopy techniques for detection CO2.
TechniquesLight SourceDistanceDirectionDetection LimitComparison SensorsReference
FTIRLamp1.5 kmHorizontal1.6 ppmSingle[16]
DOASLED3.045 kmHorizontal--[19]
TDLASDFB laser0.2 kmHorizontal5.4 ppmSingle[28]
TDLASDFB laser1.3 kmHorizontal20 ppm-[29]
TDLASDFB laser0.11 kmVertical0.52 ppmMultipleThis work
Publisher’s Note: MDPI stays neutral with regard to jurisdictional claims in published maps and institutional affiliations.

