
Application of a Vision-Based Single Target on Robot Positioning System

Abstract
:1. Introduction
2. Related Works
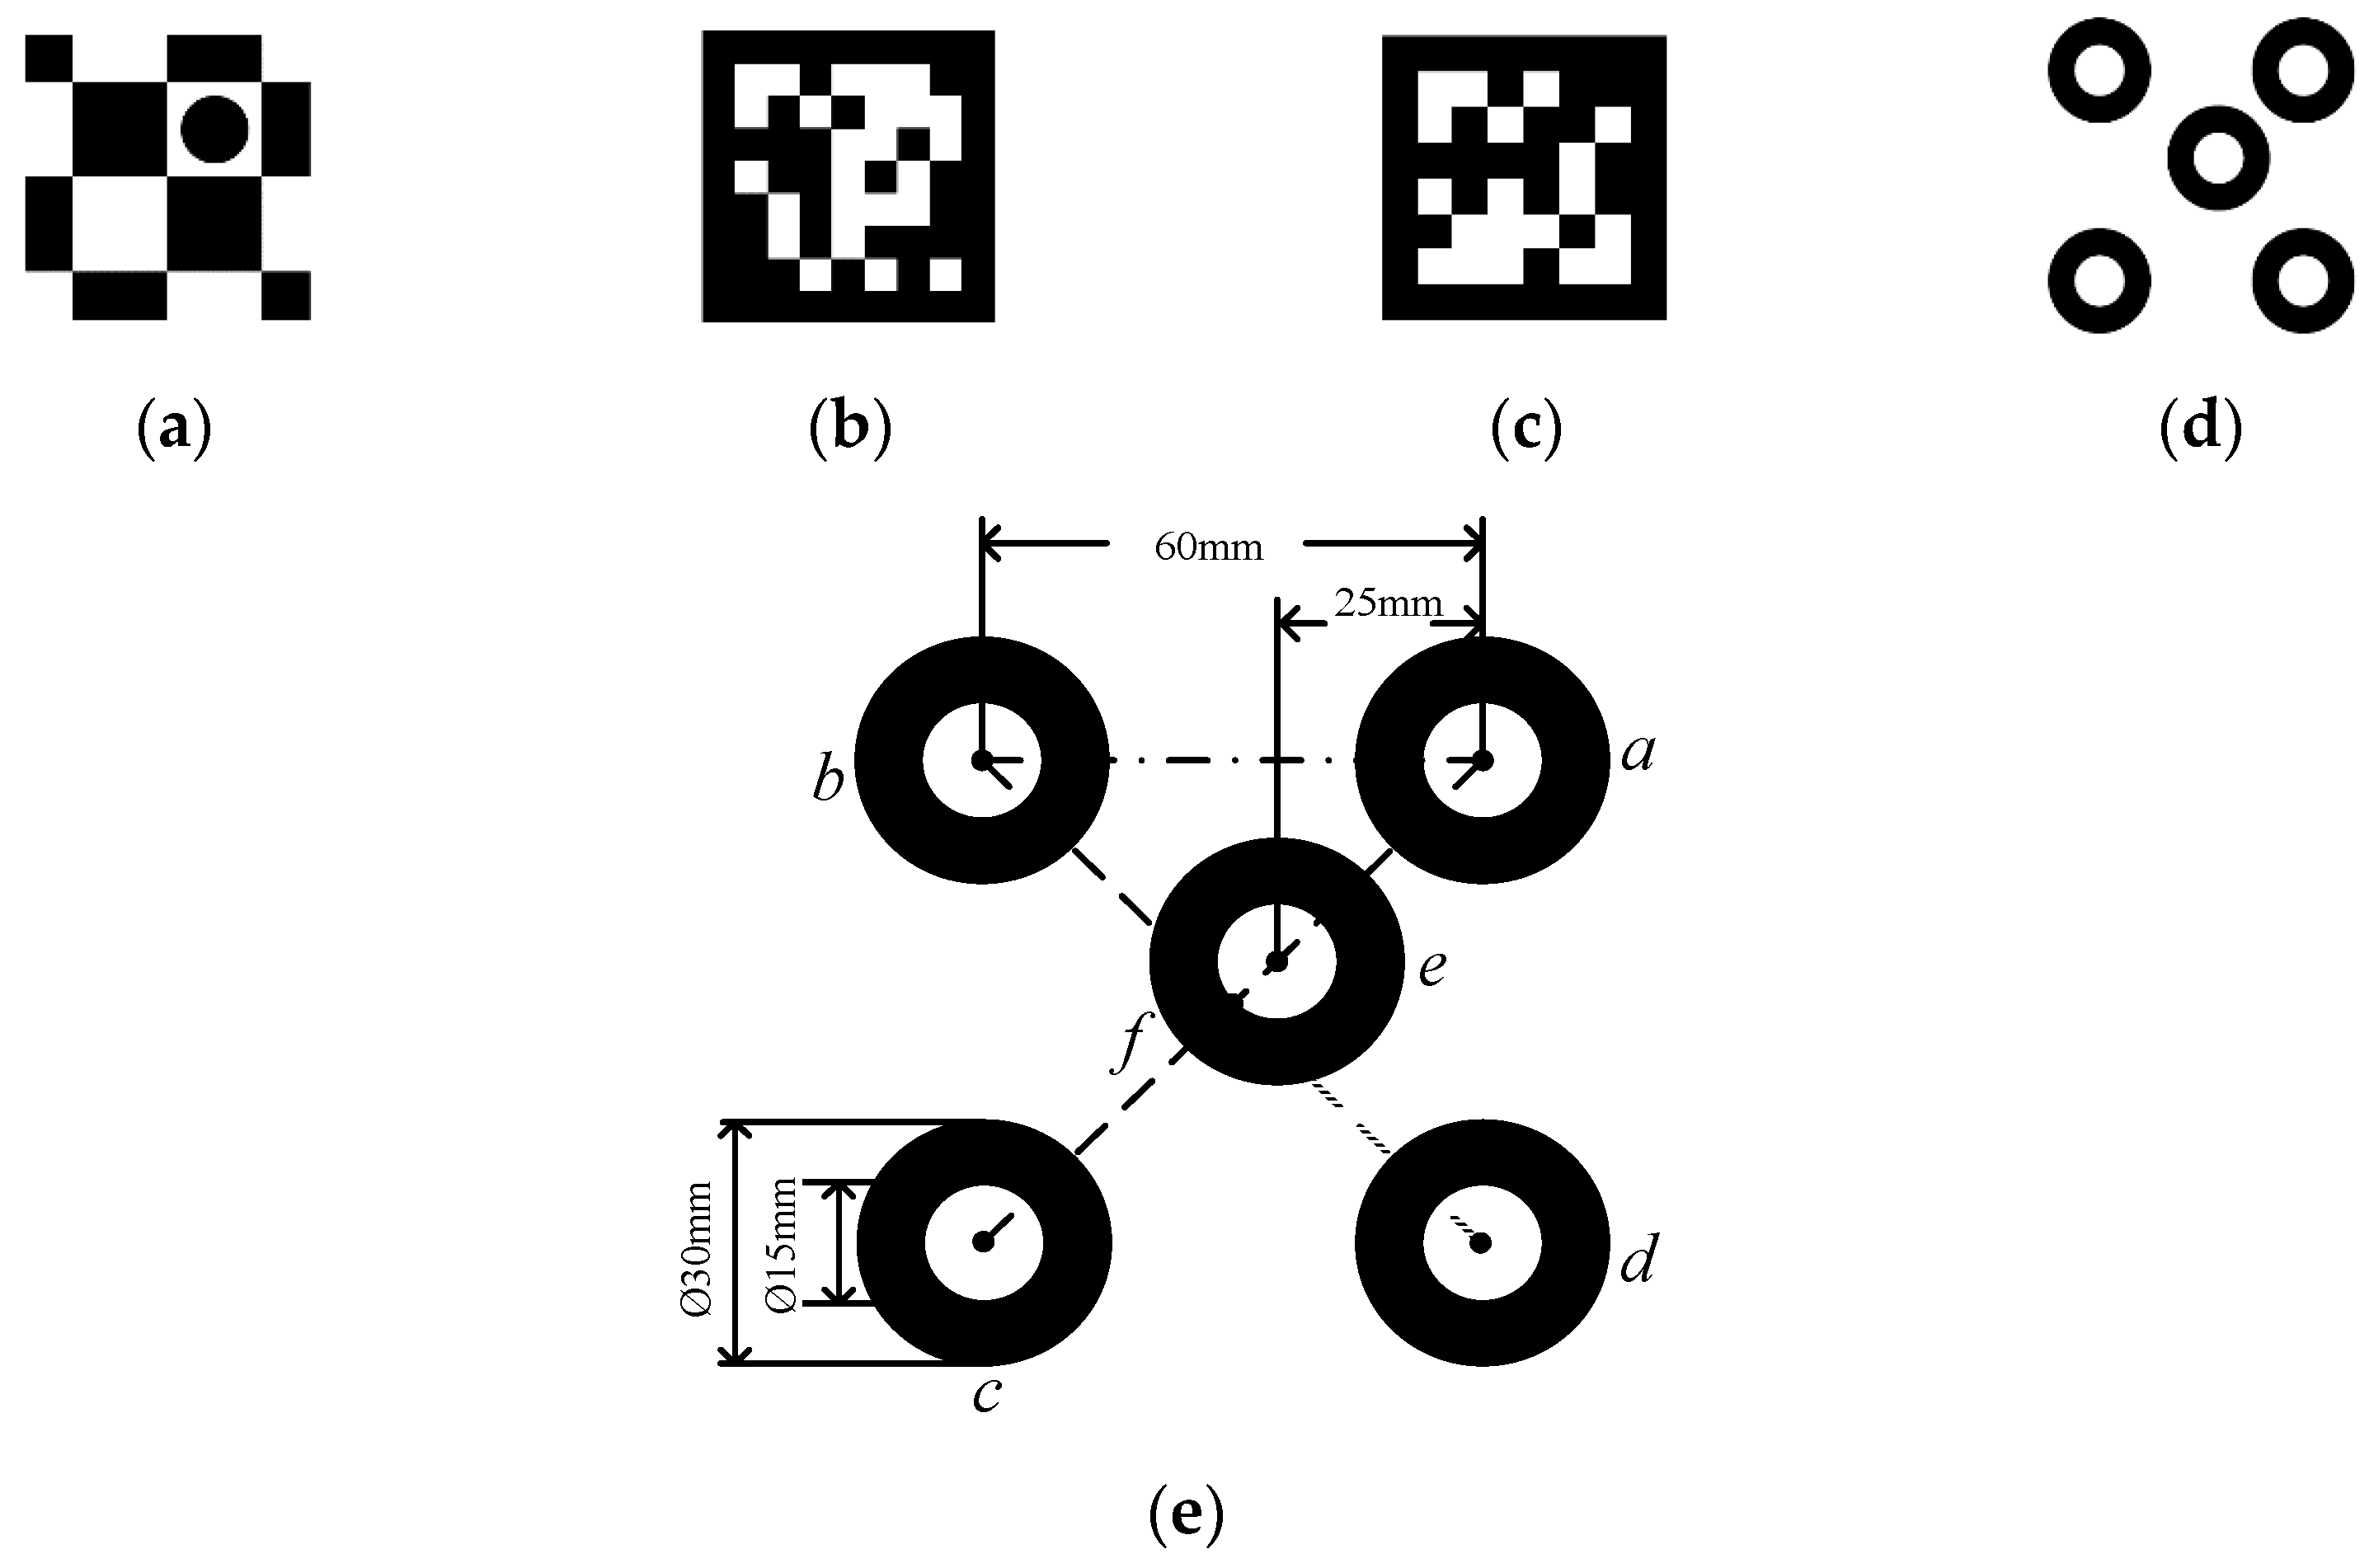
3. Designing the Encoded Marker Points
- (1)
- The markers must be correctly detected in the case of long-distance work, illumination variation, and complex background.
- (2)
- The markers must be able to encode specific information to be used after being captured by the camera.
- (3)
- The markers should be easy to use and cost-effective. For instance, a marker should be able to be printable on paper and recognized using ordinary grayscale cameras.
- (4)
- The fundamental function of a marker is to provide an accurate position of the object, where a 6 DoF includes both translation and rotation.
- (5)
- When a scanning probe is operating at the end of a robotic arm, the scanning probe’s information and the location of its end-effector must be synchronized. To facilitate this the process of reading, the markers should be fast enough to meet this synchronicity.
4. Identifying the Circular-Ring Marker
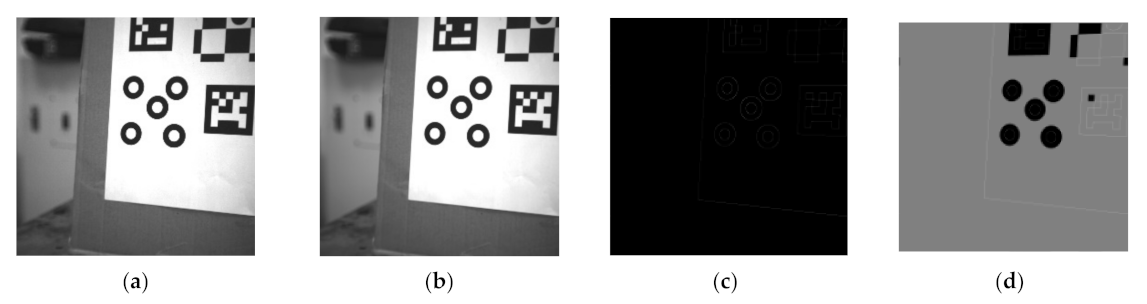
4.1. Image Preprocessing
4.2. Image Edge Segmentation
- (1)
- The same edge should be more than six-pixel points to match the basic requirements of ellipse fitting.
- (2)
- The total number of those pixel points should be less than the image pixel circumference.
- (2)
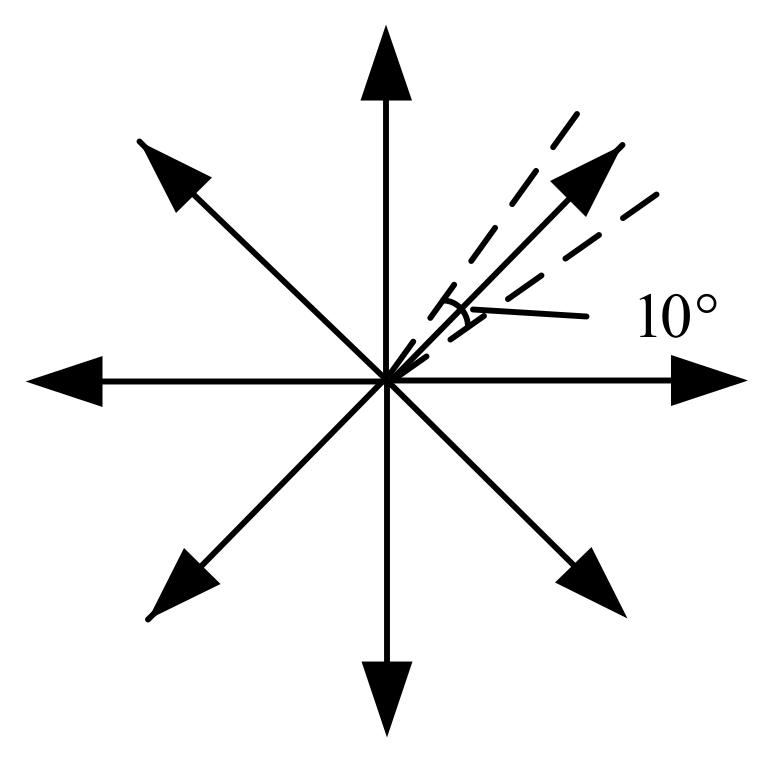
- The pixel points are continuous. To reasonably set up eight regions, we take the pixel center point and then calculate the angle of the edge around the pixel center point andwhere the function fastAtan2 is used to find the angle. The angle deviation of each region is 10° as shown in Figure 4. If there are edge points in each area, the edge is continuous. The angle setting of the regions cannot be greater than 45°. Otherwise, there will be an intersection between the regions, which will cause the method to fail. Just choose a smaller value, such as 10°.
4.3. Edge Fitting
- (1)
- The ellipse major axis is 1/3 of the image length and width.
- (2)
- The ellipse is inside the image. According to the fitting parameters , the ellipse is qualified if and are inside the image.
- (3)
- Reject ellipse that are too small. The semi-major and the semi-minor axis length of the ellipse are less than two pixels and thus are considered unqualified. The area of the ellipse should satisfy .If the ellipse meets all of the above conditions, the next step performs a secondary screening. The specific implementation scheme is to traverse two ellipses at a time. The center pixel coordinates of the two ellipses are and . The semi-major axis and semi-minor axis are and the characteristic values are . We need two ellipses that satisfy the following four constraints.
- (4)
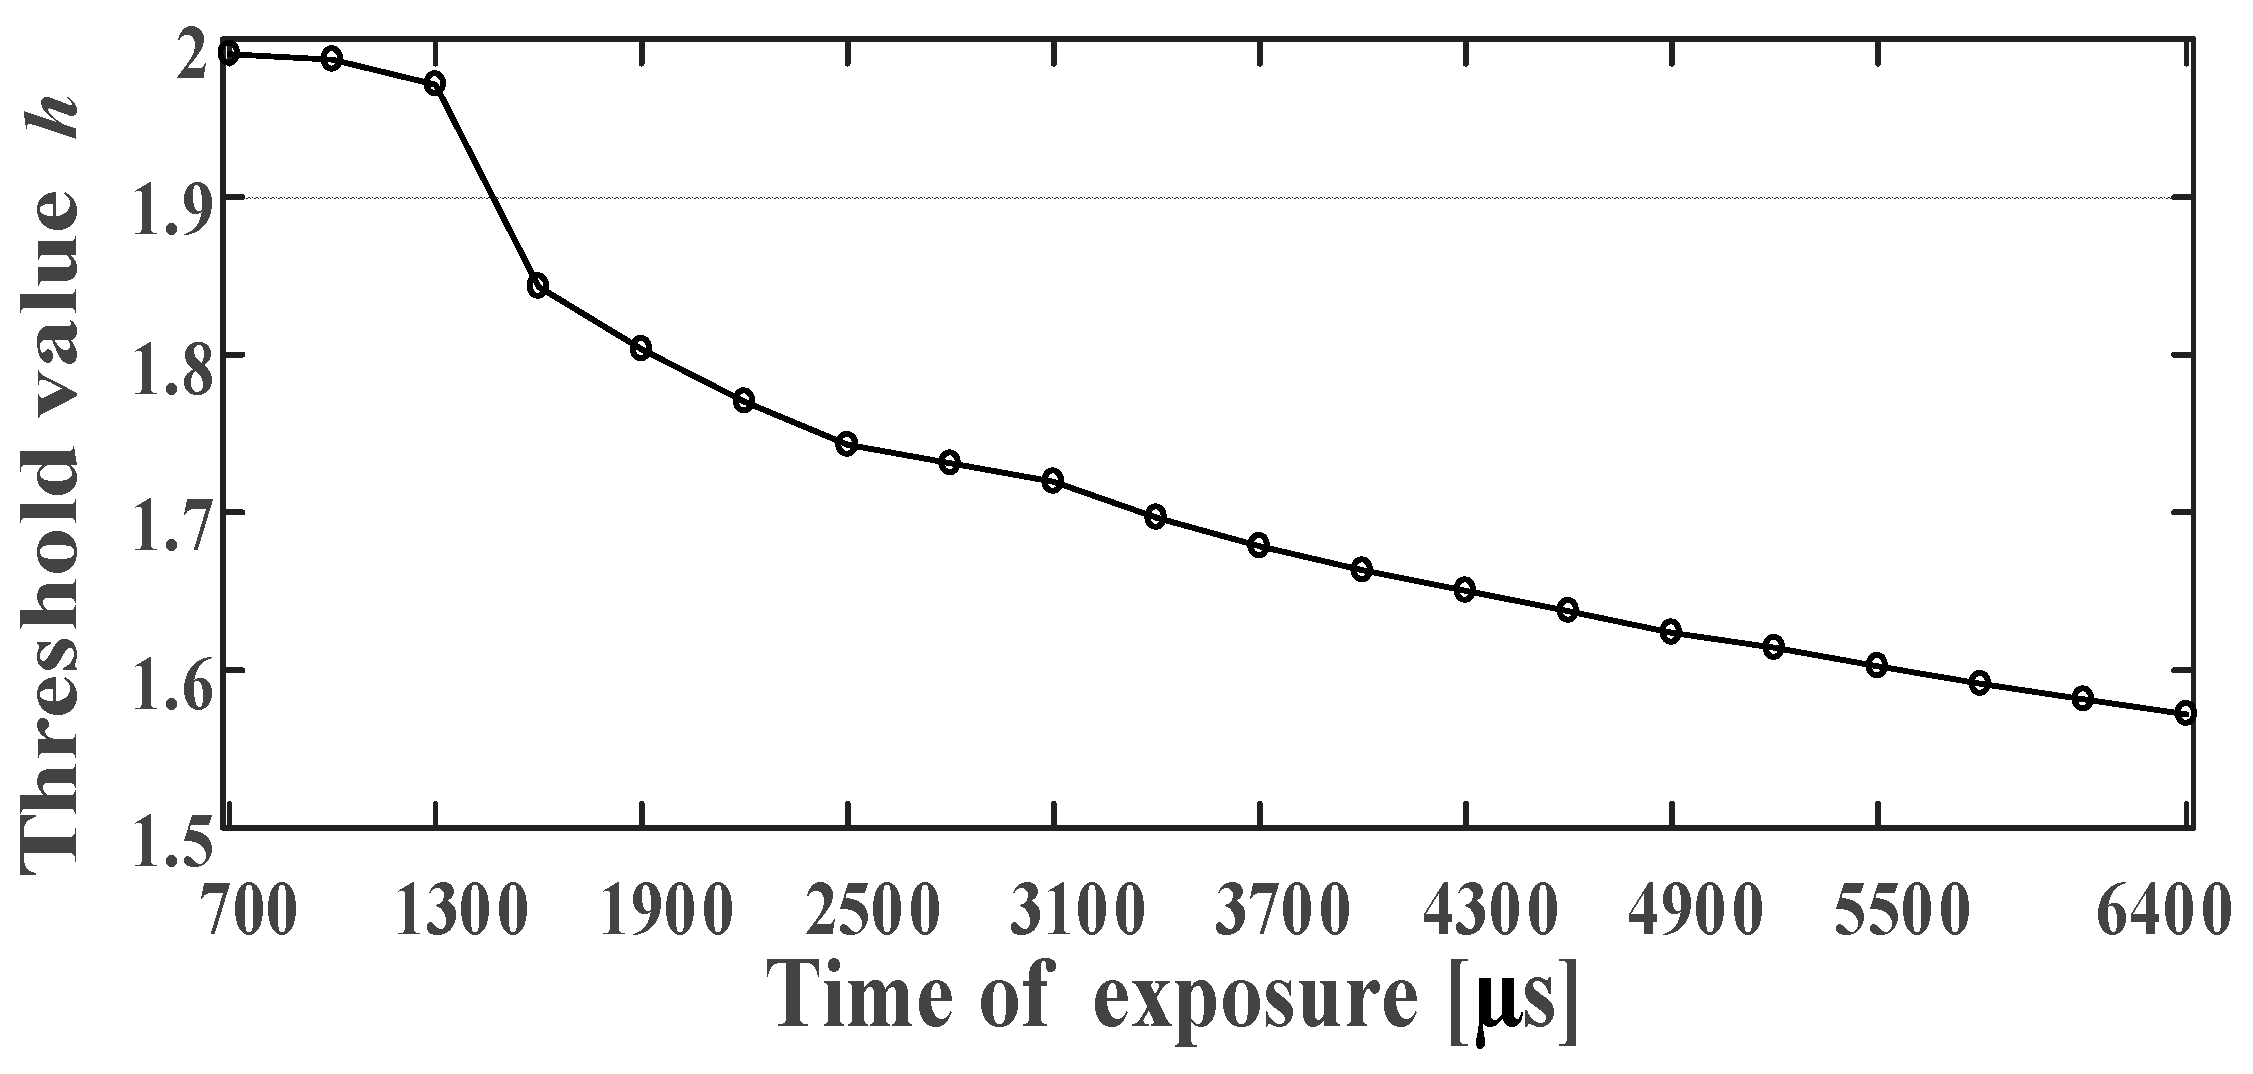
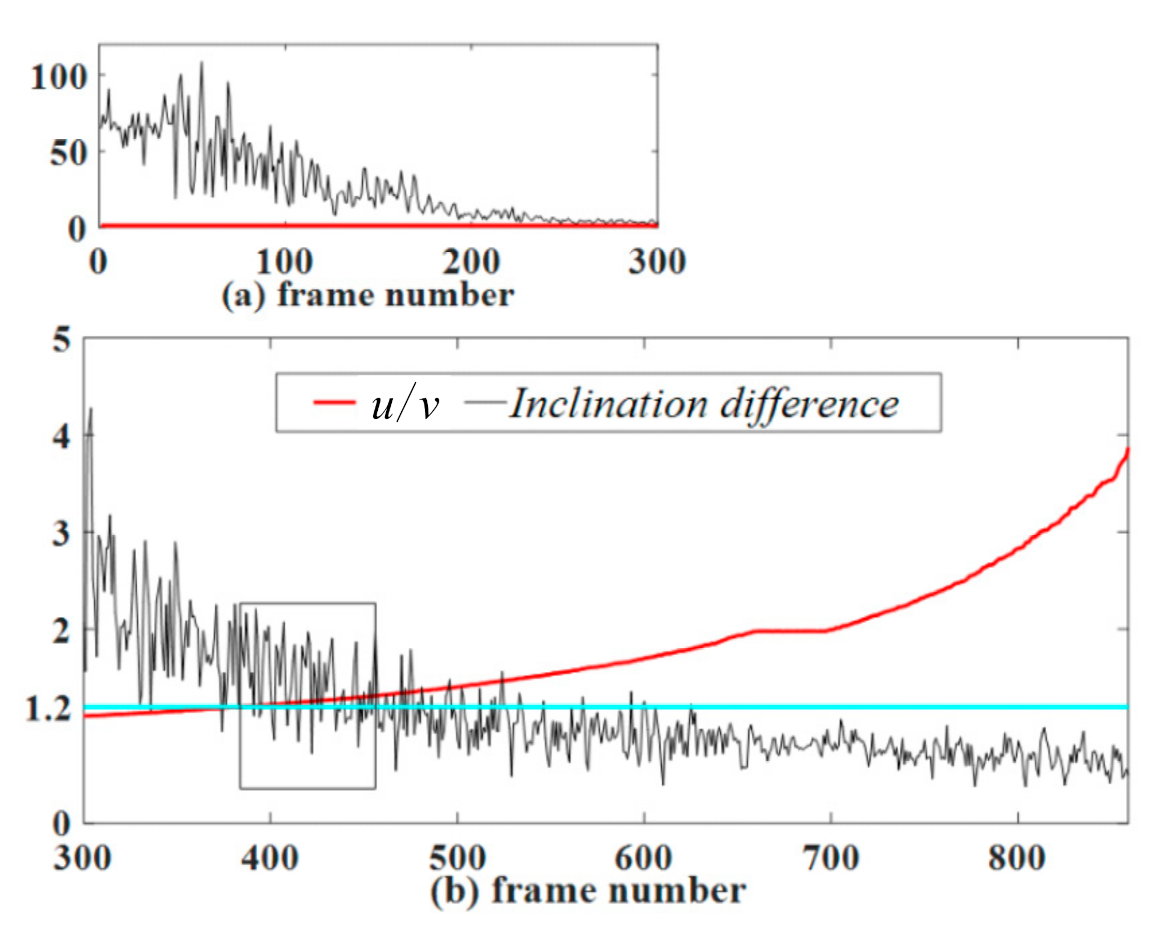
- For the two ellipses, should hold, where is the preset threshold, and it depends on the light source intensity. Section 5.1 determines the effective range of the threshold . The effective range ensures that the correct two ellipses are not deleted by mistake.
- (5)
- The circular ring is composed of a white–black–white region. In cases where the edge is white–black, its characteristic value is greater than zero, and for a black–white edge, its characteristic value is less than zero. For the Circular-ring marker in this article, the feature values and of the two ellipses should satisfy
- (6)
- The outer ellipse size should be more than the inner ellipse size, i.e.,
- (7)
- The pixel distance between the centers of the two ellipses is small enough andwhere K is a constant. The constraint range of the central pixel deviation value varies with the size of the ellipse. After verification of all experiments in Section 5, the ratio between the center coordinate difference of the two ellipses and the semi-major axis is less than 0.055. We set K to 0.06, and the marker identification effect is strong.
4.4. Decoding of Circular Ring
- (1)
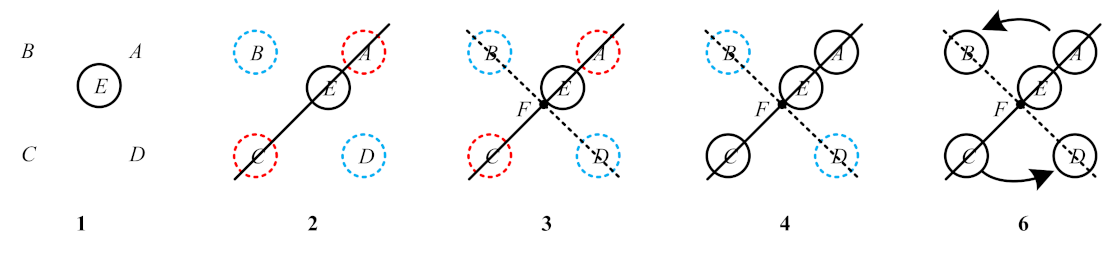
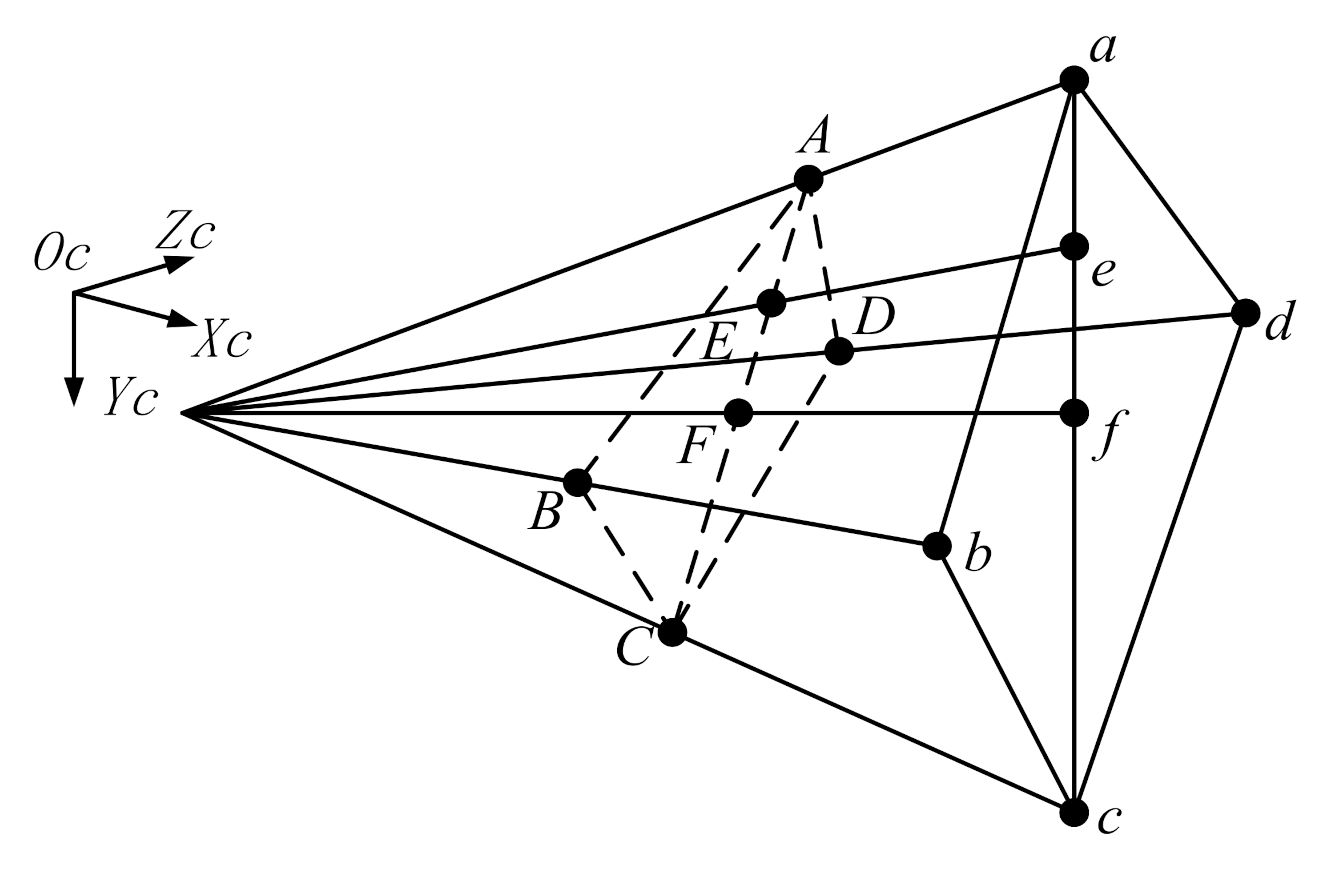
- Find the internal point from the five points. Then, use the positional relationship between the internal point and the remaining four points so thatwhere is the area of a quadrilateral formed by the four points , are the area of the triangle formed by the internal point and the four sides of a quadrilateral , respectively. The point that satisfies this equation is an internal point . Then, point is assigned pixel coordinates. As shown in No. 1 in Figure 5, point is represented by a black solid circle.
- (2)
- Find the points that are collinear with the internal point . The two-point construction line iswhere are constants. We calculate the vertical distance according to Equation (13). The is the distance from to line .If is small enough and , one can consider the two target points as points . Note that this step finds point , but does not assign pixel coordinates. As shown in No. 2 in Figure 5, this step separates points from points . The circles in different colors in Figure 5 represent different areas, and the dotted circles represent no pixel coordinates assigned.
- (3)
- Determine the pixel coordinate of the Circular-ring marker center point . By Step 2, we know that the remaining two points are . Then, we find the intersection between line and line , as shown in No. 3 in Figure 5. The coordinate of the point F can be obtained by calculation. Point should satisfywhere are the directed line segments between two points.
- (4)
- Determine the positions of points and . In Step 2, are determined, but they do not assign pixel coordinates, as shown in No. 4 in Figure 5. In the Circular-ring marker, is between point and point , and satisfies and point satisfies . Then, under the constraint conditions in this step, points and are assigned pixel coordinates values in sequence.
- (5)
- Using the obtained , we calculate the cross-ratio :where are modules of the directed line segments. According to the projective theorem of cross-ratio invariance, . Note that image recognition may produce certain errors, so we can set qualifying conditions to specify the allowable error range. If the cross-ratio error is within the allowable error range, then satisfy the cross-ratio invariance. Otherwise, the decoding work will go back to Step 1.
- (6)
- Determine the positions of points and . In Step 2, are determined, but they do not assign pixel coordinates. We set the point as the center of the mass and then calculate the value of the points relative to the center of the mass:where is the x-axis difference and is the y-axis difference. In Formula (16), the centroid point can be set as the origin of the coordinate. At this time, the points should be located in four different quadrants on the coordinate axis. is the x-axis difference between the points and the point . is the y-axis difference between the points and the point . Then, calculate the value of the points in turn. As shown in No. 6 in Figure 5, in the counterclockwise direction, is increased, and we can determine the positions of , based on the positions of . Then, the points and are assigned pixel coordinates values in sequence.
5. Experiment and Analysis
5.1. Parameter Setting Experiment
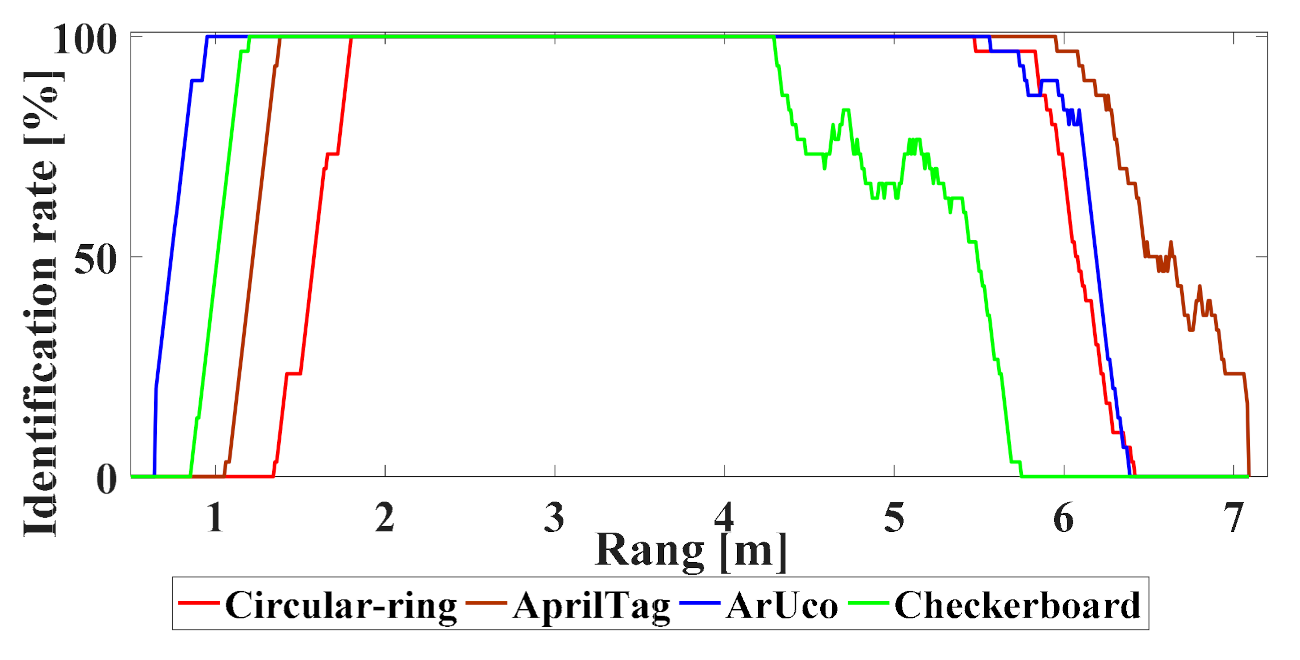
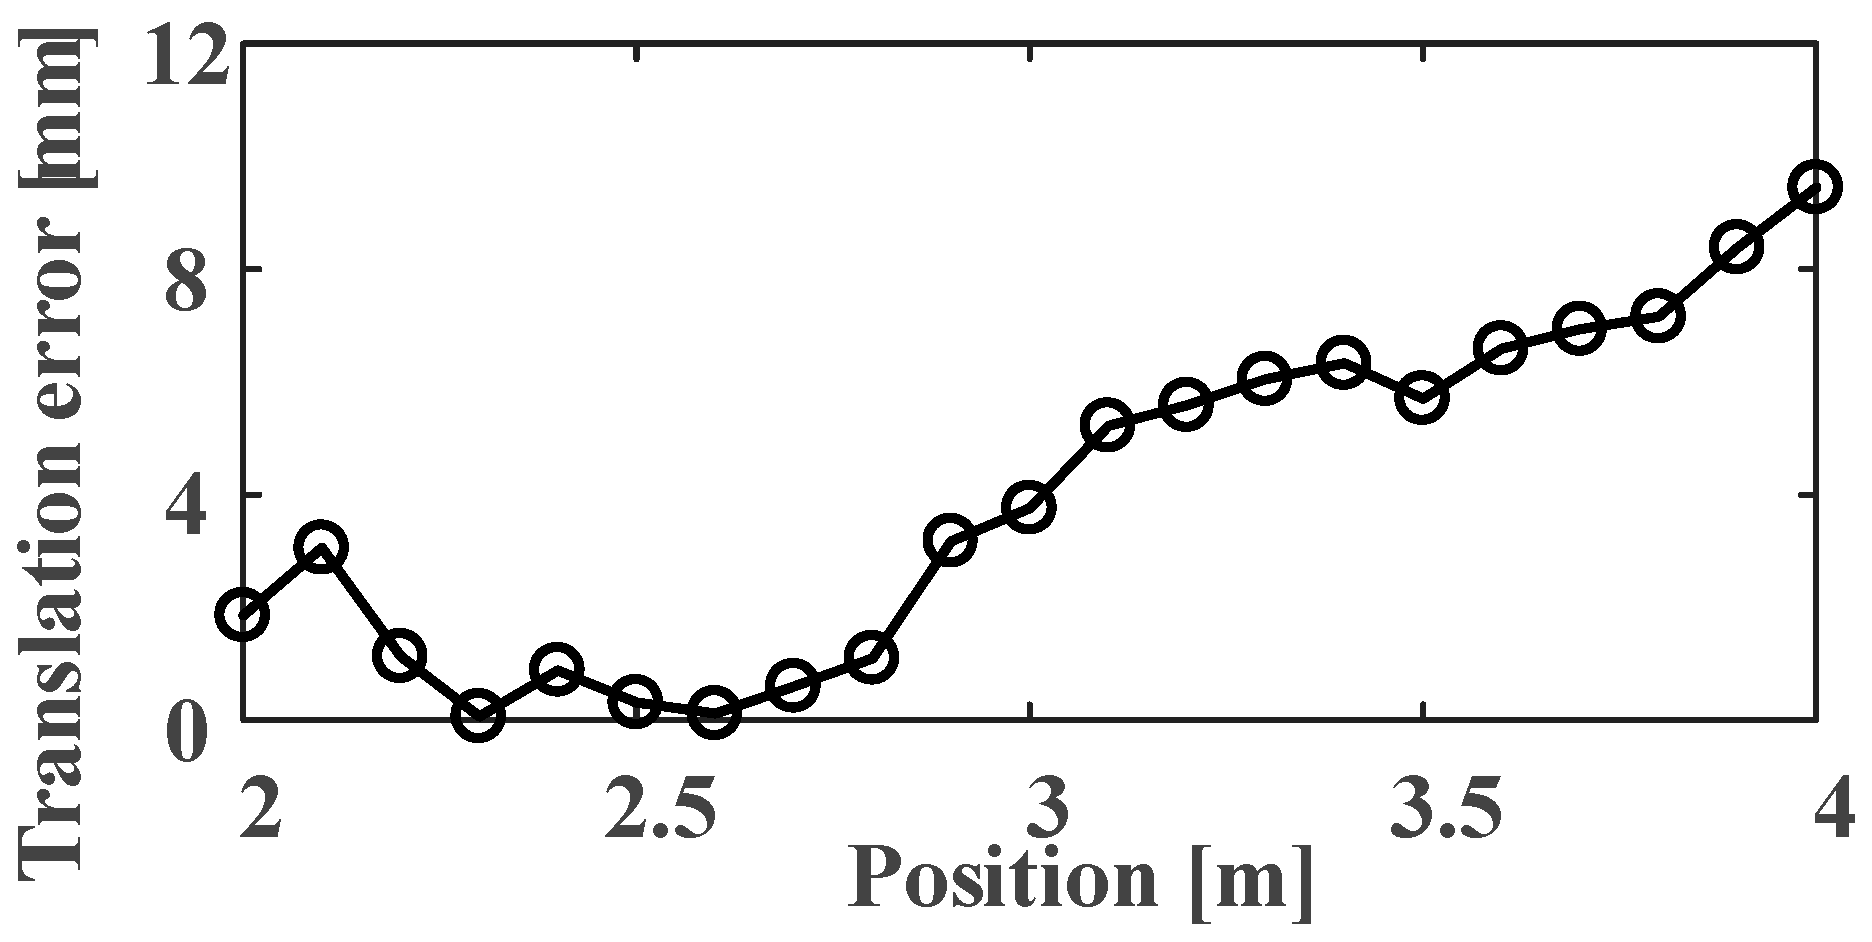
5.2. Effective Distance Detection
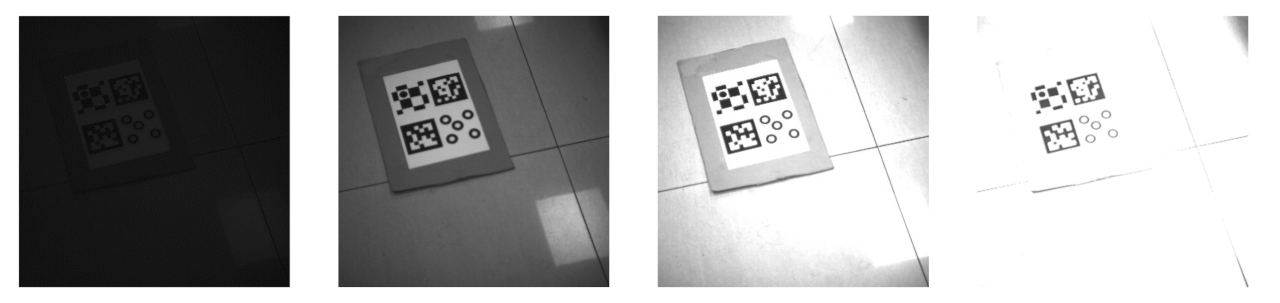
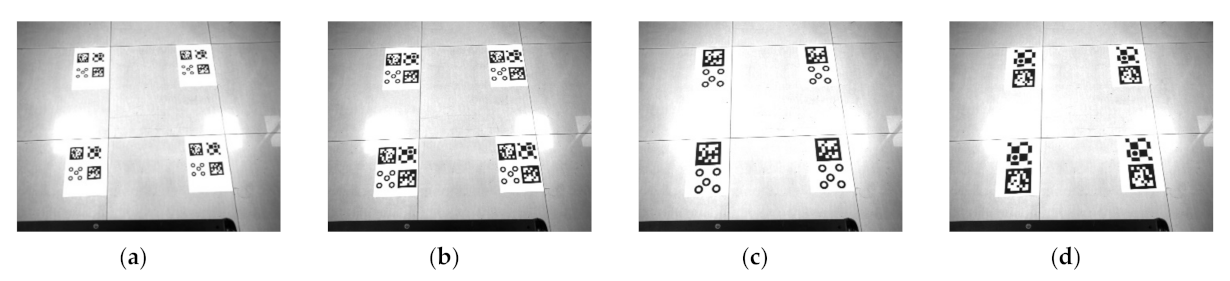
5.3. Robustness against the Light Changes
5.4. Detection Speed of the Marker
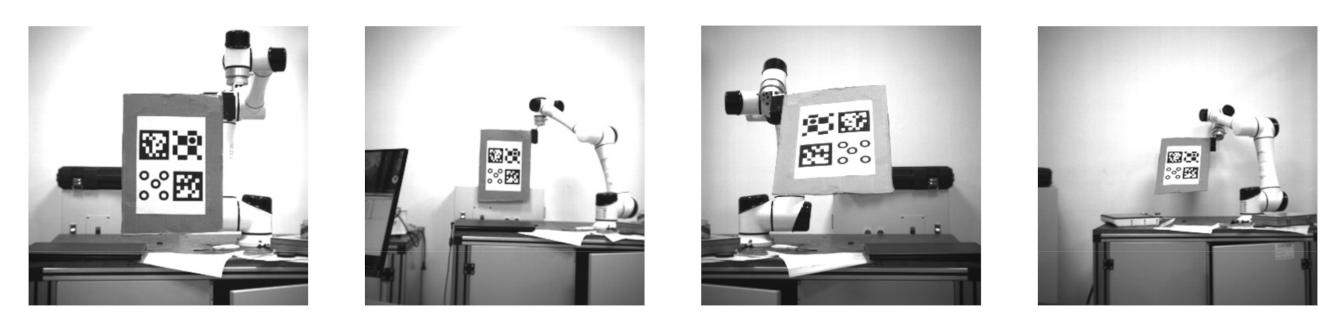
5.5. Repeatability of the Positioning Experiment
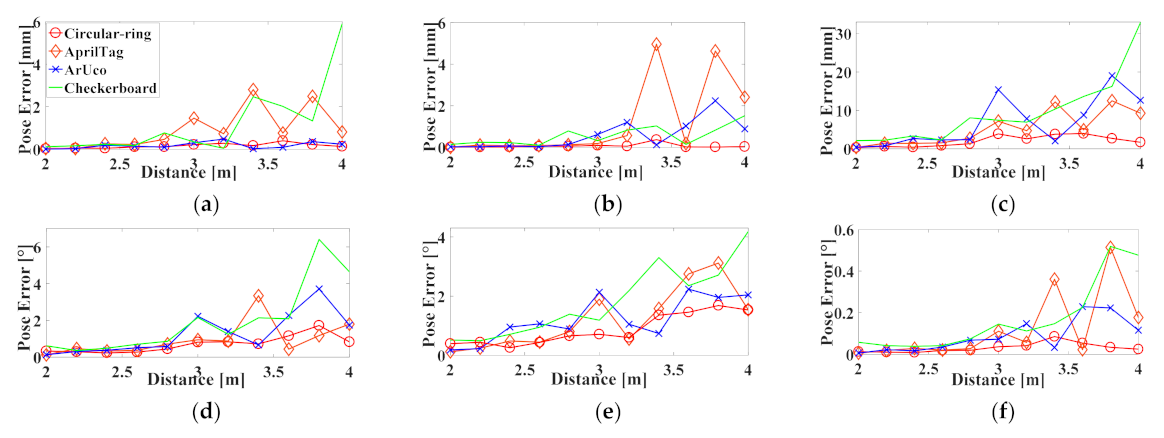
5.6. Positioning Accuracy Experiment
5.7. Comparison with Other Visual Positioning Systems
5.7.1. Compare at Different Resolutions
5.7.2. Comparison of Different Dimensions
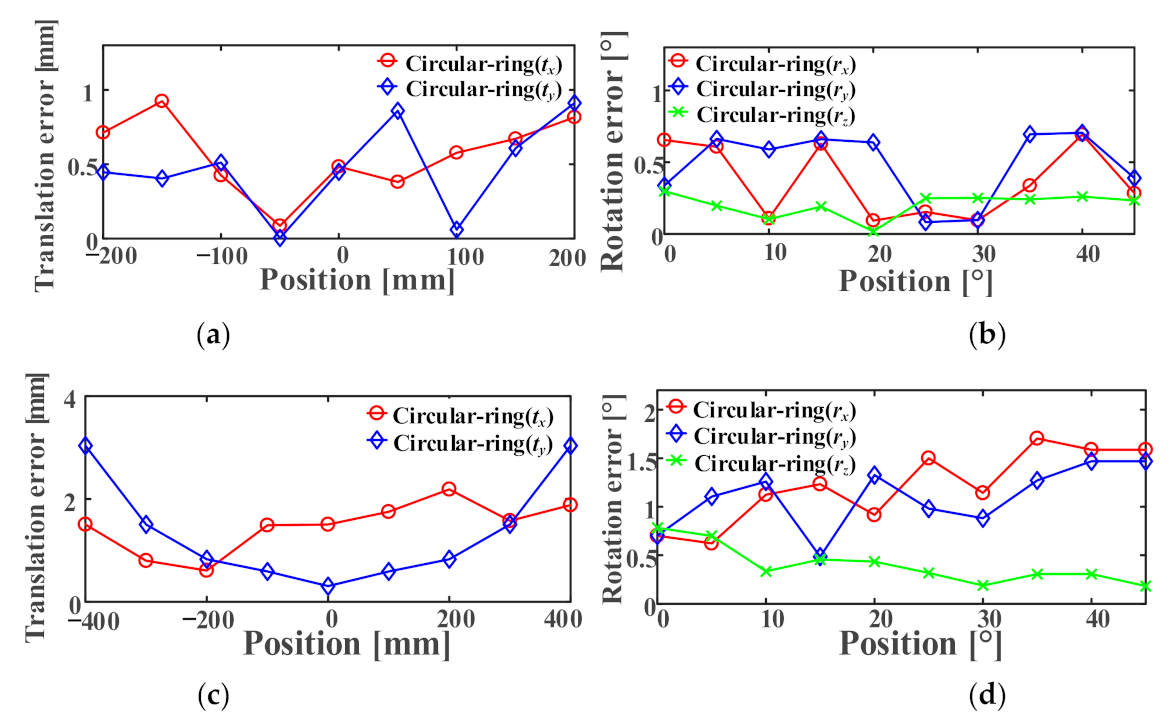
5.7.3. Comparison of Relative Position Changes
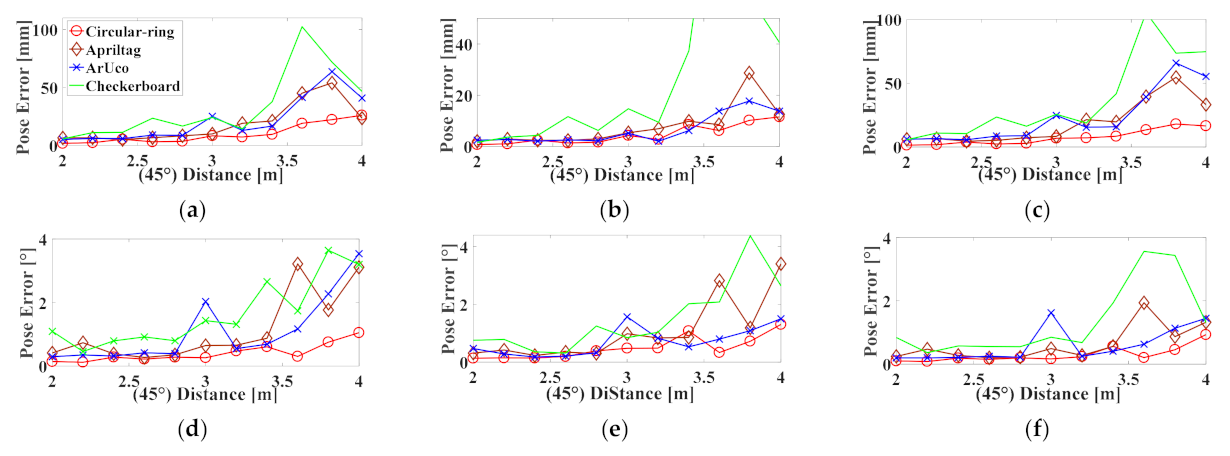
5.7.4. Comparison between Markers at Greater Distances
5.7.5. Accuracy of Angle Estimation
5.8. Experimental Analysis
6. Conclusions
Author Contributions
Funding
Data Availability Statement
Conflicts of Interest
References
- Tsai, C.; Liu, T.; Lu, Y.; Nisar, H. A novel interactive assembly teaching aid using multi-template augmented reality. Multimedia Tools Appl. 2020, 79, 43–44. [Google Scholar] [CrossRef]
- Taheri, H.; Zhao, C. Omnidirectional mobile robots, mechanisms and navigation approaches. Mech. Mach. Theory 2020, 153, 103958. [Google Scholar] [CrossRef]
- Bacik, J.; Durovsky, F.; Fedor, P. Autonomous flying with quadrocopter using fuzzy control and ArUco markers. Intell. Serv. Robot. 2017, 10, 185–194. [Google Scholar] [CrossRef]
- Gaetano, C.; Salvatore, M.; Vincenzo, C.; Juan, F.; Javier, B. Performance analysis of visual markers for indoor navigation systems. Front. Inf. Technol. Electron. Eng. 2016, 17, 730–740. [Google Scholar] [CrossRef]
- Calvet, L.; Gurdjos, P.; Griwodz, C.; Gasparini, S. Detection and Accurate Localization of Circular Fiducials under Highly Challenging Conditions. In Proceedings of the 2016 IEEE Conference on Computer Vision and Pattern Recognition (CVPR), Las Vegas, NV, USA, 27–30 June 2016; pp. 562–570. [Google Scholar] [CrossRef] [Green Version]
- Huang, B.; Sun, Y.; Zeng, Q. General fusion frame of circles and points in vision pose estimation. Optik 2018, 154, 47–57. [Google Scholar] [CrossRef]
- Olson, E. AprilTag: A robust and flexible visual fiducial system. In Proceedings of the 2011 IEEE International Conference on Robotics and Automation (ICRA), Shanghai, China, 9–13 May 2011; pp. 3400–3407. [Google Scholar]
- Wang, C.; Chen, D.; Li, M.; Gong, J. Direct solution for pose estimation of single circle with detected centre. Electron. Lett. 2016, 52, 1751–1753. [Google Scholar] [CrossRef]
- Li, Y.; Wang, Z.; Cheng, Y.; Tang, Y.; Shang, Z. Application of vision measurement model with an improved moth-flame optimization algorithm. Opt. Express 2019, 27, 20800–20815. [Google Scholar] [CrossRef]
- Wang, Z.; Li, Y.; Hao, R.; Cheng, Y.; Jiang, W. Monocular vision pose measurement algorithm based on points feature. Infrared Laser Eng. 2019, 48, 0517002. [Google Scholar] [CrossRef]
- Bergamasco, F.; Albarelli, A.; Torsello, A. Pi-Tag: A fast image-space marker design based on projective invariants. Mach. Vision Appl. 2013, 24, 1295–1310. [Google Scholar] [CrossRef] [Green Version]
- Canny, J. A Computational Approach to Edge Detection. IEEE Trans. Pattern Anal. Mach. Intell. 1986, 8, 679–698. [Google Scholar] [CrossRef]
- Mao, X.; Lei, Y.; Wang, B.; Wu, S. Introduction to OpenCV3 Programming; Publishing House of Electronics Industry: Beijing, China, 2015. [Google Scholar]
- Yang, S.; Liu, M.; Yin, S.; Guo, Y.; Ren, Y.; Zhu, J. An improved method for location of concentric circles in vision measurement. Measurement 2017, 100, 243–251. [Google Scholar] [CrossRef]
- Hcormen, T.; Eleiserson, C.; Lrivest, R.; Stein, C. Introduction to Algorithms, 3rd ed.; The MIT Press: Cambridge, MA, USA, 2009. [Google Scholar] [CrossRef]
- Lay, K.; Zhou, M. Perspective Projection for Decoding of QR Codes Posted on Cylinders. In Proceedings of the IEEE International Conference on Signal and Image Processing Applications (ICSIPA), Kuching, Malaysia, 12–14 September 2017; pp. 39–42. [Google Scholar]
- Fiala, M. Artag rev2 fiducial marker system: Vision based tracking for AR. In Proceedings of the ISMAR, Vienna, Austria, 5–8 October 2005. [Google Scholar]
- Wagner, D.; Schmalstieg, D. Artoolkitplus for pose tracking on mobile devices. In Proceedings of the 12th Computer Vision Winter Workshop (CVWW’07), St. Lambrecht, Austria, 6–8 February 2007. [Google Scholar]
- Garrido-Jurado, S.; Munoz-Salinas, R.; Madrid-Cuevas, F.; Marin-Jimenez, M. Automatic generation and detection of highly reliable fiducial markers under occlusion. Pattern Recognit. 2014, 47, 2280–2292. [Google Scholar] [CrossRef]
- Kam, H.; Yu, Y.; Wong, K. An Improvement on ArUco Marker for Pose Tracking Using Kalman Filter. In Proceedings of the 2018 19th IEEE/ACIS International Conference on Software Engineering, Artificial Intelligence, Networking and Parallel/Distributed Computing (SNPD), Busan, Korea, 27–29 June 2018; pp. 65–69. [Google Scholar]
- Wang, J.; Olson, E. Apriltag 2: Efficient and robust fiducial detection. In Proceedings of the 2016 IEEE/RSJ International Conference on Intelligent Robots and Systems (IROS), Daejeon, Korea, 9–14 October 2016; pp. 4193–4198. [Google Scholar]
- Zhang, G.; Patricio, V.; Panagiotis, T.; Dae-Min, C. Efficient Closed-Loop Detection and Pose Estimation for Vision-Only Relative Localization in Space with A Cooperative Target. In Proceedings of the AIAA Space Conference and Exposition, San Diego, CA, USA, 4–7 August 2014. [Google Scholar]
- Gatrell, L.; Hoff, W.; Sklair, C. Robust image features: Concentric contrasting circles and their image extraction. In Proceedings of the SPIE 1612, Cooperative Intelligent Robotics in Space II, Bellingham, WA, USA, 12–14 November 1991. [Google Scholar] [CrossRef]
- Edwards, M.; Hayes, M.; Green, R. High-accuracy Fiducial Markers for Ground Truth. In Proceedings of the International Conference on Image and Vision Computing New Zealand (IVCNZ), Palmerston North, New Zealand, 21–22 November 2016; pp. 261–266. [Google Scholar]
- Krajnik, T.; Nitsche, M.; Faigl, J.; Vaněk, P.; Saska, M.; Přeučil, L.; Duckett, T.; Mejail, M. A Practical Multirobot Localization System. J. Intell. Robot. Syst. 2014, 76, 539–562. [Google Scholar] [CrossRef] [Green Version]
- Bergamasco, F.; Albareli, A.; Emanuele, R.; Torsello, A. RUNE-Tag: A High Accuracy Fiducial Marker with Strong Occlusion Resilience. In Proceedings of the IEEE Conference on Computer Vision and Pattern Recognition (CVPR), Colorado Springs, CO, USA, 20–25 June 2011; pp. 113–120. [Google Scholar]
- Lopez de Ipina, D.; Mendonça, P.R.S.; Hopper, A. TRIP: A Low-Cost Vision-Based Location System for Ubiquitous Computing. Pers. Ubiquitous Comput. 2002, 6, 206–219. [Google Scholar] [CrossRef]
- Patruno, C.; Nitti, M.; Petitti, A.; Stella, E.; D’Orazio, T. A Vision-Based Approach for Unmanned Aerial Vehicle Landing. J. Intell. Robot. Syst. 2018, 95, 645–664. [Google Scholar] [CrossRef]
- Naimark, L.; Foxlin, E. Circular data matrix fiducial system and robust image processing for a wearable vision-inertial self-tracker. In Proceedings of the 1st International Symposium on Mixed and Augmented Reality, ISMAR ’02, Darmstadt, Germany, 1 October 2002. [Google Scholar] [CrossRef]
- Mooser, J.; You, S.; Neumann, U. Tricodes: A barcode-like fiducial design for augmented reality media. In Proceedings of the 2006 IEEE International Conference on Multimedia and Expo, ICME 2006, Toronto, ON, Canada, 9–12 July 2006. [Google Scholar]
- Lightbody, P.; Krajnik, T.; Hanheide, M. An efficient visual fiducial localisation system. ACM SIGAPP Appl. Comput. Rev. 2017, 17, 28–37. [Google Scholar] [CrossRef] [Green Version]
- Teixeira, L.; Loaiza, M.; Raposo, A. Gattass, M. Augmented Reality Using Projective Invariant Patterns. In Advances in Visual Computing, Volume 5358 of Lecture Notes in Computer Science; Springer: Berlin/Heidelberg, Germany, 2008. [Google Scholar] [CrossRef] [Green Version]
- Premachandra, C.; Ueda, D.; Kato, K. Speed-Up Automatic Quadcopter Position Detection by Sensing Propeller Rotation. IEEE Sensors J. 2018, 19, 2758–2766. [Google Scholar] [CrossRef]
- Premachandra, H.; Premachandra, C.; Parape, C.; Kawanaka, H. Speed-up ellipse enclosing character detection approach for large-size document images by parallel scanning and Hough transform. Int. J. Mach. Learn. Cybern. 2015, 8, 371–378. [Google Scholar] [CrossRef]
- Kawanaka, H.; Sumida, T.; Yamamoto, K.; Shinogi, T.; Tsuruoka, S. Document recognition and XML generation of tabular form discharge summaries for analogous case search system. Methods Inf. Med. 2007, 46, 700–708. [Google Scholar]
- Fitzgibbon, A.; Fisher, R. A Buyer’s Guide to conic Fitting. In Proceedings of the Sixth British Machine Vision Conference, Birmingham, England, 11–14 September 1995. [Google Scholar]
- Lepetit, V.; Moreno-Noguer, F.; Fua, P. Epnp: An Accurate O(n) Solution to the PnP Problem. Int. J. Comput. Vis. 2009, 81, 155–166. [Google Scholar] [CrossRef] [Green Version]
- Wenfu, X.; Bin, L.; Cheng, L.; Yu, L. Measurement and Planning Approach of Space Robot for Capturing Non-cooperative Target. Robot 2010, 32, 61–69. [Google Scholar] [CrossRef]


| K | L | ||
|---|---|---|---|
| Experimental Value | 0.2 | 2 pixels | 0.5 |
| Maximum Value | 0.055 | 1.025 pixels | 0.297 |
| Preset Value | 0.06 | 1.13 pixels | 0.33 |
| Circular-Ring | AprilTag | ArUco | Checkerboard | |
|---|---|---|---|---|
| Identification | 1.7–5.8 | 1.3–6.1 | 0.9–5.8 | 1.1–4.3 |
| Circular-Ring | AprilTag | ArUco | Checkerboard | |
|---|---|---|---|---|
| Low exposure | 400 | 100 | 200 | 100 |
| High exposure | 6600 | 3600 | 4200 | 3800 |
| Circular-Ring | AprilTag | ArUco | Checkerboard | |
|---|---|---|---|---|
| Time | 0.077 | 1.581 | 0.052 | 1.347 |
| Circular-Ring | AprilTag | ArUco | Checkerboard | |
|---|---|---|---|---|
| (0°)/mm | 3.99 | 13.56 | 19.17 | 33.43 |
| (0°)/° | 2.410 | 3.713 | 4.205 | 6.974 |
| (45°)/mm | 32.94 | 81.95 | 93.23 | 190.69 |
| (45°)/° | 1.915 | 4.798 | 4.108 | 6.651 |
| Relative Error [%] | ||||||||
|---|---|---|---|---|---|---|---|---|
| Circular Ring | AprilTag | ArUco | Checkerboard | |||||
| avg | max | avg | max | avg | max | avg | max | |
| 0.43 | 0.96 | 1.31 | 4.29 | 1.07 | 4.80 | 1.35 | 4.49 | |
| 0.26 | 0.50 | 0.88 | 1.27 | 0.64 | 1.84 | 0.78 | 1.83 | |
| 0.18 | 0.32 | 0.18 | 0.41 | 0.39 | 0.60 | 0.19 | 0.39 | |
| Mean Error [mm] | ||||
|---|---|---|---|---|
| Circular-Ring | AprilTag | ArUco | Checkerboard | |
| mm | 21.1 | 41.8 | 62.0 | 109.8 |
| mm | 6.8 | 19.5 | 30.8 | 32.2 |
| mm | 3.4 | 17.8 | 7.0 | 15.3 |
| Absolute Error [mm] | ||||||||
|---|---|---|---|---|---|---|---|---|
| Circular Ring | AprilTag | ArUco | Checkerboard | |||||
| avg | max | avg | max | avg | max | avg | max | |
| 1 | 3.4 | 8.0 | 8.8 | 26.5 | 29.0 | 74.4 | 22.5 | 62.5 |
| 2 | 2.4 | 6.1 | 14.2 | 46.7 | 17.4 | 58.9 | 23.8 | 79.0 |
| 3 | 3.8 | 10.7 | 19.5 | 47.2 | 7.9 | 17.1 | 32.2 | 101.4 |
| 4 | 6.8 | 17.6 | 17.0 | 52.7 | 30.8 | 88.2 | 20.1 | 58.3 |
| Circular-Ring | AprilTag | ArUco | Checkerboard | ||||||
|---|---|---|---|---|---|---|---|---|---|
| avg | max | avg | max | avg | max | avg | max | ||
| vertical | Absolute error [mm] | 101.9 | 269.4 | 258.5 | 436.6 | 245.0 | 569.8 | 284.0 | 973.0 |
| Relative error [%] | 1.67 | 4.42 | 4.24 | 7.16 | 4.02 | 9.34 | 4.66 | 15.95 | |
| horizontal | Absolute error [mm] | 48.4 | 125.9 | 90.7 | 243.7 | 111.8 | 259.2 | 134.6 | 415.4 |
| Relative error [%] | 0.79 | 2.06 | 1.49 | 4.00 | 1.83 | 4.25 | 2.21 | 6.81 | |
| Absolute Error [°] | ||||||||
|---|---|---|---|---|---|---|---|---|
| Circular Ring | AprilTag | ArUco | Checkerboard | |||||
| avg | max | avg | max | avg | max | avg | max | |
| Pitch/Yaw | 2.807 | 4.927 | 4.011 | 9.626 | 3.380 | 5.157 | 6.933 | 9.225 |
| Roll | 0.745 | 1.776 | 1.948 | 3.438 | 0.573 | 1.490 | 1.604 | 3.380 |
| Circular Ring | AprilTag | ArUco | Checkerboard | ||
|---|---|---|---|---|---|
| 5.5 (translation) | 0° | 1 | 3.4 | 4.8 | 8.4 |
| 45° | 1 | 2.5 | 2.8 | 5.8 | |
| 5.7.1 (translation) | low | 1 | 3.0 | 2.5 | 3.1 |
| medium | 1 | 3.4 | 2.5 | 3.0 | |
| high | 1 | 1 | 2.2 | 1.1 | |
| 5.7.2 (translation) | little | 1 | 2.0 | 2.9 | 5.2 |
| medium | 1 | 2.9 | 4.5 | 4.7 | |
| big | 1 | 5.2 | 2.1 | 4.5 | |
| 5.7.4 (translation) | horizontal | 1 | 1.9 | 2.3 | 2.8 |
| vertical | 1 | 2.5 | 2.4 | 2.8 | |
| 5.5 (rotation) | 0° | 1 | 1.5 | 1.7 | 2.9 |
| 45° | 1 | 2.5 | 2.1 | 3.5 | |
| 5.7.5 (rotation) | Pitch/Yaw | 1 | 1.4 | 1.2 | 2.5 |
| Roll | 1 | 2.6 | 0.8 | 2.2 |
Publisher’s Note: MDPI stays neutral with regard to jurisdictional claims in published maps and institutional affiliations. |
© 2021 by the authors. Licensee MDPI, Basel, Switzerland. This article is an open access article distributed under the terms and conditions of the Creative Commons Attribution (CC BY) license (http://creativecommons.org/licenses/by/4.0/).
Share and Cite
Yu, J.; Jiang, W.; Luo, Z.; Yang, L. Application of a Vision-Based Single Target on Robot Positioning System. Sensors 2021, 21, 1829. https://doi.org/10.3390/s21051829
Yu J, Jiang W, Luo Z, Yang L. Application of a Vision-Based Single Target on Robot Positioning System. Sensors. 2021; 21(5):1829. https://doi.org/10.3390/s21051829
Chicago/Turabian StyleYu, Jing, Wensong Jiang, Zai Luo, and Li Yang. 2021. "Application of a Vision-Based Single Target on Robot Positioning System" Sensors 21, no. 5: 1829. https://doi.org/10.3390/s21051829