
SSVM: An Ultra-Low-Power Strain Sensing and Visualization Module for Long-Term Structural Health Monitoring

 ,
, 
 and
and
Abstract
:1. Introduction
2. Proposed Design for SSVM
2.1. Strain Sensing Circuit
2.2. Power Management Circuit
2.3. Microcontroller Unit (MCU)
2.4. Visualization of QR Code on EPD
2.4.1. QR Code Generation
2.4.2. Padding at the Boarders
2.4.3. Scaling Up QR Code
2.4.4. Conversion to EPD Format
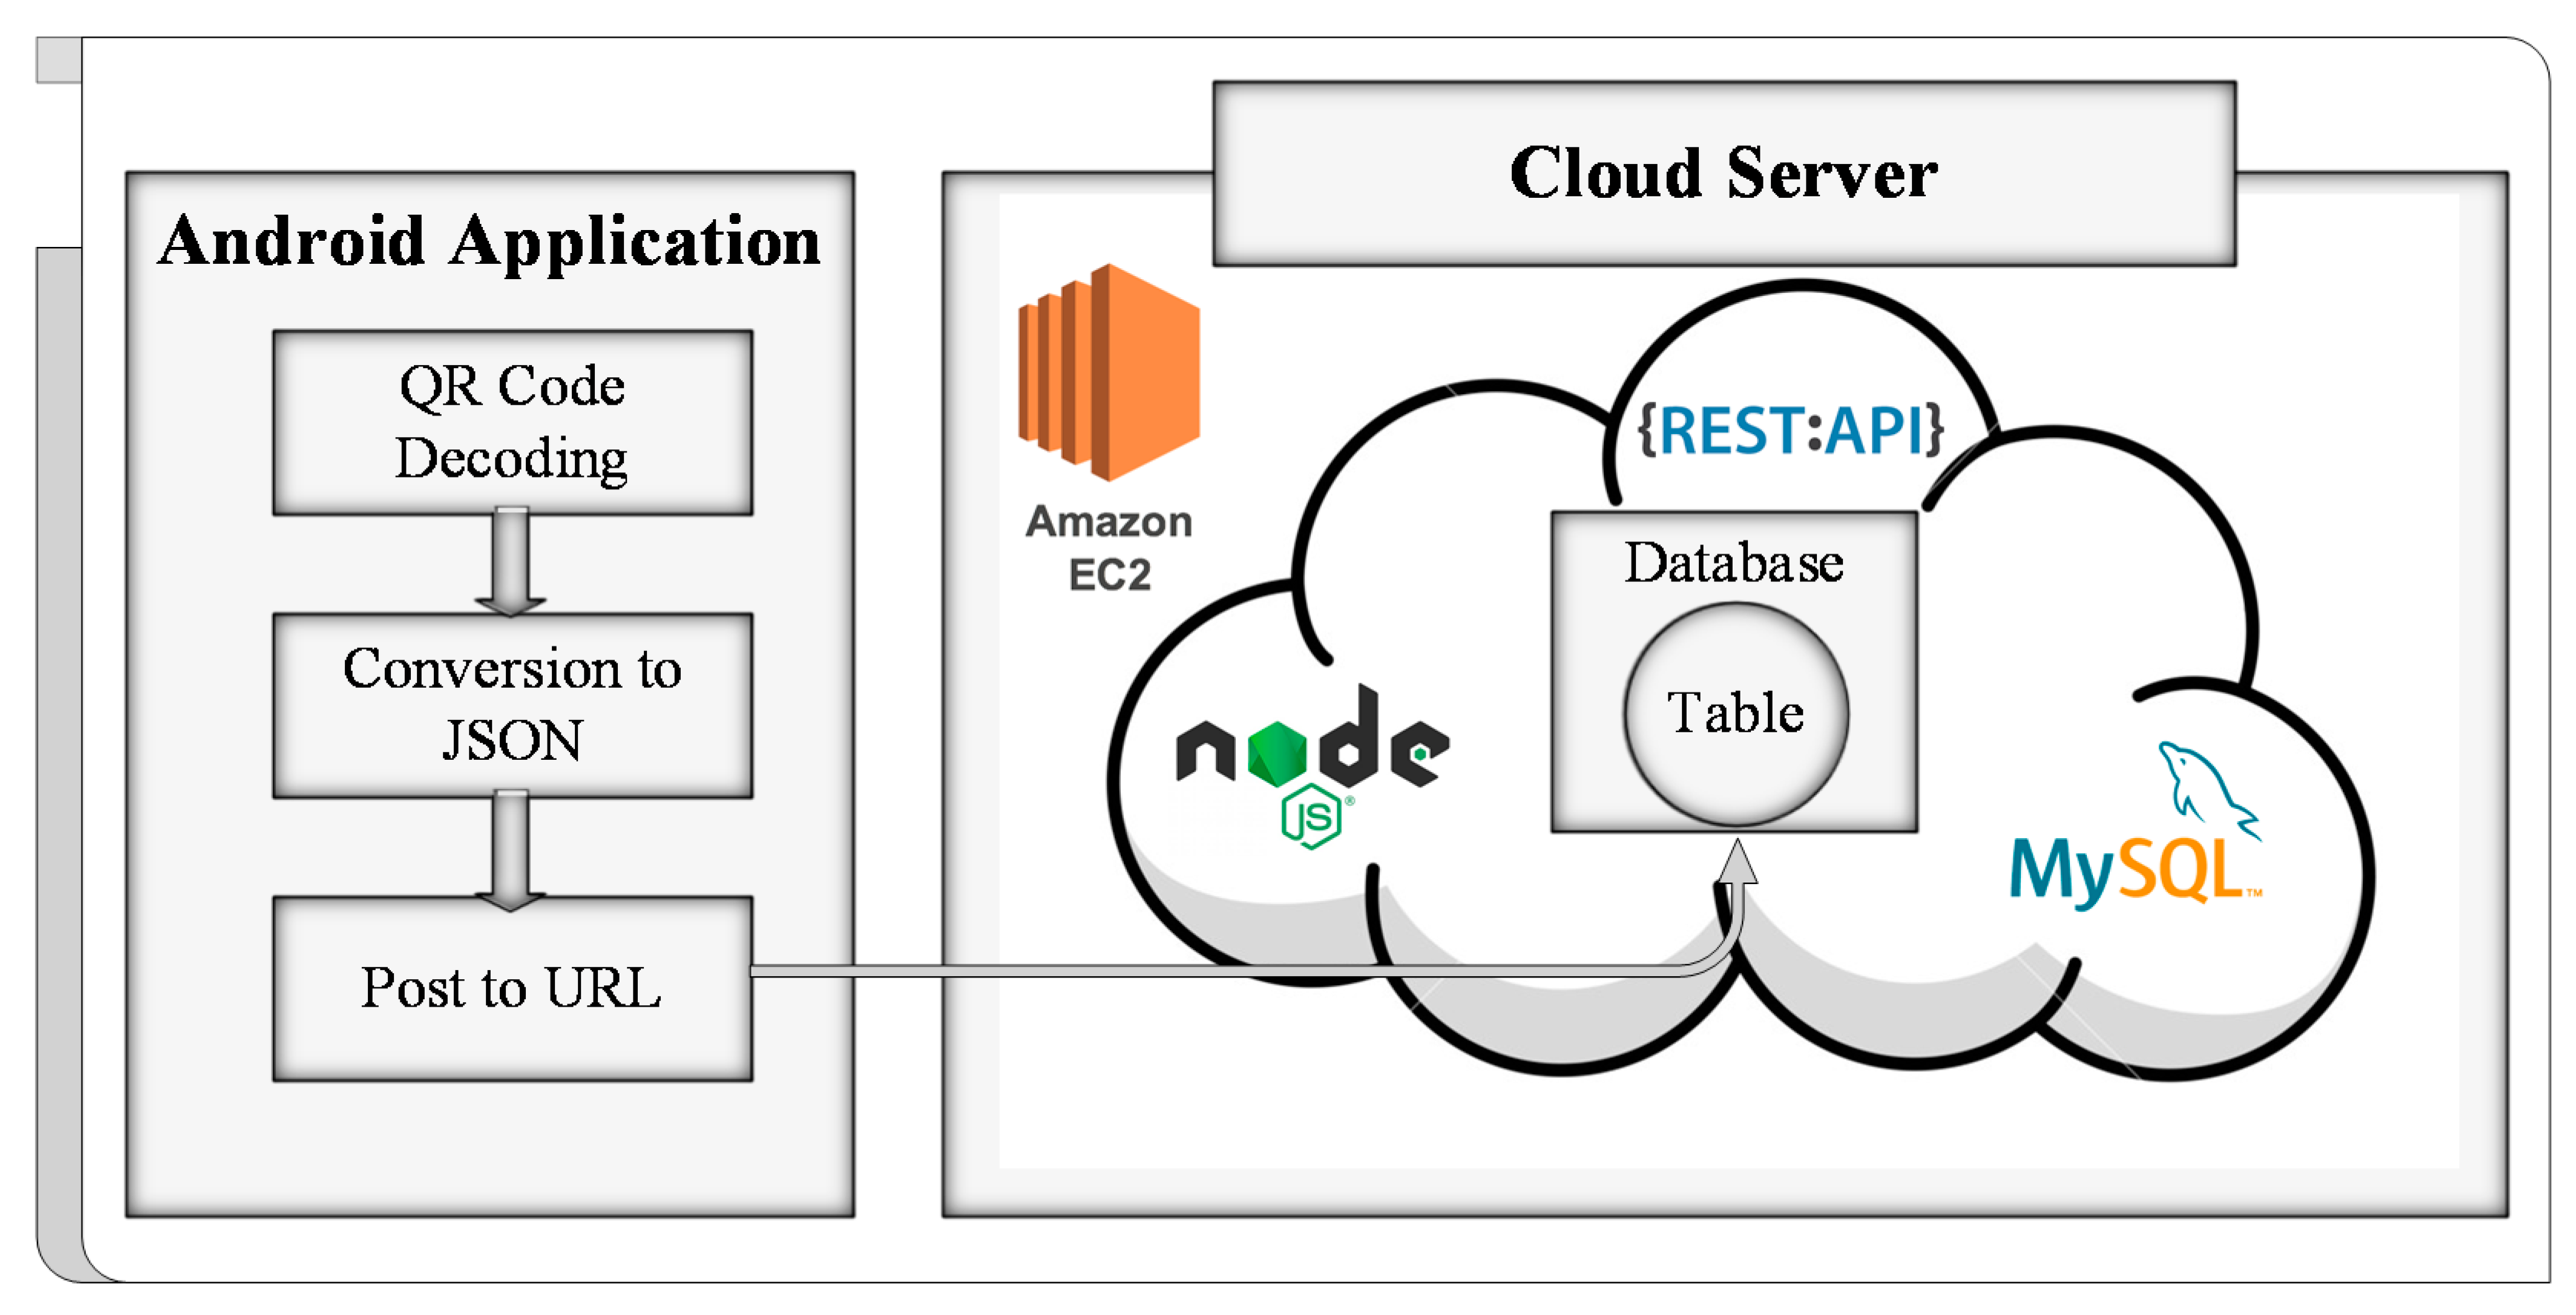
2.5. Data Storage
2.5.1. Server Setup and DB Creation
2.5.2. Smartphone Application Development
3. Development of SSVM Prototype
3.1. Hardware Integration
3.2. Software Integration
4. Evaluation of SSVM from Lab Scale Experiment
5. Power Consumption Analysis of SSVM
6. Discussion
7. Conclusions
Author Contributions
Funding
Conflicts of Interest
Abbreviations
| SSVM | strain sensing and visualization module |
| EPD | electronic-paper display |
| MCU | microcontroller unit |
| EL | electro-luminance |
| SID | structure identity code |
| TS | Timestamp |
| Timer (RTC) | real time clock |
| ADC | analog to digital converter |
| ENOB | effective number of bits |
| SPS | sample per seconds |
| DB | database |
| URL | Uniform Resource Locator |
References
- Sony, S.; Laventure, S.; Sadhu, A. A literature review of next-generation smart sensing technology in structural health monitoring. Struct. Control Health Monit. 2019, 26, e2321. [Google Scholar] [CrossRef]
- Güemes, A.; Fernandez-Lopez, A.; Pozo, A.R.; Sierra-Pérez, J. Structural health monitoring for advanced composite structures: A review. J. Compos. Sci. 2020, 4, 13. [Google Scholar] [CrossRef] [Green Version]
- Kralovec, C.; Schagerl, M. Review of structural health monitoring methods regarding a multi-sensor approach for damage assessment of metal and composite structures. Sensors 2020, 20, 826. [Google Scholar] [CrossRef] [Green Version]
- Farrar, C.R.; Worden, K. An introduction to structural health monitoring. Philos. Trans. R. Soc. A Math. Phys. Eng. Sci. 2007, 365, 303–315. [Google Scholar] [CrossRef]
- Barthorpe, R.J.; Worden, K. Emerging trends in optimal structural health monitoring system design: From sensor placement to system evaluation. J. Sens. Actuator Netw. 2020, 9, 31. [Google Scholar] [CrossRef]
- Park, J.-W.; Sim, S.-H.; Jung, H.-J. Development of a wireless displacement measurement system using acceleration responses. Sensors 2013, 13, 8377–8392. [Google Scholar] [CrossRef] [PubMed] [Green Version]
- Kim, N.-S.; Cho, N.-S. Estimating deflection of a simple beam model using fiber optic Bragg-grating sensors. Exp. Mech. 2004, 44, 433–439. [Google Scholar] [CrossRef]
- Kim, S.-W.; Kang, W.-R.; Jeong, M.-S.; Lee, I.; Kwon, I.-B. Deflection estimation of a wind turbine blade using FBG sensors embedded in the blade bonding line. Smart Mater. Struct. 2013, 22, 125004. [Google Scholar] [CrossRef]
- Liu, H.-L.; Zhu, Z.-W.; Zheng, Y.; Liu, B.; Xiao, F. Experimental study on an FBG strain sensor. Opt. Fiber Technol. 2018, 40, 144–151. [Google Scholar] [CrossRef]
- Kang, L.-H.; Kim, D.-K.; Han, J.-H. Estimation of dynamic structural displacements using fiber Bragg grating strain sensors. J. Sound Vib. 2007, 305, 534–542. [Google Scholar] [CrossRef]
- Lee, Y.; Blaauw, D.; Sylvester, D. Ultralow power circuit design for wireless sensor nodes for structural health monitoring. Proc. IEEE 2016, 104, 1529–1546. [Google Scholar] [CrossRef]
- Jang, S.; Jo, H.; Cho, S.; Mechitov, K.; Rice, J.A.; Sim, S.-H.; Jung, H.-J.; Yun, C.-B.; Spencer, B.F., Jr.; Agha, G. Structural health monitoring of a cable-stayed bridge using smart sensor technology: Deployment and evaluation. Smart Struct. Syst. 2010, 6, 439–459. [Google Scholar] [CrossRef] [Green Version]
- Cheng, L.; Pakzad, S.N. Agility of wireless sensor networks for earthquake monitoring of bridges. In Proceedings of the Sixth International Conference on Networked Sensing Systems (INSS), Pittsburgh, PA, USA, 17–19 June 2009; pp. 1–4. [Google Scholar]
- Noel, A.B.; Abdaoui, A.; Elfouly, T.; Ahmed, M.H.; Badawy, A.; Shehata, M.S. Structural health monitoring using wireless sensor networks: A comprehensive survey. IEEE Commun. Surv. Tutor. 2017, 19, 1403–1423. [Google Scholar] [CrossRef]
- Sim, S.-H.; Li, J.; Jo, H.; Park, J.-W.; Cho, S.; Spencer, B.F., Jr.; Jung, H.-J. A wireless smart sensor network for automated monitoring of cable tension. Smart Mater. Struct. 2013, 23, 025006. [Google Scholar] [CrossRef]
- Soyoz, S.; Feng, M.Q. Long-term monitoring and identification of bridge structural parameters. Comput.-Aided Civ. Infrastruct. Eng. 2009, 24, 82–92. [Google Scholar] [CrossRef]
- Hoult, N.A.; Fidler, P.R.; Hill, P.G.; Middleton, C.R. Long-term wireless structural health monitoring of the Ferriby Road Bridge. J. Bridge Eng. 2010, 15, 153–159. [Google Scholar] [CrossRef] [Green Version]
- Rault, T.; Bouabdallah, A.; Challal, Y. Energy efficiency in wireless sensor networks: A top-down survey. Comput. Netw. 2014, 67, 104–122. [Google Scholar] [CrossRef] [Green Version]
- Silva, A.; Liu, M.; Moghaddam, M. Power-management techniques for wireless sensor networks and similar low-power communication devices based on nonrechargeable batteries. J. Comput. Netw. Commun. 2012, 2012, 757291. Available online: https://www.hindawi.com/journals/jcnc/2012/757291/ (accessed on 10 August 2020). [CrossRef]
- Hoang, T.; Fu, Y.; Mechitov, K.; Sánchez, F.G.; Kim, J.R.; Zhang, D.; Spencer, B.F. Autonomous end-to-end wireless monitoring system for railroad bridges. Adv. Bridge Eng. 2020, 1, 1–27. [Google Scholar] [CrossRef]
- O’Connor, S.M.; Zhang, Y.; Lynch, J.P.; Ettouney, M.M.; Jansson, P.O. Long-term performance assessment of the Telegraph Road Bridge using a permanent wireless monitoring system and automated statistical process control analytics. Struct. Infrastruct. Eng. 2017, 13, 604–624. [Google Scholar] [CrossRef]
- Xu, C.; Watanabe, T.; Akiyama, M.; Zheng, X. Artificial skin to sense mechanical stress by visible light emission. Appl. Phys. Lett. 1999, 74, 1236–1238. [Google Scholar] [CrossRef]
- Xu, C.-N.; Watanabe, T.; Akiyama, M.; Zheng, X.-G. Direct view of stress distribution in solid by mechanoluminescence. Appl. Phys. Lett. 1999, 74, 2414–2416. [Google Scholar] [CrossRef]
- Wang, W.X.; Matsubara, T.; Takao, Y.; Imai, Y.; Xu, C.N. Visualization of stress distribution using smart mechanoluminescence sensor. Mater. Sci. Forum 2009, 614, 169–174. [Google Scholar] [CrossRef]
- Kim, J.S.; Kibble, K.; Kwon, Y.N.; Sohn, K.-S. Rate-equation model for the loading-rate-dependent mechanoluminescence of SrAl2O4: Eu2+, Dy3+. Opt. Lett. 2009, 34, 1915–1917. [Google Scholar] [CrossRef]
- Zhang, H.; Yamada, H.; Terasaki, N.; Xu, C.-N. Ultraviolet mechanoluminescence from SrAl2O4: Ce and SrAl2O4: Ce, Ho. Appl. Phys. Lett. 2007, 91, 081905. [Google Scholar] [CrossRef]
- Akiyama, M.; Nishikubo, K.; Nonaka, K. Intense visible light emission from stress-activated SrMgAl6O11: Eu. Appl. Phys. Lett. 2003, 83, 650–652. [Google Scholar] [CrossRef]
- Zhang, H.; Terasaki, N.; Yamada, H.; Xu, C.-N. Blue Light Emission from Stress-Activated SR2MGSI2O7: EU. Int. J. Mod. Phys. B 2009, 23, 1028–1033. [Google Scholar] [CrossRef]
- Chandra, V.; Chandra, B. Suitable materials for elastico mechanoluminescence-based stress sensors. Opt. Mater. 2011, 34, 194–200. [Google Scholar] [CrossRef]
- Xu, J.; Jo, H. Development of high-sensitivity and low-cost electroluminescent strain sensor for structural health monitoring. IEEE Sens. J. 2015, 16, 1962–1968. [Google Scholar] [CrossRef]
- Potu, A.; Jayalakshmi, R.; Umpathy, K. Smart Paper Technology a Review Based On Concepts of EPaper Technology. IOSR J. Electron. Commun. Eng. 2016, 11, 42–47. [Google Scholar]
- Akwukwuma, V.; Chete, F. Electronic-Paper: The Electronic Display of the Future. Pac. J. Sci. Technol. 2012, 13, 173–180. [Google Scholar]
- Comiskey, B.; Albert, J.D.; Yoshizawa, H.; Jacobson, J. An electrophoretic ink for all-printed reflective electronic displays. Nature 1998, 394, 253–255. [Google Scholar] [CrossRef]
- Heikenfeld, J.; Drzaic, P.; Yeo, J.S.; Koch, T. A critical review of the present and future prospects for electronic paper. J. Soc. Inf. Disp. 2011, 19, 129–156. [Google Scholar] [CrossRef] [Green Version]
- Fleming, R.; Peruvemba, S.; Holman, R.; Ferguson, S.; Sadlik, B.; Johansson, T. Electronic Paper 2.0: Frustrated eTIR as a Path to Color and Video. SID Symp. Dig. Tech. Pap. 2018, 49, 630–632. [Google Scholar] [CrossRef]
- Fleming, R.; Kazlas, P.; Johansson, T.; Beales, G.; Manna, E.; Porush, V.; Han, J.; Mennen, J.; Aubert, J.; Sakai, T. Tablet-size eTIR Display for Low-power ePaper Applications with Color Video Capability. SID Symp. Dig. Tech. Pap. 2019, 50, 505–508. [Google Scholar] [CrossRef]
- Suciu, G.; Vochin, M.; Diaconu, C.; Suciu, V.; Butca, C. Convergence of software defined radio: WiFi, ibeacon and epaper. In Proceedings of the 2016 15th RoEduNet Conference: Networking in Education and Research, Bucharest, Romania, 7–9 September 2016. [Google Scholar]
- Kieseberg, P.; Leithner, M.; Mulazzani, M.; Munroe, L.; Schrittwieser, S.; Sinha, M.; Weippl, E. QR code security. In Proceedings of the 8th International Conference on Advances in Mobile Computing and Multimedia, Paris, France, 8–10 November 2010. [Google Scholar]
- All about Circuits. Strain Gauges. 2021. Available online: https://www.allaboutcircuits.com/textbook/direct-current/chpt-9/strain-gauges/ (accessed on 15 September 2020).
- Texas Instruments. ADS1220 Datasheet and Product Info. 2021. Available online: https://www.ti.com/lit/ds/symlink/ads1220.pdf?ts=1611239451651 (accessed on 15 September 2020).
- Joice. Protocentral_ADS1220. 2021. Available online: https://github.com/Protocentral/Protocentral_ADS1220 (accessed on 15 September 2020).
- Maxim Integrated. MAX6816 Datasheet and Product Info. 2021. Available online: https://datasheets.maximintegrated.com/en/ds/MAX6816-MAX6818.pdf (accessed on 15 September 2020).
- Maxim Integrated. DS3231 Datasheet and Product Info. 2021. Available online: https://datasheets.maximintegrated.com/en/ds/DS3231.pdf (accessed on 15 September 2020).
- Texas Instruments. SN74AUP1G58 Datasheet and Product Info. 2021. Available online: https://pdf1.alldatasheet.com/datasheet-pdf/view/107179/TI/SN74AUP1G58DCKT.html (accessed on 15 September 2020).
- Nexperia. 74AUP1G00 Datasheet and Product Info. 2021. Available online: https://assets.nexperia.com/documents/data-sheet/74AUP1G00.pdf (accessed on 15 September 2020).
- Texas Instruments. SN74LVC1G373 Datasheet and Product Info. 2021. Available online: https://www.ti.com/lit/ds/symlink/sn74lvc1g373.pdf?ts=1611245715032&ref_url=https%253A%252F%252Fwww.google.com%252F (accessed on 15 September 2020).
- Texas Instruments. TPS22860 Datasheet and Product Info. 2021. Available online: https://www.ti.com/lit/ds/symlink/tps22860.pdf?ts=1611212453928&ref_url=https%253A%252F%252Fwww.google.com%252F (accessed on 15 September 2020).
- Microchip, MCP1725 Datasheet and Product Info. 2021. Available online: http://ww1.microchip.com/downloads/en/DeviceDoc/22026b.pdf (accessed on 15 September 2020).
- Moore, R. QRcode. 2021. Available online: https://github.com/ricmoo/QRCode (accessed on 5 November 2020).
- Kumar, D.; Singh, A.; Omkar, S. A Novel Visual Cryptographic Method for Color Images. Int. J. Image Graph. Signal Process. 2013, 5, 49. [Google Scholar] [CrossRef]
- MySQL. MySQL Database Services. 2021. Available online: https://www.mysql.com/ (accessed on 5 November 2020).
- Amazon. Amazon AWS, EC2. 2021. Available online: https://aws.amazon.com/ec2/?ec2-whats-new.sort-by=item.additionalFields.postDateTime&ec2-whats-new.sort-order=desc (accessed on 5 November 2020).
- MobaXterm. MobaXterm Sever and SSH Client. 2021. Available online: https://mobaxterm.mobatek.net/ (accessed on 5 November 2020).
- MySQL. MySQL Workbench. 2021. Available online: https://www.mysql.com/products/workbench/ (accessed on 5 November 2020).
- OpenJS Foundation. Node.Js. 2021. Available online: https://nodejs.org/en/ (accessed on 5 November 2020).
- Express. Body-Parser. 2021. Available online: http://expressjs.com/en/resources/middleware/body-parser.html (accessed on 5 November 2020).
- NPM. Request. 2021. Available online: https://www.npmjs.com/package/request (accessed on 5 November 2020).
- Developers. Android Studio. 2021. Available online: https://developer.android.com/studio?gclid=CjwKCAiAu8SABhAxEiwAsodSZBml0FKYOgBCGQfKFTnDg_6zAC9_YTsQrTXyZgzmo8HF7bO5tL-5OBoCKU4QAvD_BwE&gclsrc=aw.ds (accessed on 5 November 2020).
- Budiyev, Y. Code Scanner. 2021. Available online: https://github.com/yuriy-budiyev/code-scanner (accessed on 5 November 2020).
- Google. Volley. 2021. Available online: https://github.com/google/volley (accessed on 5 November 2020).
- Spencer, B., Jr.; Park, J.-W.; Mechitov, K.; Jo, H.; Agha, G. Next generation wireless smart sensors toward sustainable civil infrastructure. Procedia Eng. 2017, 171, 5–13. [Google Scholar] [CrossRef]
- Sarwar, M.Z.; Saleem, M.R.; Park, J.-W.; Moon, D.-S.; Kim, D.J. Multimetric Event-Driven System for Long-Term Wireless Sensor Operation for SHM Applications. IEEE Sens. J. 2020, 20, 5350–5359. [Google Scholar] [CrossRef] [Green Version]
- Hashmi, M.U.; Labidi, W.; Bušić, A.; Elayoubi, S.-E.; Chahed, T. Long-term revenue estimation for battery performing arbitrage and ancillary services. In Proceedings of the 2018 IEEE International Conference on Communications, Control, and Computing Technologies for Smart Grids (SmartGridComm), Aalborg, Denmark, 29–31 October 2018. [Google Scholar]
- Xu, H.; Ren, W.-X.; Wang, Z.-C. Deflection estimation of bending beam structures using fiber bragg grating strain sensors. Adv. Struct. Eng. 2015, 18, 395–403. [Google Scholar] [CrossRef]
- Park, J.-W.; Sim, S.-H.; Jung, H.-J. Displacement estimation using multimetric data fusion. IEEE/ASME Trans. Mechatron. 2013, 18, 1675–1682. [Google Scholar] [CrossRef]


| Variable Array | Size (Dimension) | Size (Bytes) |
|---|---|---|
| raw_QR | 29 × 29 | 841 |
| padded_QR | 33 × 33 | 1089 |
| upsized_QR | 400 × 400 | 160,000 |
| EPD_Format | 20,000 | 20,000 |
| Total | 178 kB | |
| Label | Components/Devices |
|---|---|
| 1 | nRF52840 (MCU) |
| 2 | ZS-042 (DS3231 RTC module) |
| 3 | Push-button |
| 4 | MAX6816 (Debounser) |
| 5 | Battery connector |
| 6 | SN74AUP1G58 (Universal gate) |
| 7 | 74AUP1G00 (NAND gate) |
| 8 | SN74LVC1G373 (D-type latch) |
| 9 | RC delay element |
| 10 | TPS22860 (Digital switch) |
| 11 | MCP1725 (Voltage regulators) |
| 12 | Power connector for the strain-to-voltage conversion circuit |
| 13 | Differential voltage input connector |
| 14 | RC low pass filter |
| 15 | ADS1220 (24-bit ADC) |
| 16 | 8-pin EPD driver connector |
| 17 | Connector for supplying power supply to the circuit |
| 18 | Bridge balancing resistors |
| 19 | Probes for output differential voltage |
| 20 | Strain leads for half-bridge configuration |
| 21 | EPD |
| 22 | EPD driver circuit |
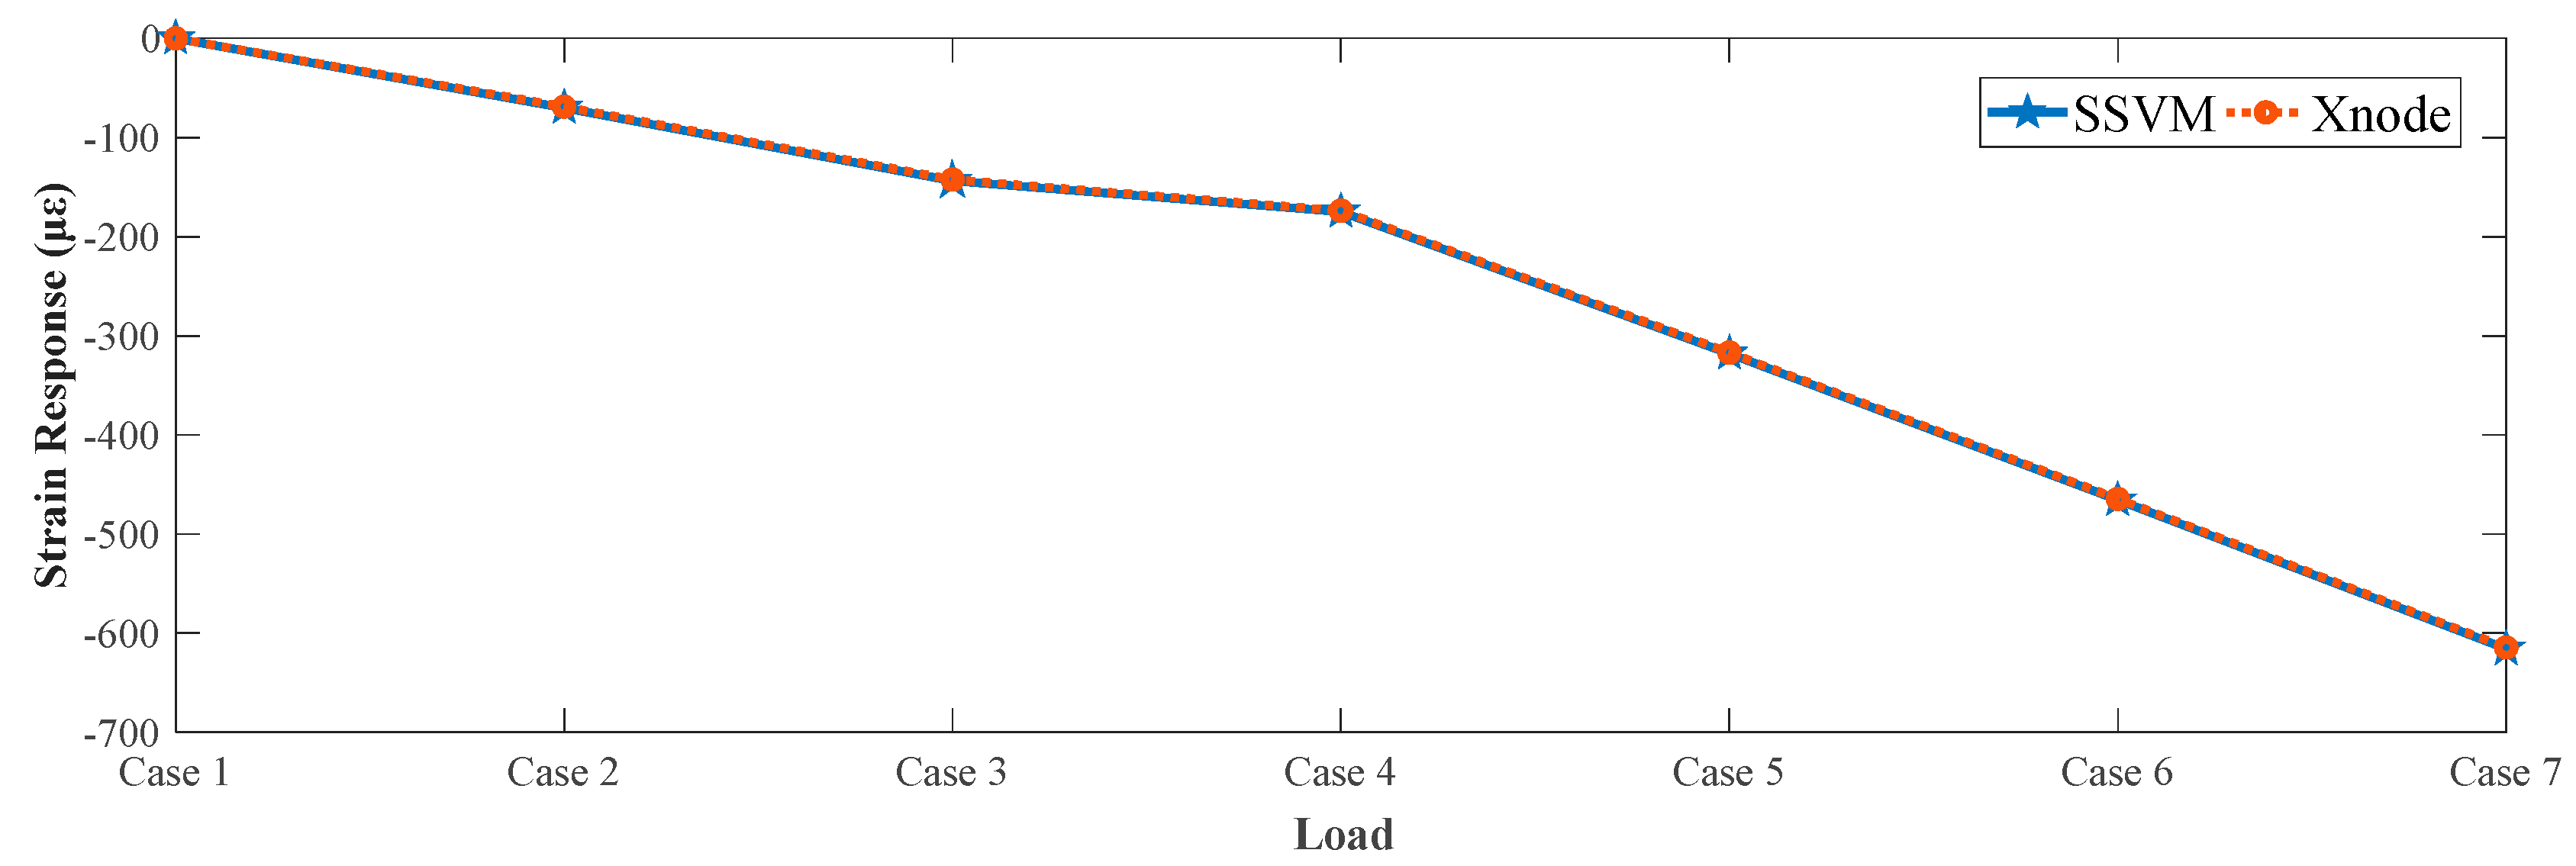
| Loading Materials | Xnode (με) | SSVM (με) | |
|---|---|---|---|
| Case 1 | No Load | 0 | 0 |
| Case 2 | 4 plates | −68.93 | −70.06 |
| Case 3 | 8 plates | −142.52 | −143.80 |
| Case 4 | 10 plates | −173.77 | −174.81 |
| Case 5 | 10 plates, 2 batteries | −316.94 | −318.06 |
| Case 6 | 10 plates, 4 batteries | −464.53 | −465.72 |
| Case 7 | 10 plates, 6 batteries | −614.5 | −615.68 |
| Device | Current Consumption (IIDLE) |
|---|---|
| ZS-042 (DS3231 RTC module) | 200 μA |
| MAX6816 (Debounser) | 6 μA |
| SN74AUP1G58 (Universal gate) | 0.9 μA |
| SN74LVC1G373 (D-type latch) | 10 μA |
| 74AUP1G00 (NAND gate) | 0.9 μA |
| TPS22860 (Digital switch) | 0.1 μA |
| MCP1725 (Voltage regulators) | 120 μA |
| Total | 337.9 μA |
Publisher’s Note: MDPI stays neutral with regard to jurisdictional claims in published maps and institutional affiliations. |
© 2021 by the authors. Licensee MDPI, Basel, Switzerland. This article is an open access article distributed under the terms and conditions of the Creative Commons Attribution (CC BY) license (http://creativecommons.org/licenses/by/4.0/).
Share and Cite
Khan, S.; Won, J.; Shin, J.; Park, J.; Park, J.-W.; Kim, S.-E.; Jang, Y.; Kim, D.J. SSVM: An Ultra-Low-Power Strain Sensing and Visualization Module for Long-Term Structural Health Monitoring. Sensors 2021, 21, 2211. https://doi.org/10.3390/s21062211
Khan S, Won J, Shin J, Park J, Park J-W, Kim S-E, Jang Y, Kim DJ. SSVM: An Ultra-Low-Power Strain Sensing and Visualization Module for Long-Term Structural Health Monitoring. Sensors. 2021; 21(6):2211. https://doi.org/10.3390/s21062211
Chicago/Turabian StyleKhan, Suleman, Jongbin Won, Junsik Shin, Junyoung Park, Jong-Woong Park, Seung-Eock Kim, Yun Jang, and Dong Joo Kim. 2021. "SSVM: An Ultra-Low-Power Strain Sensing and Visualization Module for Long-Term Structural Health Monitoring" Sensors 21, no. 6: 2211. https://doi.org/10.3390/s21062211