
Wearable Technologies for Mental Workload, Stress, and Emotional State Assessment during Working-Like Tasks: A Comparison with Laboratory Technologies

 , , , ,
Abstract
:1. Introduction
1.1. Monitoring Mental States
1.2. Consumer Wearables in Scientific Research
1.3. Aim of the Present Study
- RQ1: Are the above-mentioned neurophysiological parameters (EBR, SCL and HR) gathered through consumer wearable devices comparable with those acquired with laboratory equipment?
- RQ2: Are consumer wearable devices reliable in discriminating different levels of the mental states considered (WL, Stress and EmS)?
2. Materials and Methods
2.1. Participants
2.2. Procedures
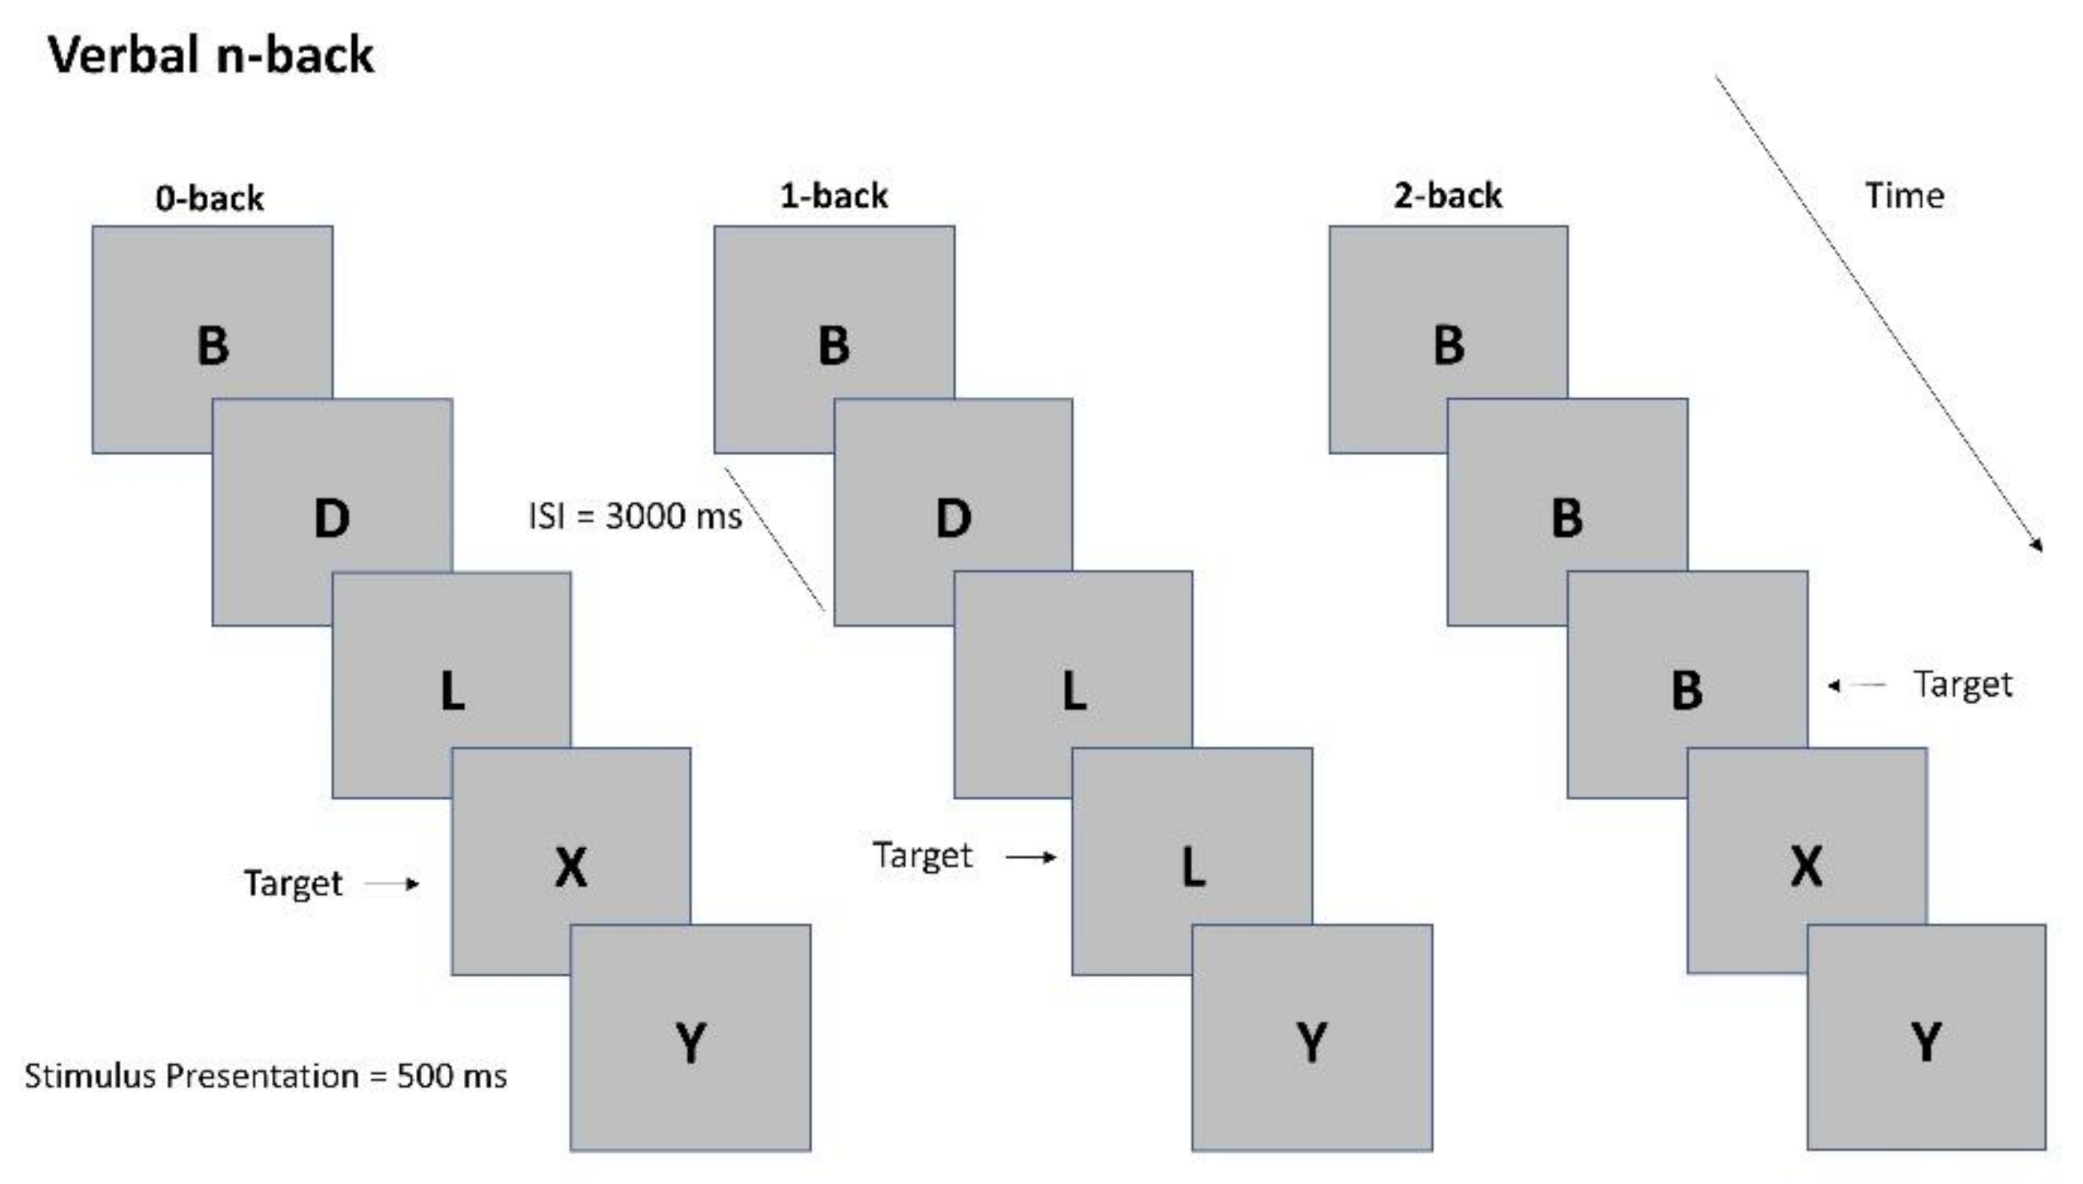
2.2.1. N-Back Task
- Baseline: Participants were instructed to watch the sequence of letters without giving any response.
- Low WL: 0-back. The task consisted in indicating when the stimulus on the screen matches a predetermined letter.
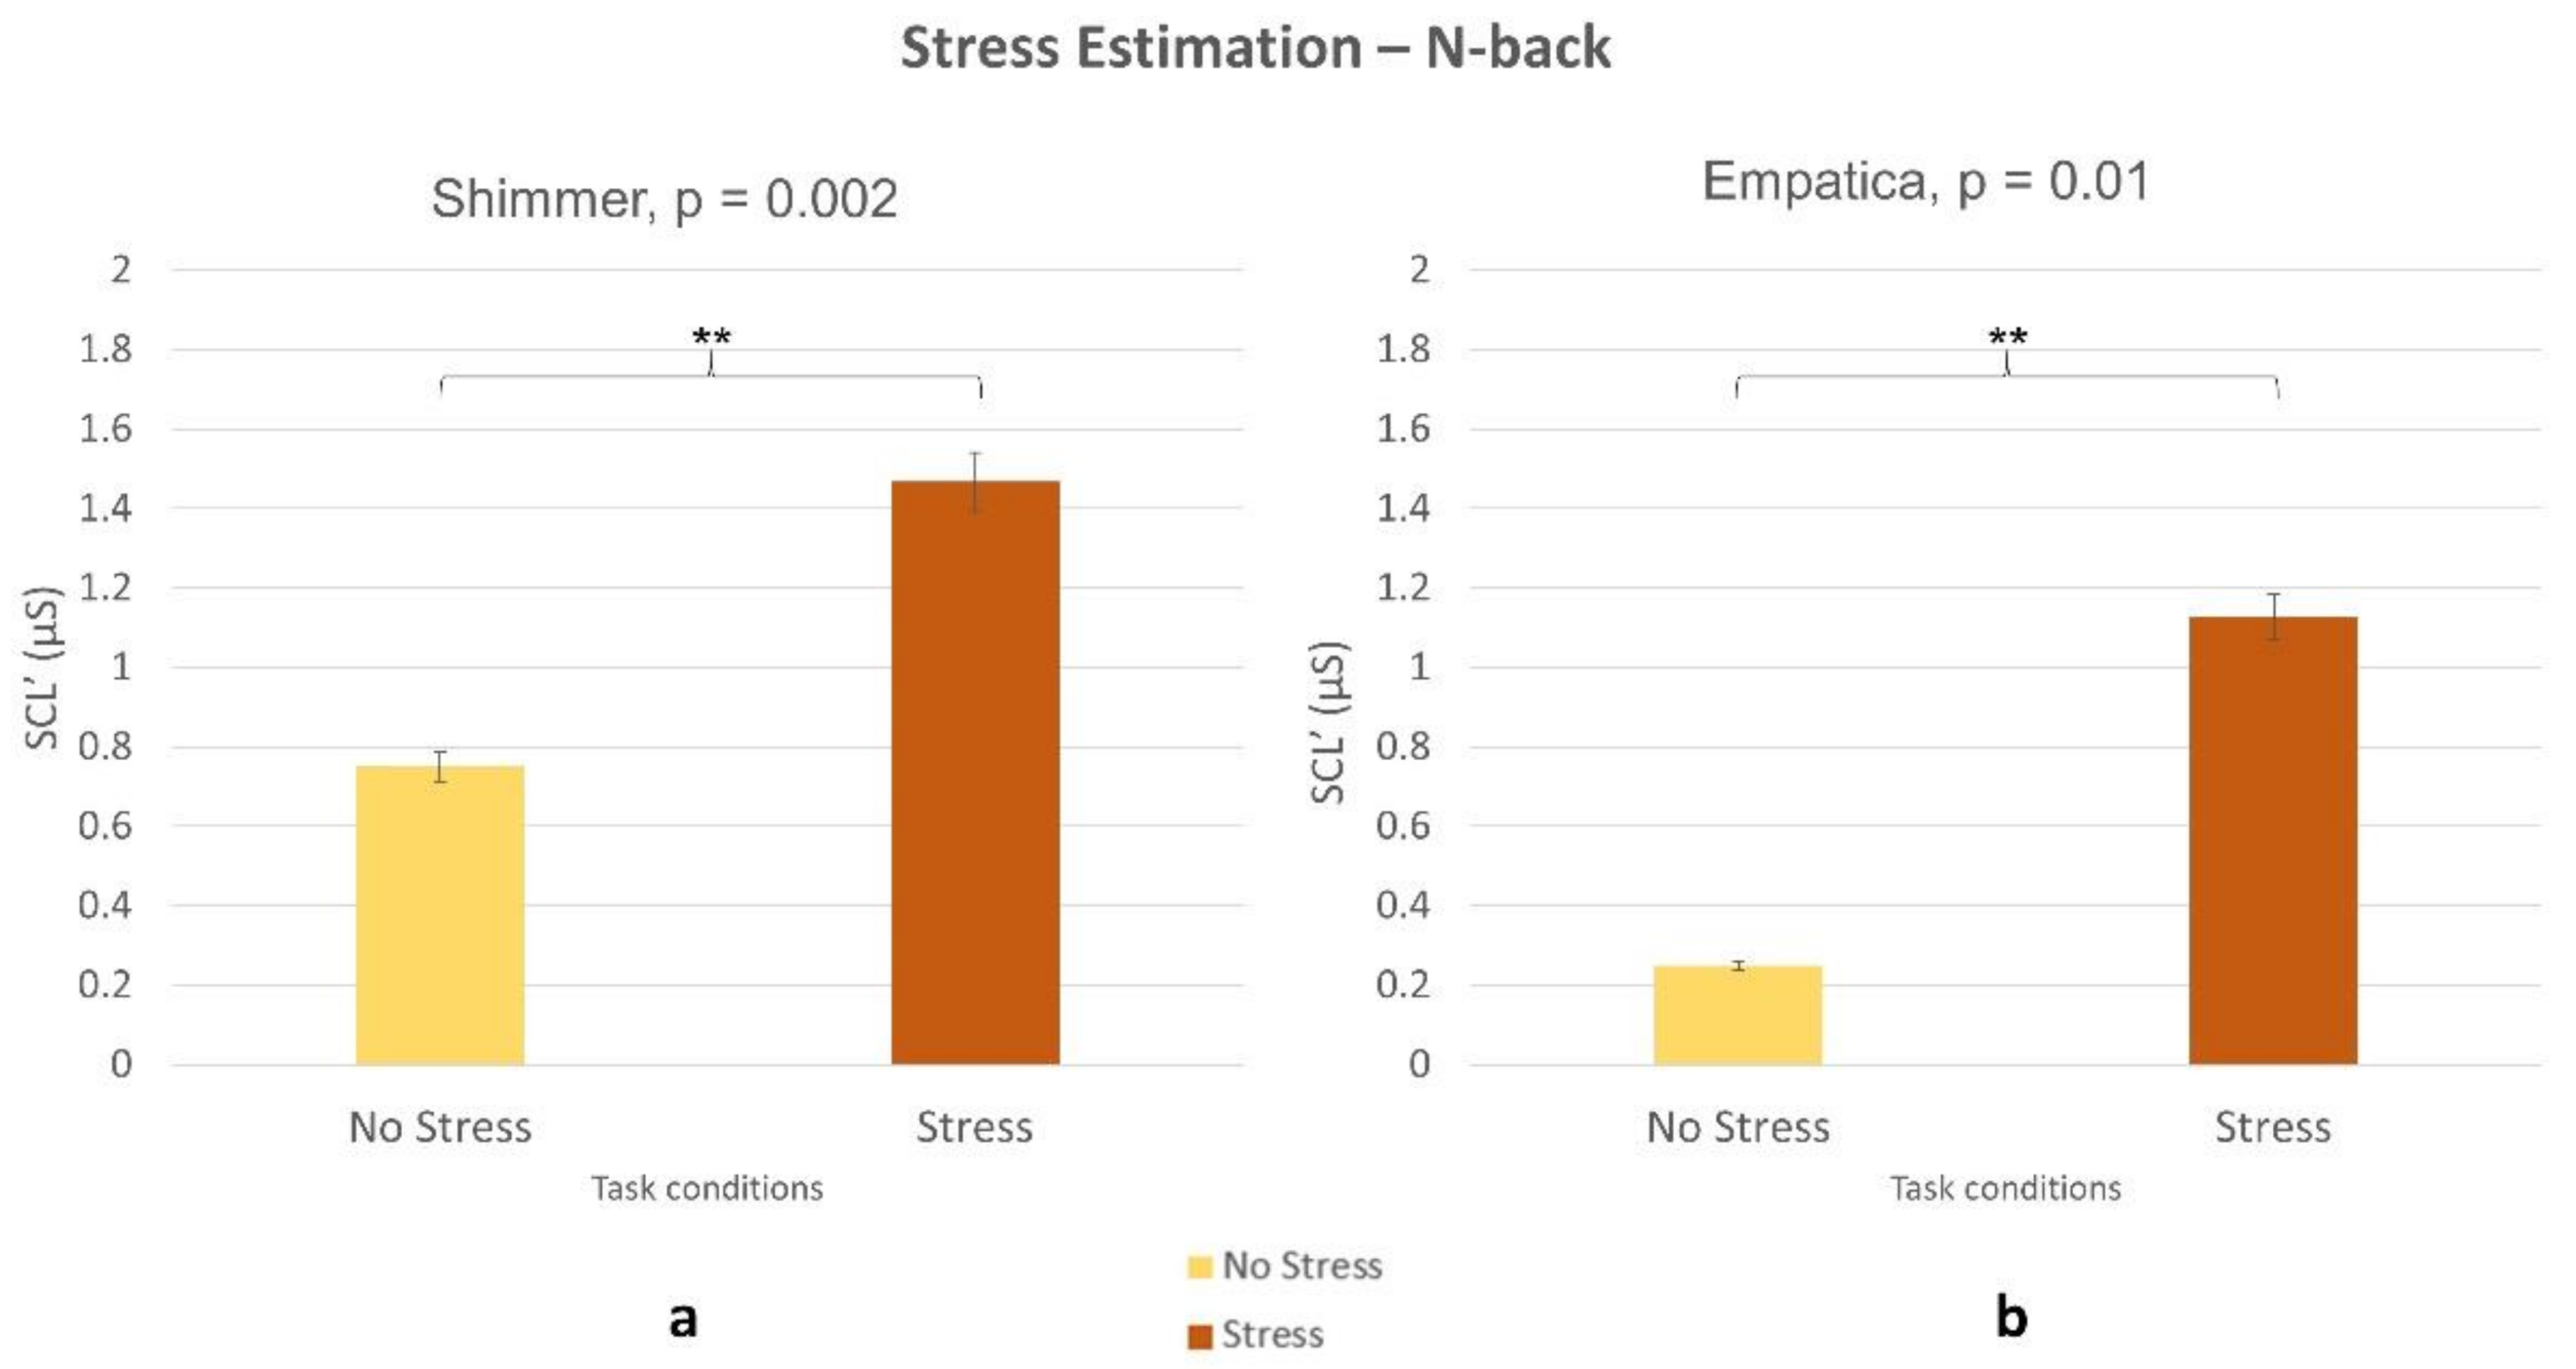
- High WL: 2-back. The task consisted in indicating when the stimulus occurred in the series 2 steps before. When investigating stress assessment, we referred to this condition as ‘No Stress’ condition (i.e., in the comparison ‘No Stress vs. Stress’) as it differed from the Stress one only in the presence of the stressors whilst the difficulty level was the same.
- Stress: The task was practically equivalent to the High WL one (indicating when the stimulus occurred in the series two steps before) but simultaneously high intensity noise was played (85 db) and the white-coat effect was used to stress the participant [35]. Four-minute relaxing music and video was played at the end of this phase for letting the participants recover from the stressful event before continuing with the remaining experimental conditions [36].
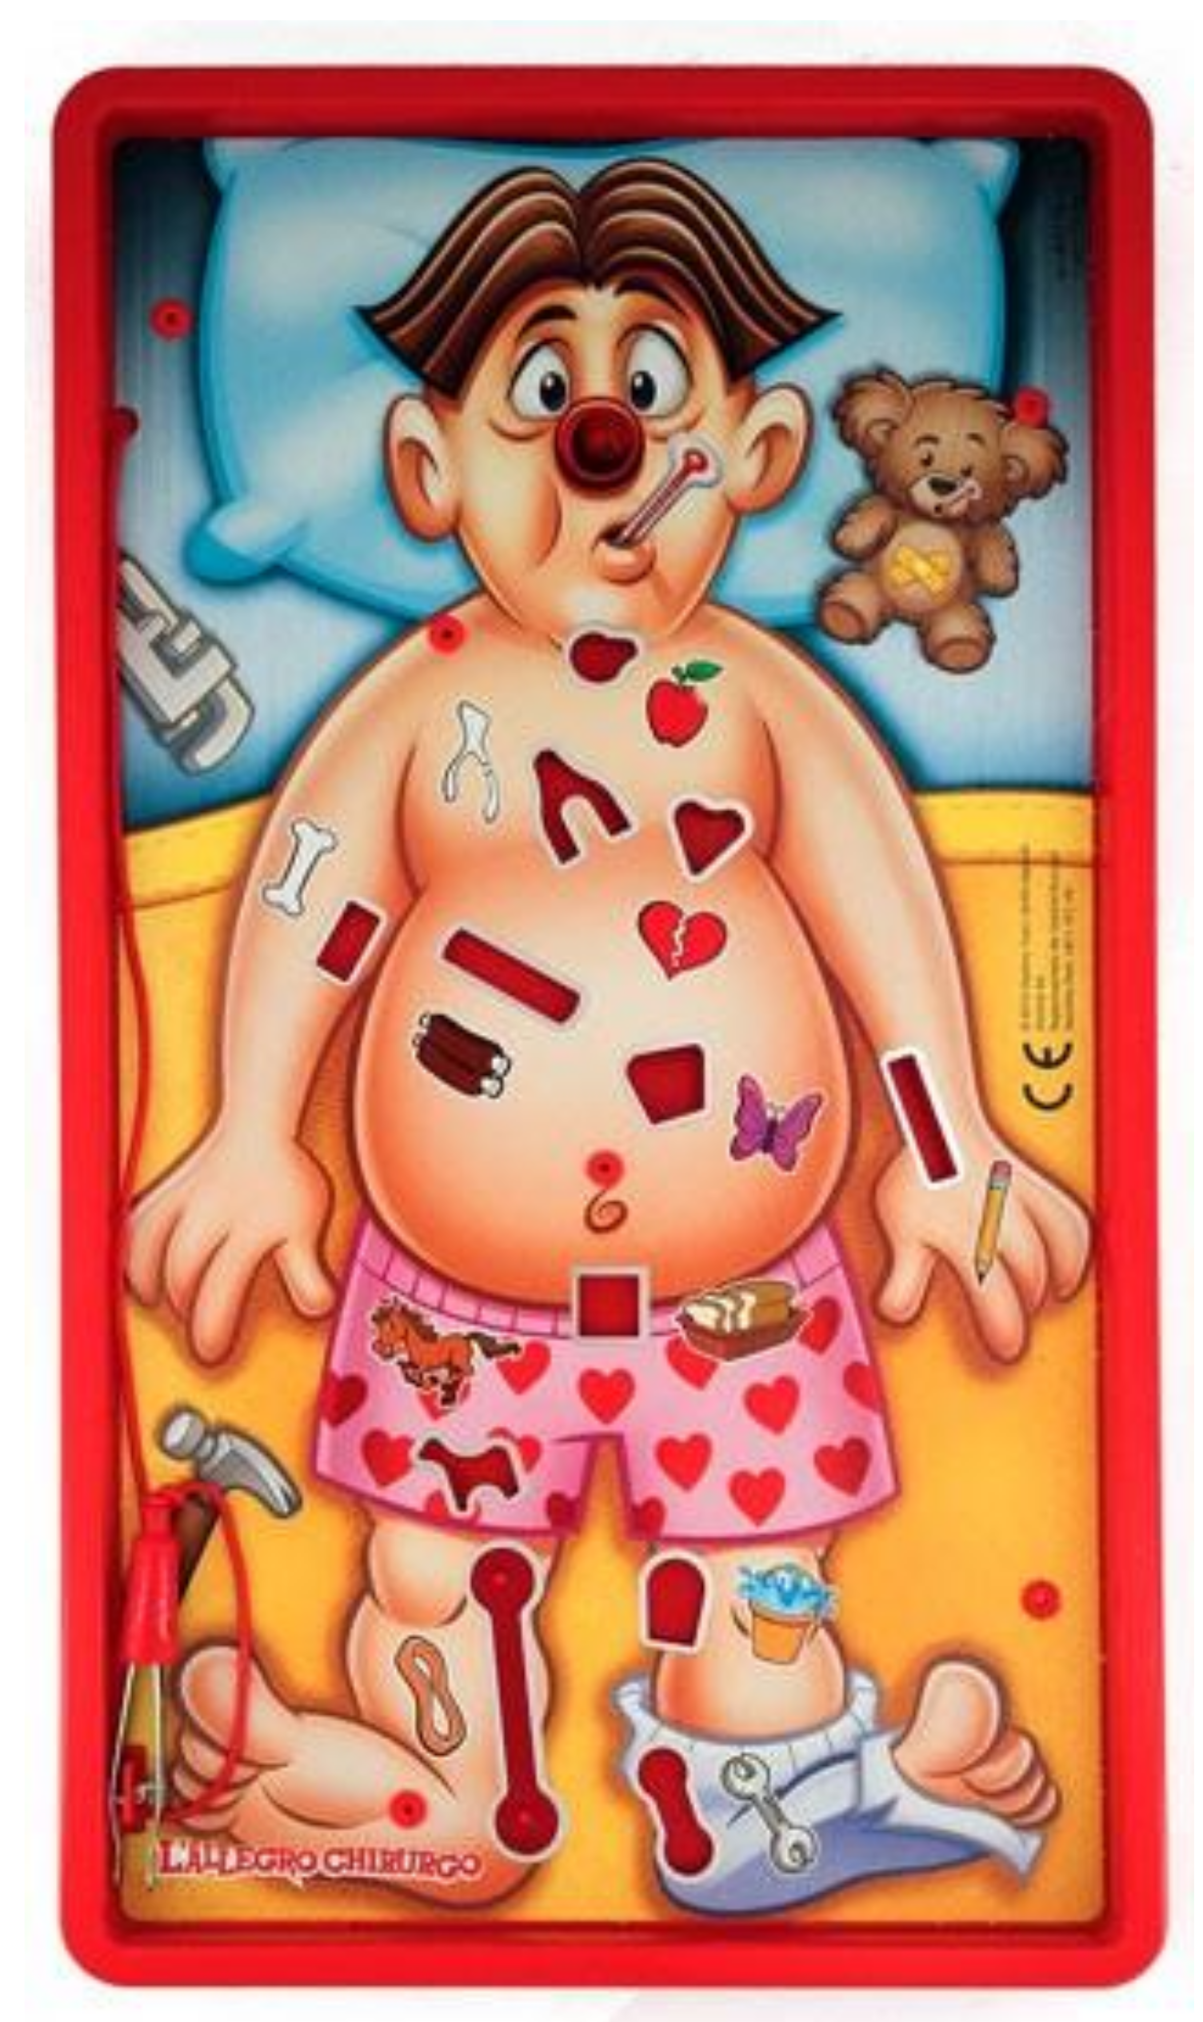
2.2.2. Doctor Game Task
- Baseline: Participants were instructed to watch the board game without touching the board itself nor the objects.
- Low WL: Participants were asked to remove five predefined objects (the easiest ones). They had three minutes to complete the task.
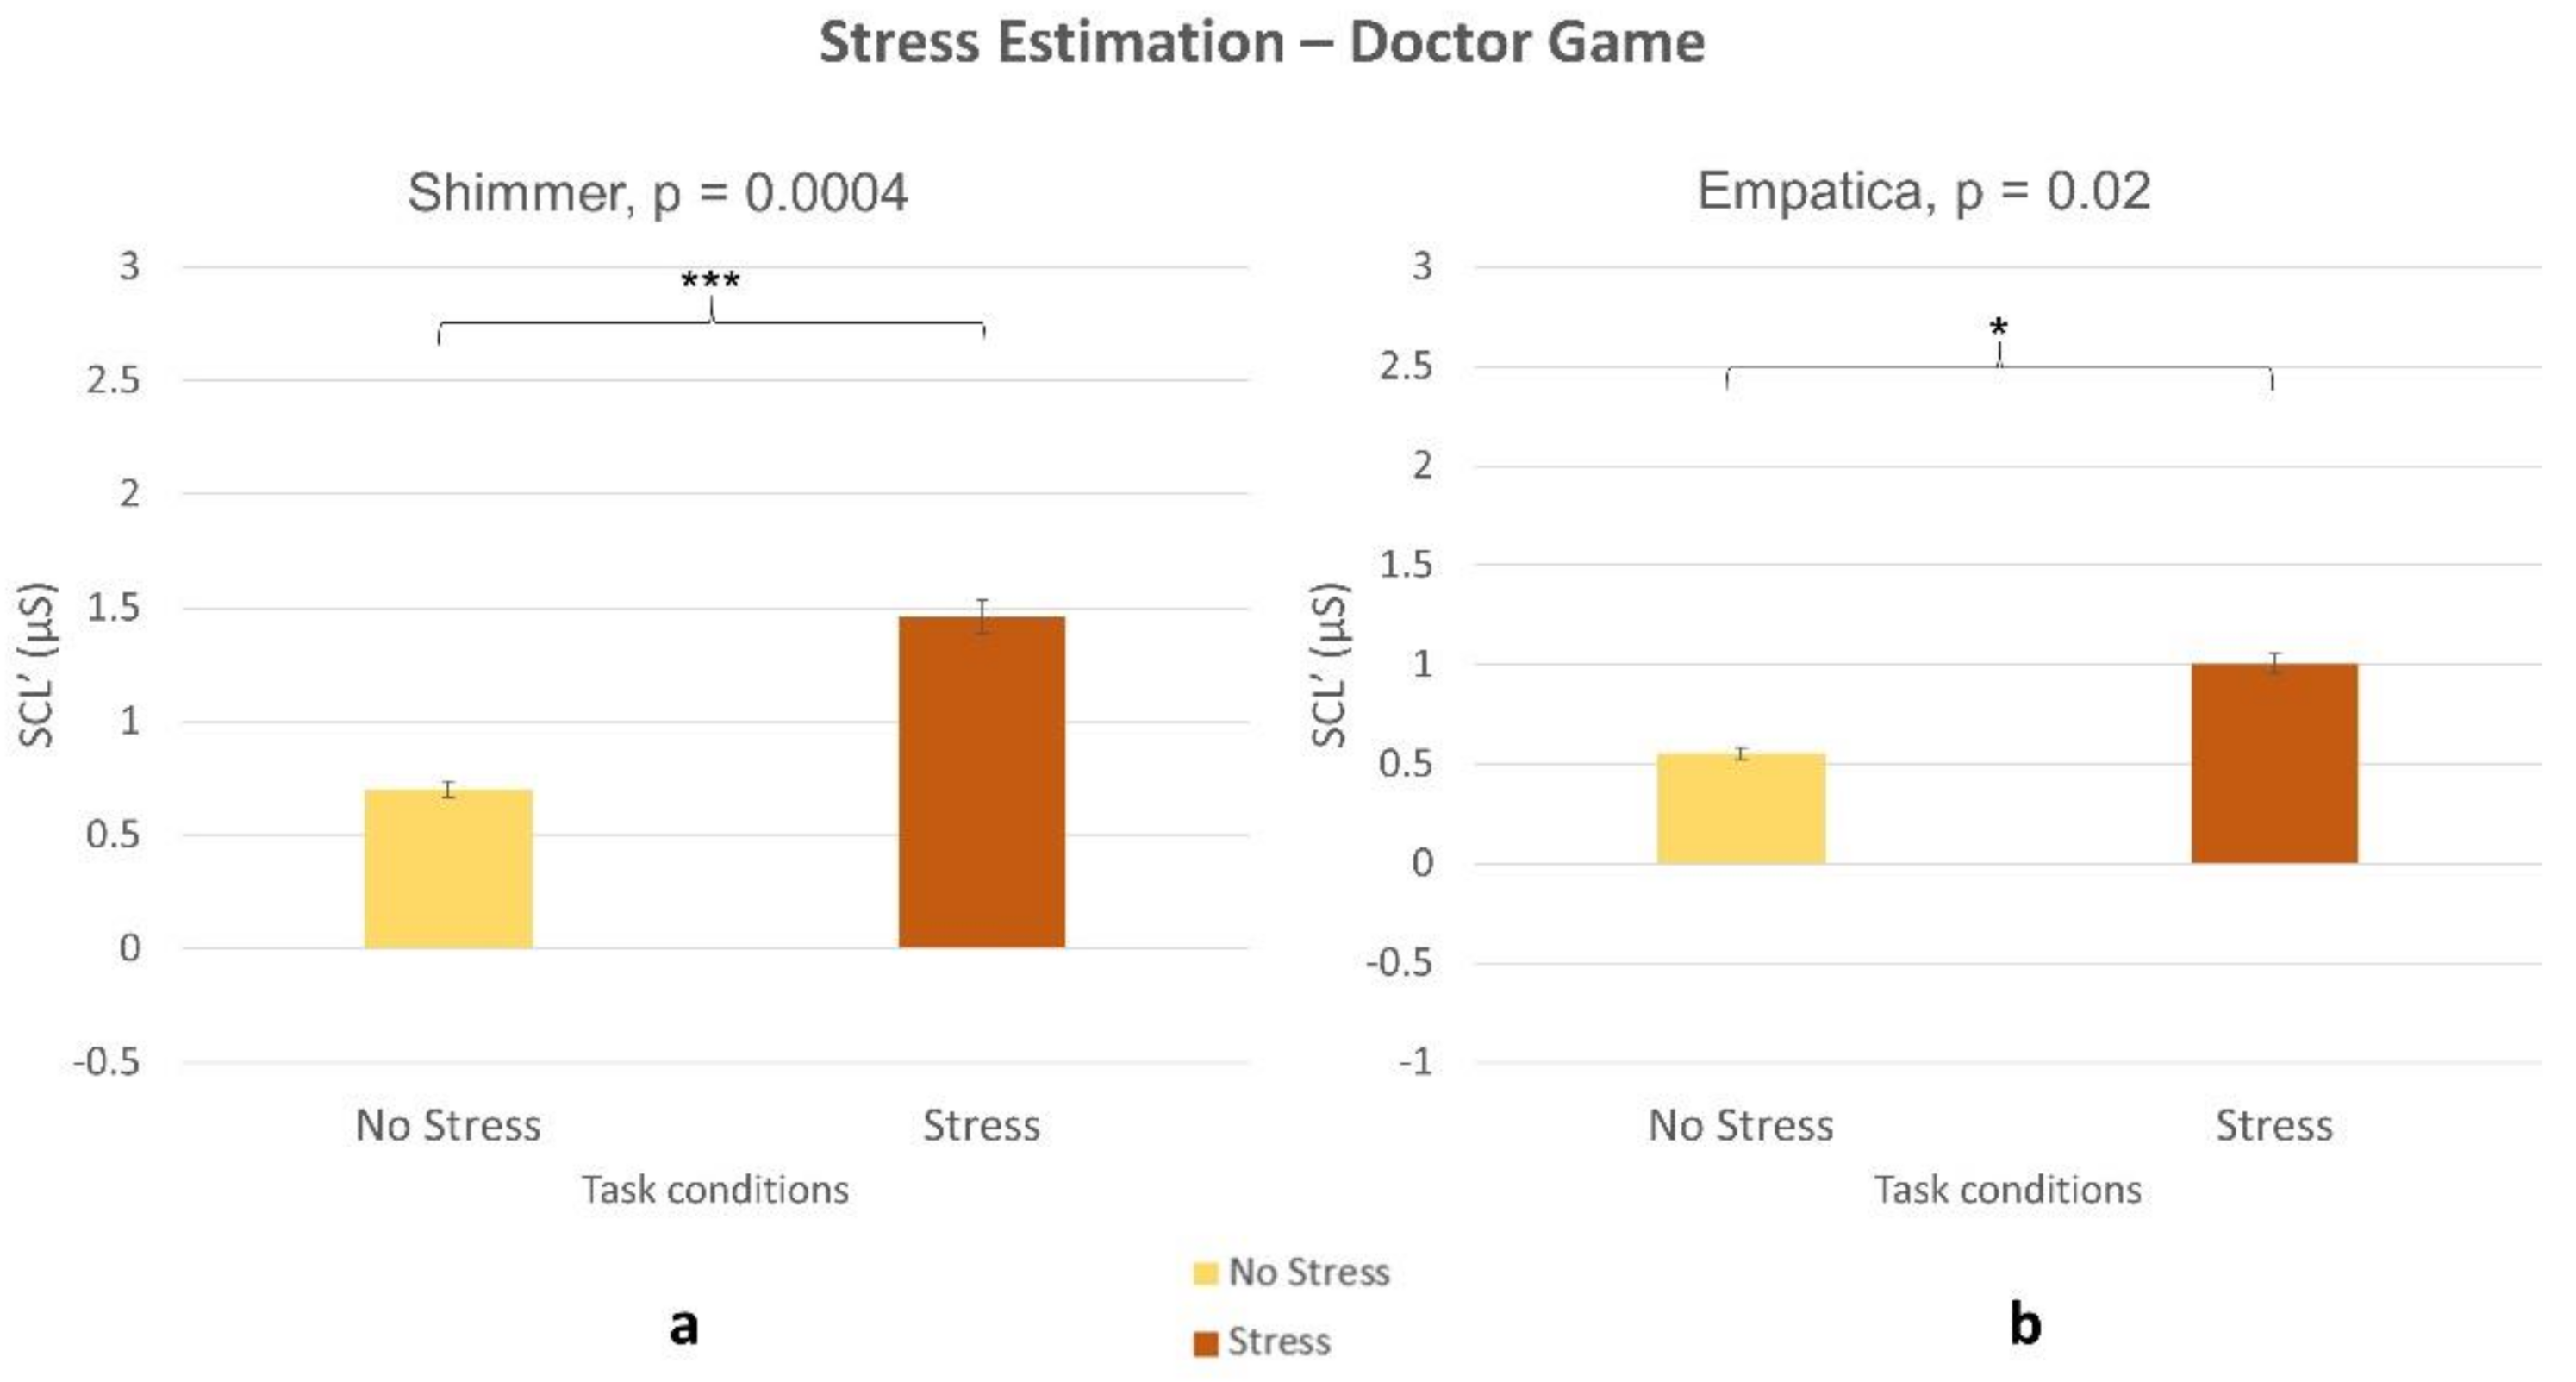
- High WL: Participants were asked to remove all 12 objects. They had three minutes to complete the task. When investigating stress assessment, we referred to this condition as ‘No Stress’ condition (i.e., in the comparison ‘No Stress vs. Stress’) as it differed from the Stress one only in the presence of the stressors whilst the difficulty level was the same.
- Stress: Participants were asked to remove all 12 objects. They had one minute to complete the task. Additionally, high intensity noise was played (85 db) and the white-coat effect was used to stress the participant [35]. Then, a four-minute relaxing music and video was played at the end of this phase. This was done to let participants recover from the stressful event before continuing with the experiment.
2.2.3. Webcall Task
2.3. Performance Assessment
2.4. Subjective Reports
- NASA Task-Load Index (NASA-TLX): It consists of six sub-scales representing independent groups of variables: mental, physical and temporal demands, frustration, effort and performance [39]. The participants were initially asked to rate on a scale from “low” to “high” (from 0 to 100) each of the six dimensions during the task. Afterwards, they had to choose the most important factor along pairwise comparisons. The NASA-TLX was selected for subjectively quantify the mental demand perceived by the participants with respect to the experimental condition of DG and NB tasks.
- GENEVA Emotion Wheel (GEW): It is a validated instrument to measure emotional reactions to several stimuli [40]. The participants were asked to indicate the emotion he/she experienced by choosing intensities for a single emotion or a blend of several emotions out of 20 distinct emotion families. Given the nature of the task, in this analysis we decided to use only the type of emotions selected by participants, without considering their intensities.
2.5. EOG Recording and Analysis for Mental Workload Assessment
2.6. EDA Recording and Analysis for Stress Assessment
2.7. ECG Signal Recording and Analysis for Emotional State Assessment
2.8. Statistical Analysis
3. Results
3.1. Performance
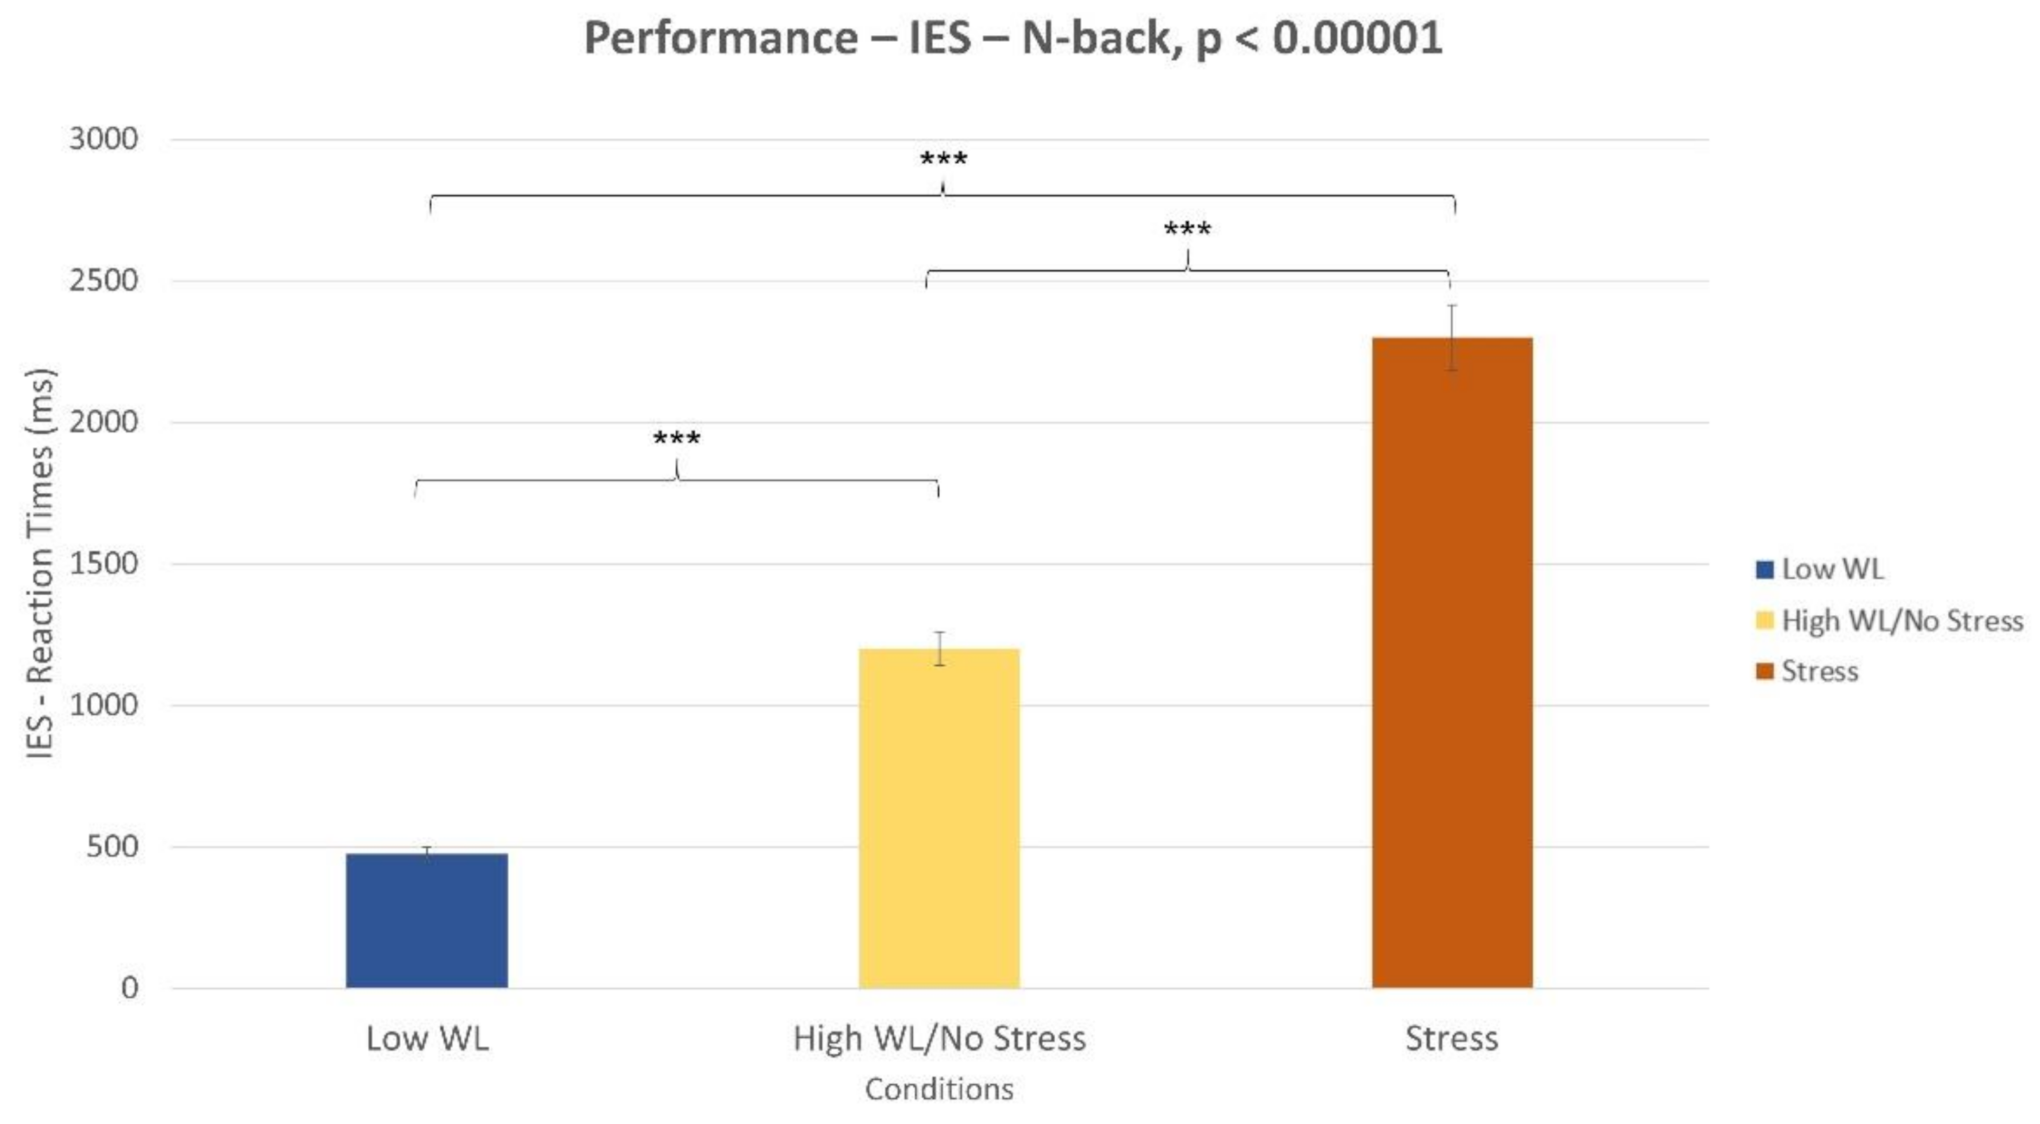
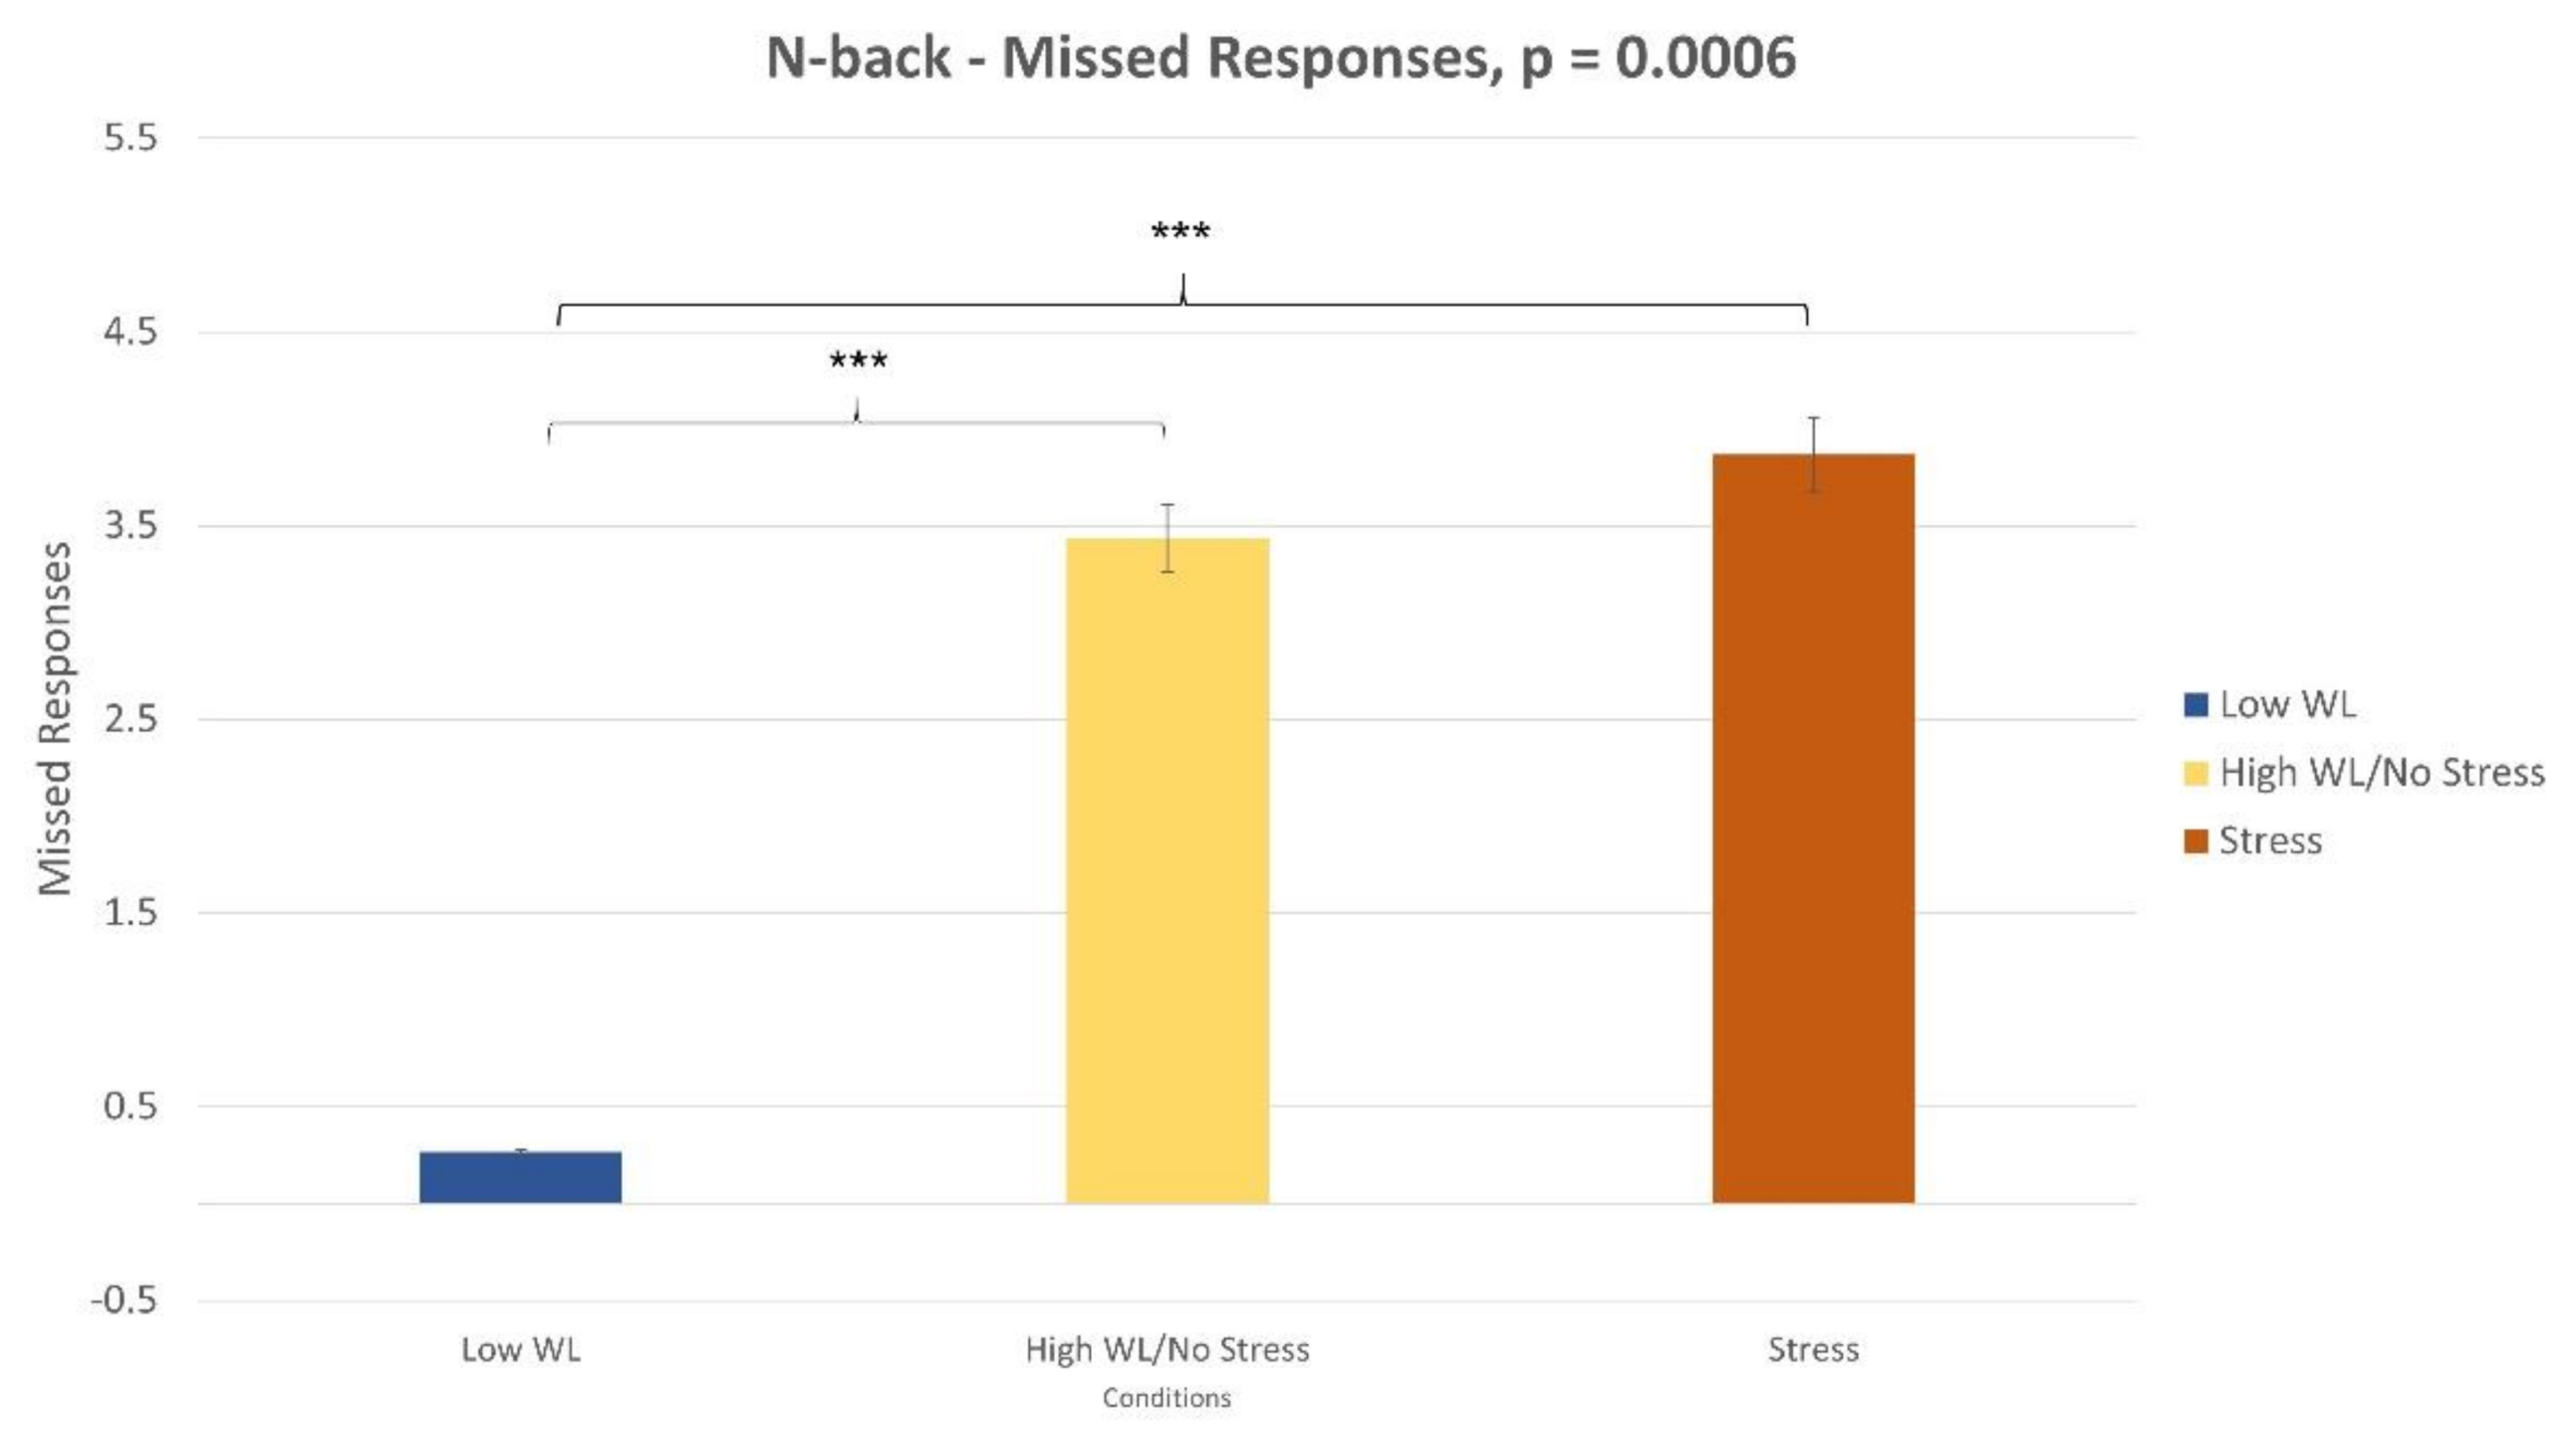
3.1.1. N-back task
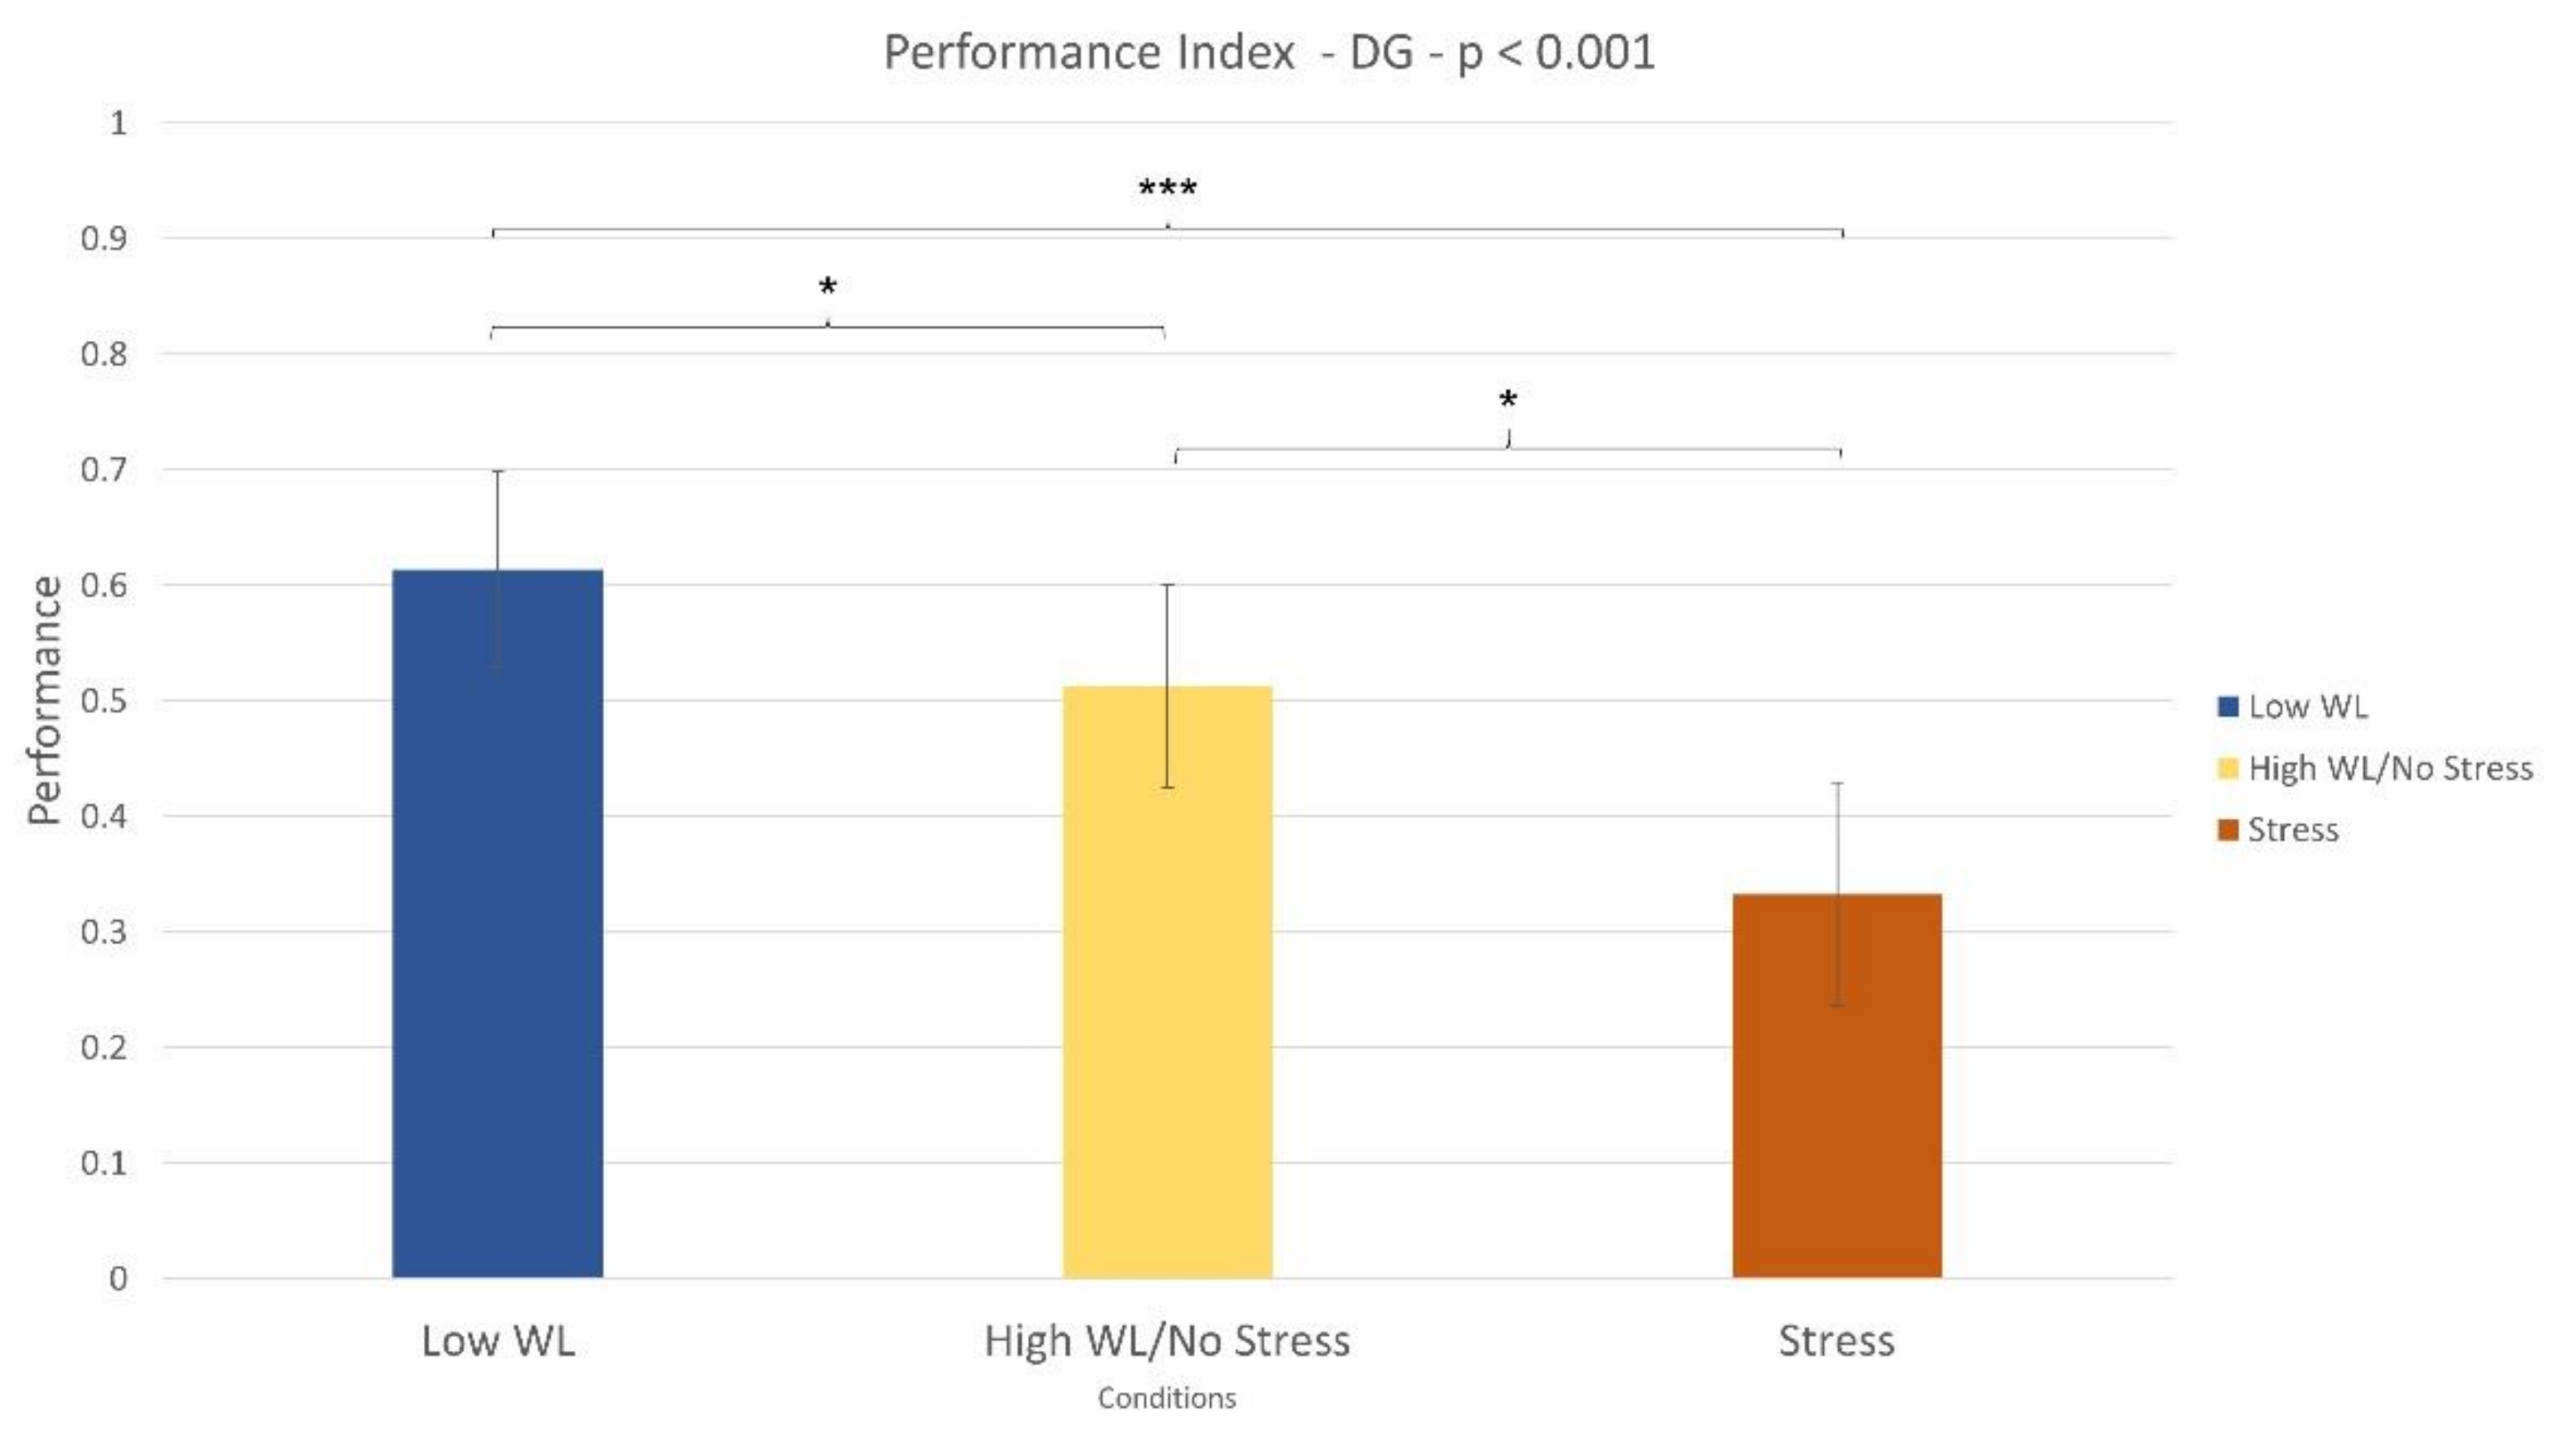
3.1.2. Doctor Game Task
3.2. Subjective Reports
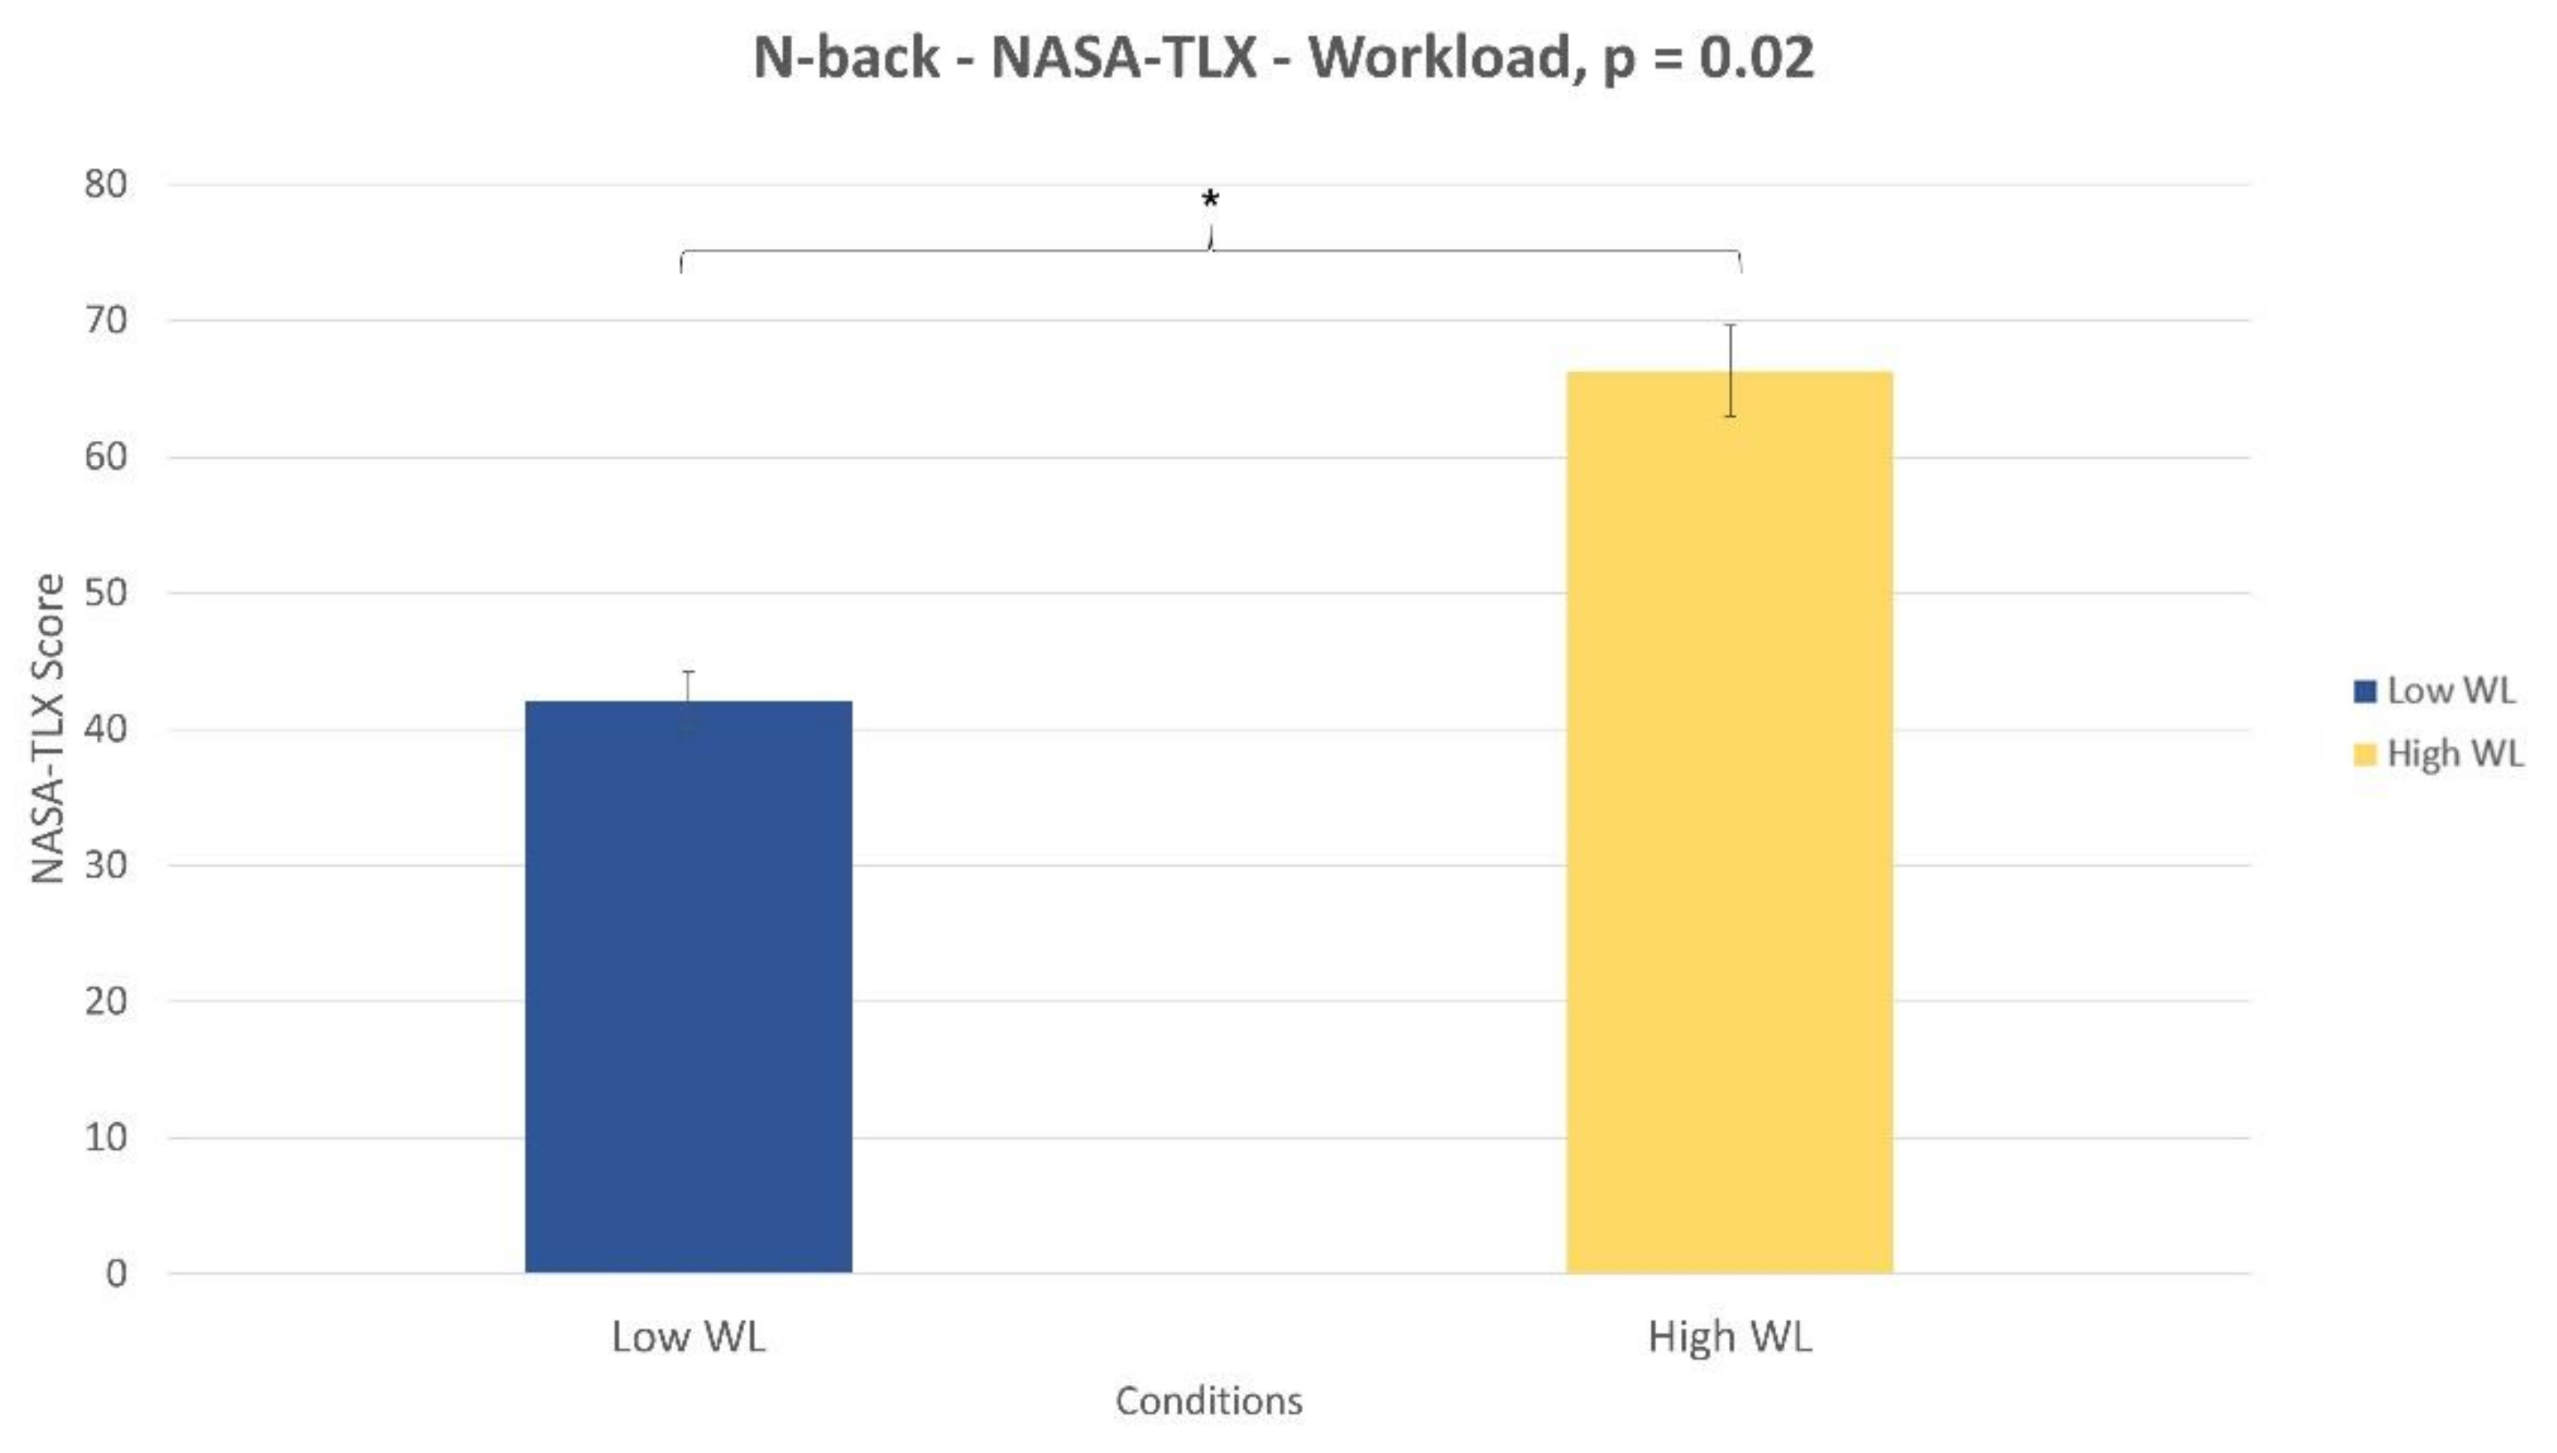
3.2.1. N-back task
3.2.2. Doctor Game Task
3.2.3. Webcall Task
3.3. Neurophysiological Results
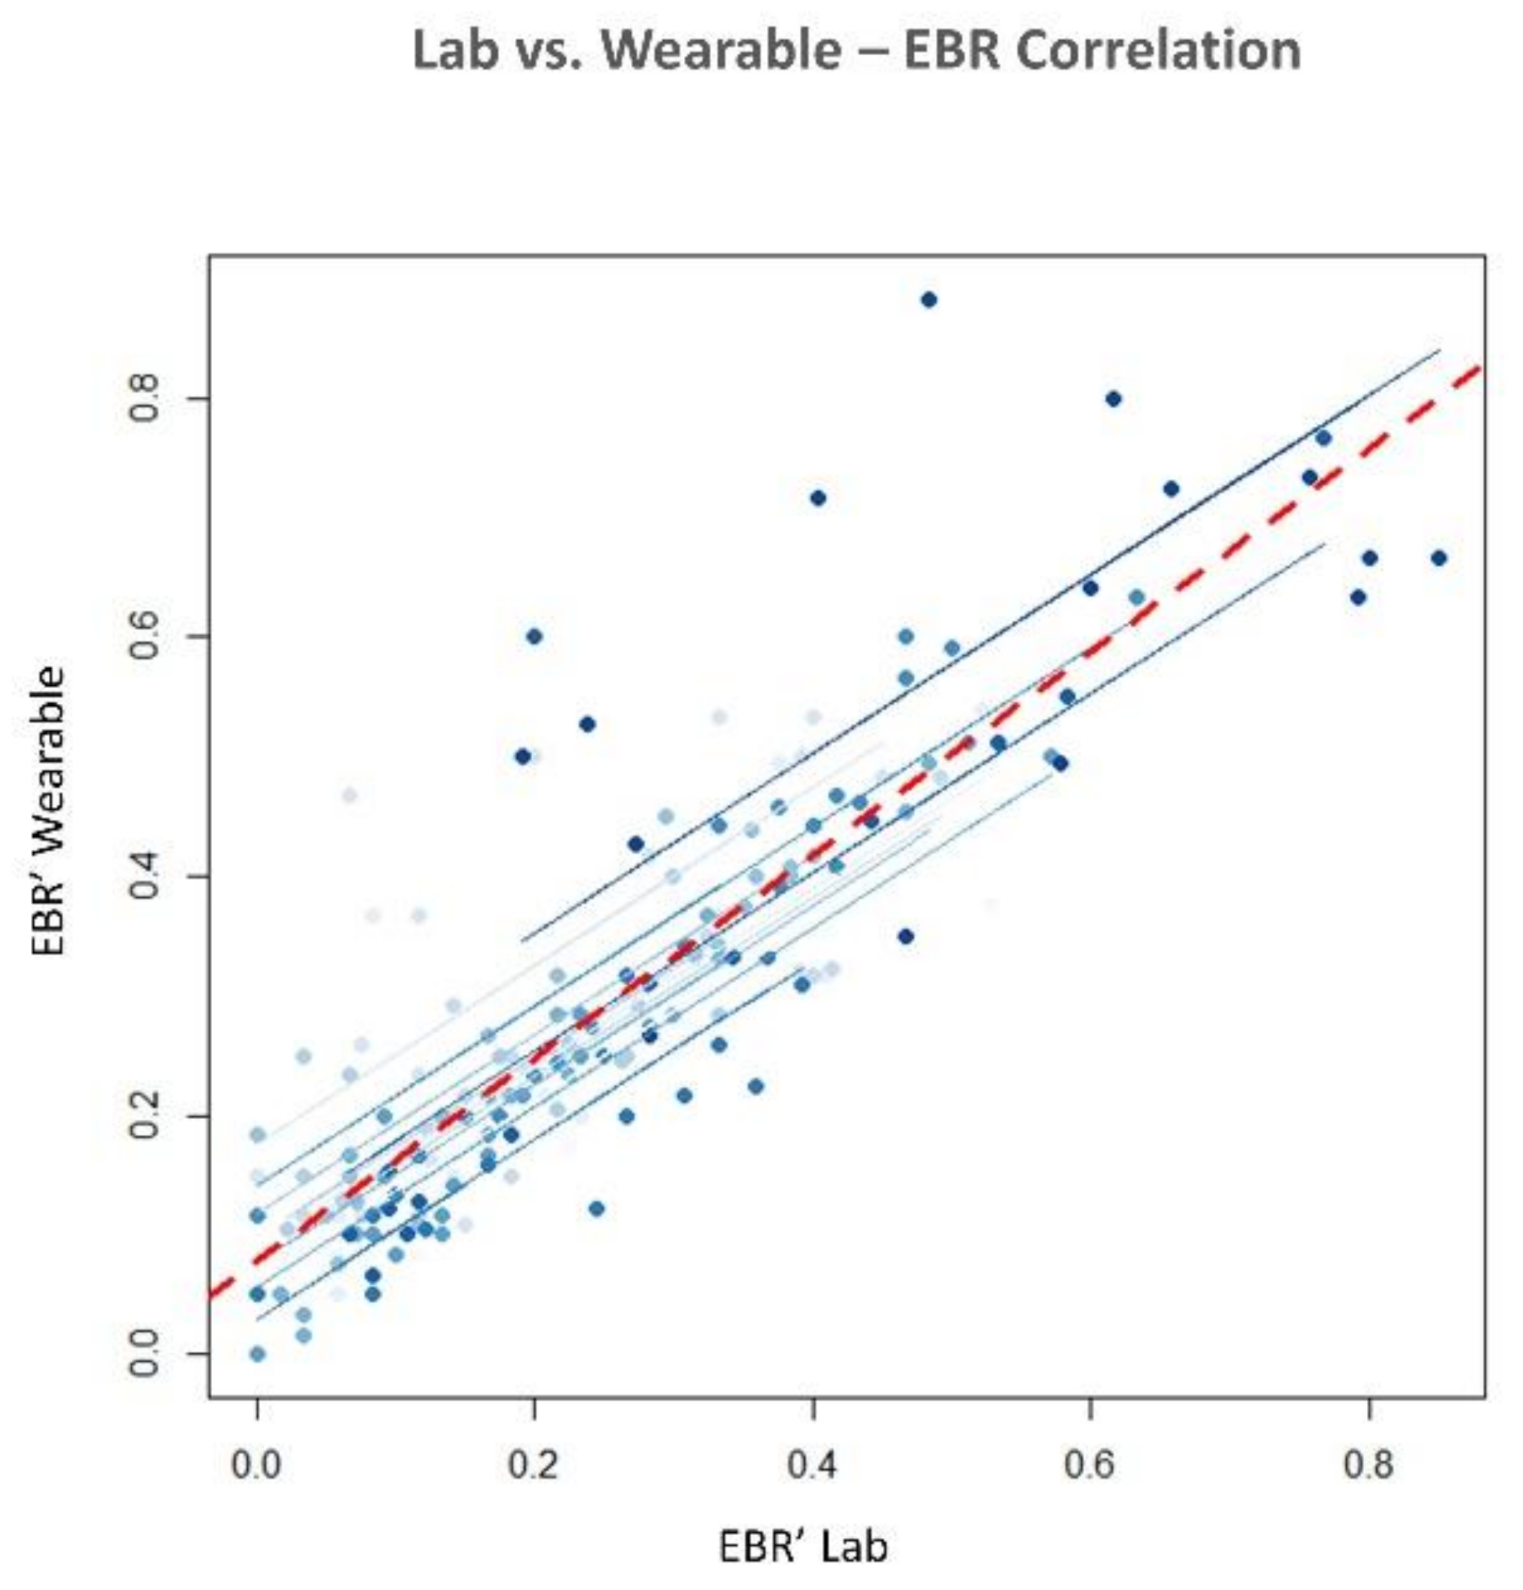
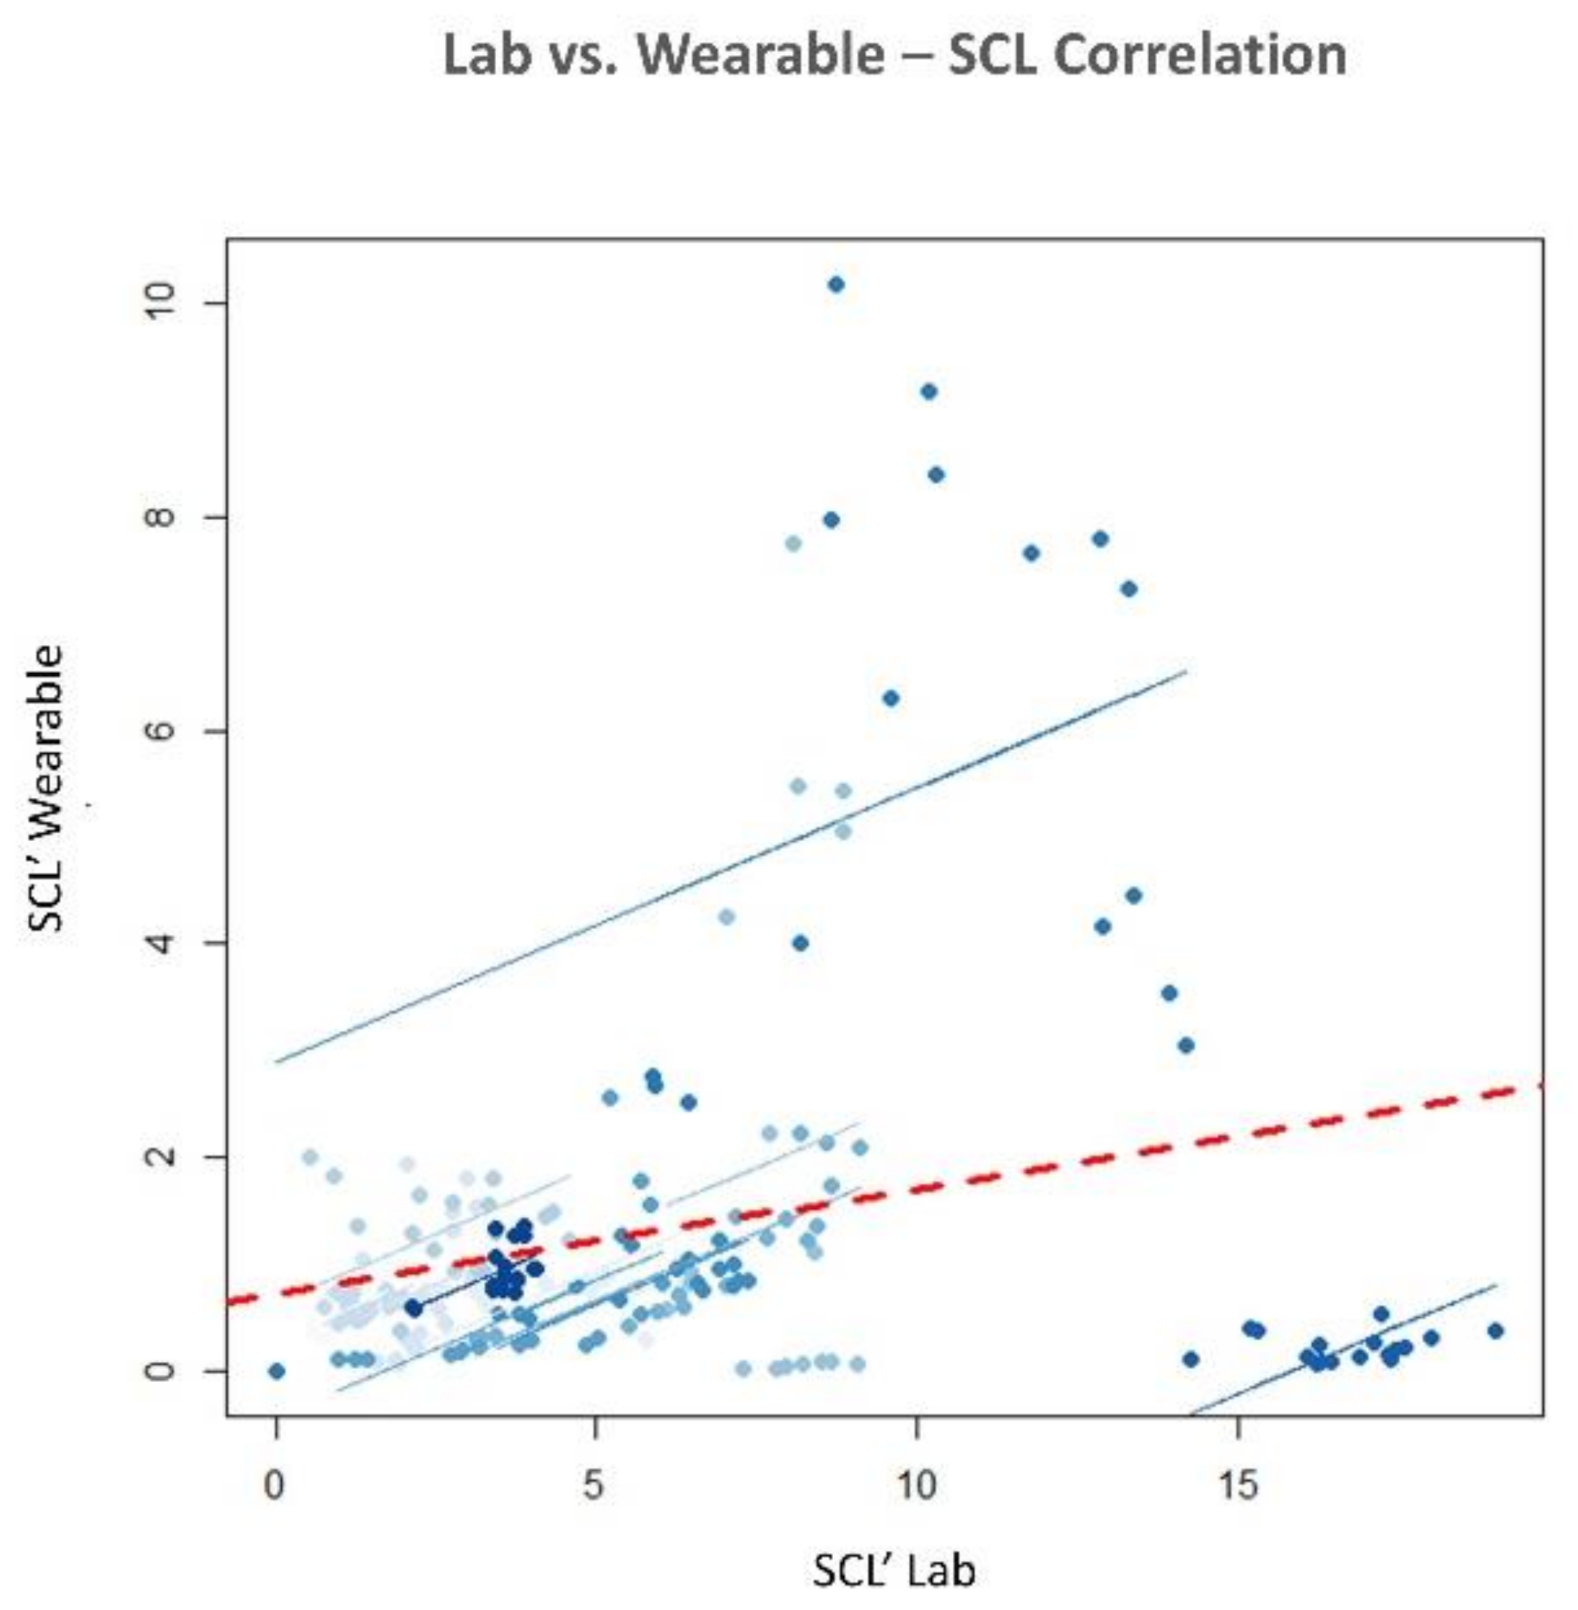
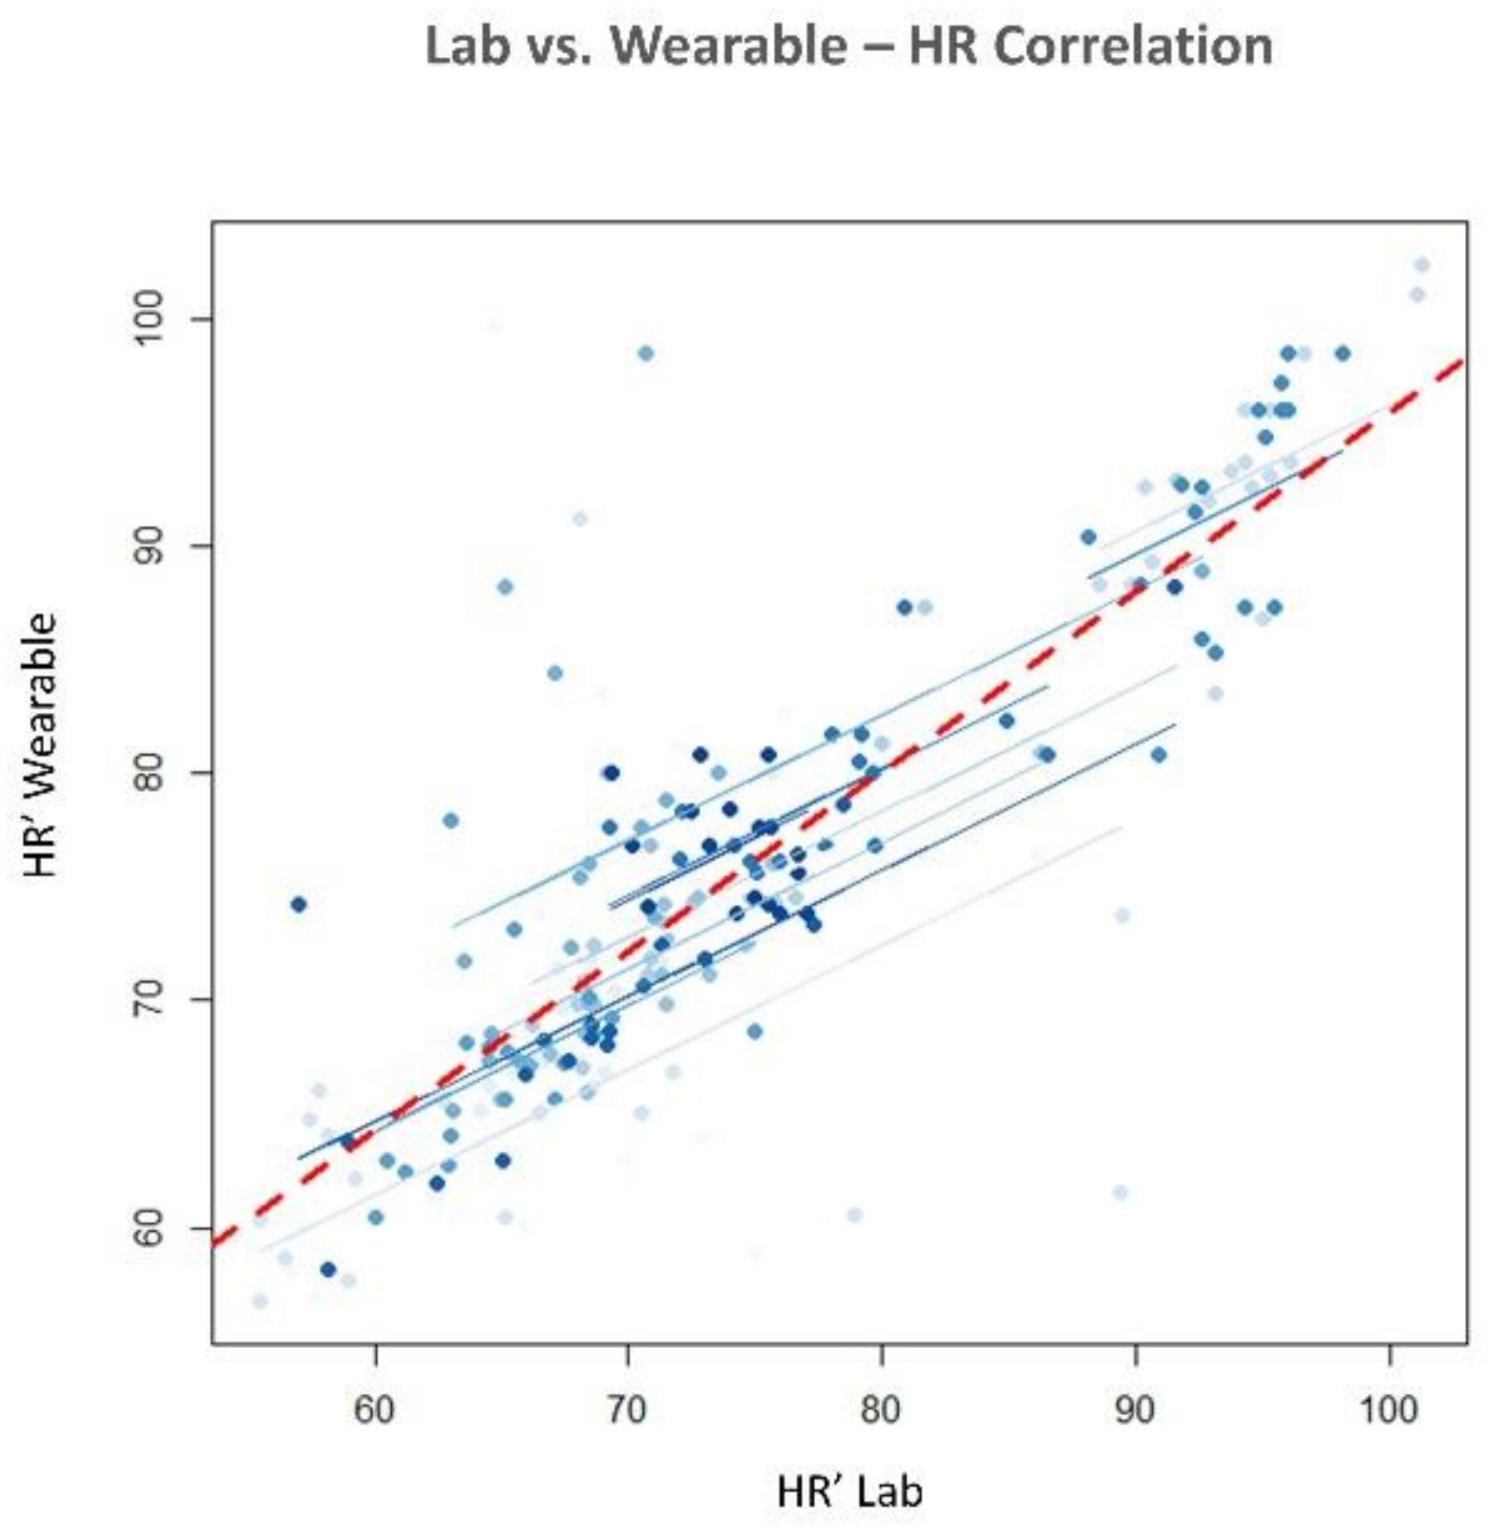
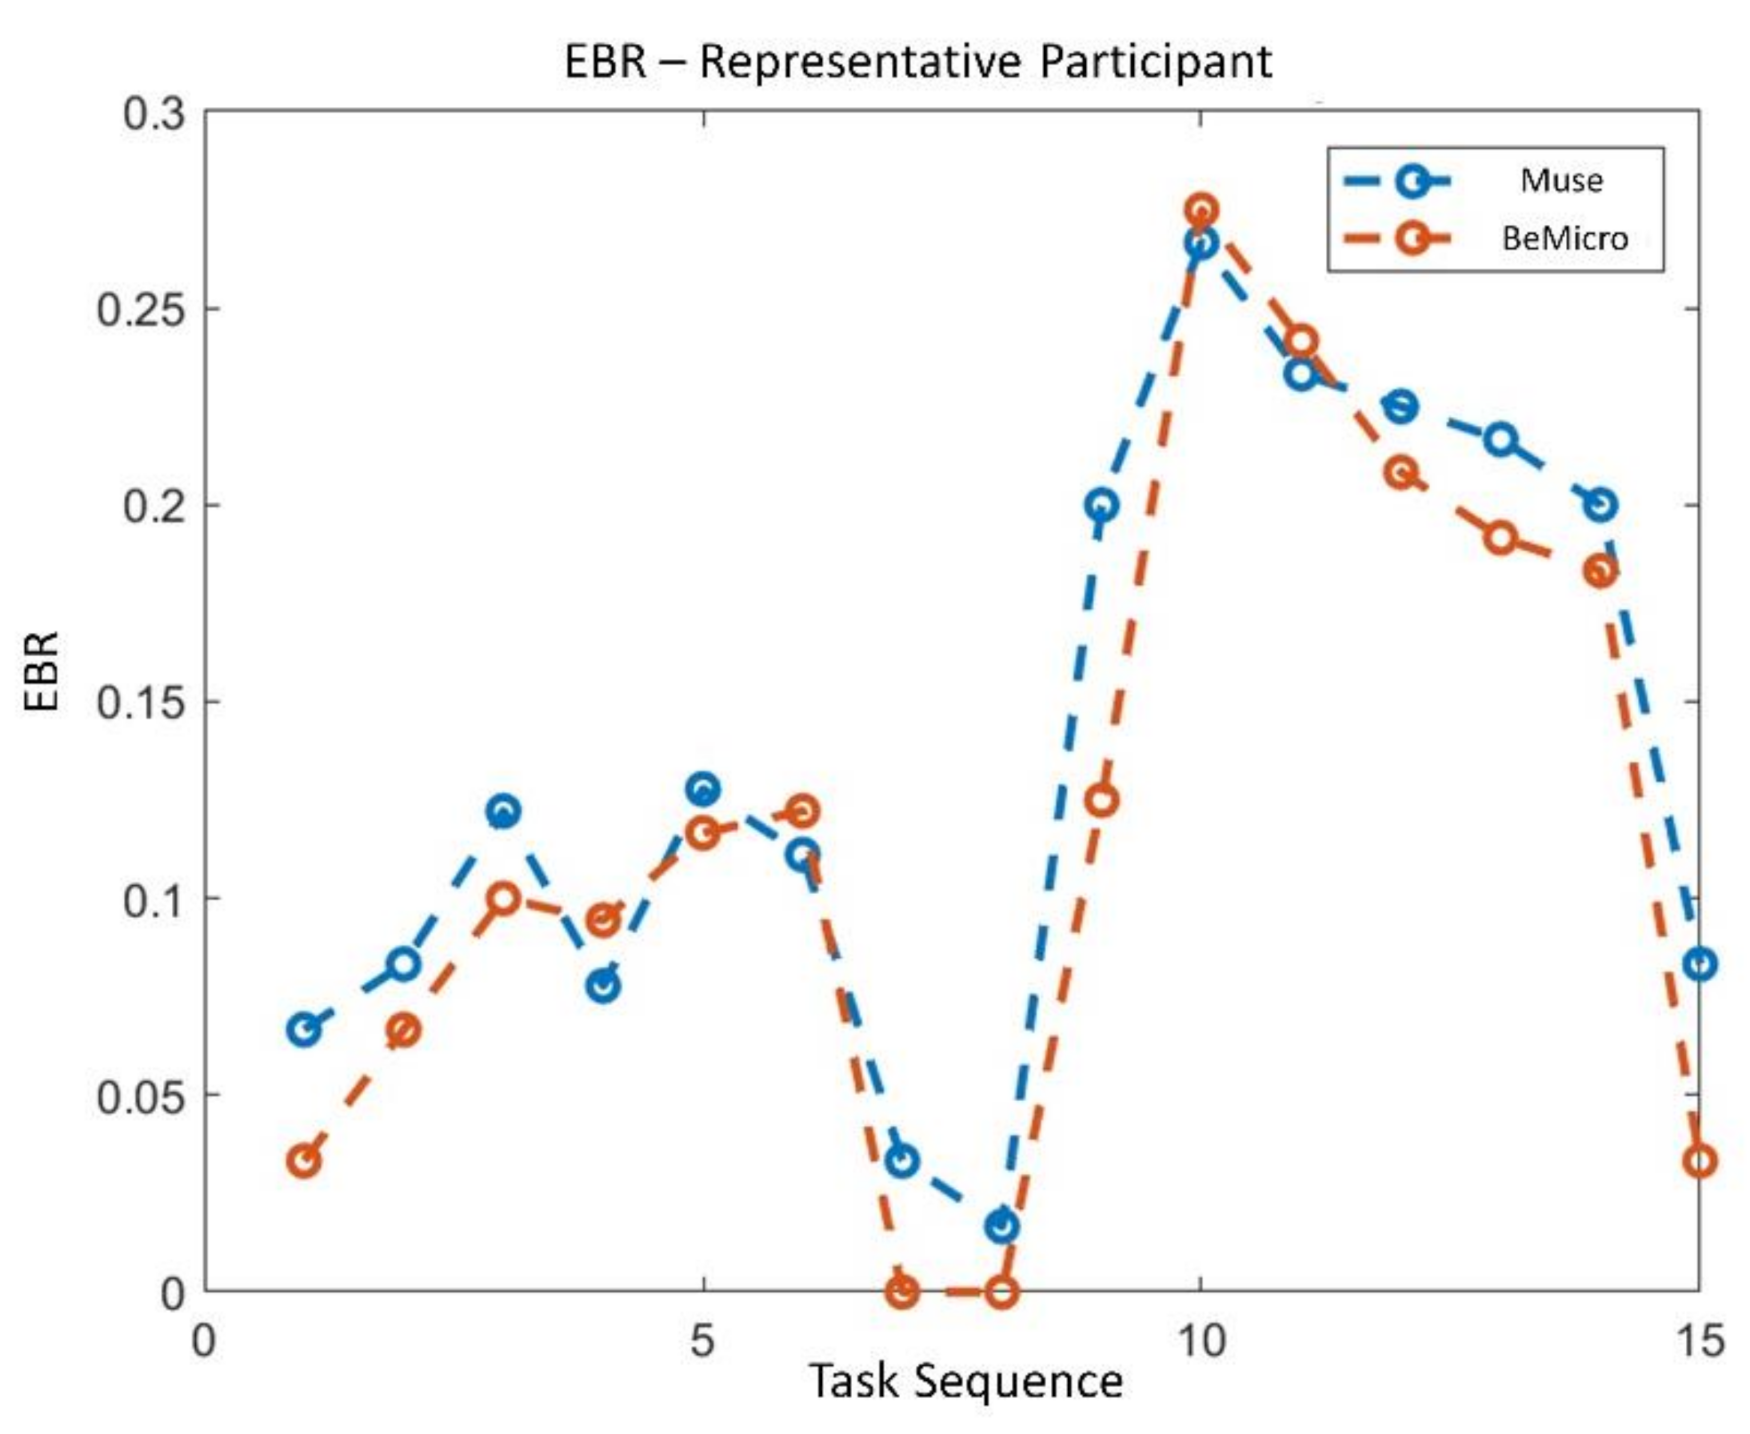
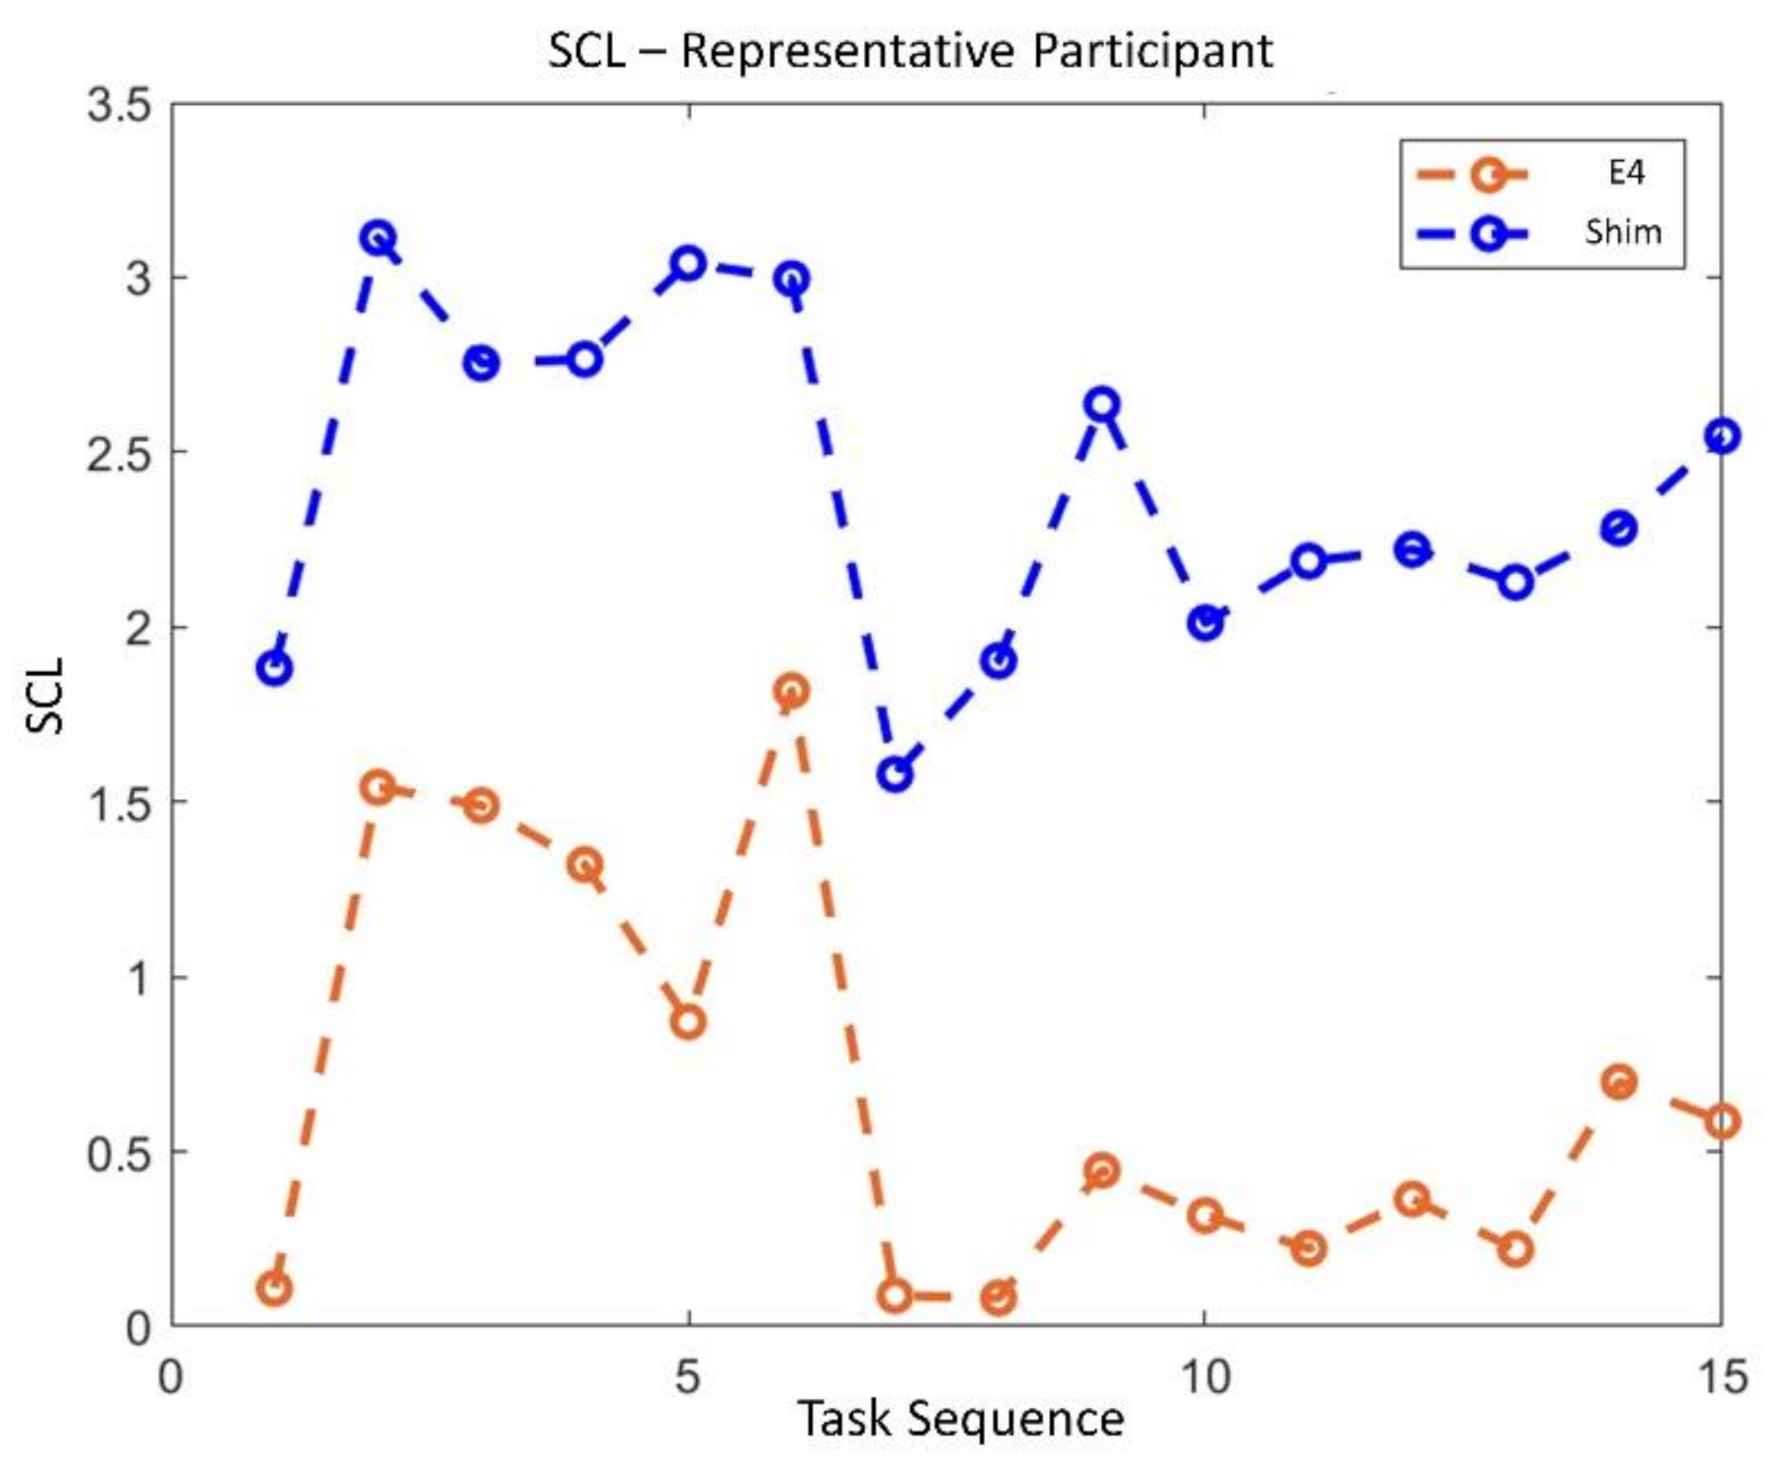
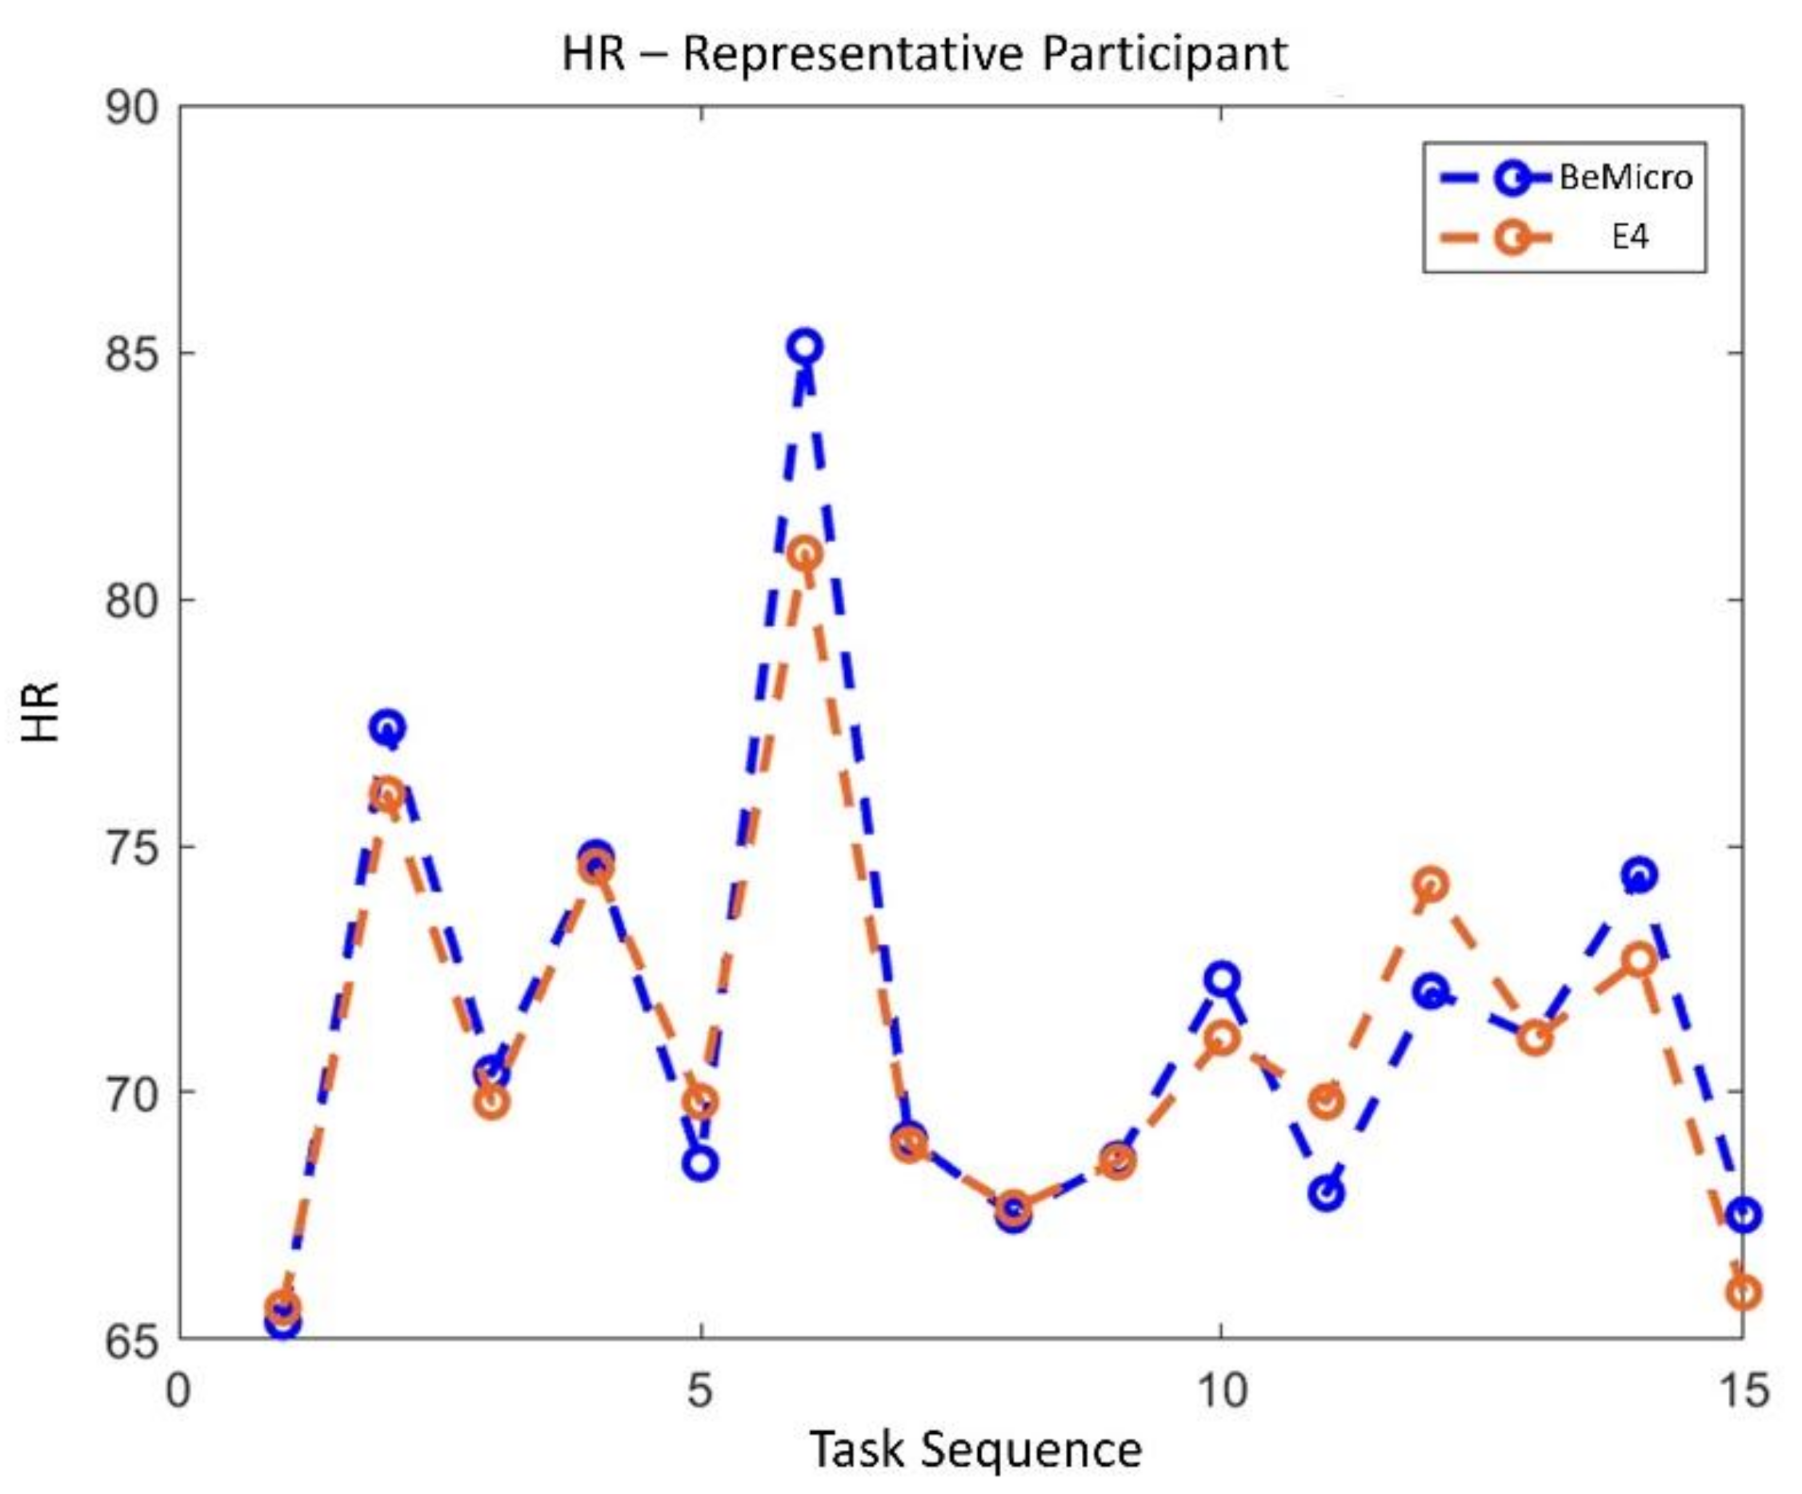
3.3.1. Methods comparisons
3.3.2. Mental workload
3.3.3. Stress
3.3.4. Emotional State
4. Discussion
4.1. Research Questions
4.2. Workload Assessment
4.3. Stress Assessment
4.4. Emotional State Assessment
4.5. Limits and Future Directions
5. Conclusions
Author Contributions
Funding
Institutional Review Board Statement
Informed Consent Statement
Data Availability Statement
Conflicts of Interest
References
- Haghi, M.; Thurow, K.; Stoll, R. Wearable devices in medical internet of things: Scientific research and commercially available devices. Healthc. Inform. Res. 2017, 23, 4–15. [Google Scholar] [CrossRef]
- Ranavolo, A.; Draicchio, F.; Varrecchia, T.; Silvetti, A.; Iavicoli, S. Wearable monitoring devices for biomechanical risk assessment at work: Current status and future challenges—A systematic review. Int. J. Environ. Res. Public Health 2018, 15, 2001. [Google Scholar] [CrossRef] [PubMed] [Green Version]
- White, M.S.; Burns, C.; Conlon, H.A. The impact of an aging population in the workplace. Work. Health Saf. 2018, 66, 493–498. [Google Scholar] [CrossRef] [PubMed] [Green Version]
- Borghini, G.; Astolfi, L.; Vecchiato, G.; Mattia, D.; Babiloni, F. Measuring neurophysiological signals in aircraft pilots and car drivers for the assessment of mental workload, fatigue and drowsiness. Neurosci. Biobehav. Rev. 2014, 44, 58–75. [Google Scholar] [CrossRef] [PubMed]
- Young, M.S.; Brookhuis, K.A.; Wickens, C.D.; Hancock, P.A. State of science: Mental workload in ergonomics. Ergonomics 2015, 58, 1–17. [Google Scholar] [CrossRef]
- Borghini, G.; Aricò, P.; Di Flumeri, G.; Cartocci, G.; Colosimo, A.; Bonelli, S.; Golfetti, A.; Imbert, J.P.; Granger, G.; Benhacene, R.; et al. EEG-based cognitive control behaviour assessment: An ecological study with professional air traffic controllers. Sci. Rep. 2017, 7, 1–16. [Google Scholar] [CrossRef]
- Borghini, G.; Di Flumeri, G.; Aricò, P.; Sciaraffa, N.; Bonelli, S.; Ragosta, M.; Tomasello, P.; Drogoul, F.; Turhan, U.; Acikel, B.; et al. A multimodal and signals fusion approach for assessing the impact of stressful events on Air Traffic Controllers. Sci. Rep. 2020, 10, 1–18. [Google Scholar] [CrossRef]
- Hansen, F. Human error: A concept analysis. J. Air Transp. 2006, 11, 61–77. Available online: https://ntrs.nasa.gov/search.jsp?R=20070022530 (accessed on 24 March 2021).
- Arico, P.; Borghini, G.; Di Flumeri, G.; Colosimo, A.; Graziani, I.; Imbert, J.-P.; Granger, G.; Benhacene, R.; Terenzi, M.; Pozzi, S.; et al. Reliability over time of EEG-based mental workload evaluation during Air Traffic Management (ATM) tasks. In Proceedings of the 37th Annual International Conference of the IEEE Engineering in Medicine and Biology Society (EMBC), Milano, Italy, 25–29 August 2015; pp. 7242–7245. [Google Scholar] [CrossRef]
- Aricò, P.; Reynal, M.; Di Flumeri, G.; Borghini, G.; Sciaraffa, N.; Imbert, J.-P.; Hurter, C.; Terenzi, M.; Ferreira, A.; Pozzi, S.; et al. How neurophysiological measures can be used to enhance the evaluation of remote tower solutions. Front. Hum. Neurosci. 2019, 13, 303. [Google Scholar] [CrossRef]
- Borghini, G.; Aricò, P.; Astolfi, L.; Toppi, J.; Cincotti, F.; Mattia, D.; Cherubino, P.; Vecchiato, G.; Maglione, A.G.; Graziani, I.; et al. Frontal EEG theta changes assess the training improvements of novices in flight simulation tasks. In Proceedings of the 35th Annual International Conference of the IEEE Engineering in Medicine and Biology Society (EMBC); Institute of Electrical and Electronics Engineers, Osaka, Japan, 3–7 July 2013; Volume 2013, pp. 6619–6622. [Google Scholar]
- Jahangiri, M.; Hoboubi, N.; Rostamabadi, A.; Keshavarzi, S.; Hosseini, A.A. Human error analysis in a permit to work system: A case study in a chemical plant. Saf. Health Work 2016, 7, 6–11. [Google Scholar] [CrossRef] [PubMed] [Green Version]
- Kondrateva, O.; Kravchenko, M.; Loktionov, O. Development of the methods for assessing the risk of damage to health of the employees of the electric power industry. Bezop. Promyshlennosti 2019, 2019, 63–68. [Google Scholar] [CrossRef]
- Bevilacqua, M.; Ciarapica, F.E. Human factor risk management in the process industry: A case study. Reliab. Eng. Syst. Saf. 2018, 169, 149–159. [Google Scholar] [CrossRef]
- Babiloni, F. Mental workload monitoring: New perspectives from neuroscience. In Communications in Computer and Information Science; Springer: Cham, Switzerland, 2019; Volume 1107, pp. 3–19. [Google Scholar]
- Arico, P.; Borghini, G.; Di Flumeri, G.; Bonelli, S.; Golfetti, A.; Graziani, I.; Pozzi, S.; Imbert, J.-P.; Granger, G.; Benhacene, R.; et al. Human factors and neurophysiological metrics in air traffic control: A critical review. IEEE Rev. Biomed. Eng. 2017, 10, 250–263. [Google Scholar] [CrossRef]
- Wall, T.D.; Michie, J.; Patterson, M.; Wood, S.J.; Sheehan, M.; Clegg, C.W.; West, M. On the validity of subjective measures of company performance. Pers. Psychol. 2004, 57, 95–118. [Google Scholar] [CrossRef]
- Sciaraffa, N.; Borghini, G.; Aricò, P.; Di Flumeri, G.; Colosimo, A.; Bezerianos, A.; Thakor, N.V.; Babiloni, F. Brain interaction during cooperation: Evaluating local properties of multiple-brain network. Brain Sci. 2017, 7, 90. [Google Scholar] [CrossRef]
- Fairclough, S.H. Fundamentals of physiological computing. Interact. Comput. 2009, 21, 133–145. [Google Scholar] [CrossRef]
- Cartocci, G.; Maglione, A.G.; Vecchiato, G.; Di Flumeri, G.; Colosimo, A.; Scorpecci, A.; Marsella, P.; Giannantonio, S.; Malerba, P.; Borghini, G.; et al. Mental workload estimations in unilateral deafened children. In Proceedings of the 37th Annual International Conference of the IEEE Engineering in Medicine and Biology Society (EMBC), Milano, Italy, 29–29 August 2015; Volume 2015, pp. 1654–1657. [Google Scholar] [CrossRef]
- Patel, S.; Park, H.; Bonato, P.; Chan, L.; Rodgers, M. A review of wearable sensors and systems with application in rehabilitation. J. Neuroeng. Rehabil. 2012, 9, 21. [Google Scholar] [CrossRef] [Green Version]
- Di Flumeri, G.; Aricò, P.; Borghini, G.; Sciaraffa, N.; Di Florio, A.; Babiloni, F. The dry revolution: Evaluation of three different EEG dry electrode types in terms of signal spectral features, mental states classification and usability. Sensors 2019, 19, 1365. [Google Scholar] [CrossRef] [PubMed] [Green Version]
- Gradl, S.; Wirth, M.; Richer, R.; Rohleder, N.; Eskofier, B.M. An overview of the feasibility of permanent, real-time, unobtrusive stress measurement with current wearables. In Proceedings of the 13th EAI International Conference on Pervasive Computing Technologies for Healthcare, Trento, Italy, 20–23 May 2019; Volume 19, pp. 360–365. [Google Scholar]
- E Dooley, E.; Golaszewski, N.M.; Bartholomew, J.B. Estimating accuracy at exercise intensities: A comparative study of self-monitoring heart rate and physical activity wearable devices. JMIR mHealth uHealth 2017, 5, e34. [Google Scholar] [CrossRef]
- Lo, J.C.; Sehic, E.; Meijer, S.A. Measuring mental workload with low-cost and wearable sensors: Insights into the accuracy, obtrusiveness, and research usability of three instruments. J. Cogn. Eng. Decis. Mak. 2017, 11, 323–336. [Google Scholar] [CrossRef] [Green Version]
- Menghini, L.; Gianfranchi, E.; Cellini, N.; Patron, E.; Tagliabue, M.; Sarlo, M. Stressing the accuracy: Wrist-worn wearable sensor validation over different conditions. Psychophysiology 2019, 56, e13441. [Google Scholar] [CrossRef]
- Shcherbina, A.; Mattsson, C.M.; Waggott, D.; Salisbury, H.; Christle, J.W.; Hastie, T.; Wheeler, M.T.; Ashley, E.A. Accuracy in wrist-worn, sensor-based measurements of heart rate and energy expenditure in a diverse cohort. J. Pers. Med. 2017, 7, 3. [Google Scholar] [CrossRef]
- McCarthy, C.; Pradhan, N.; Redpath, C.; Adler, A. Validation of the empatica E4 wristband. In Proceedings of the IEEE EMBS International Student Conference (ISC), Ottawa, ON, Canada, 29–31 May 2016; pp. 1–4. [Google Scholar]
- Ragot, M.; Martin, N.; Em, S.; Pallamin, N.; Diverrez, J.-M. Emotion recognition using physiological signals: Laboratory vs. wearable sensors. Adv. Intell. Syst. Comput. 2018, 608, 15–22. [Google Scholar]
- Setz, C.; Arnrich, B.; Schumm, J.; La Marca, R.; Tröster, G.; Ehlert, U. Discriminating stress from cognitive load using a wearable EDA device. IEEE Trans. Inf. Technol. Biomed. 2010, 14, 410–417. [Google Scholar] [CrossRef] [PubMed]
- Krigolson, O.E.; Williams, C.C.; Norton, A.; Hassall, C.D.; Colino, F.L. Choosing MUSE: Validation of a low-cost, portable EEG system for ERP research. Front. Neurosci. 2017, 11, 109. [Google Scholar] [CrossRef] [PubMed] [Green Version]
- Abujelala, M.; Abellanoza, C.; Sharma, A.; Makedon, F. Brain-EE: Brain enjoyment evaluation using commercial EEG headband. In Proceedings of the PETRA 2016, Corfu, Greece, 29 June–1 July 2016. [Google Scholar] [CrossRef]
- Kirchner, W.K. Age differences in short-term retention of rapidly changing information. J. Exp. Psychol. 1958, 55, 352–358. [Google Scholar] [CrossRef] [PubMed]
- Berka, C.; Levendowski, D.J.; Lumicao, M.N.; Yau, A.; Davis, G.; Zivkovic, T.; Olmstead, R.E.; Tremoulet, P.; Craven, P.L. EEG correlates of task engagement and mental workload in vigilance, learning, and memory tasks. Aviat. Space Environ. Med. 2007, 78, B231–B244. Available online: https://www.researchgate.net/publication/6289900_EEG_correlates_of_task_engagement_and_mental_workload_in_vigilance_learning_and_memory_tasks (accessed on 24 January 2021). [PubMed]
- Skoluda, N.; Strahler, J.; Schlotz, W.; Niederberger, L.; Marques, S.; Fischer, S.; Thoma, M.V.; Spoerri, C.; Ehlert, U.; Nater, U.M. Intra-individual psychological and physiological responses to acute laboratory stressors of different intensity. Psychoneuroendocrinology 2015, 51, 227–236. [Google Scholar] [CrossRef] [PubMed]
- De La Torre-Luque, A.; Caparros-Gonzalez, R.A.; Bastard, T.; Vico, F.J.; Buela-Casal, G. Acute stress recovery through listening to Melomics relaxing music: A randomized controlled trial. Nord. J. Music Ther. 2016, 26, 124–141. [Google Scholar] [CrossRef]
- Ceccarelli, L.A.; Giuliano, R.J.; Glazebrook, C.M.; Strachan, S.M. Self-compassion and psycho-physiological recovery from recalled sport failure. Front. Psychol. 2019, 10, 1564. [Google Scholar] [CrossRef] [PubMed]
- Konečni, V.J.; Brown, A.; Wanic, R.A. Comparative effects of music and recalled life-events on emotional state. Psychol. Music 2008, 36, 289–308. [Google Scholar] [CrossRef]
- Hart, S.; Staveland, L. Development of NASA-TLX (Task Load Index) results of empirical and theoretical research. Adv. Psychol. 1988, 52, 139–183. [Google Scholar]
- Coyne, A.K.; Murtagh, A.; McGinn, C. Using the Geneva Emotion Wheel to measure perceived affect in human-robot interaction. In Proceedings of the 2020 ACM/IEEE International Conference on Human-Robot Interaction, Cambridge, UK, 23–26 March 2020; pp. 491–498. [Google Scholar]
- Zheng, B.; Jiang, X.; Tien, G.; Meneghetti, A.; Panton, O.N.M.; Atkins, M.S. Workload assessment of surgeons: Correlation between NASA TLX and blinks. Surg. Endosc. 2012, 26, 2746–2750. [Google Scholar] [CrossRef] [PubMed]
- Grier, R.A. How High is High? A Meta-Analysis of NASA-TLX Global Workload Scores. Proc. Hum. Factors Ergon. Soc. Annu. Meet. 2015, 59, 1727–1731. [Google Scholar] [CrossRef]
- Shuman, V.; Schlegel, K.; Scherer, K. Geneva Emotion Wheel Rating Study PROPEREMO View Project a Developmental Perspective of Emotion Regulation View Project. 2015. Available online: https://www.researchgate.net/publication/280880848 (accessed on 26 January 2021).
- Faure, V.; Lobjois, R.; Benguigui, N. The effects of driving environment complexity and dual tasking on drivers’ mental workload and eye blink behavior. Transp. Res. Part F Traffic Psychol. Behav. 2016, 40, 78–90. [Google Scholar] [CrossRef]
- Di Flumeri, G.; Arico, P.; Borghini, G.; Colosimo, A.; Babiloni, F. A new regression-based method for the eye blinks artifacts correction in the EEG signal, without using any EOG channel. In Proceedings of the 38th Annual International Conference of the IEEE Engineering in Medicine and Biology Society (EMBC), Orlando, FL, USA, 16–20 August 2016; Volume 2016, pp. 3187–3190. [Google Scholar]
- Abbas, S.N.; Abo-Zahhad, M. Eye Blinking EOG Signals as Biometrics; Springer: Cham, Switzerland, 2017; pp. 121–140. [Google Scholar]
- Kleifges, K.; Bigdely-Shamlo, N.; Kerick, S.E.; Robbins, K.A. BLINKER: Automated extraction of ocular indices from eeg enabling large-scale analysis. Front. Neurosci. 2017, 11, 12. [Google Scholar] [CrossRef] [Green Version]
- Borghini, G.; Ronca, V.; Vozzi, A.; Aricò, P.; Di Flumeri, G.; Babiloni, F. Monitoring performance of professional and oc-cupational operators. Handb. Clin. Neurol. 2020, 168, 199–205. [Google Scholar]
- Bach, D.R. A head-to-head comparison of SCRalyze and Ledalab, two model-based methods for skin conductance analysis. Biol. Psychol. 2014, 103, 63–68. [Google Scholar] [CrossRef] [PubMed] [Green Version]
- Benedek, M.; Kaernbach, C. A continuous measure of phasic electrodermal activity. J. Neurosci. Methods 2010, 190, 80–91. [Google Scholar] [CrossRef] [PubMed] [Green Version]
- Braithwaite, J.J.; Derrick, D.; Watson, G.; Jones, R.; Rowe, M. A Guide for Analysing Electrodermal Activity (EDA) and Skin Conductance Responses (SCRs) for Psychological Experiments. 2015. Available online: https://www.birmingham.ac.uk/Documents/college-les/psych/saal/guide-electrodermal-activity.pdf (accessed on 24 March 2021).
- Borghini, G.; Bandini, A.; Orlandi, S.; Di Flumeri, G.; Arico, P.; Sciaraffa, N.; Ronca, V.; Bonelli, S.; Ragosta, M.; Tomasello, P.; et al. Stress assessment by combining neurophysiological signals and radio communications of air traffic controllers. In Proceedings of the 42nd Annual International Conference of the IEEE Engineering in Medicine & Biology Society (EMBC); Institute of Electrical and Electronics Engineers (IEEE), online event (ex-Montreal). 20–24 July 2020; Volume 2020, pp. 851–854. [Google Scholar]
- Goovaerts, H.G.; Ros, H.H.; Akker, T.J.V.D.; Schneider, H. A digital QRS detector based on the principle of contour limiting. IEEE Trans. Biomed. Eng. 1976, 23, 154–160. [Google Scholar] [CrossRef]
- Pan, J.; Tompkins, W.J. A real-time QRS detection algorithm. IEEE Trans. Biomed. Eng. 1985, 32, 230–236. [Google Scholar] [CrossRef] [PubMed]
- Russell, J.A.; Barrett, L.F. Core affect, prototypical emotional episodes, and other things called emotion: Dissecting the elephant. J. Pers. Soc. Psychol. 1999, 76, 805–819. [Google Scholar] [CrossRef]
- Vecchiato, G.; Cherubino, P.; Maglione, A.G.; Ezquierro, M.T.H.; Marinozzi, F.; Bini, F.; Trettel, A.; Babiloni, F. How to measure cerebral correlates of emotions in marketing relevant tasks. Cogn. Comput. 2014, 6, 856–871. [Google Scholar] [CrossRef]
- Bakdash, J.Z.; Marusich, L.R. Repeated measures correlation. Front. Psychol. 2017, 8, 456. [Google Scholar] [CrossRef] [PubMed] [Green Version]
- Marakhimov, A.; Joo, J. Consumer adaptation and infusion of wearable devices for healthcare. Comput. Hum. Behav. 2017, 76, 135–148. [Google Scholar] [CrossRef]
- Guk, K.; Han, G.; Lim, J.; Jeong, K.; Kang, T.; Lim, E.-K.; Jung, J. Evolution of wearable devices with real-time disease monitoring for personalized healthcare. Nanomaterials 2019, 9, 813. [Google Scholar] [CrossRef] [Green Version]
- Tran, V.-T.; Riveros, C.; Ravaud, P. Patients’ views of wearable devices and AI in healthcare: Findings from the ComPaRe e-cohort. NPJ Digit. Med. 2019, 2, 1–8. [Google Scholar] [CrossRef] [PubMed] [Green Version]
- Stavropoulos, T.G.; Lazarou, I.; Strantsalis, D.; Nikolopoulos, S.; Kompatsiaris, I.; Koumanakos, G.; Frouda, M.; Tsolaki, M. Human factors and requirements of people with mild cognitive impairment, their caregivers and healthcare professionals for ehealth systems with wearable trackers. In Proceedings of the IEEE International Conference on Human-Machine Systems (ICHMS), Rome, Italy, 6–8 April 2020; pp. 1–6. [Google Scholar]


| Signal | Laboratory Device | Consumer Wearable Device | Extracted Feature | Filter Frequency Range | Time Window |
|---|---|---|---|---|---|
| EOG | BeMicro | Muse 2 | EBR | 2–10 Hz | - |
| EDA | Shimmer | Empatica 4 | SCL | 1 Hz | 60 s |
| PPG | - | Empatica 4 | HR | 1–4 Hz | 60 s |
| ECG | BeMicro | - | HR | 1–15 Hz | 60 s |
| Emotions (Geneva Emotion Wheel) | Positive Webcall | Negative Webcall |
|---|---|---|
| Admiration | 1 | |
| Contentment | 1 | 1 |
| Joy | 12 | |
| Love | 3 | 2 |
| Pleasure | 6 | |
| Pride | 3 | 1 |
| Relief | 1 | |
| Interest | 6 | 2 |
| Embarrassment | 1 | |
| Compassion | 1 | |
| Anger | 1 | 2 |
| Disappointment | 4 | |
| Disgust | 1 | |
| Fear | 3 | |
| Guilt | 3 | |
| Regret | 1 | 1 |
| Sadness | 2 | 11 |
| Shame | 1 | 3 |
Publisher’s Note: MDPI stays neutral with regard to jurisdictional claims in published maps and institutional affiliations. |
© 2021 by the authors. Licensee MDPI, Basel, Switzerland. This article is an open access article distributed under the terms and conditions of the Creative Commons Attribution (CC BY) license (http://creativecommons.org/licenses/by/4.0/).
Share and Cite
Giorgi, A.; Ronca, V.; Vozzi, A.; Sciaraffa, N.; di Florio, A.; Tamborra, L.; Simonetti, I.; Aricò, P.; Di Flumeri, G.; Rossi, D.; et al. Wearable Technologies for Mental Workload, Stress, and Emotional State Assessment during Working-Like Tasks: A Comparison with Laboratory Technologies. Sensors 2021, 21, 2332. https://doi.org/10.3390/s21072332
Giorgi A, Ronca V, Vozzi A, Sciaraffa N, di Florio A, Tamborra L, Simonetti I, Aricò P, Di Flumeri G, Rossi D, et al. Wearable Technologies for Mental Workload, Stress, and Emotional State Assessment during Working-Like Tasks: A Comparison with Laboratory Technologies. Sensors. 2021; 21(7):2332. https://doi.org/10.3390/s21072332
Chicago/Turabian StyleGiorgi, Andrea, Vincenzo Ronca, Alessia Vozzi, Nicolina Sciaraffa, Antonello di Florio, Luca Tamborra, Ilaria Simonetti, Pietro Aricò, Gianluca Di Flumeri, Dario Rossi, and et al. 2021. "Wearable Technologies for Mental Workload, Stress, and Emotional State Assessment during Working-Like Tasks: A Comparison with Laboratory Technologies" Sensors 21, no. 7: 2332. https://doi.org/10.3390/s21072332