2.1. Experimental Field and Setup
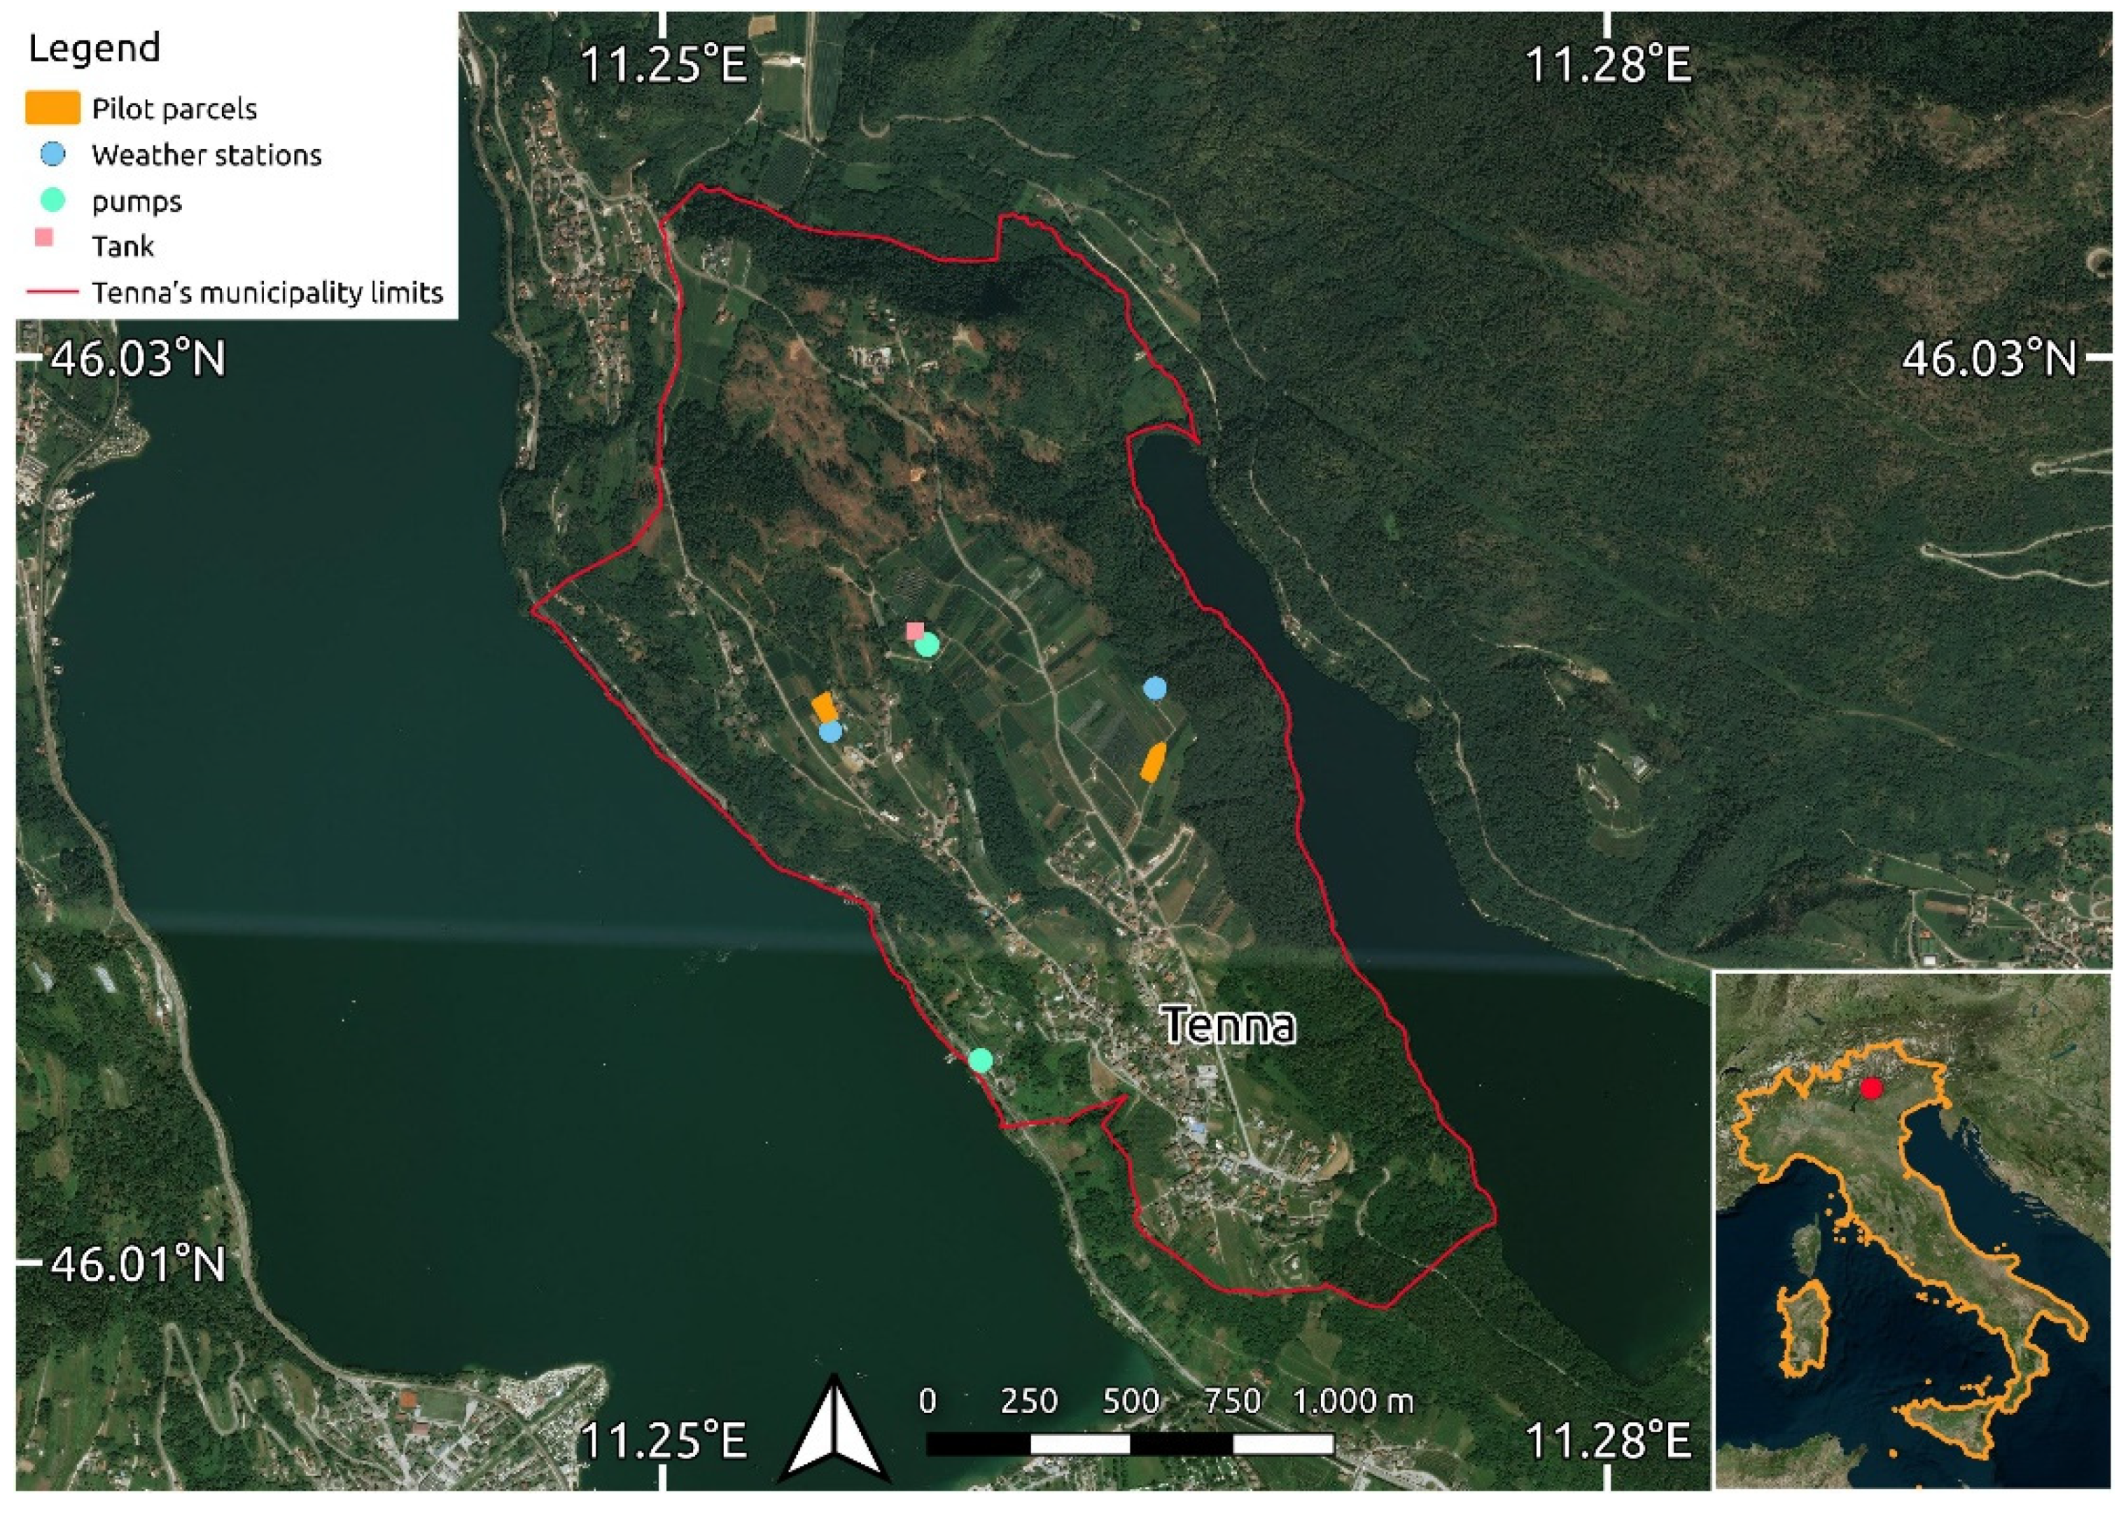
The location chosen for the experimental setup is a cultivated area in the municipality of Tenna, Trentino, Alto Adige region, Italy. The area is about 50 hectares, located in a mountainous area at 569 m a.s.l., and mainly dedicated to the production of apples and berries.
Tenna is characterized by a warm and temperate climate with high rainfall throughout the year, including the driest month. According to Köppen and Geiger [
14], the climate is classified as oceanic temperate (Cfb), the average temperature is 10.4 °C, and the average annual rainfall is 862 mm.
The difference in precipitation is 56 mm between the driest month and the wettest month. Average temperatures vary by 21.3 °C over the course of the year (
Table 1).
In recent decades, the area has been characterized by climate change;
Table 2 shows the average monthly temperatures of 2019, which highlights sharply increased values.
The irrigation of the area is managed by a local consortium of small agricultural producers, the Consorzio di Miglioramento Fondiario di Tenna.
The experimental setup consists of two experimental parcels in the Tenna area (
Figure 1).
The east parcel, with an area of 0.21 ha, is cultivated with golden apples on rootstock M9, planted in 2015, with a planting distance of 0.80 × 3.00 m. The west parcel, with an area of 0.17 ha, is cultivated with Crimson Crisp apples on M9 rootstock, planted in 2014, with a planting distance of 0.80 × 3.50 m. Apples begin the vegetative cycle around March 20th. For both varieties, the fruits are harvested in the last week of September, and leaf fall occurs in the first days of November.
Both parcels are managed through driplines irrigation systems. The water is collected from the Caldonazzo lake at a quota different by 187 m. The difference in altitude is surmounted by means of an electrical 75 kW pump with a flow of 26 L m−1. At the top of the pumping system, a cistern of 200 m3 collects the water pumped from the lake and, from there, drops by gravity to the parcels. Two other 9 kW parallels pumps, with a flow of 18 L m−1, guarantee the water supply to the upper fields of the consortium.
The conventional irrigation scheduling adopted for the entire consortium’s parcels is equal to 1 h a day with a water volume of 5.25 mm m−2. The west experimental parcel was used as control for the irrigation model comparison, being managed through conventional irrigation strategy.
Both soil parcels are characterized by sandy loam texture in the first 90 cm of depth. The organic matter (OM) content in T1 (east parcel) is considered moderately low at 30 cm and 60 cm and low at 90 cm, while in T2 (west parcel) soil OM is moderately low at 30 cm and very low (not quantifiable) at 60 cm and 90 cm. Nevertheless, in T2, high content of organic matter on the topsoil was detected. Both soils are considered noncalcareous. The available water capacity (AWC) tends to be low, consistent with the sandy classification of the two soils. This would confirm the need for a specific differential irrigation strategy in terms of volumes and number of interventions. Due to the presence of skeletons (particles with a diameter >2 mm), especially in T2 (west) soil, particular attention was paid to sampling the soil.
Soil is managed with inter-row grassing and chemical weeding on the row. The root depth of apple trees, being on weak rootstocks M9, reaches a maximum of 0.40 m.
In each experimental parcel was installed a weather station and soil moisture sensors connected via LoRaWAN protocol.
The installed weather stations (
Table 3) are Davis Vantage Pro2 models, engineered to handle the harshest environments and deliver data with scientific precision. It was used to collect the following data: air temperature and humidity, dew point, wind speed and direction, barometric pressure, and rainfall. The installed model is also capable of communicating data through a mobile Internet connection to the web database and it is also integrated with a LoRaWAN gateway to collect data from remote field sensors. In addition, extra sensors and accessories could be added to the Vantage Pro 2 station to allow the design of sophisticated environmental monitoring systems, building up an adapted configuration.
2.2. The Open Source Soil Moisture LoRa Device
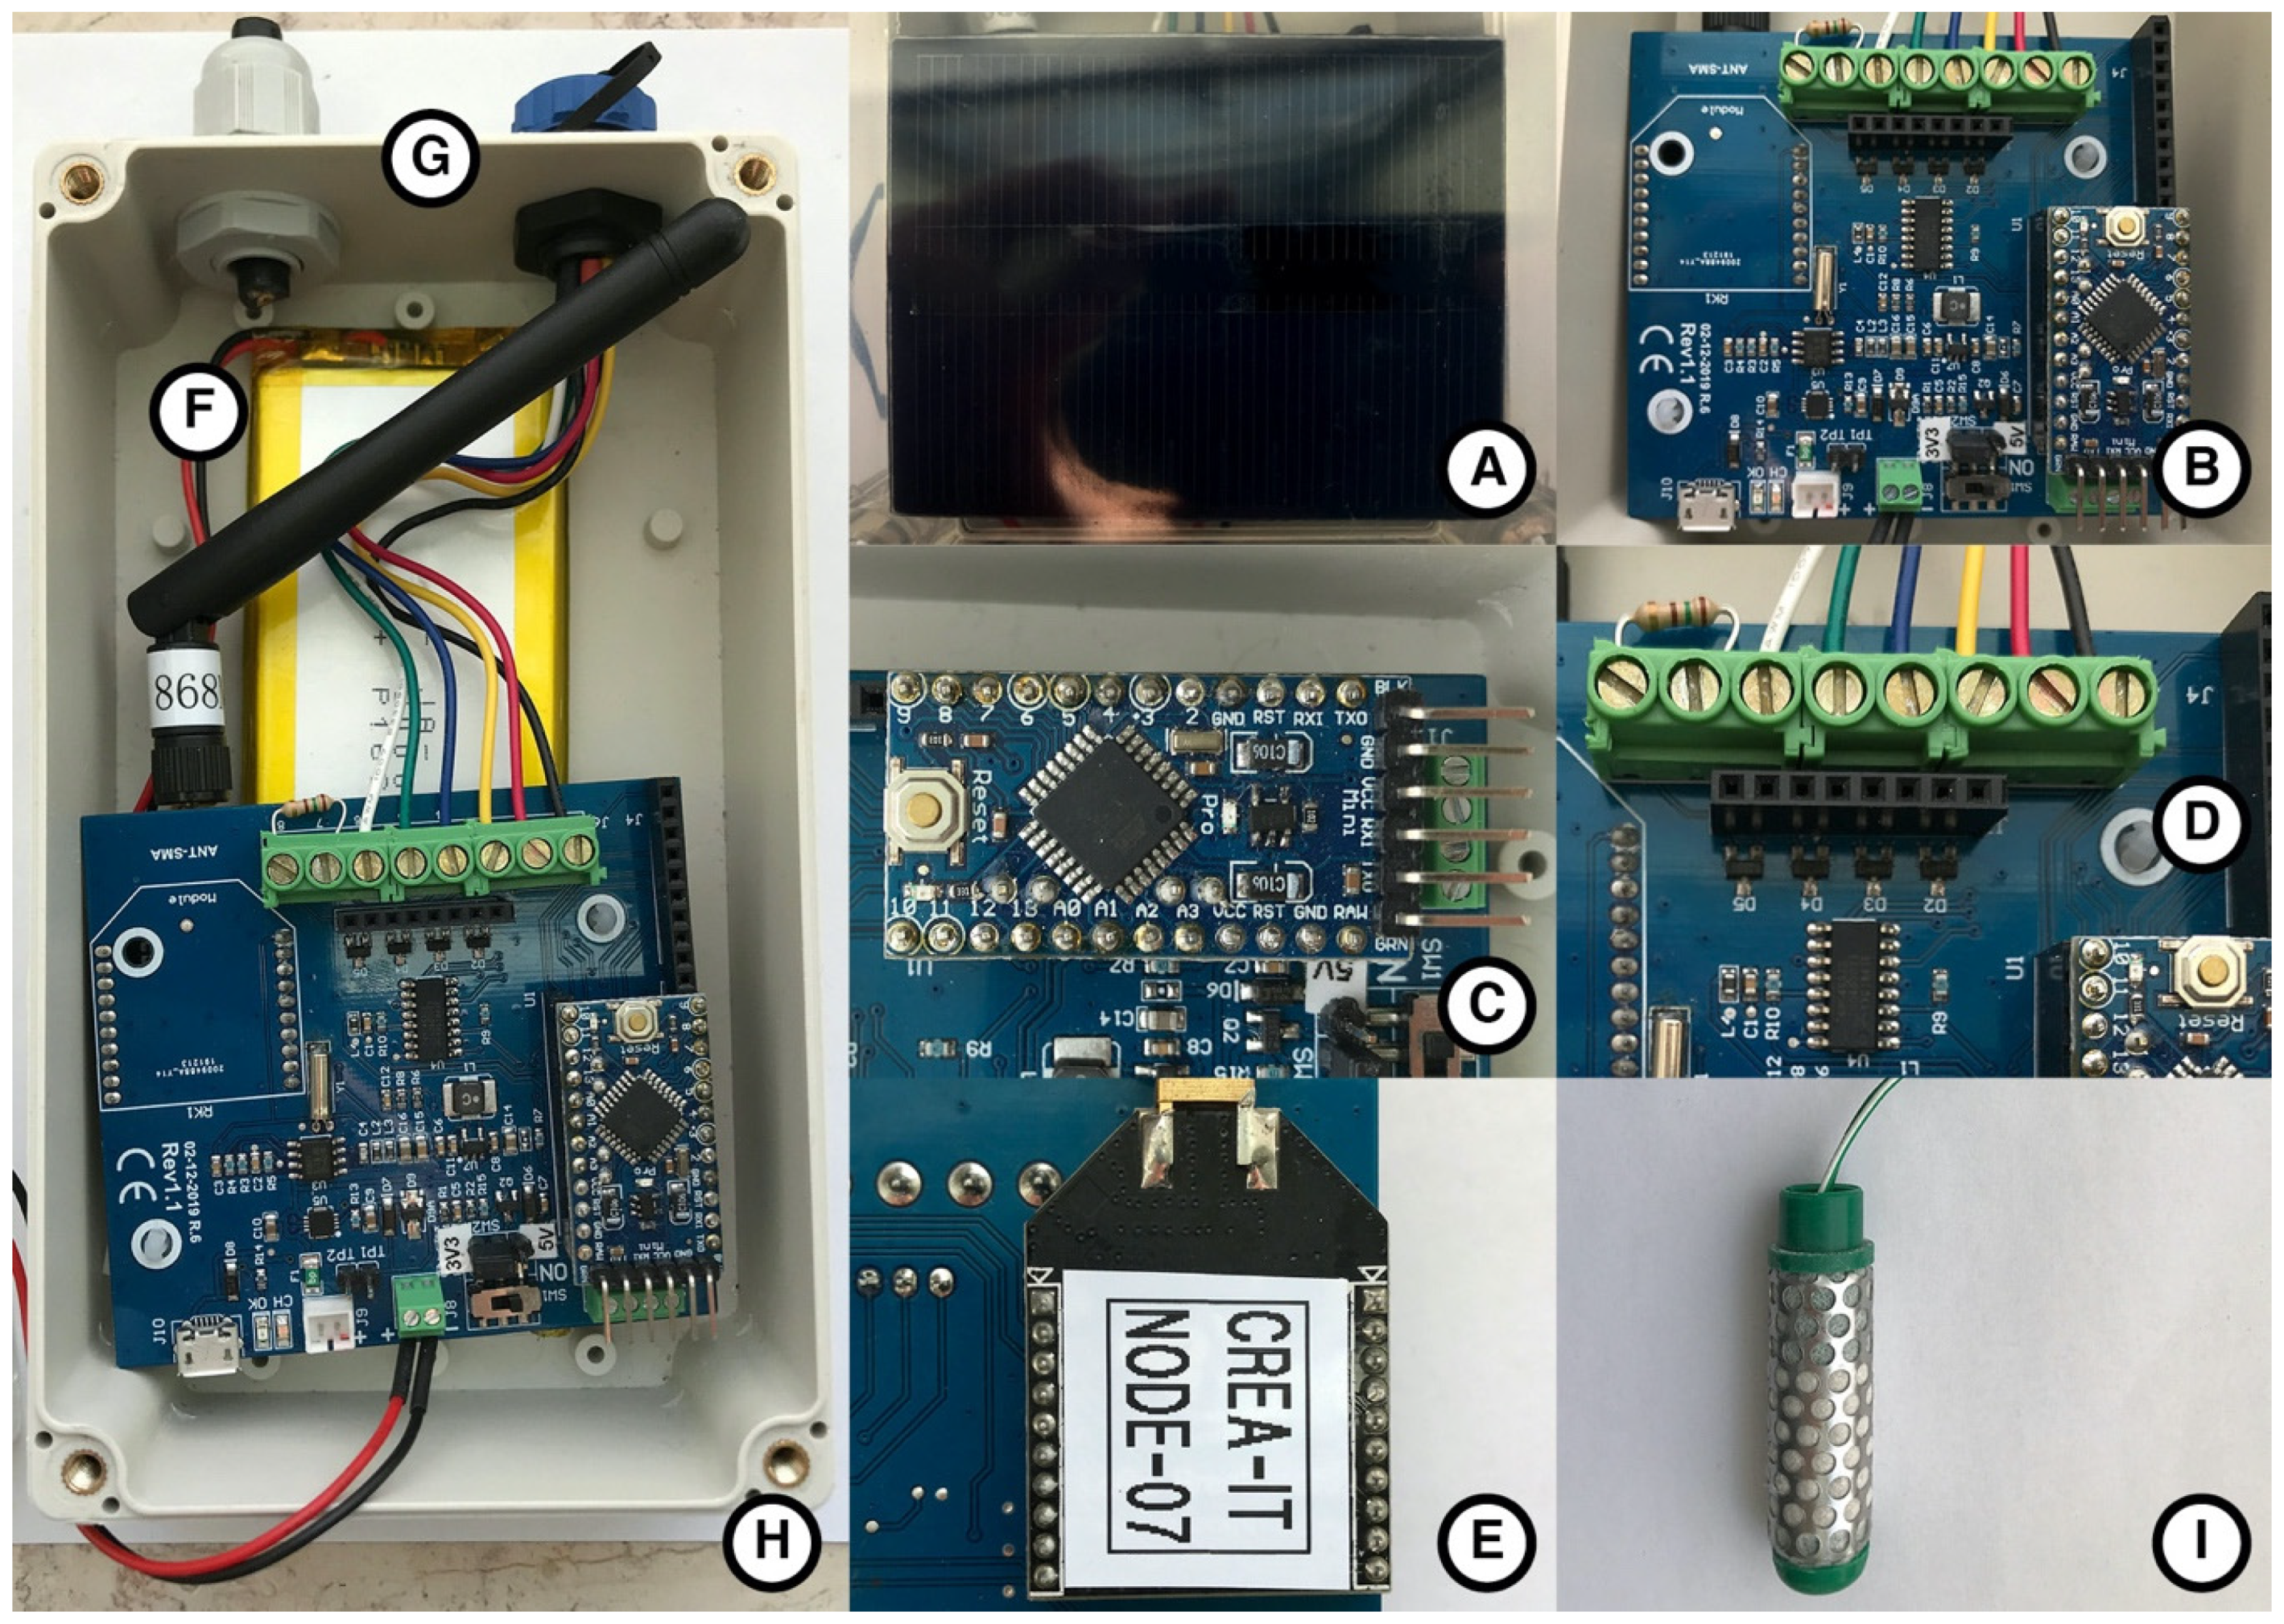
The soil moisture LoRa device is based on open source technology (software and hardware). Mainly, it is equipped with soil moisture sensors, based on resistive technology, which exploits the relationship principal constant between the ohmic variation and pressure given by the soil water tension, soil moisture, air quality, and rainfall height sensors. The model used is the Watermark Soil Moisture Sensors 200SS (The Irrometer Company Inc., Riverside, CA, USA), a well-established method of assessing soil moisture in crops with a good value for money. The acquired information is transferred through radio waves using LoRaWAN (long-range wide-area network) technology. The transmission protocol was chosen because it guarantees greater autonomy of the device and a range of action on several km. The whole system was optimized to reduce energy consumption, making it possible to power it through a LiPo battery recharged through a small solar panel (
Figure 2).
The device was designed in a single electronic board (
Figure 2), integrating different numbers and typologies of sensors. This device can integrate many types of sensors, for example, those typical of a weather station (e.g., rain gauge and air quality), monitor the status of the battery and solar panel, with a dedicated connection for debugging. Finally, the actual communication system, currently based on LoRaWAN, can be replaced for other applications with different technologies such as Wi-Fi and Xbee.
The selected soil moisture sensors (
Figure 2) consist of a pair of highly corrosion-resistant electrodes embedded in a granular matrix. A current is applied to the sensor to obtain a resistance value. The sensor meter correlates the resistance to centibars (kilopascals) of the soil water tension. The sensor has also been designed to be a permanent sensor, positioned in the matrix to be monitored. Finally, an important feature, for the reliability of the reading, is the presence of plaster installed internally, which provides a buffer effect considering the effect of the salinity levels normally present in crops and irrigated agricultural landscapes.
The sensors installed for the experimental activities of this study are equipped with three moisture sensors (installed at 30–60–90 cm depth) and a rain gauge.
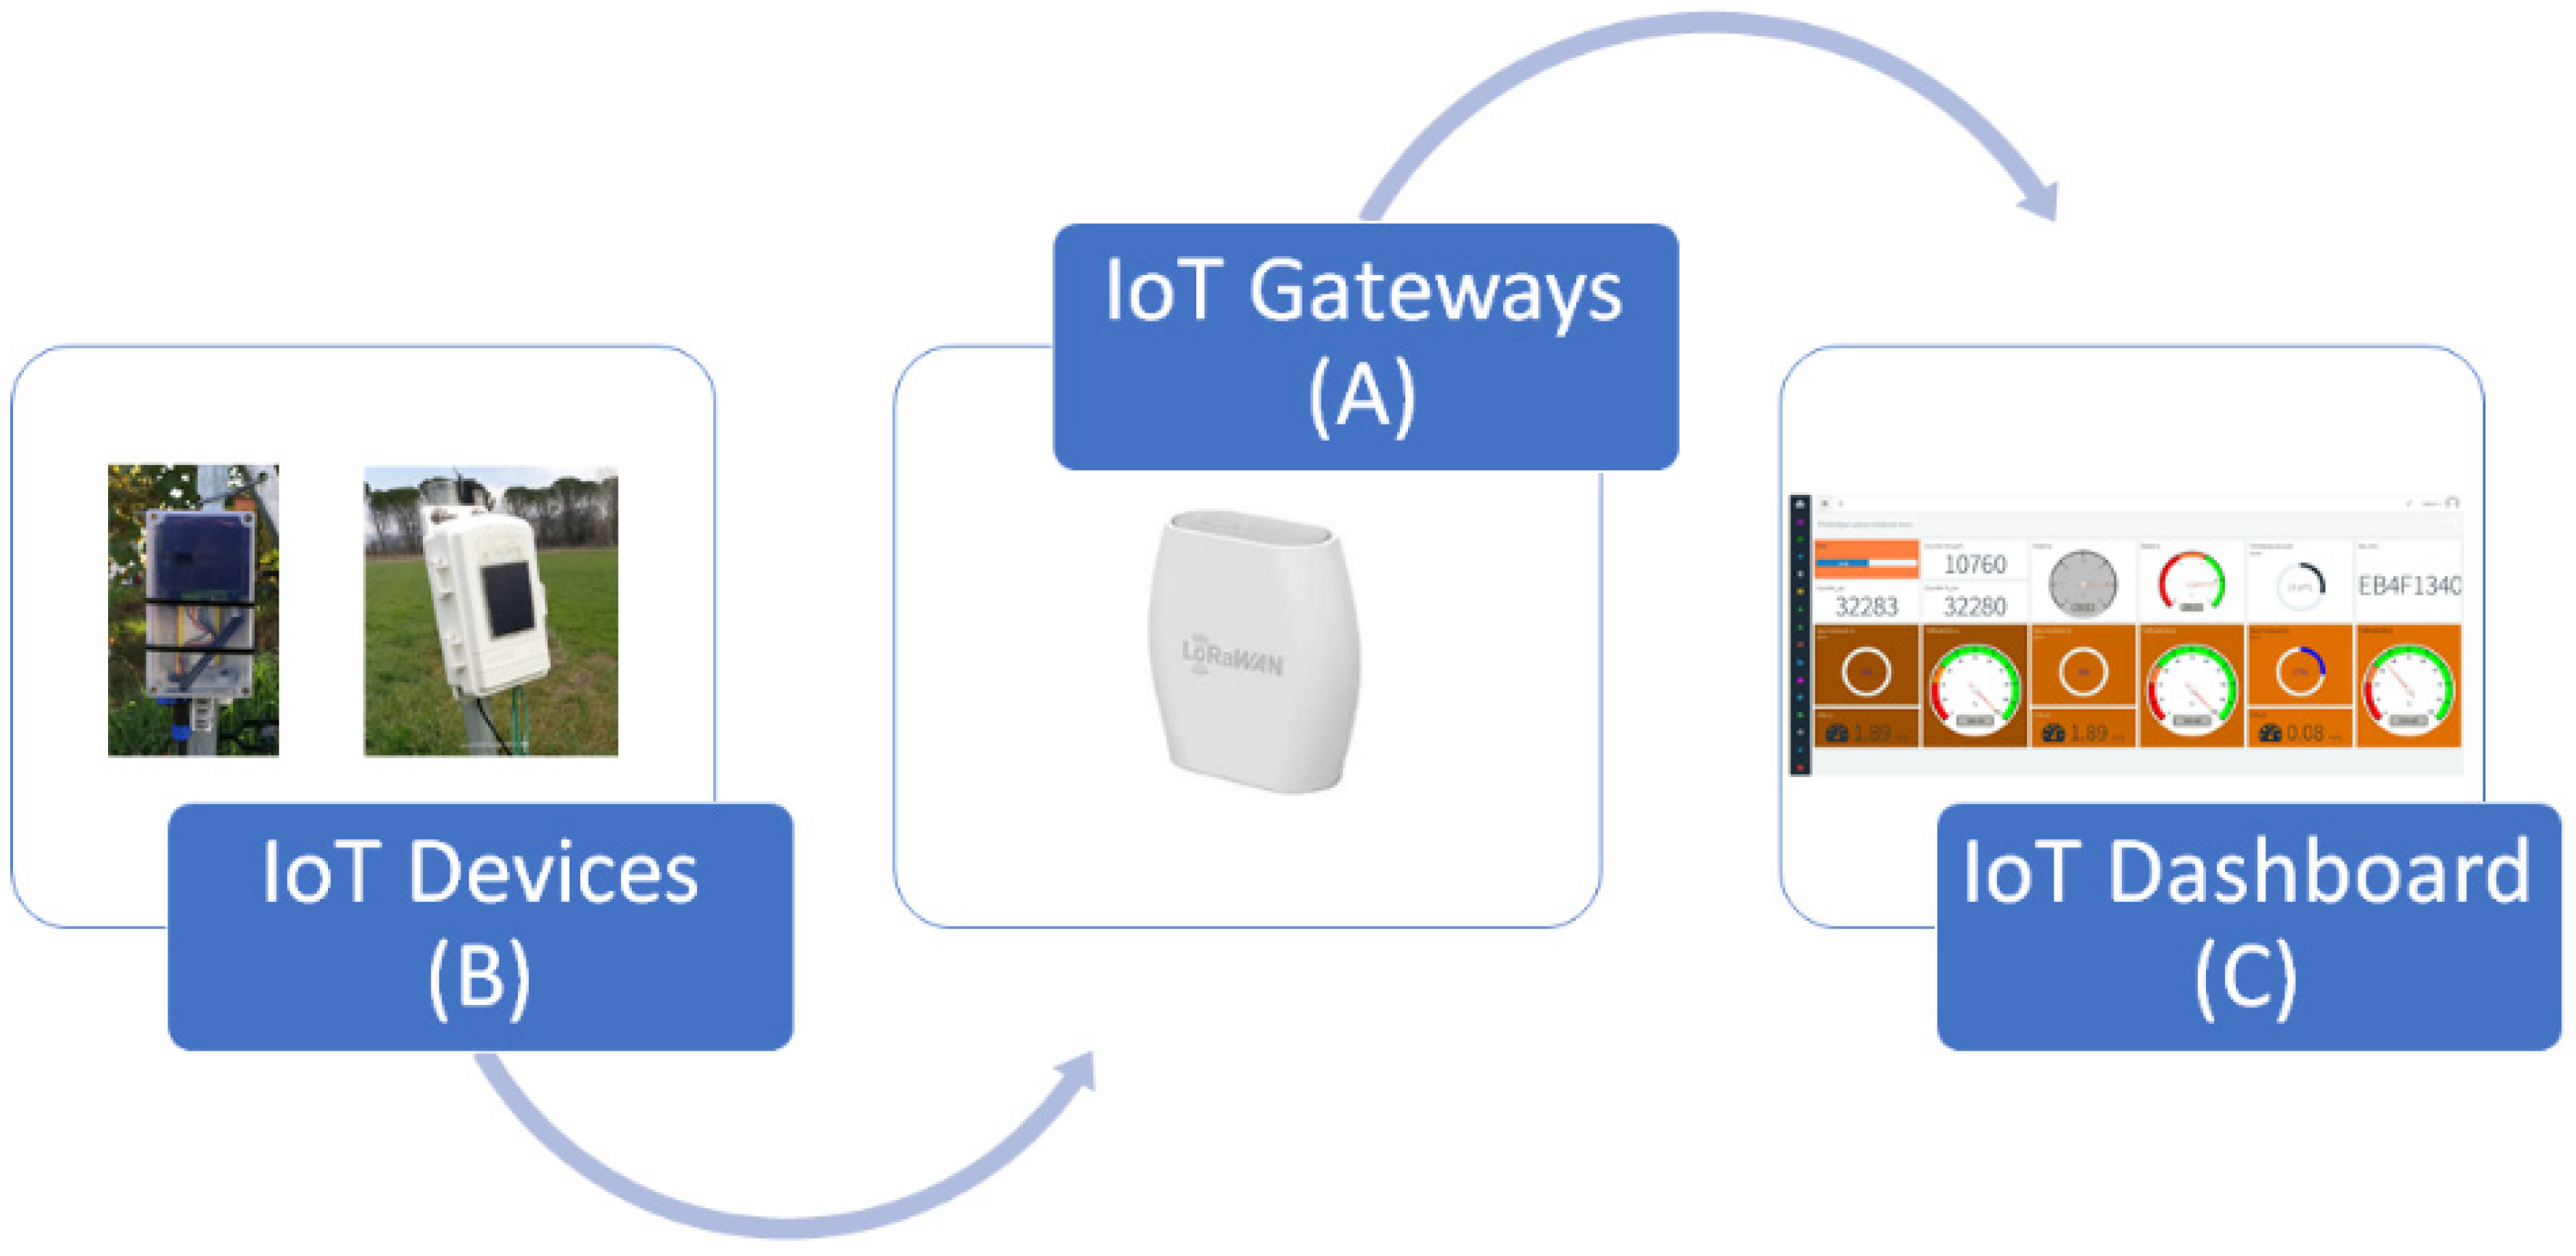
The data acquisition and historicization infrastructure is composed by the LoRaWAN gateway, for a direct connection of the sensors via LoRaWAN transmission and an IoT remote service for the creation of the dashboard (
Figure 3) and historicization of data.
The device transmits the packet containing the read values to the gateway on which it has established a LoRaWAN connection. Then, the gateway forwards the packet to the remote service that will historicize and display according to the created mask. This service is accessible from any internet point. The approximate cost of the open source device with the configuration described above is around EUR 350.00, which can be considered low cost, compared to a commercial device on the market.
The developer open source device was operatively compared with the Sentek Drill & Drop soil moisture and temperature sensors installed in the Tenna parcels. These are capacitive frequency domain reflectometry (FDR) sensors with a probe length of 90 cm and a step of measurement of 10 cm in depth.
2.3. Data Acquisition and App
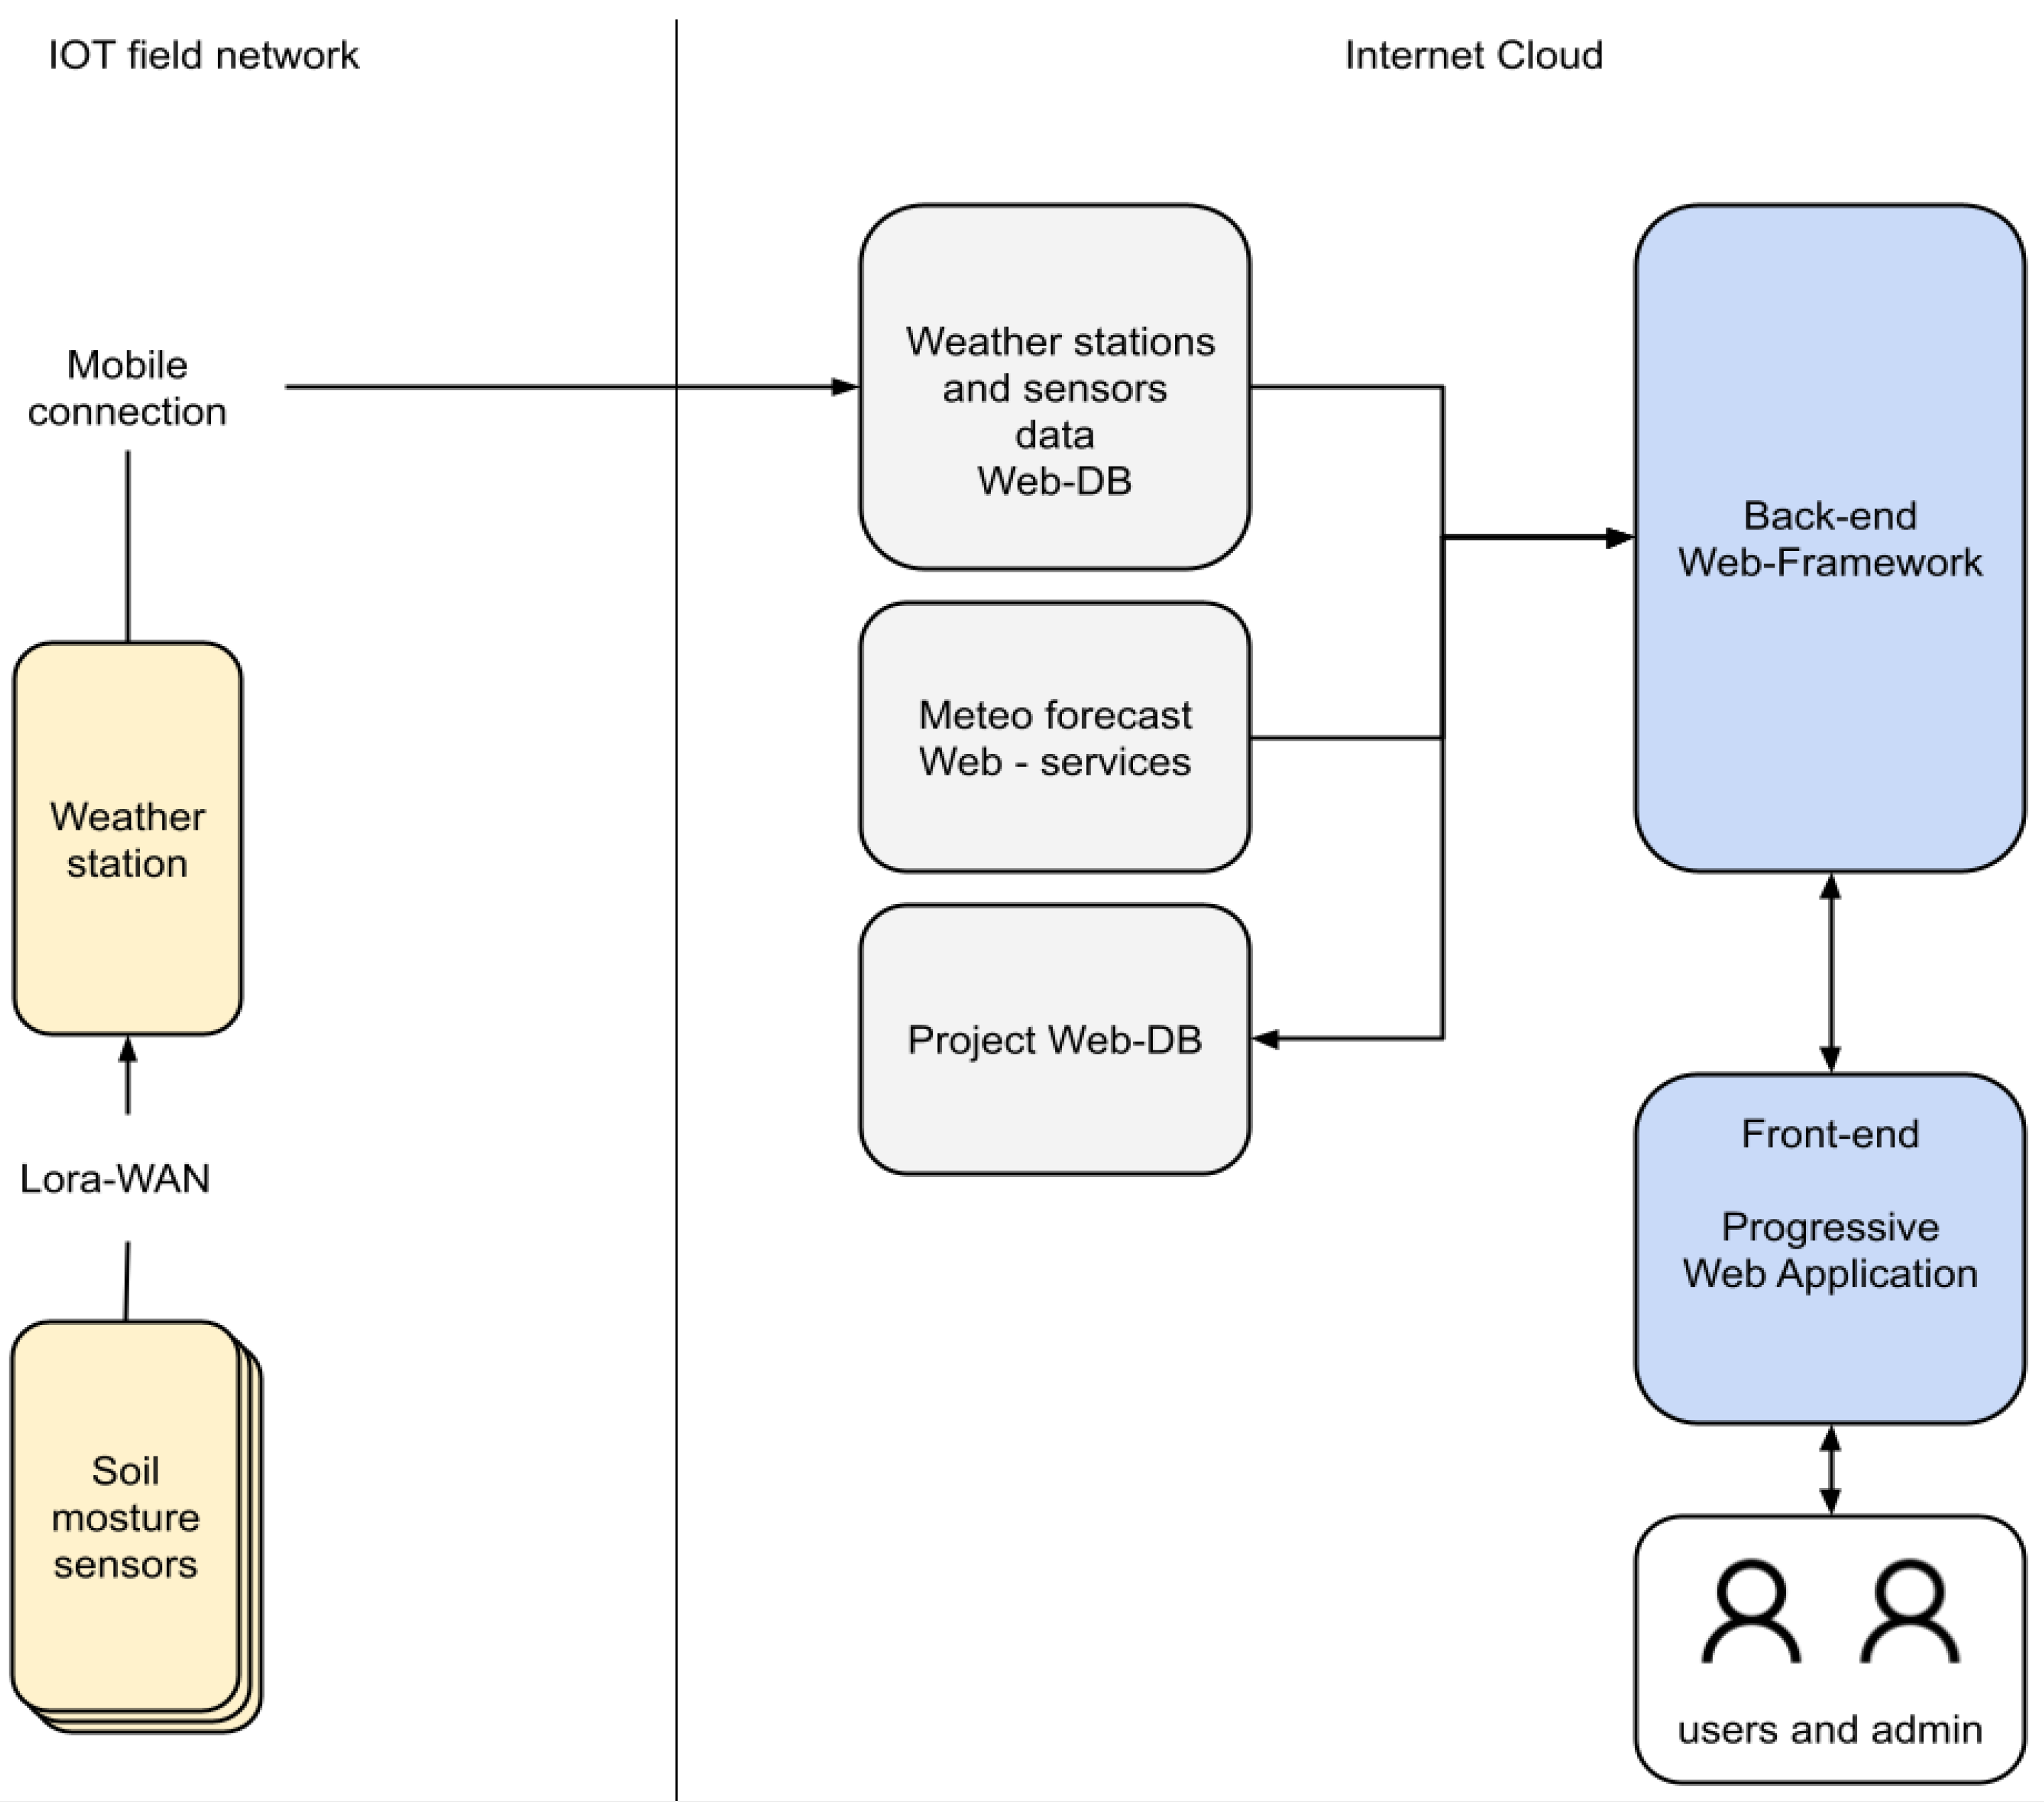
The experimental area sensors operate through an IoT LoRaWAN local network and transmit data to a web-based software framework that manages the back end of the system, the cloud databases, and the interface with final users called via a web application (
Figure 4).
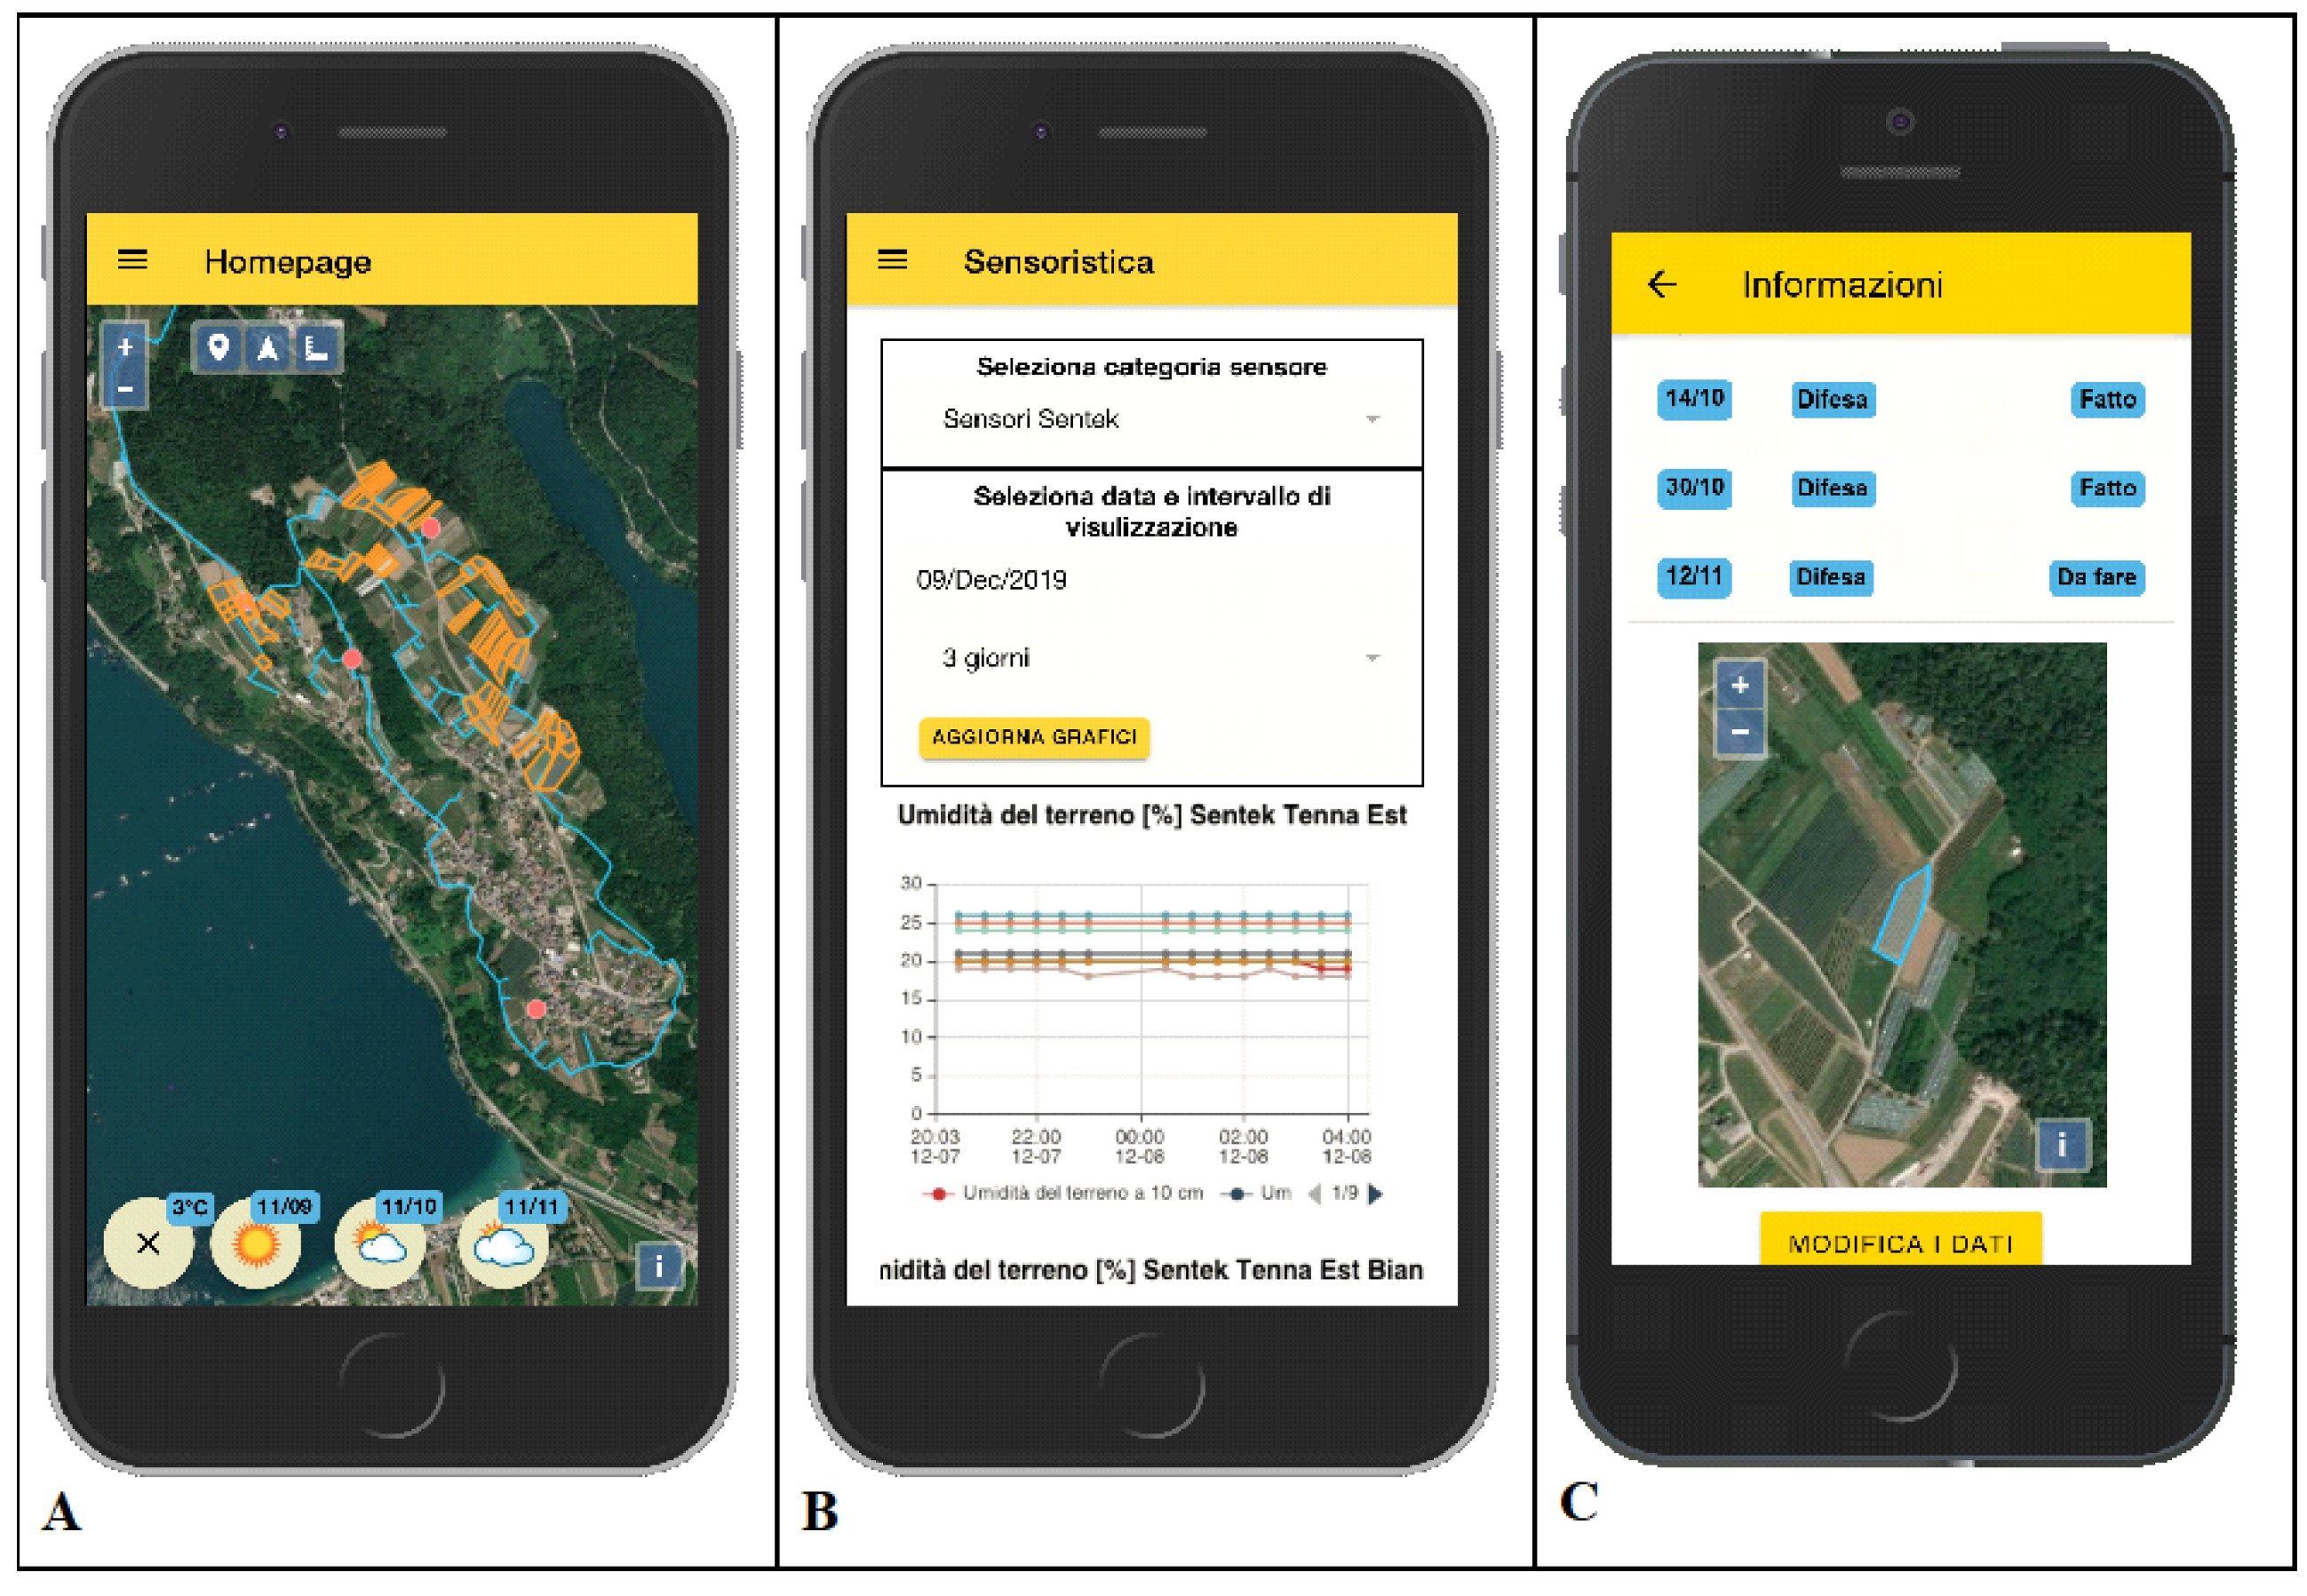
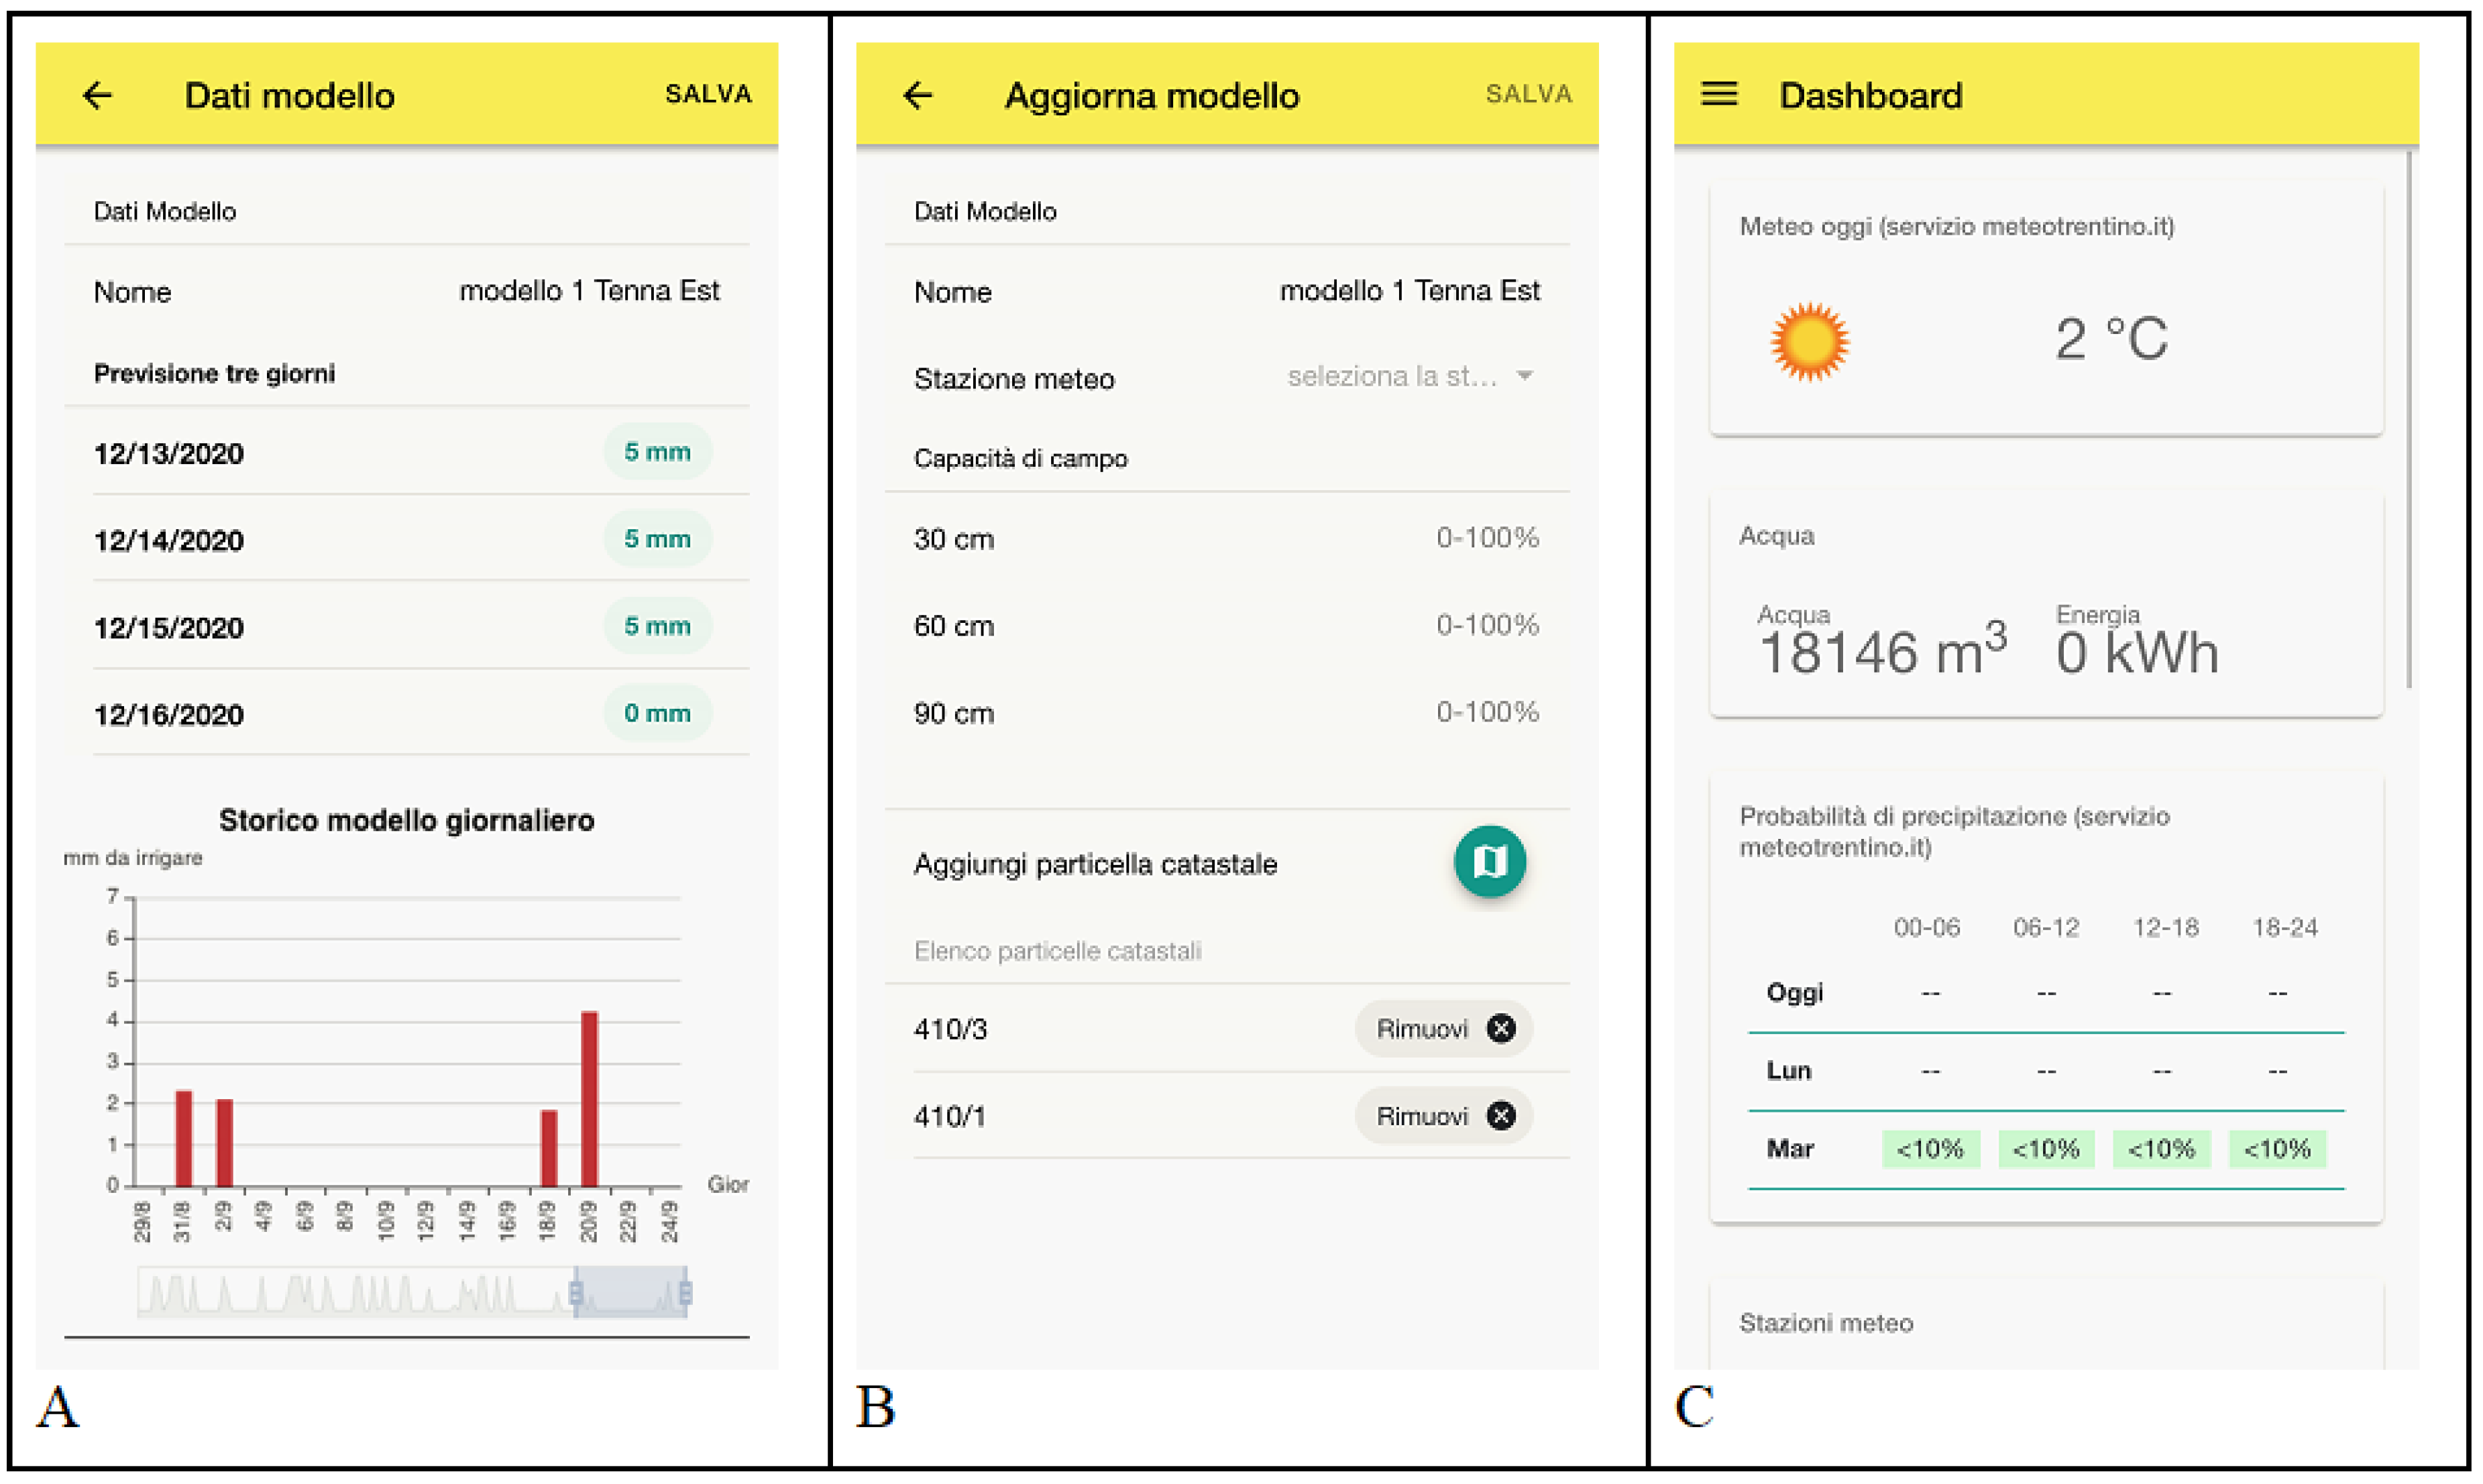
The front-end software was developed as a mobile progressive web application (PWA), and it was implemented using Ionic and Angular frameworks (
Figure 5). The app is available for Android and iOS and, alternatively, it is accessible via a common browser. The app allows final users to access the data collected by sensors, manage their cultivation, the agricultural activities, and, for admin users, monitor water and energy consumption. Moreover, the web application allows admin users to check the precision irrigation model outputs and evaluate irrigation decisions.
The back-end web framework is a server-side REST API (Representational State Transfer Application Programming Interface), implemented in Loopback. It provides a common interface to the front-end application to access the different data sources of the project—sensors data, weather stations data, weather forecast data. It also provides the interface to store and retrieve in a MongoDB web-DB user data such as parcels administrative and geographical data, fields data, agricultural activities log, etc.
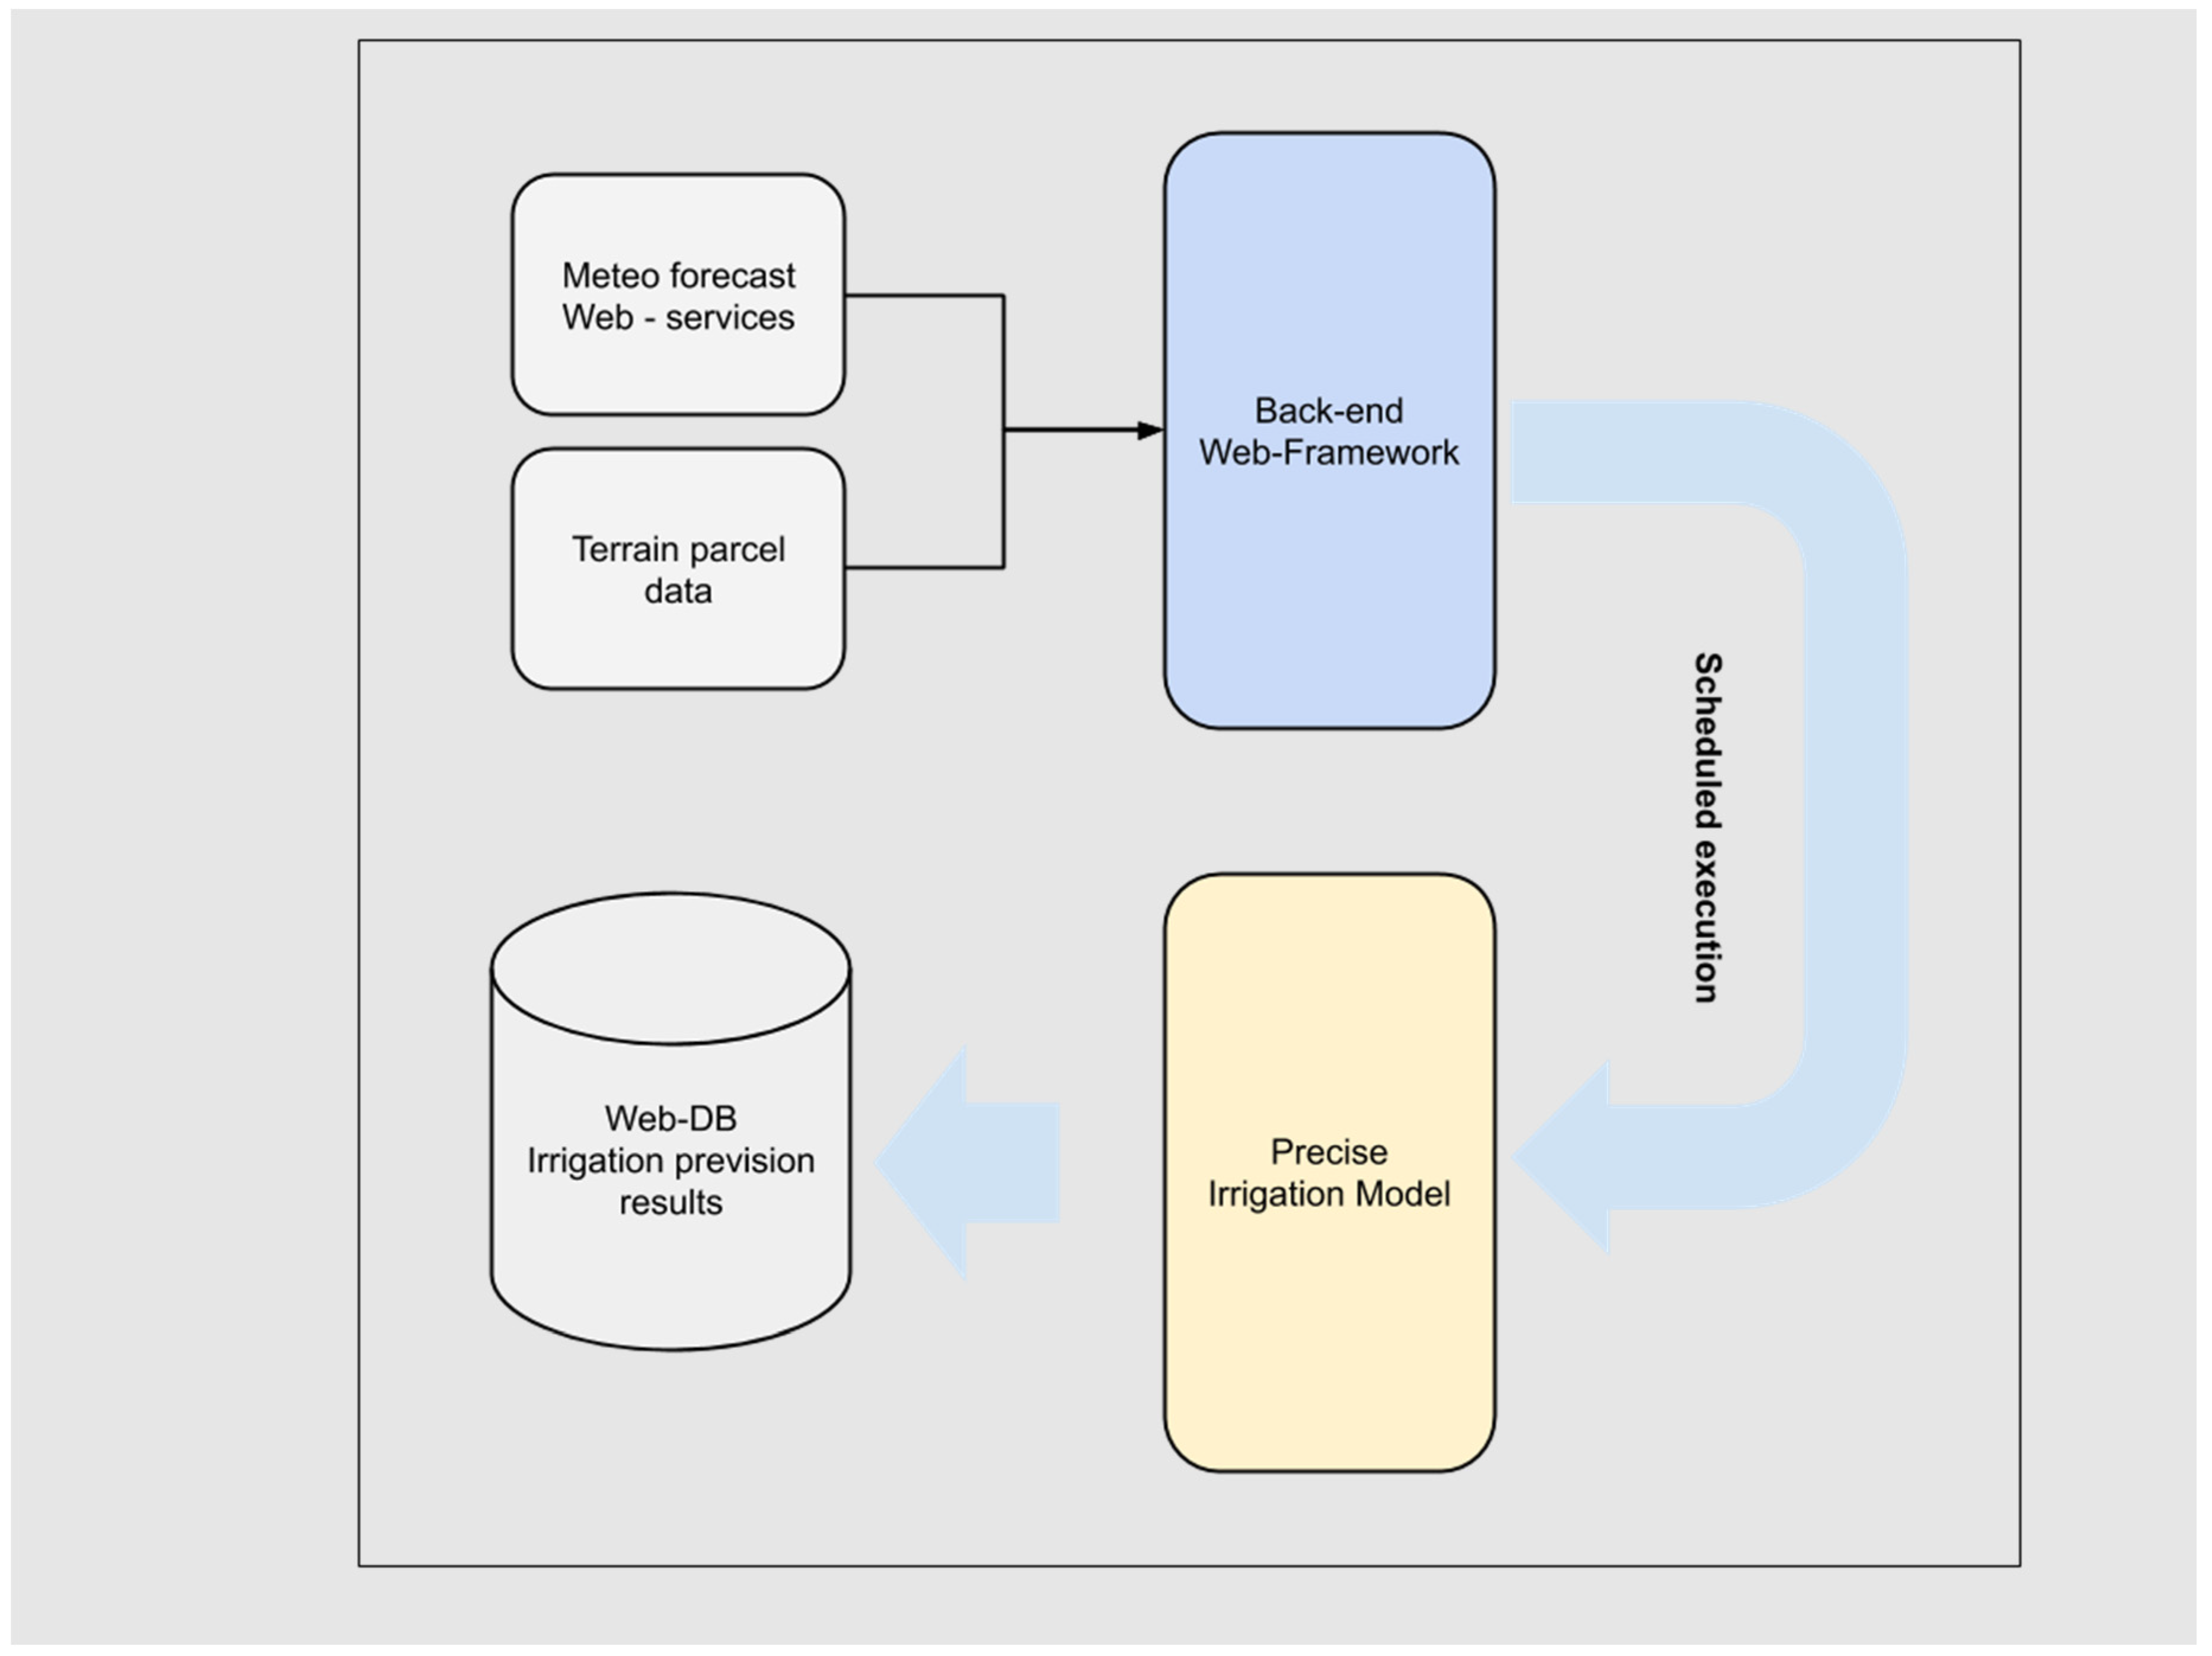
The back-end web framework (
Figure 6) has also a specific developed service to execute the predictive modeling for precise irrigation. Precise irrigation model’s software implementation consists of a MATLAB code runnable via MATLAB Runtime Compiler. The model execution needs field terrain data stored in the project web database and updated weather forecast data. A server-side Node.js application runs independently at a model-dependent scheduled time, from one time every day to one time every 6 h, collects data from weather service and database, and stores new irrigation prevision results on it; it also preserves previous predictions.
The irrigation previsions are immediately and automatically available in the mobile web application and could be used to adapt the irrigation strategies. They could also be part of the necessary data needed to pilot the automatic irrigation system.
In the mobile web application (
Figure 7), admin users could also examine historical previsions data of the specific model and manage the association of the model with compatible parcels of the consortium. Finally, a panel in the app dashboard quickly summarizes the total amount of water used from the beginning of the irrigation season, using the predictive irrigation model instead of the classic daily constant rate.
2.4. Predictive Modeling
The database was constructed with data collected from the weather station and from the sensors (commercial ground sensors and open source soil moisture LoRa) distributed in the Tenna consortium from 19 June to 3 September 2019 (77 days).
The weather station collected the following parameters every 30 minutes: air humidity (%), air temperature (i.e., maximum, minimum, and average (°C), dew point temperature (°C), wind direction, mean wind speed (km∙h−1), gust wind speed (km∙h−1), rainfall height (i.e., H2O rain; mm), solar radiation (Watt∙m−2)).
The commercial ground sensors measured soil temperature and moisture at different depths of 20, 30, 40, 50, 60, 70, 80, and 90 cm (
Figure 8). Meanwhile, the open source soil temperature was measured at 30 cm, and the soil moisture LoRa at 30, 60, and 90 cm. Additionally, the irrigation water input estimated indirectly from the consumption in kWh of the pump was added to these data.
The pump of the consortium consumed 900 kWh equivalent to 5.25 mm m
−2.
Table 4 shows the parameters related to the soil structure at different depths.
The optimum moisture (%) for the crop (at different depths) must lie between the values of available water capacity (AWC) and those of field capacity (FC). Above the FC values, the water is dispersed into the subsoil. The objective of the models is to suggest a correct water supply to keep the crop always in the optimum range without going to waste water-soluble fertilizers and/or energy.
In the first phase, the dynamics of the water in the soil at the different layers were studied. To observe the correlation between the input water (rain + irrigation) and the soil moisture at different depths (i.e., 30, 60, and 90 cm), a cross-correlation analysis (Davis, 1986) was carried out on the two columns of daily sampled temporal data. The correlation values at different time (day) lags were calculated, together with the
p values indicating the significance of the correlation. Cross-correlation analysis was carried out with the software PAST (version 2.17v) [
15].
The precision irrigation model was based on the concept of TimeLag/TimeSeries [
16]. TimeLag represents the elapse between the water input and the soil moisture data shifted
i days before and analyzed with the aforementioned cross-correlation analysis. Furthermore, the possibility was considered that the event could be related to the variable of specific adjacent (
n) days (TimeSeries). Consequently, the possibility to combine the TimeSeries variables was considered to account for variable weights different from the initial condition.
The input block (X-block) in the training phase was constituted by the parameters (daily mean, minimum, and maximum) collected by the weather station (i.e., air humidity (%), air temperature (i.e., maximum, minimum, and mean; °C), wind direction, mean wind speed (km∙h−1), rainfall height (i.e., H2O rain (mm)), by the parameters measured by the ground sensor (i.e., daily mean soil moisture at different depths (30, 60, and 90 cm)). The Y-block was constituted by the irrigation water input (mm).
The partial least squares (PLS) procedure was elaborated using the PLS Toolbox in MATLAB V7.0 R14 (Math Works, Natick, MA, USA), and included the following steps: (i) the extraction of the dataset (X-block variables); (ii) the creation of a measured values dataset to be used as a reference or response variable (Y-variable); (iii) the data fusion of the two datasets (Y- and X-block) in one analysis dataset (AD); (iv) an analysis dataset partitioning into the model set (MS = 80% of AD) and external validation test set (TS = 20% of ADs) by means of a sample set partitioning based on the joint x–y distances (SPXY) algorithm. This method employs a partitioning algorithm that considers the variability in both x- and y-spaces; (v) application of different preprocessing algorithms to the X- and Y-block (none, Log 1/R, diff1, mean center, autoscale, median center, baseline)—the matrices were preprocessed using the autoscale MATLAB algorithm; (vi) application of chemometric technique—modeling and testing; and (vii) calculation of the efficiency parameter of prediction. Partial least squares consider internal cross-validation of the model set, and we introduced a further validation using the test set. The performances of the model were estimated by evaluating the coefficient of correlation (r) between observed and predicted values, the standard error of prediction (SEP), root-mean-square error of calibration (RMSEC), and bias calculated as the average of the differences between predicted and measured values. Residual predictive deviation (RPD), defined as the ratio of the standard deviation of the laboratory-measured (reference) data to the RMSE, was used to verify the accuracy of the model. The model accuracy and precision were evaluated according to the highest r, minimum SEP, maximum RPD, and bias value very close to zero [
17].
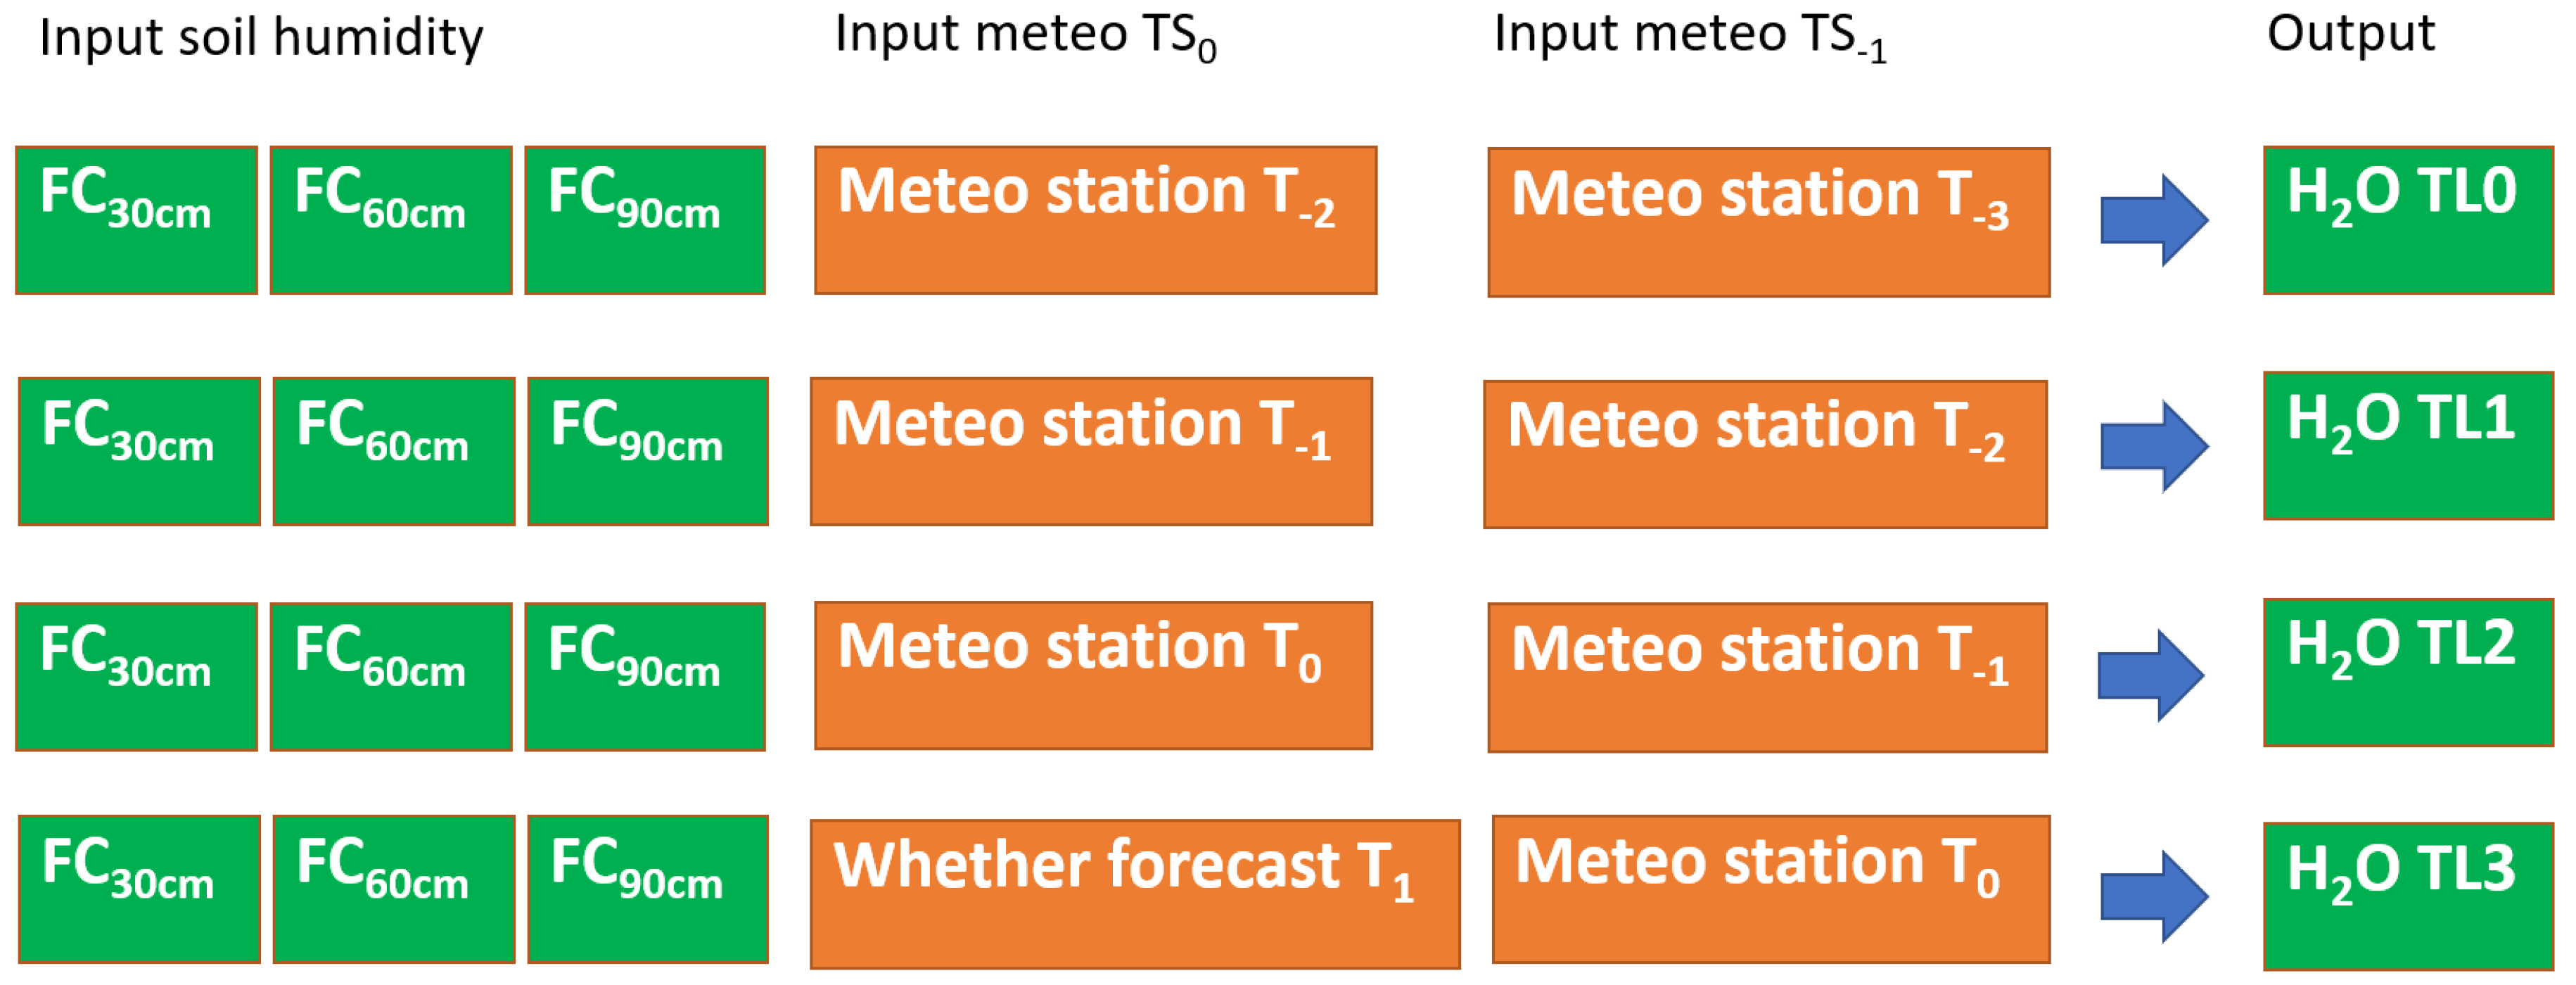
After the training phase, the model resulting to be the most efficient and robust was adopted (application phase) for the in-field application and inserted in the web framework for scheduled previsions. The model predicts the irrigation water needs for the same day of the interrogation (T0), for the next day after the interrogation (T1), and the following second and third days after the interrogation (T2, T3). The prevision model replaced the soil moisture at the different depths (30, 60, 90 cm) with the field capacity at the same depths (
Figure 8). The open source weather forecast was implemented at TL > 0 using the service Open Weather Map. A scheme of the application phase at different timing is shown in
Figure 8.


 ,
, 


