
Prediction of Drill Bit Breakage Using an Infrared Sensor

 , ,
, ,
Abstract
:1. Introduction
2. Theoretical Background
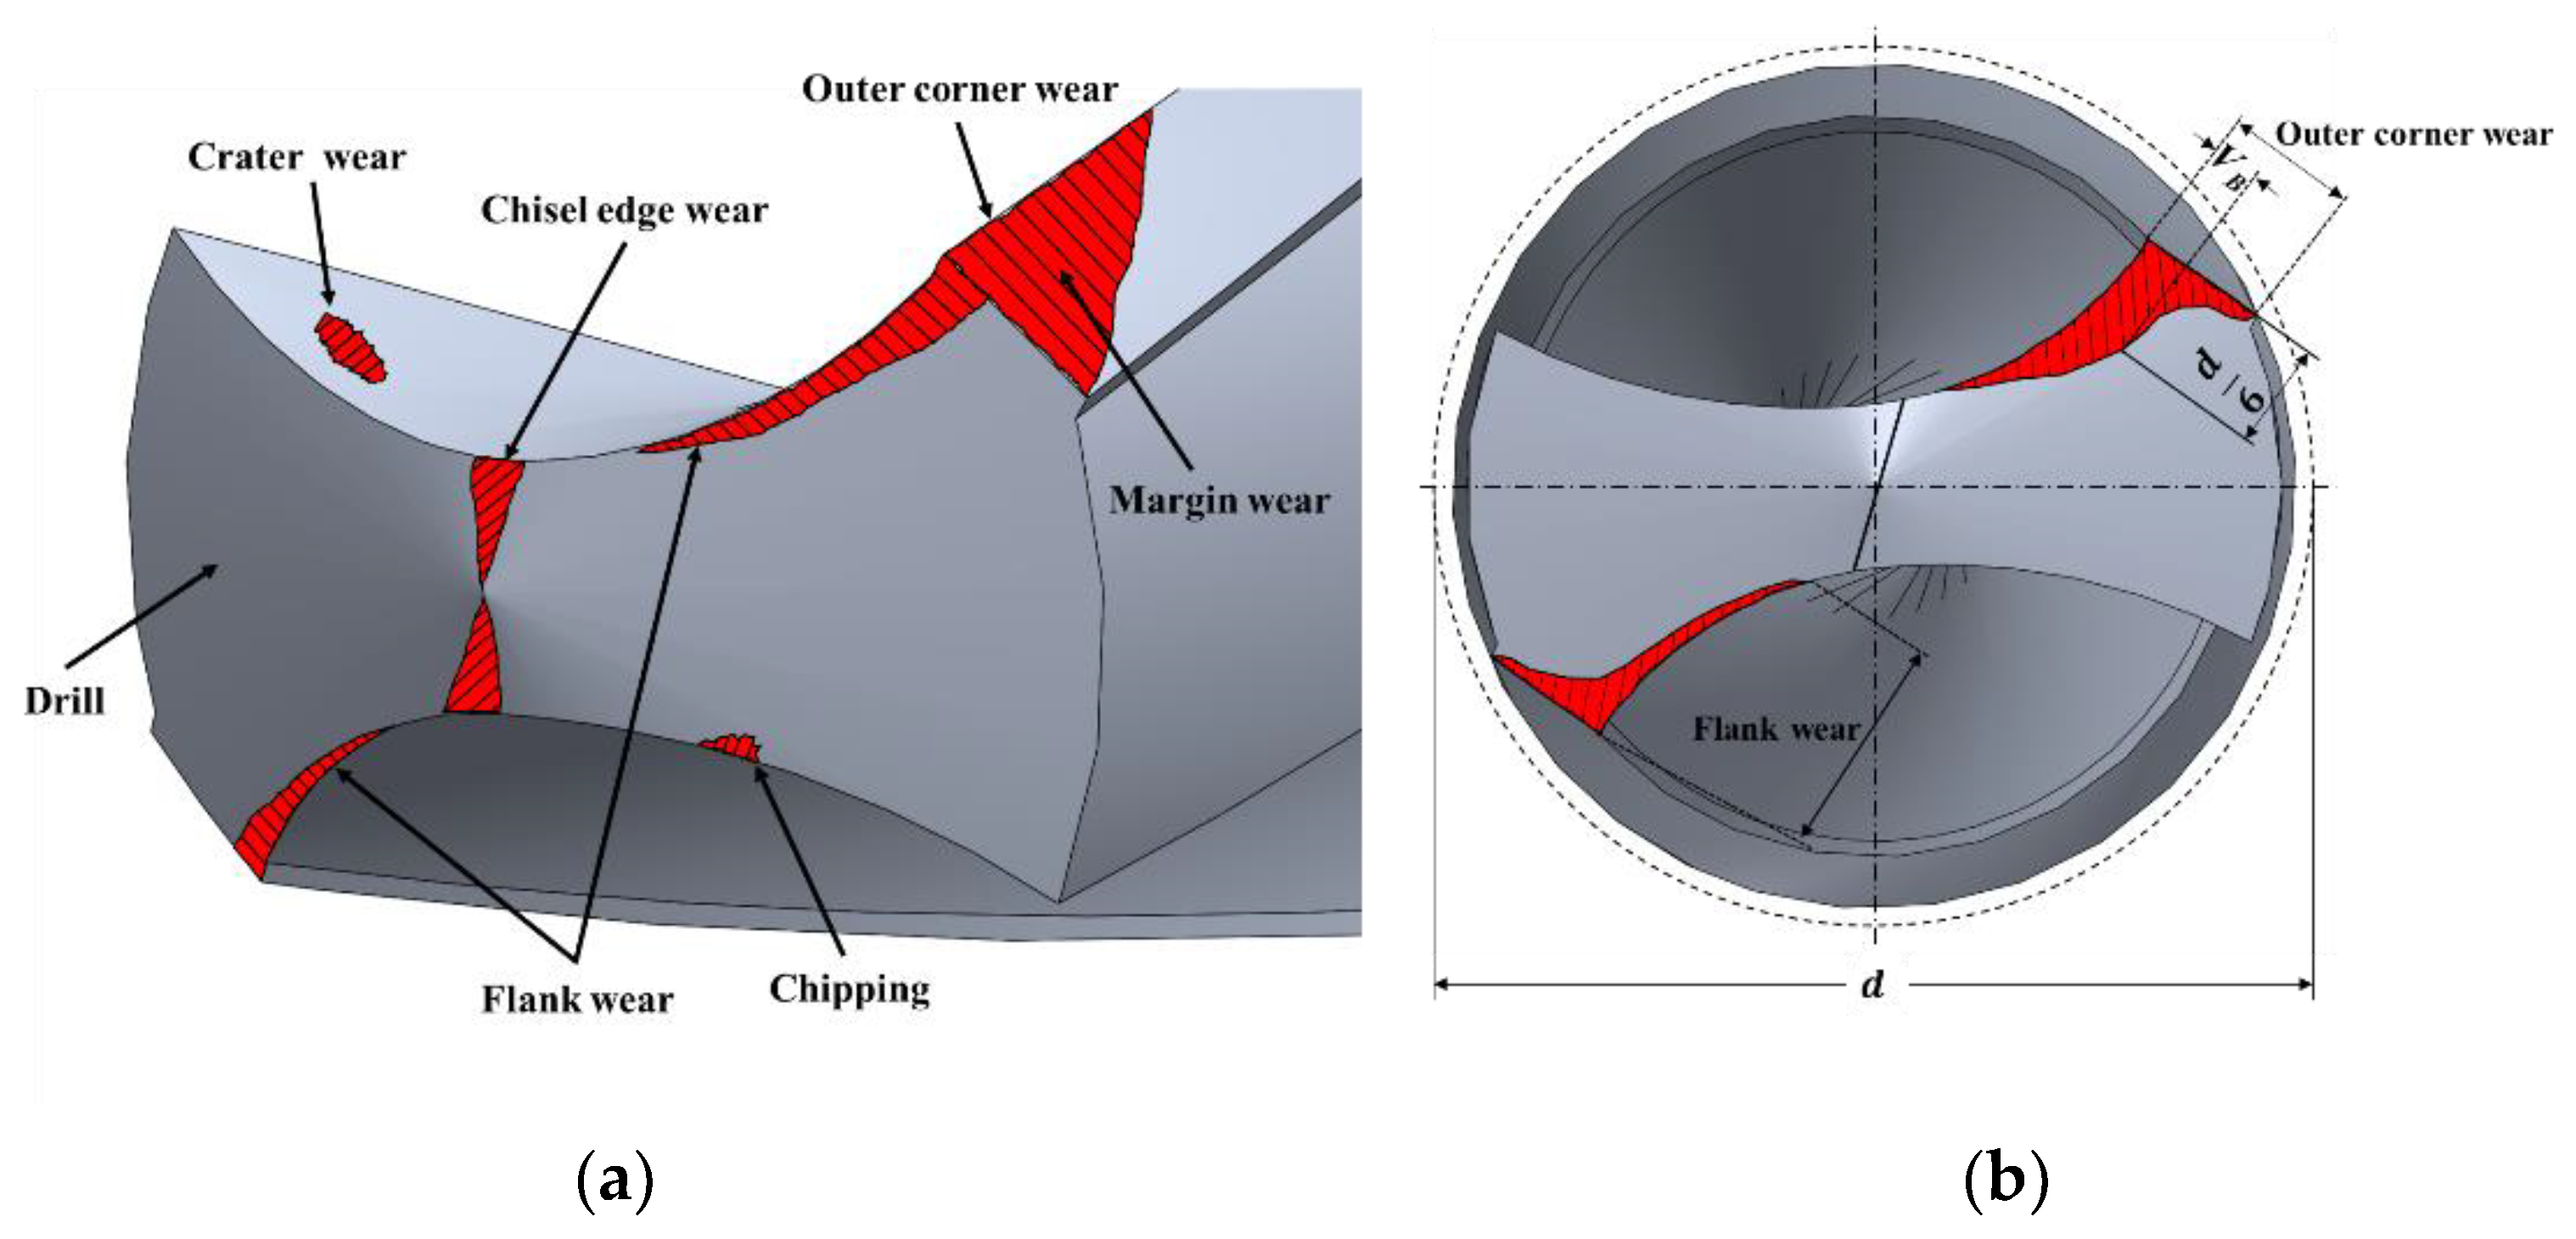
2.1. Drill Bit Wear and Tool Life Criteria
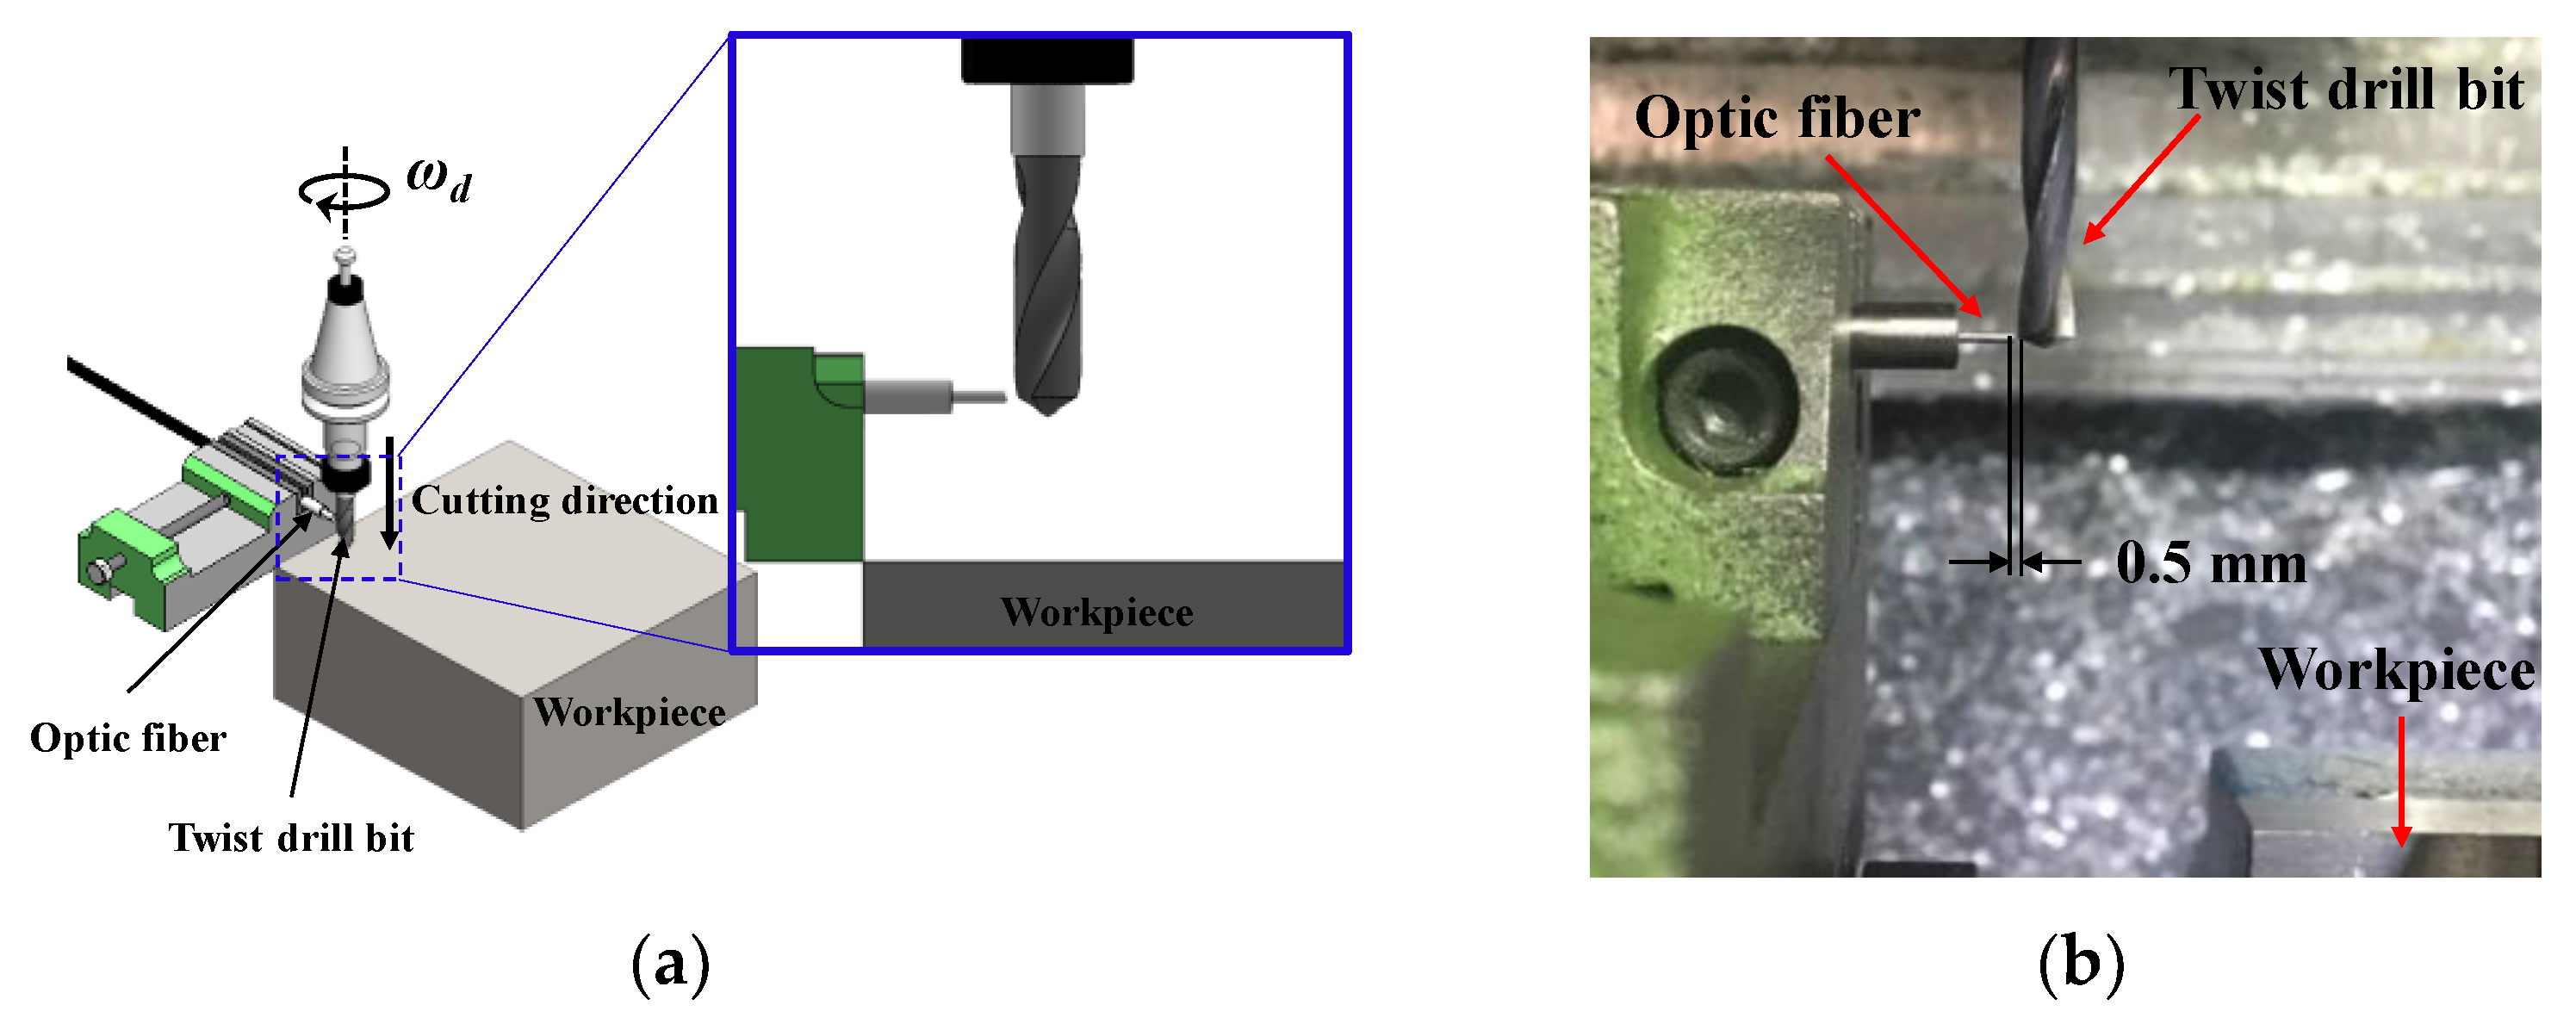
2.2. Working Principle
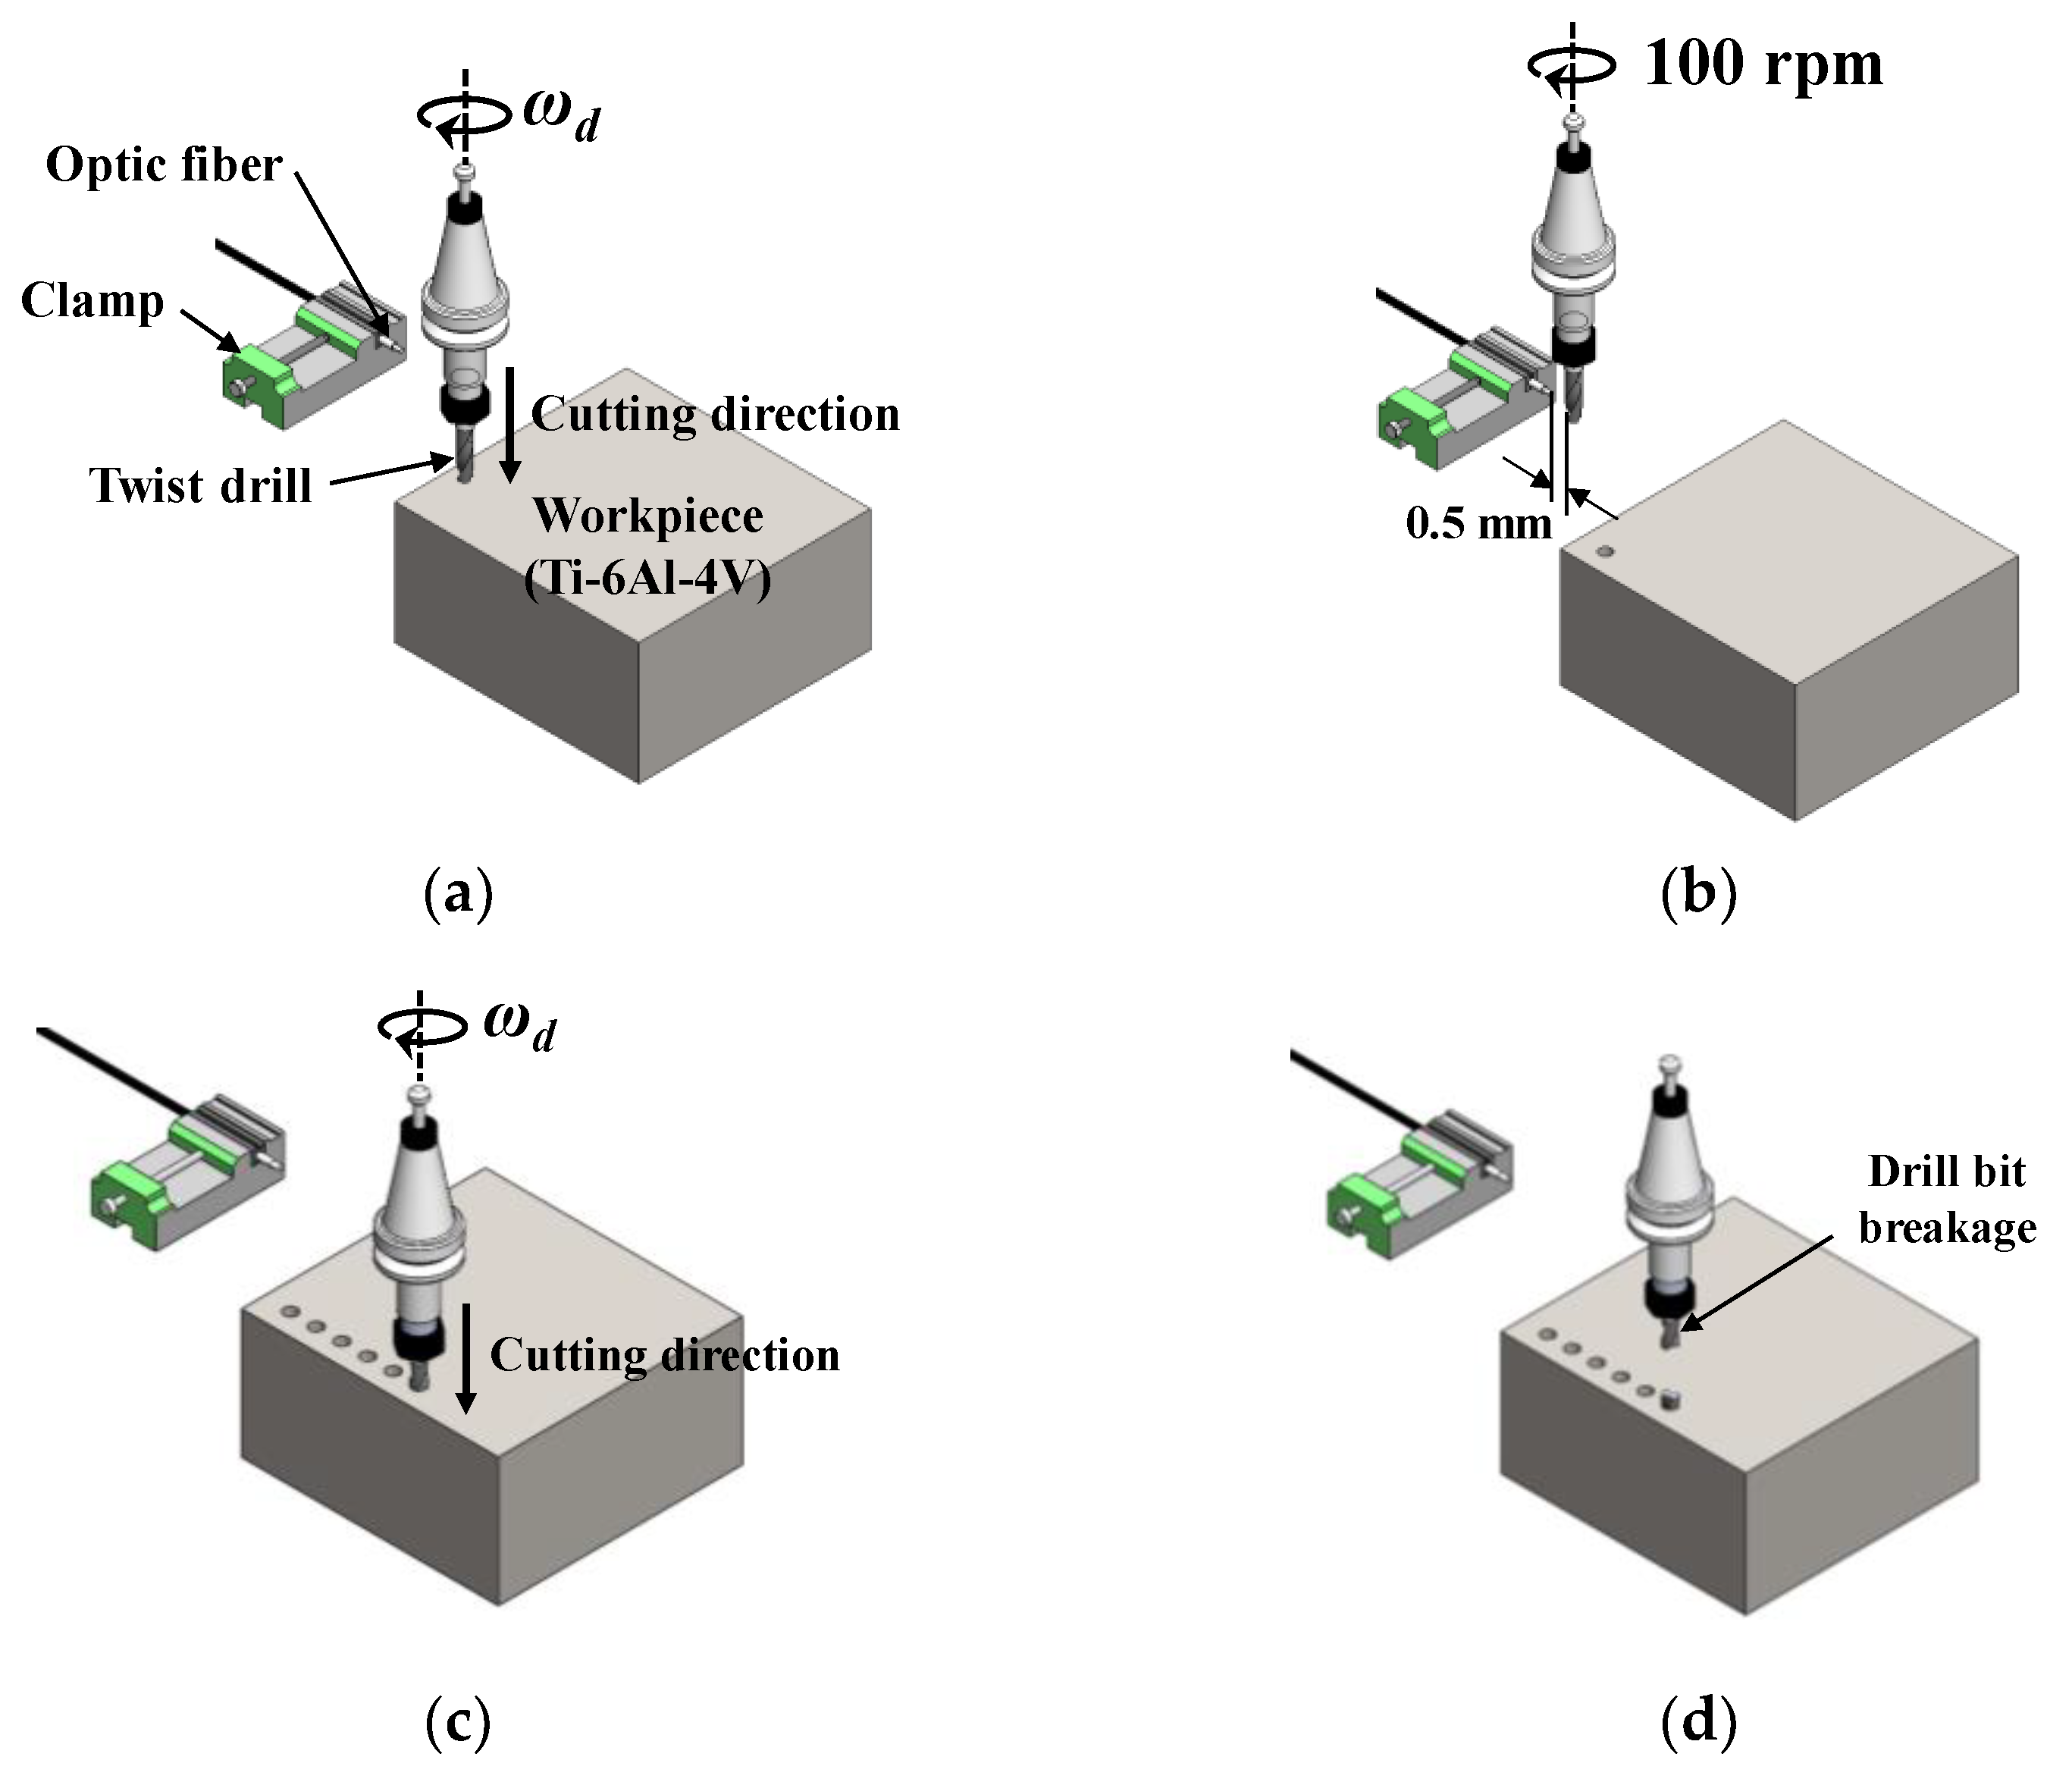
3. Experimental Procedure
3.1. Workpieces and Cutting Tools
3.2. Experimental Setup
4. Experimental Results and Discussion
4.1. Relationship between Surface Roughness and Breakage
4.2. Reflected Infrared Light and Outer Corner Wear
5. Conclusions
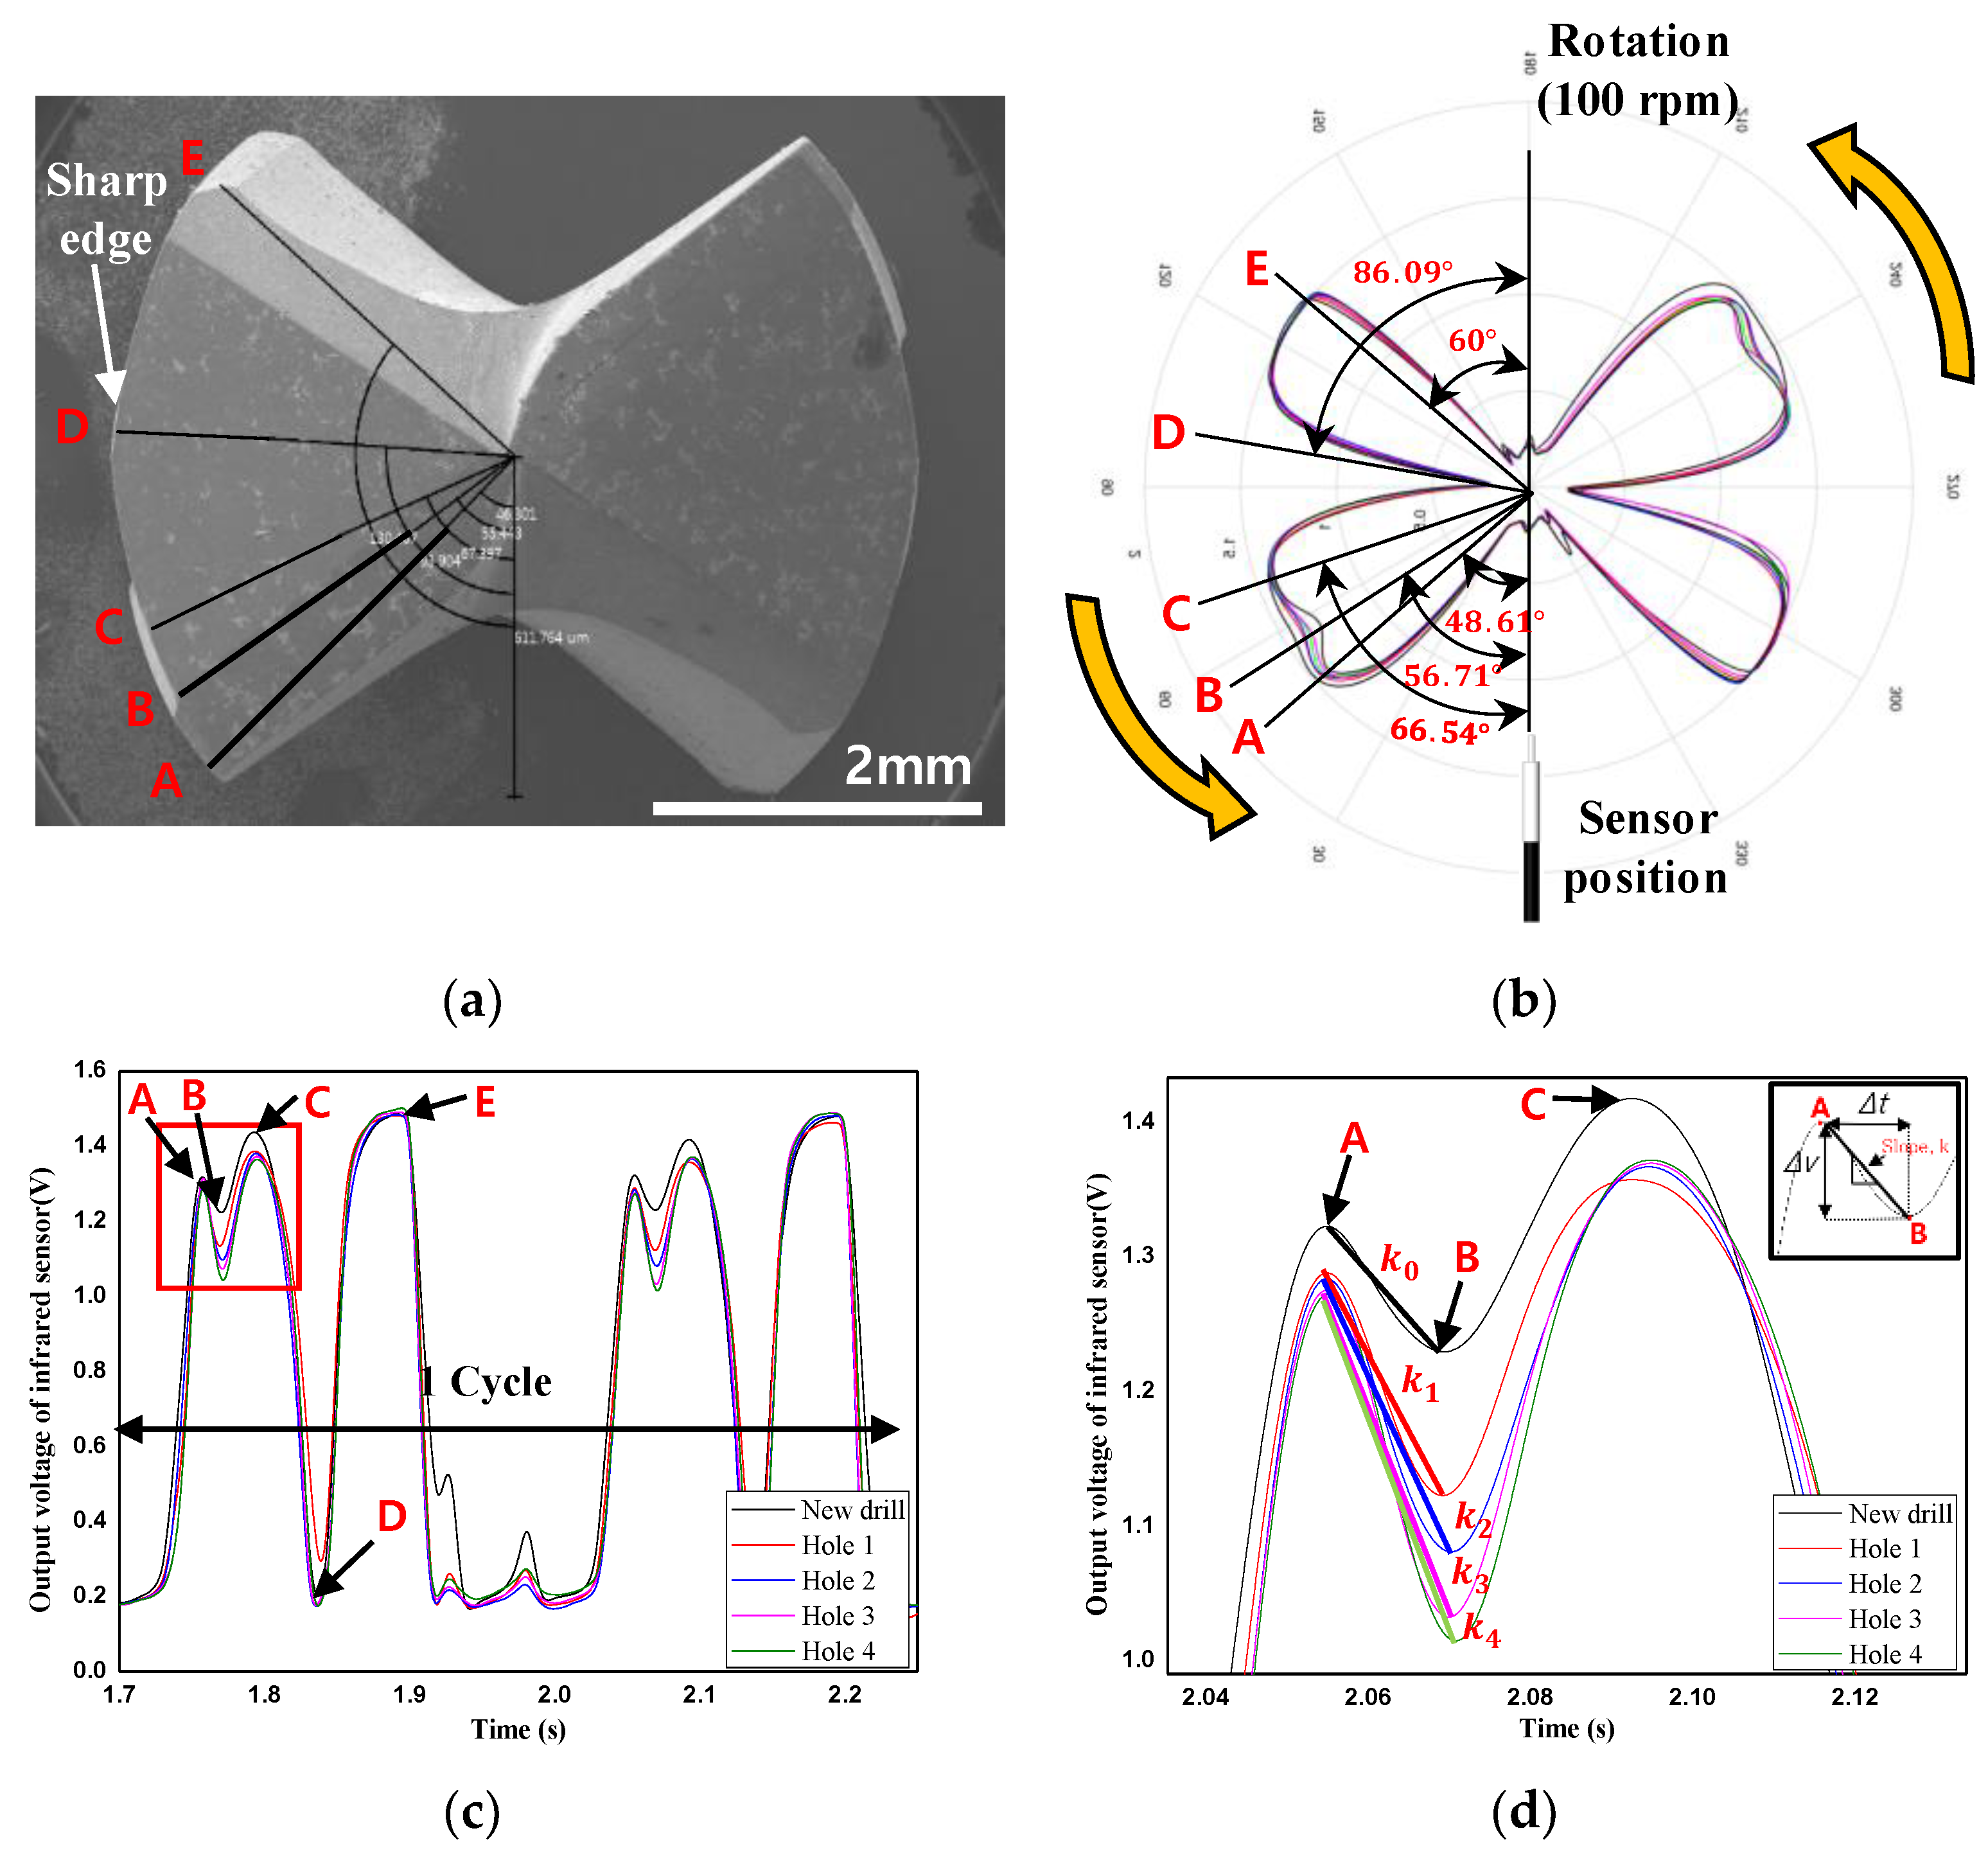
- Drill bit corner wear increases as the number of drilled holes increases. Scanning electron micrographs and three-dimensional surface topography results showed that the shape and surface roughness of the drill bit corners change drastically immediately before the drill bit breaks.
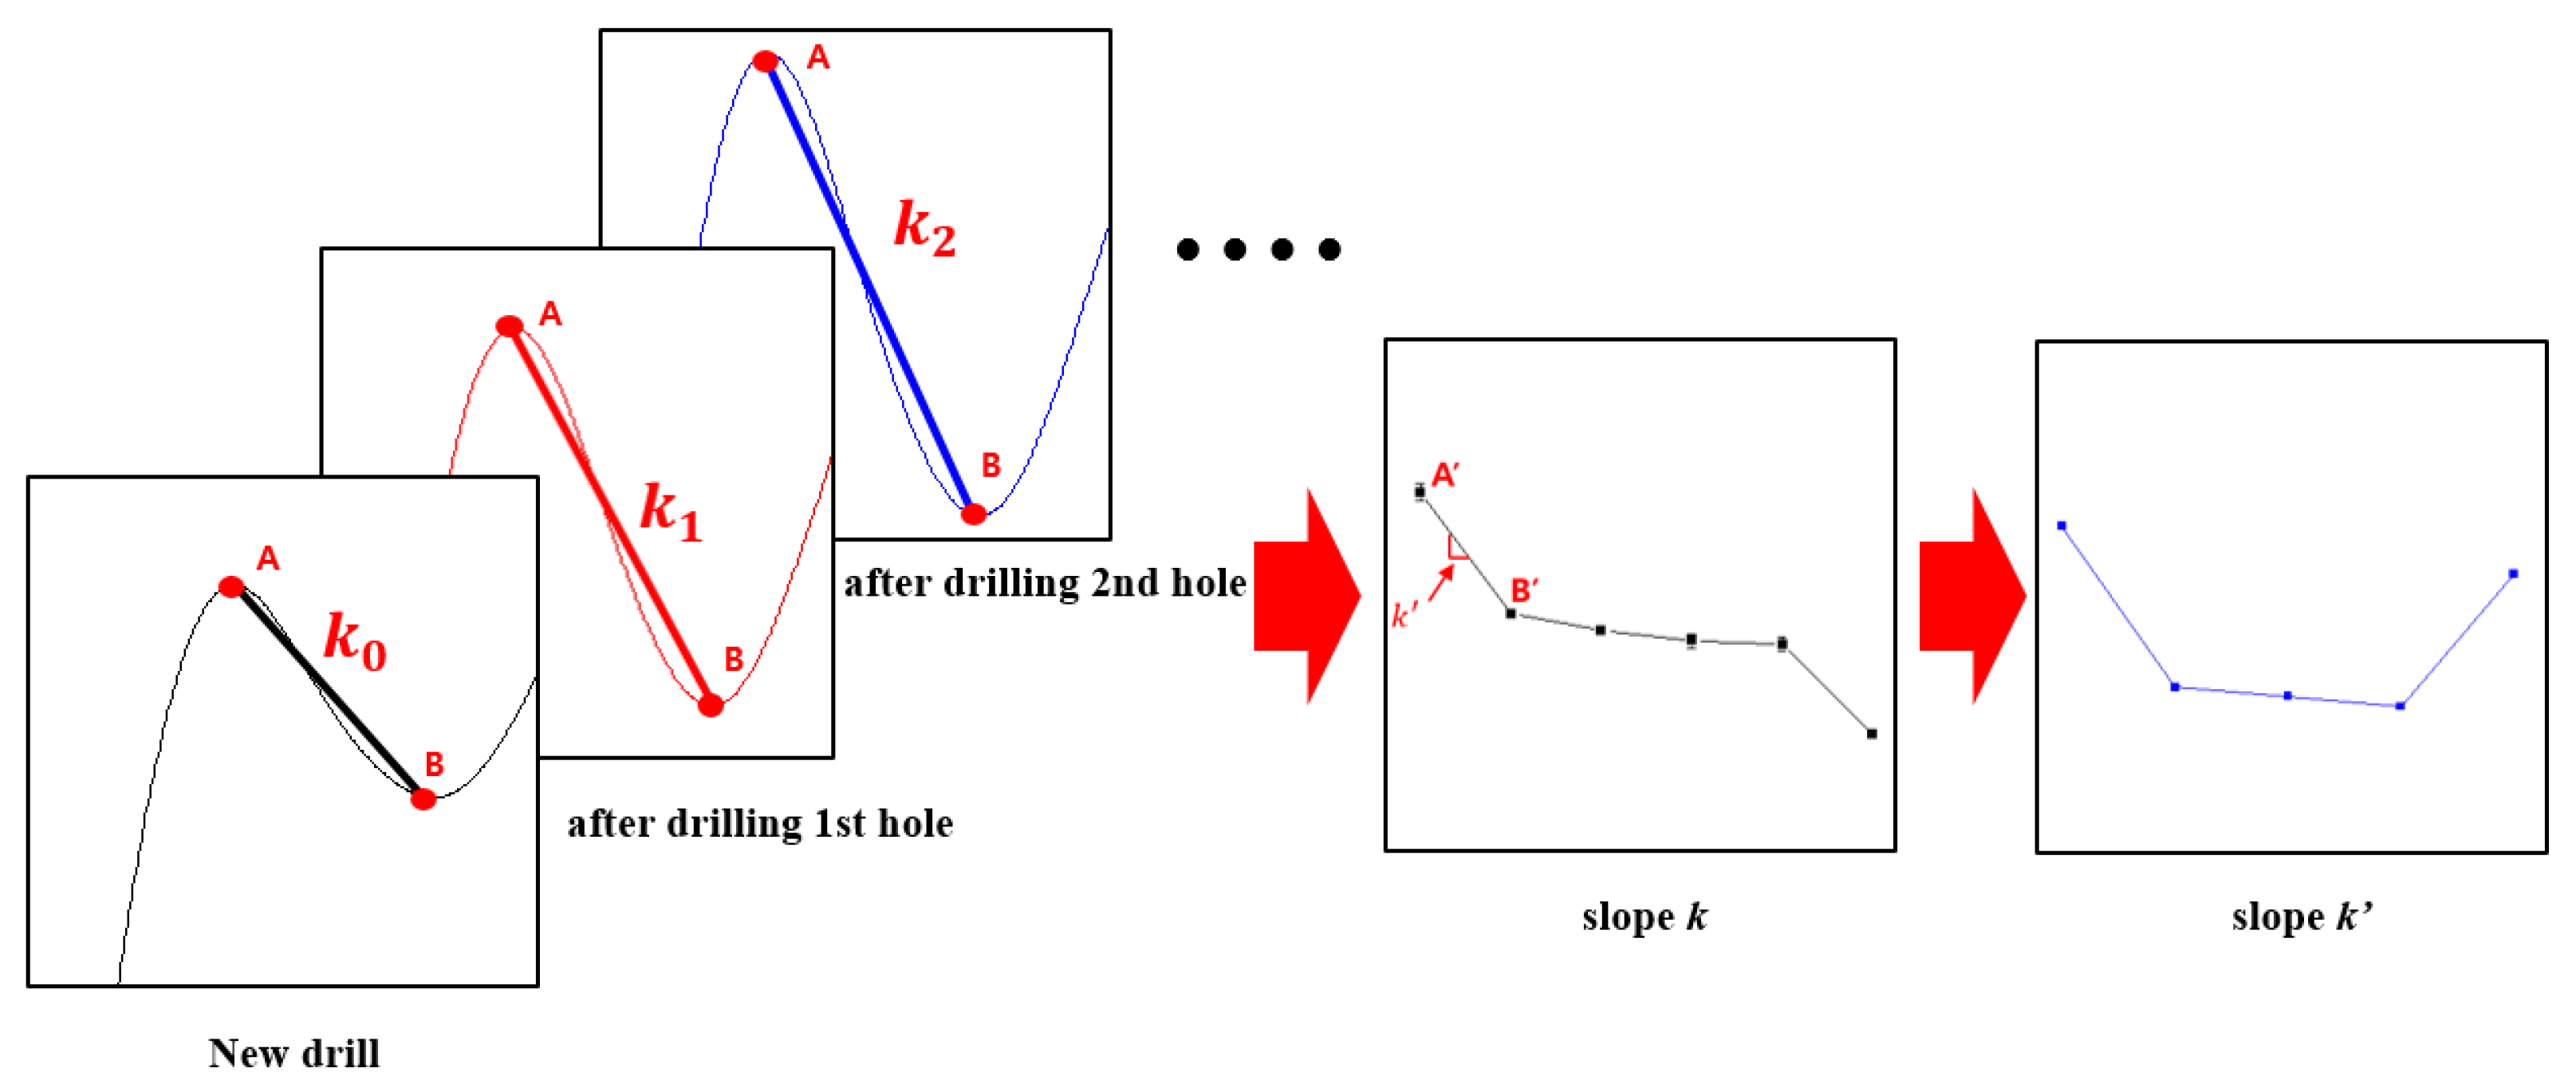
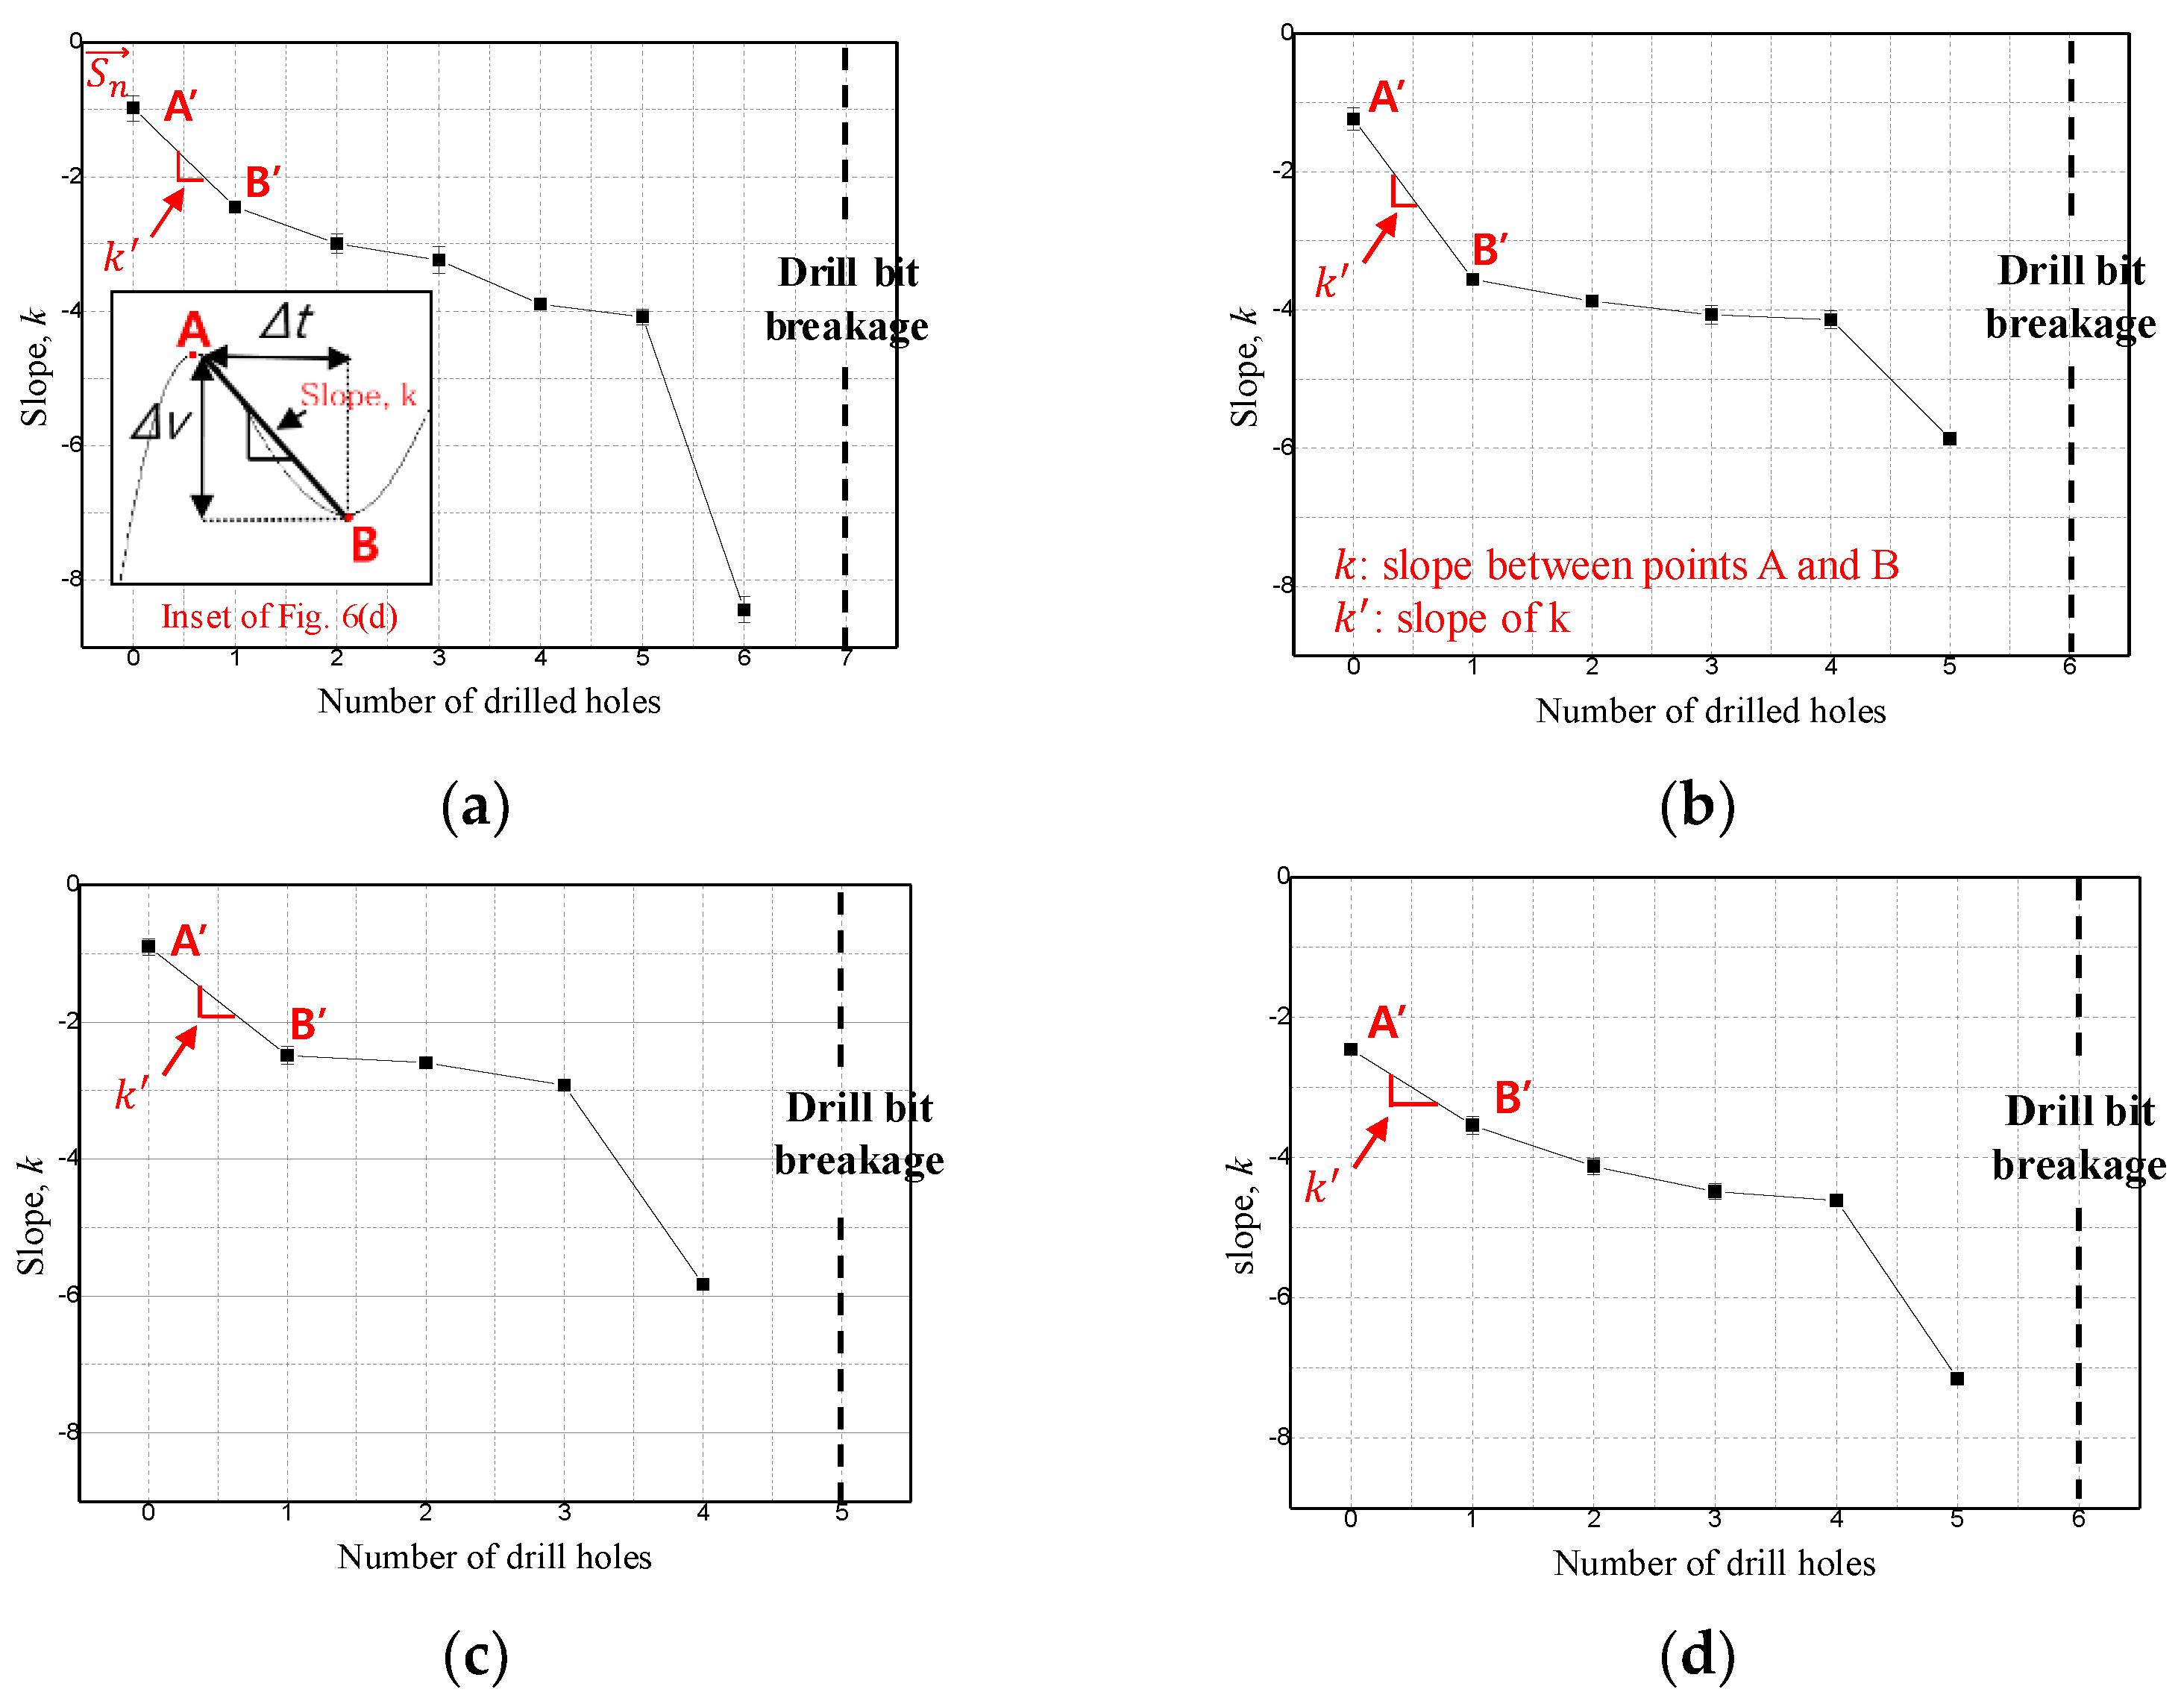
- Changes in drill bit corner shape and surface roughness result in diffuse reflection, causing changes in the light intensity measured by infrared sensors. The change in light intensity is represented by the change in the slope between inflection points A and B of the voltage signal measured by the infrared sensor.
- By converting the time–voltage waveform measured during one rotation of the drill bit to angle–voltage polar coordinates, the position of the two inflection points, A and B, can be expressed as the angle from the fixed infrared sensor position. The position of points A and B were found to be 48.61° and 56.71° sensor, respectively, and were confirmed by scanning electron micrographs. Therefore, the inclination change of points A and B is caused by the change in shape and surface roughness of the drill bit corner as the number of drilled holes increases.
- The experimental results were reviewed through Liu et al. and Wang et al.: Liu et al. studied the correlation where the drilling torque increased as the outer corner increased [26], and Wang et al. confirmed the tendency of increasing the surface roughness of drilled holes and drilling torque as flank wear increased [15]. This is because the cutting edge is not sharp enough to cut the base material due to the wear of the outer corner, so that the frictional force increases, and thus the cutting surface of the tool becomes more and more rough.
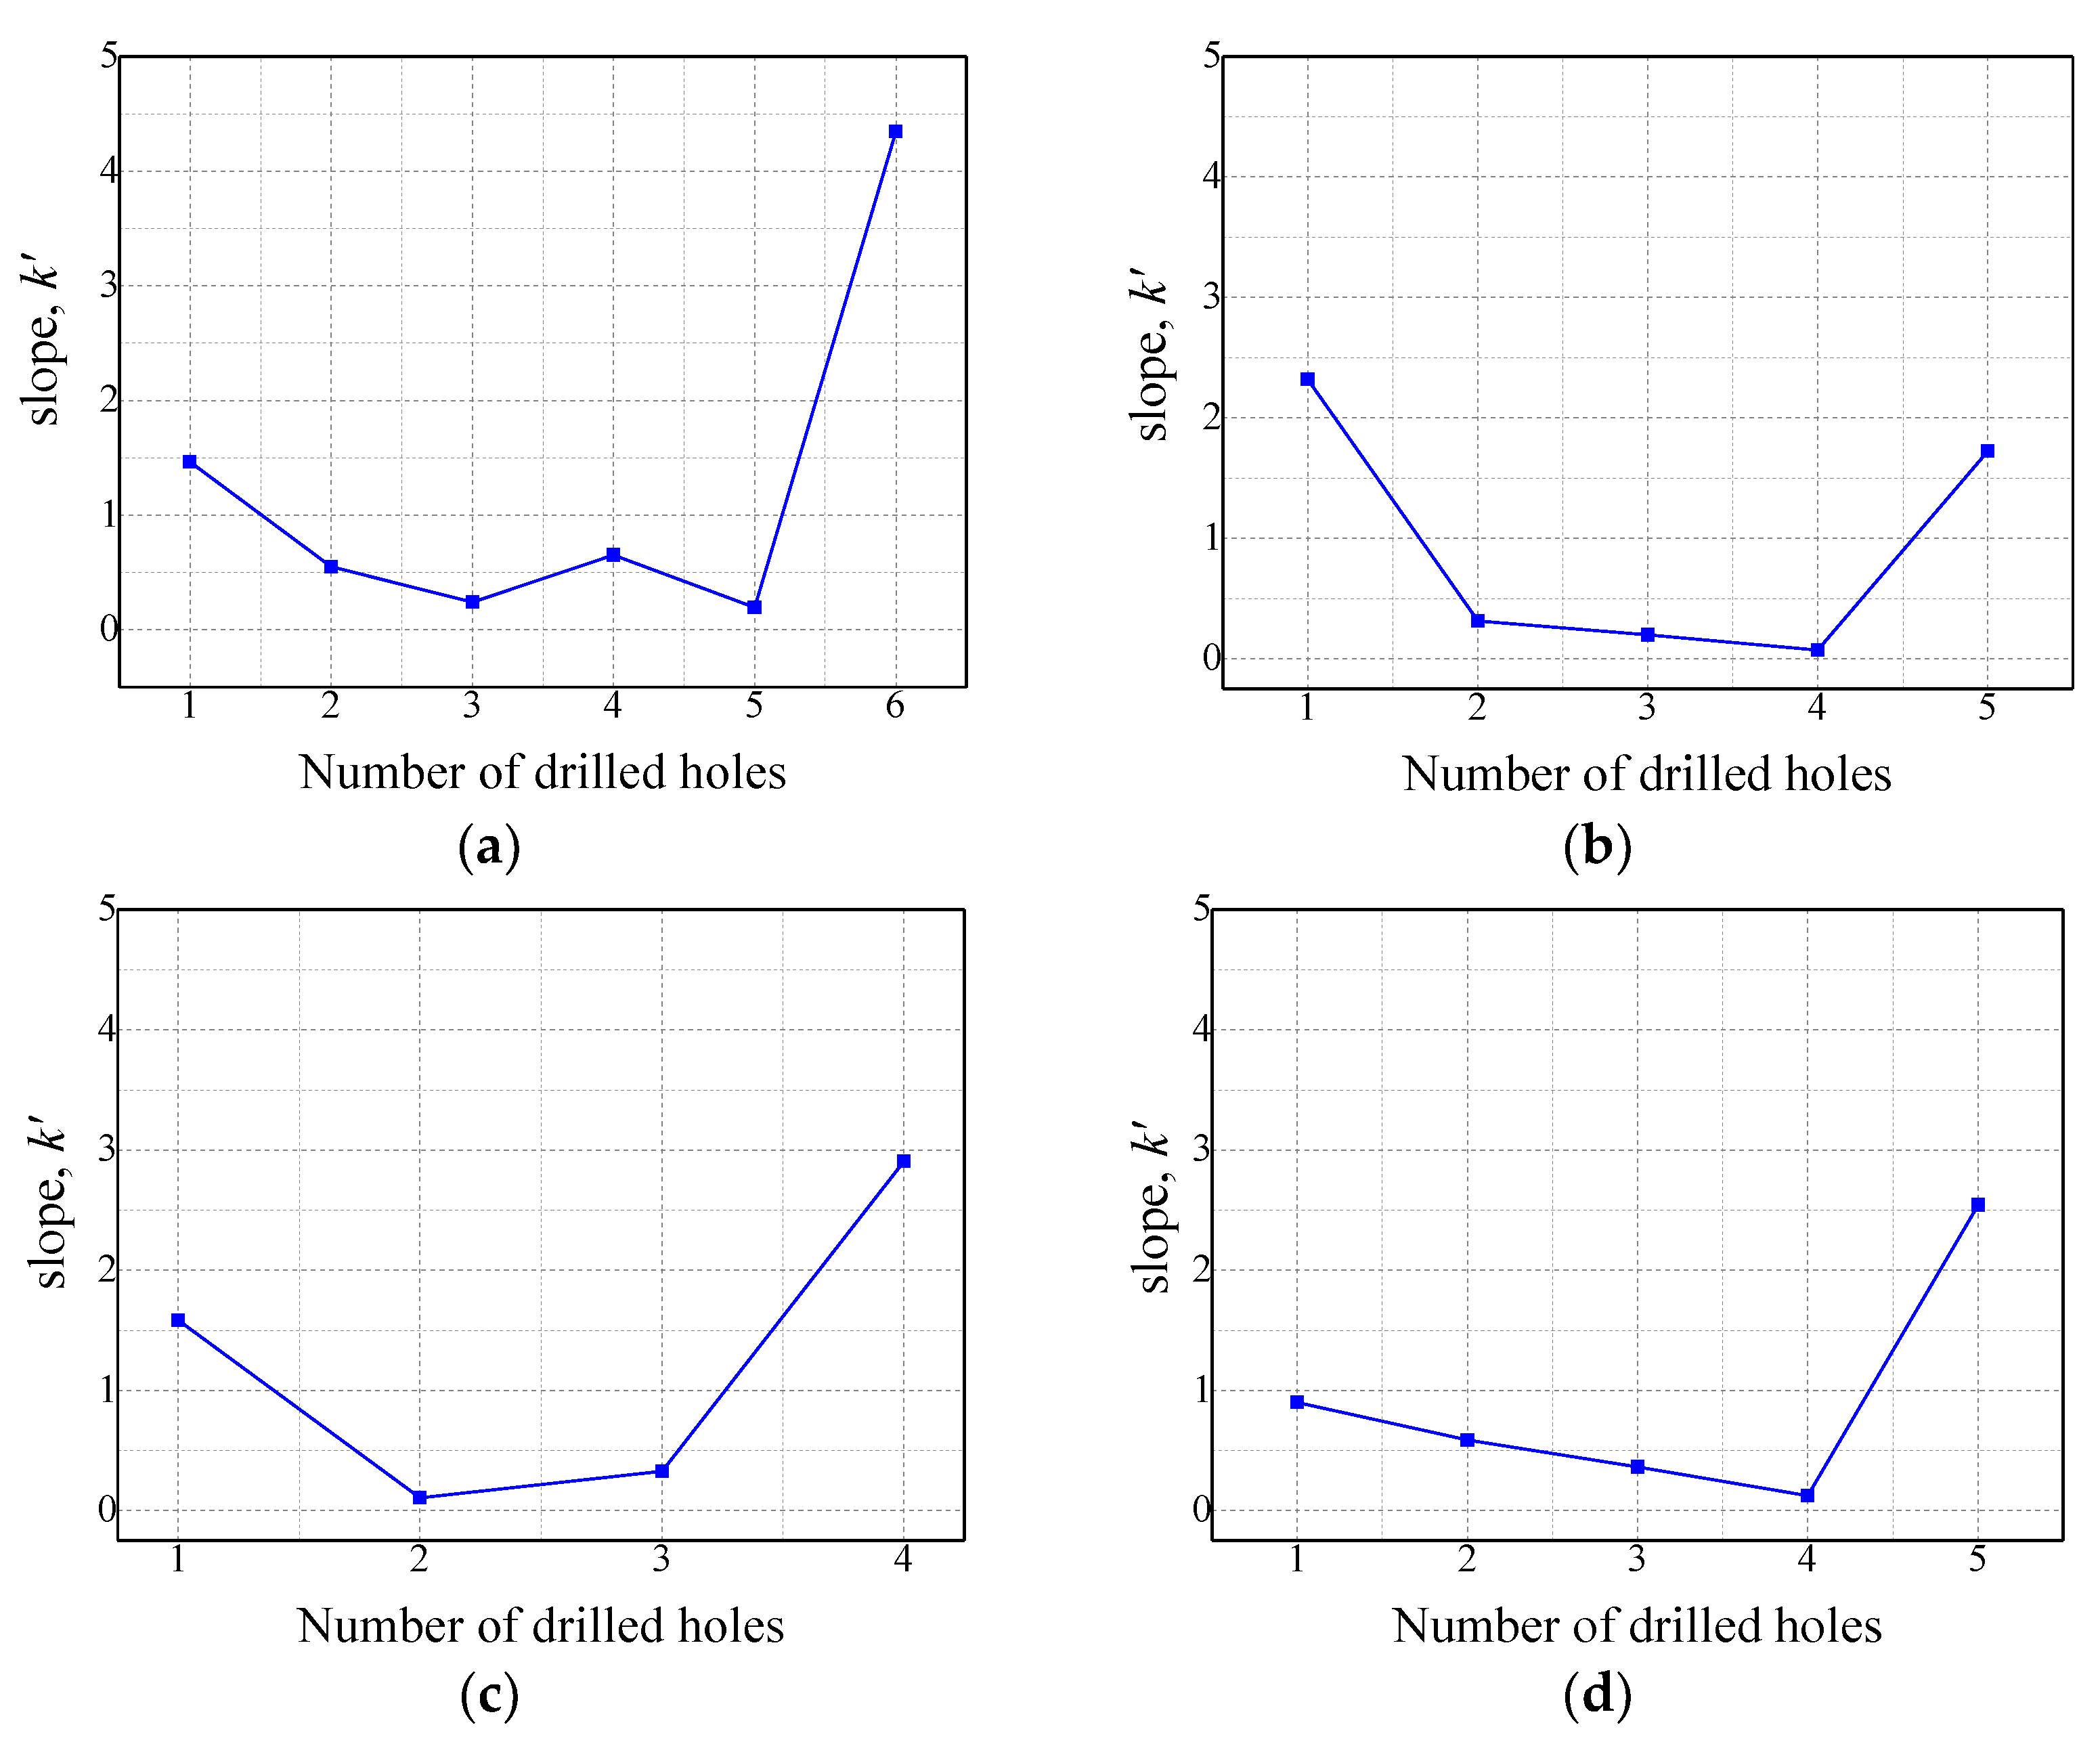
- Arbitrary gradient vectors were defined and the ratio of the x- and -direction components of these vectors was selected as a criterion for predicting the drill failure prediction point. Under each experimental condition, the ratios of the x- and -direction components of the gradient vector were greater than 1, indicating that the slope vector immediately before breakage was inclined by more than 45° in the negative -direction. Therefore, in this paper, the drill failure prediction point was selected as the moment when the ratio of the x- and -direction components of the gradient vector of the nth hole is greater than 1.
- This study proposes a novel measuring device that is easy to install, can be configured at a low cost (infrared sensor price of about US $2), and is resistant to electromagnetic noise and ambient temperature.
- Since the proposed measurement method does not require complex analysis of the measurement signal, it does not require a high-performance analyzer and can reduce analysis time.
6. Patent
Author Contributions
Funding
Institutional Review Board Statement
Informed Consent Statement
Data Availability Statement
Conflicts of Interest
Nomenclature
| VB | Flank wear width (μm) |
| Arbitrary distance between the optical fiber and the drill (mm) | |
| Intensity of the reflected infrared light (V) | |
| Rotation speed to measure outer corner wear (RPM) | |
| Slope between A and B in Figure 8a | |
| Slope of k in Figure 8b | |
| Inclination vector for the nth hole |
References
- Development Project of Advanced Cutting Tools for Machining Difficult-to-Cut-Materials. 2018. Available online: https://www.dbpia.co.kr/journal/articleDetail?nodeId=NODE07059427 (accessed on 3 November 2016).
- Son, G.H.; Kim, M.R.; Lee, S.J.; Jeong, J.H.; Lew, K.H.; Lee, D.W. A Investigation into tool state monitoring by sensing changes according to groove. Korean Soc. Manuf. Process. Eng. 2017, 16, 31–39. [Google Scholar] [CrossRef]
- Cuka, B.; Kim, D.W. Fuzzy logic based tool condition monitoring for end-miling. Robot Comput-Integr. Manuf. 2017, 47, 22–36. [Google Scholar] [CrossRef]
- Lotfi, M.M.J.; Akhavan Farid, A. Wear estimation of ceramic and coated carbide tools in turning of Inconel 625: 3D FE analysis. Tribol. Int. 2016, 99, 107–116. [Google Scholar] [CrossRef]
- Binder, M.; Klocke, F.; Lung, D. Tool wear simulation of complex shaped coated cutting tools. Wear 2015, 330, 600–607. [Google Scholar] [CrossRef]
- Altintas, Y. Manufacturing Automation, 2nd ed.; Cambridge University Press: Cambridge, UK, 2012; pp. 149–172. [Google Scholar]
- Dimla, D.E., Sr.; Lister, P.M. On-line metal cutting tool condition monitoring. I: Force and vibration analyses. Int. J. Mach. Tools Manuf. 2000, 40, 739–768. [Google Scholar] [CrossRef]
- Li, X. A brief review: Acoustic emission method for tool wear monitoring during turning. Int. J. Mach. Tools Manuf. 2002, 42, 157–165. [Google Scholar] [CrossRef] [Green Version]
- Alonso, F.J.; Salgado, D.R. Analysis of the structure of vibration signals for tool wear detection. Mech. Syst. Signal Process. 2008, 22, 735–748. [Google Scholar] [CrossRef]
- Rao, K.V.; Murthy, B.S.N.; Rao, N.M. Prediction of cutting tool wear, surface roughness and vibration of work piece in boring of AISI 316 steel with artificial neural network. Measurement 2014, 51, 63–70. [Google Scholar]
- Salgado, D.R.; Alonso, F.J. An approach based on current and sound signals for in-process tool wear monitoring. Int. J. Mach. Tools Manuf. 2007, 47, 2140–2152. [Google Scholar] [CrossRef]
- Al-Sulaiman, F.A.; Baseer, M.A.; Sheikh, A.K. Use of electrical power for online monitoring of tool condition. J. Mater. Process. Technol. 2005, 166, 364–371. [Google Scholar] [CrossRef]
- Kulkarni, A.P.; Joshi, G.G.; Karekar, A.; Sargade, V.G. Investigation on cutting temperature and cutting force in turning AISI 304 austenitic stainless steel using AlTiCrN coated carbide insert. Int. J. Mach. Mach. Mater. 2 2014, 15, 147–156. [Google Scholar] [CrossRef]
- Abouelatta, O.B.; Madl, J. Surface roughness prediction based on cutting parameter and tool vibration in turning operation. J. Mater. Process. Technol. 2001, 118, 269–277. [Google Scholar] [CrossRef]
- Wang, F.; Qian, B.; Jia, Z.; Cheng, D.; Fu, R. Effects of cooling position on tool wear reduction of secondary cutting edge corner of one-shot drill bit in drilling CFRP. Int. J. Adv. Manuf. Technol. 2018, 94, 4277–4287. [Google Scholar] [CrossRef]
- Kuntoğlu, M.; Sağlam, H. Investigation of signal behaviors for sensor fusion with tool condition monitoring system in turning. Measurement 2021, 173, 108582. [Google Scholar] [CrossRef]
- Mohanraj, T.; Yerchuru, J.; Krishnan, H.; Aravind, R.N.; Yameni, R. Development of tool condition monitoring system in end milling process using wavelet features and Hoelder’s exponent with machine learning algorithms. Measurement 2021, 173, 108671. [Google Scholar] [CrossRef]
- Dahe, S.V.; Manikandan, G.S.; Jegadeeshwaran, R.; Sakthivel, G.; Lakshmipathi, J. Tool condition monitoring using Random forest and FURIA through statistical learning. Mater. Today Proc. 2021. [Google Scholar] [CrossRef]
- Jaini, S.N.B.; Lee, D.; Lee, S.; Kim, M.; Kwon, Y. Tool monitoring of end milling based on gap sensor and machine learning. J. Ambient Intell. Humaniz. Comput. 2021, 1–13. [Google Scholar] [CrossRef]
- Zhang, X.Y.; Lu, X.; Li, W.D.; Wang, S. CNN-LSTM enabled prediction of remaining useful life of cutting tool. Data Driven Smart Manuf. Technol. Appl. 2021, 91–123. [Google Scholar] [CrossRef]
- Nitin, A.; Dinesh, K.; Satish, C.; Vishal, W. Tool condition monitoring system: A review. Mater. Today Proc. 2015, 2, 3419–3428. [Google Scholar]
- Aliustaoglu, C.; Ertunc, H.H.; Hasan, O. Tool wear condition monitoring using a sensor fusion model based on fuzzy inference system. Mech. Syst. Signal Process. 2009, 23, 539–546. [Google Scholar] [CrossRef]
- Lee, D.Y.; Song, K.H. The state of the art in monitoring technology of machining oprertions. J. Korean Soc. Precis. Eng. 2018, 35, 293–304. [Google Scholar]
- Gaurav, B.; Choudhury, S.K. Effect of cutting parameters on cutting force and surface roughness during finish hard turning AISI52100 grade steel. Procedia CIrP 2012, 1, 651–656. [Google Scholar]
- Brahim, F.; Yallese, M.A. Cutting forces and surface roughness in hard turning of hot work steel X38CrMoV5-1 using mixed ceramic. Mechanics 2008, 70, 73–78. [Google Scholar]
- Liu, H.S.; Lee, B.Y.; Tarng, Y.S. In-process prediction of corner wear in drilling operations. J. Mater. Process. Technol. 2000, 101, 152–158. [Google Scholar] [CrossRef]
- Vlasveld, A.C.; Harris, S.G.; Doyle, E.D.; Lewis, D.B.; Munz, W.D. Characterisation and performance of partially filtered arc TiAlN coatings. Surf. Coatings Technol. 2002, 149, 217–223. [Google Scholar] [CrossRef]


| Coating Material | TiAlN |
|---|---|
| Diameter | 5 mm |
| Point angle | 140° |
| Helix angle | 15° |
| Total length | 72 mm |
| Shank diameter | 6 mm |
| Shank length | 40 mm |
| Tensile strength | 974 MPa |
| Elongation | 8% |
| Reduction of area | 20% |
| Model | TSAL4400(Emitter) | SFH309FA(Detector) |
|---|---|---|
| Spectral range | 840~1030 nm | 730~1120 nm |
| Peak wavelength | 940 nm | 900 nm |
| Viewing angle | 25° | 12° |
| Number | Workpiece | Drill Diameter | Cutting Speed | Feed Rate | Hole Depth |
|---|---|---|---|---|---|
| 1 | Ti6Al4V | ∅ 5 | 23.6 m/min | 0.133 mm/rev | 20 mm |
| 2 | 31.4 m/min | 0.125 mm/rev | 20 mm | ||
| 3 | 31.4 m/min | 0.1 mm/rev | 20 mm | ||
| 4 | 39.3 m/min | 0.1 mm/rev | 15 mm |
| Experimental Condition | Number of Drilled Holes | |||||||
|---|---|---|---|---|---|---|---|---|
| 0 | 1 | 2 | 3 | 4 | 5 | 6 | 7 | |
| Experimental condition 1 |  | 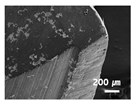 |  | 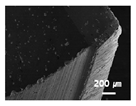 | 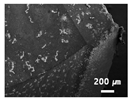 |  | 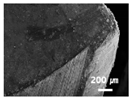 | × (drill bit breakage) |
| Experimental condition 2 | 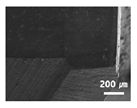 | 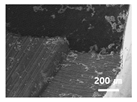 | 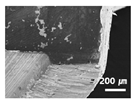 |  |  |  | × (drill bit breakage) | |
| Experimental condition 3 |  |  | 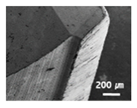 | 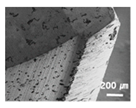 | 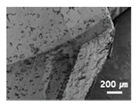 | × (drill bit breakage) | ||
| Experimental condition 4 | 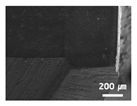 |  | 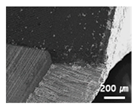 | 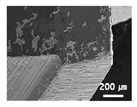 | 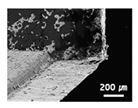 | 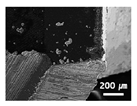 | × (drill bit breakage) | |
Publisher’s Note: MDPI stays neutral with regard to jurisdictional claims in published maps and institutional affiliations. |
© 2021 by the authors. Licensee MDPI, Basel, Switzerland. This article is an open access article distributed under the terms and conditions of the Creative Commons Attribution (CC BY) license (https://creativecommons.org/licenses/by/4.0/).
Share and Cite
Jeong, M.-J.; Lee, S.-W.; Jang, W.-K.; Kim, H.-J.; Seo, Y.-H.; Kim, B.-H. Prediction of Drill Bit Breakage Using an Infrared Sensor. Sensors 2021, 21, 2808. https://doi.org/10.3390/s21082808
Jeong M-J, Lee S-W, Jang W-K, Kim H-J, Seo Y-H, Kim B-H. Prediction of Drill Bit Breakage Using an Infrared Sensor. Sensors. 2021; 21(8):2808. https://doi.org/10.3390/s21082808
Chicago/Turabian StyleJeong, Min-Jae, Sang-Woo Lee, Woong-Ki Jang, Hyung-Jin Kim, Young-Ho Seo, and Byeong-Hee Kim. 2021. "Prediction of Drill Bit Breakage Using an Infrared Sensor" Sensors 21, no. 8: 2808. https://doi.org/10.3390/s21082808