
Ventilation Diagnosis of Angle Grinder Using Thermal Imaging


Abstract
:1. Introduction
2. Theoretical Background
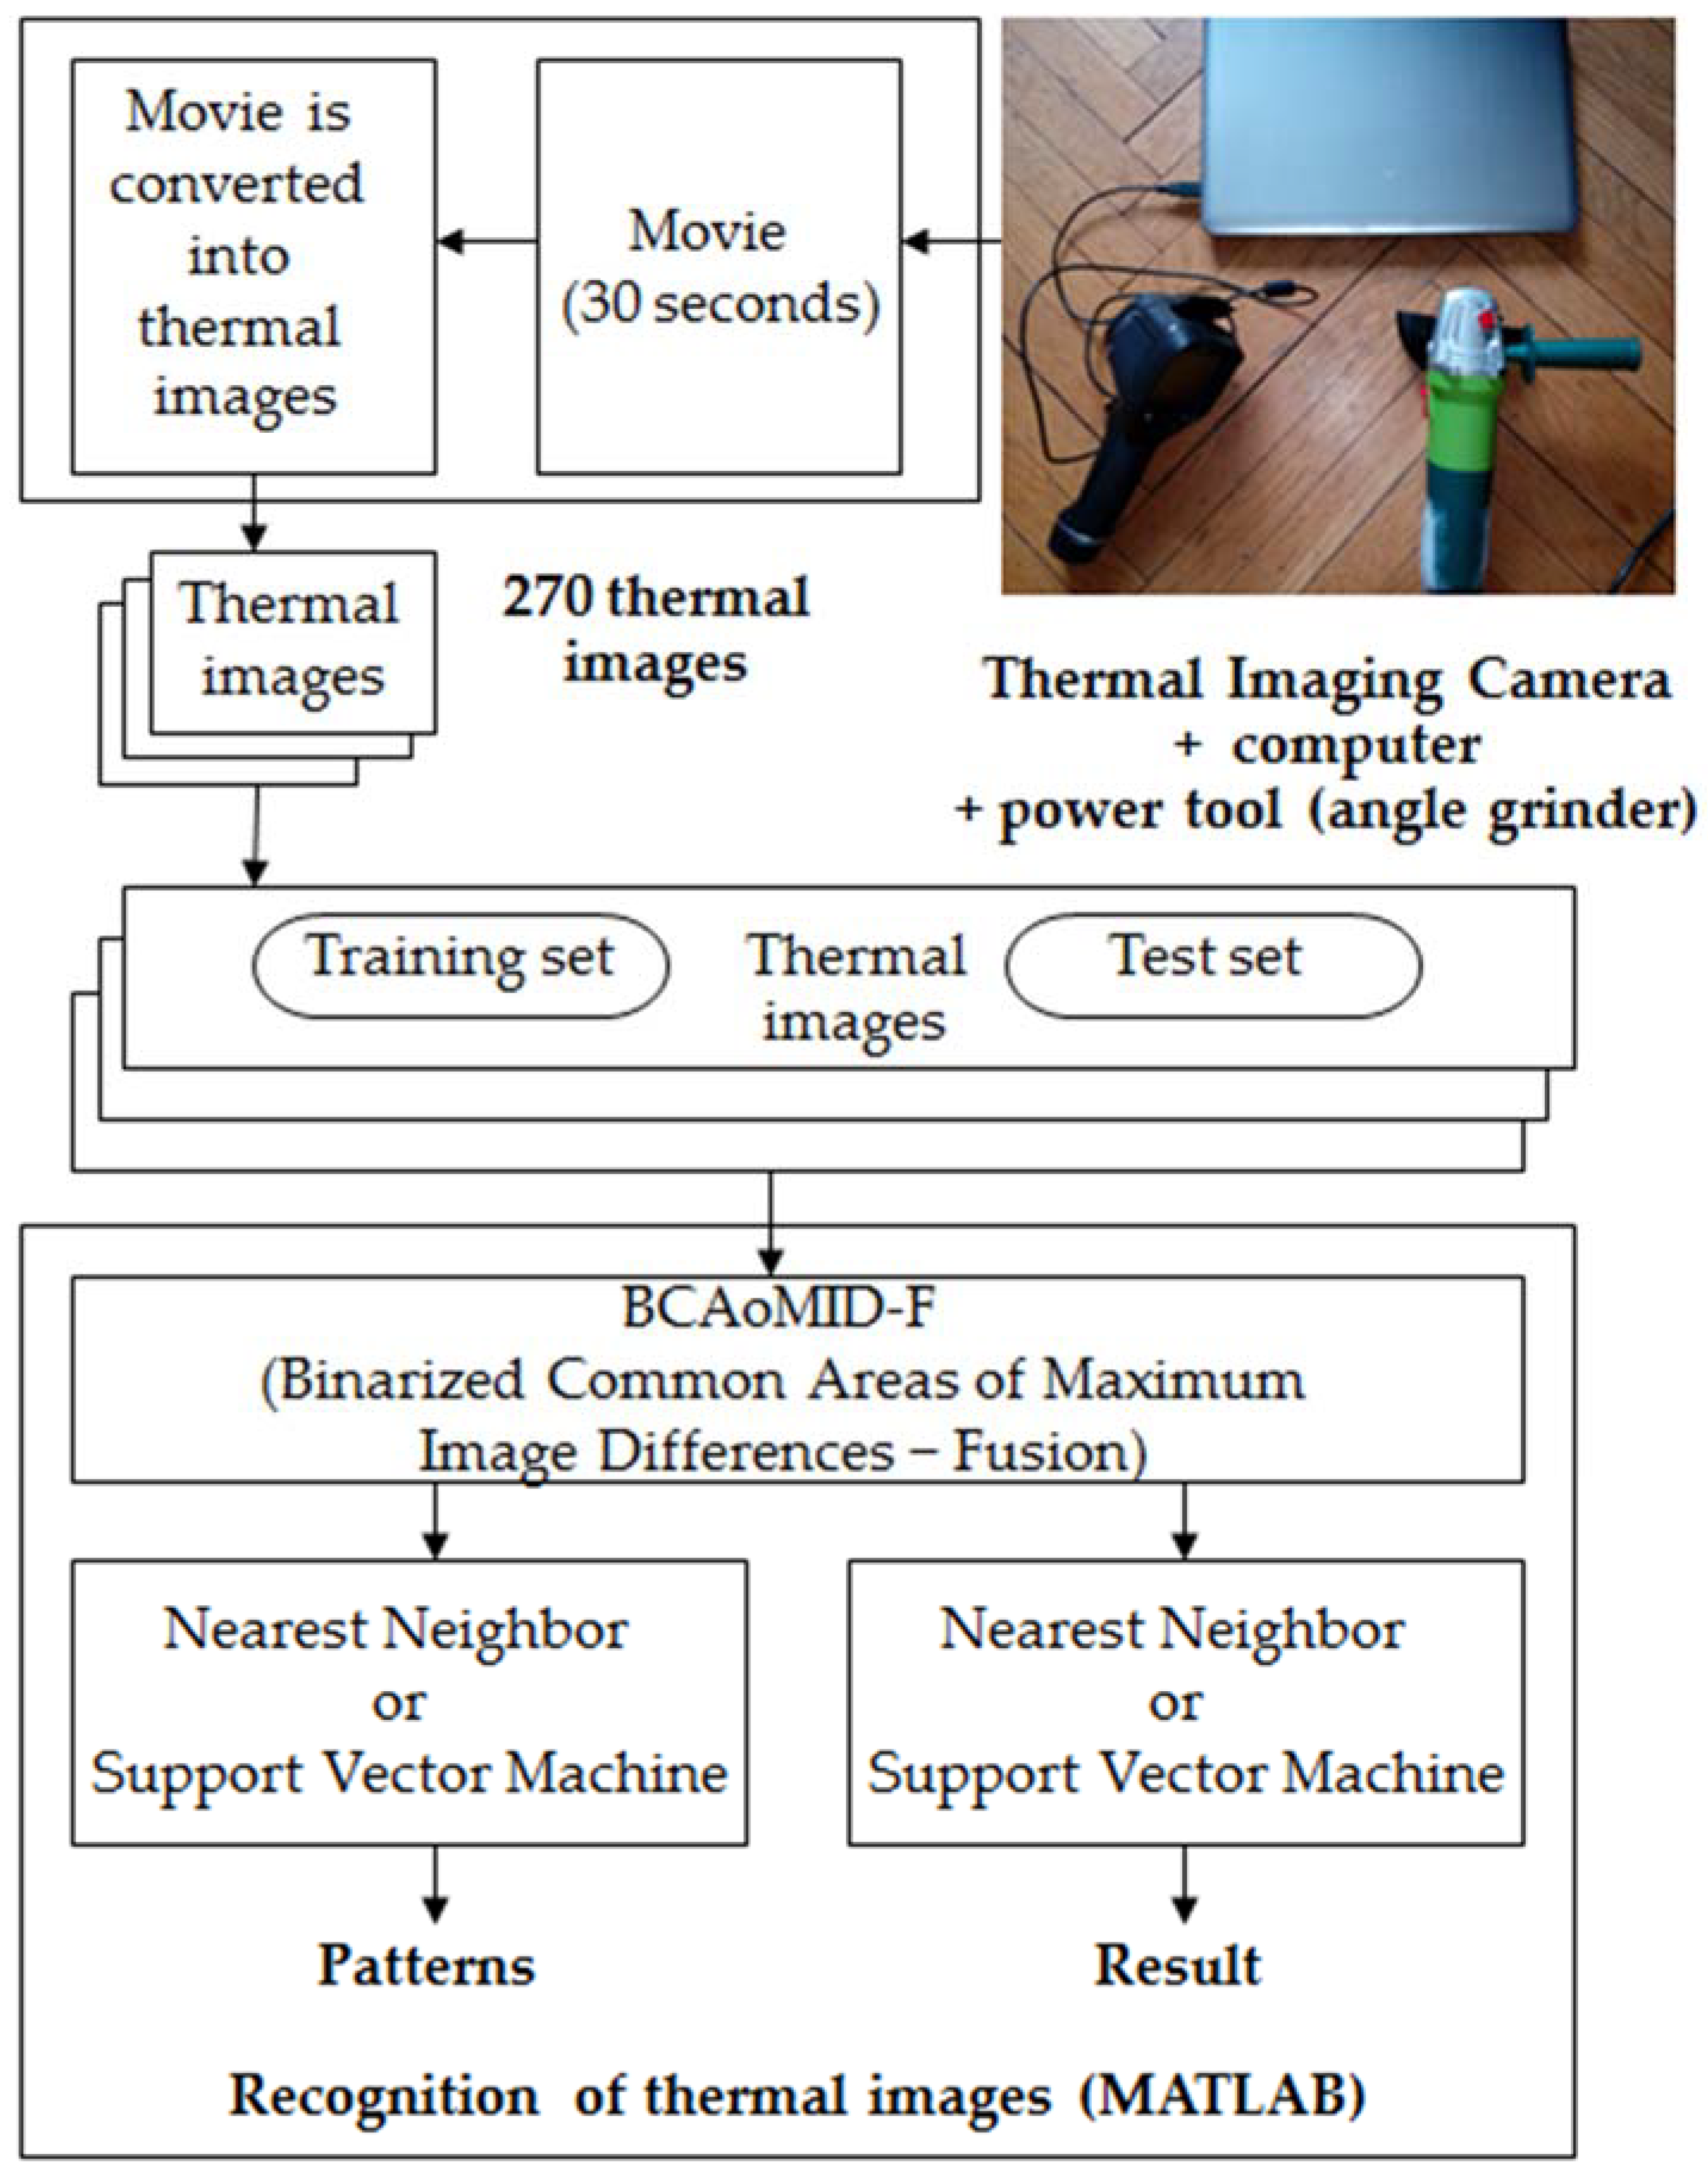
3. Processing and Recognition of the Thermal Image
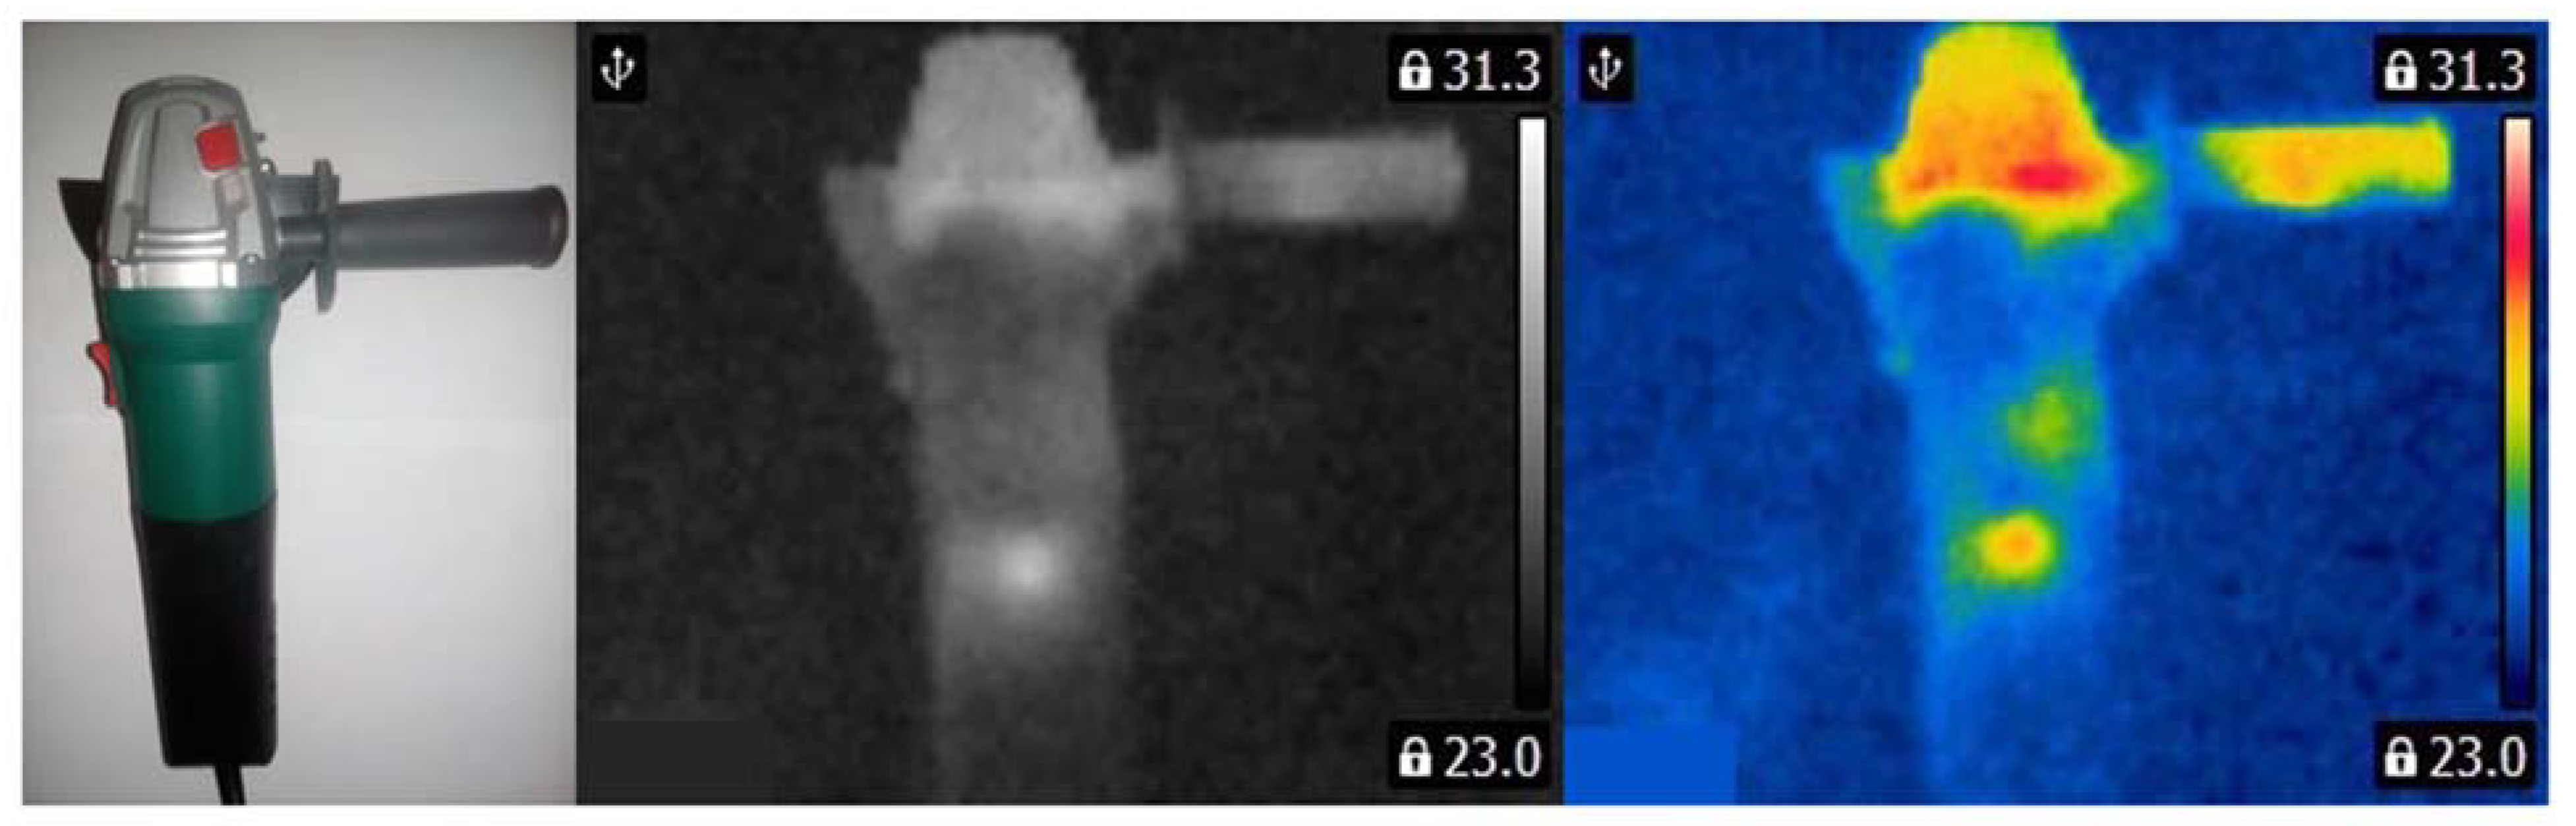
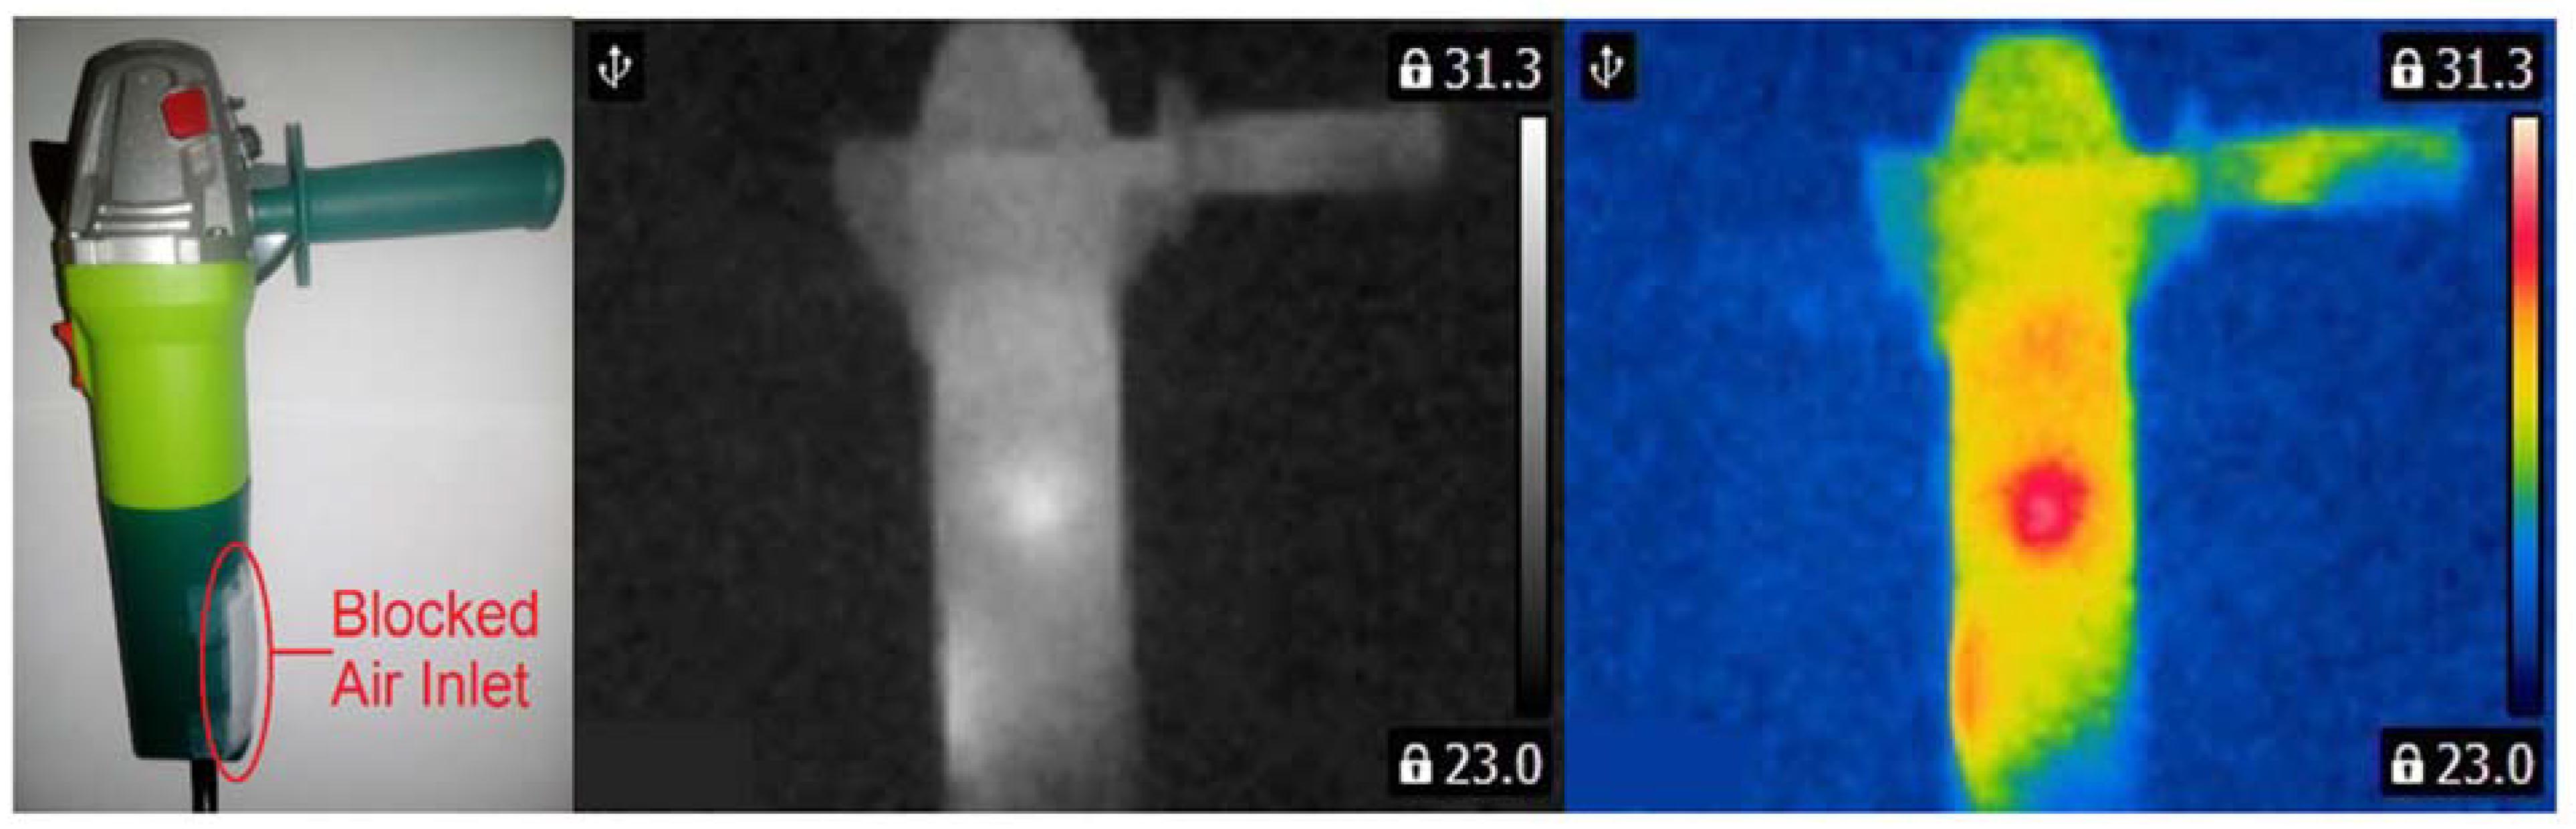
4. Analyzed States of the Angle Grinder
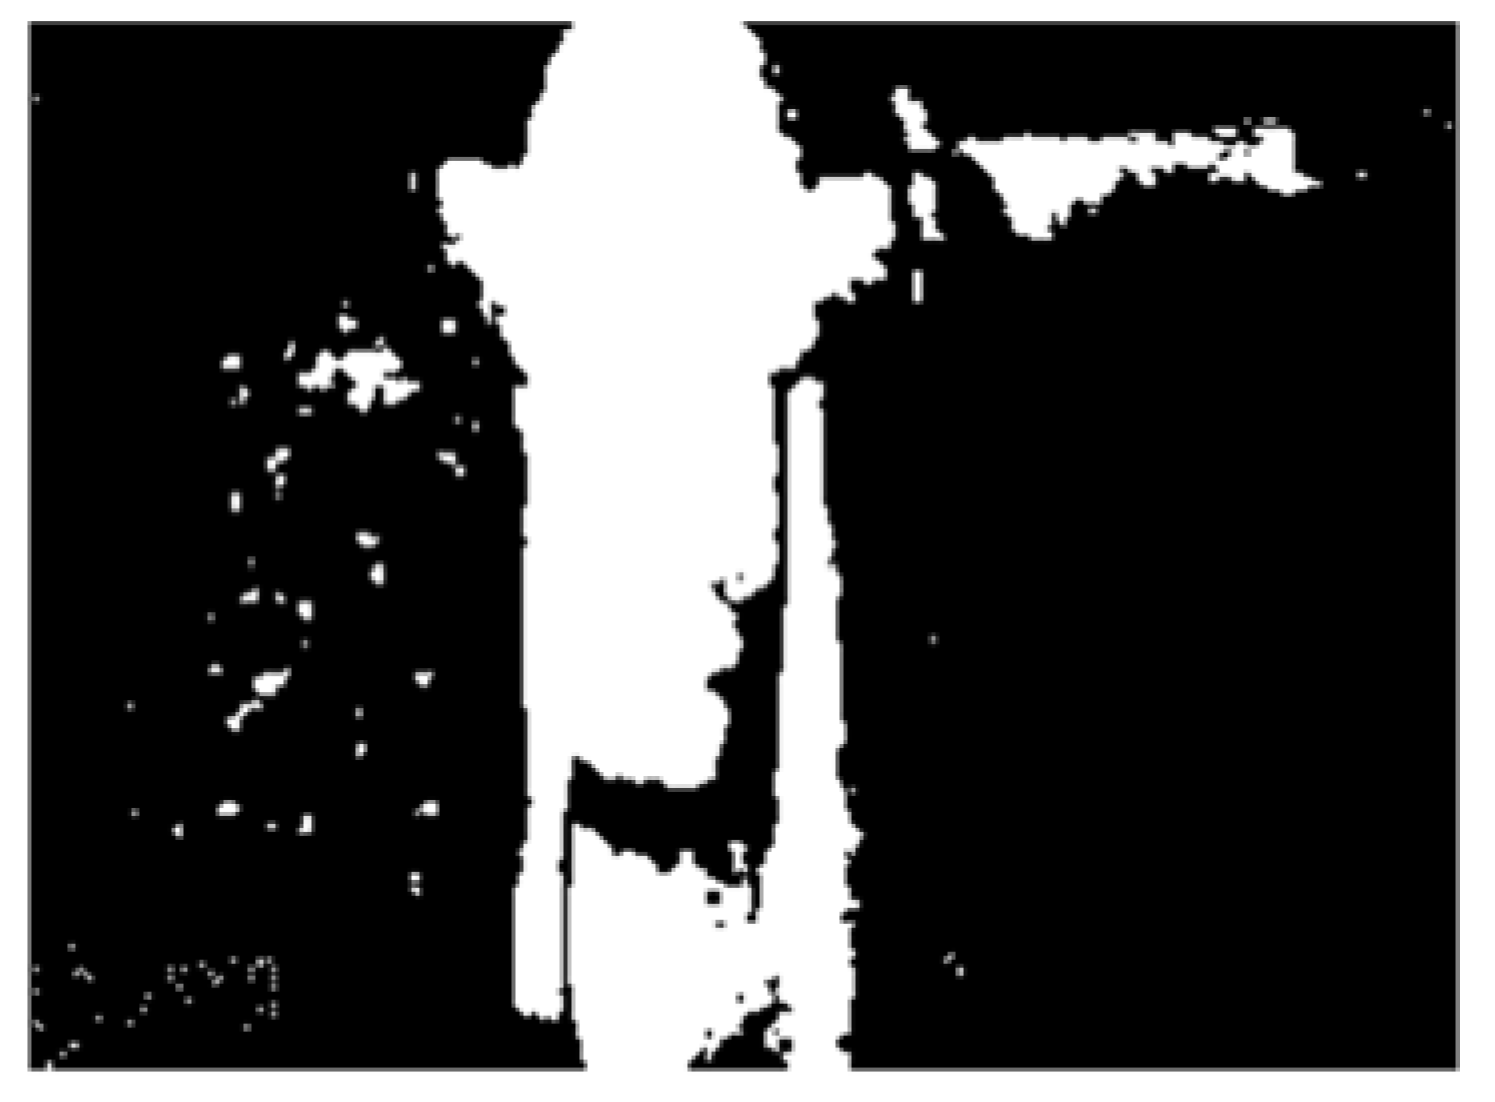
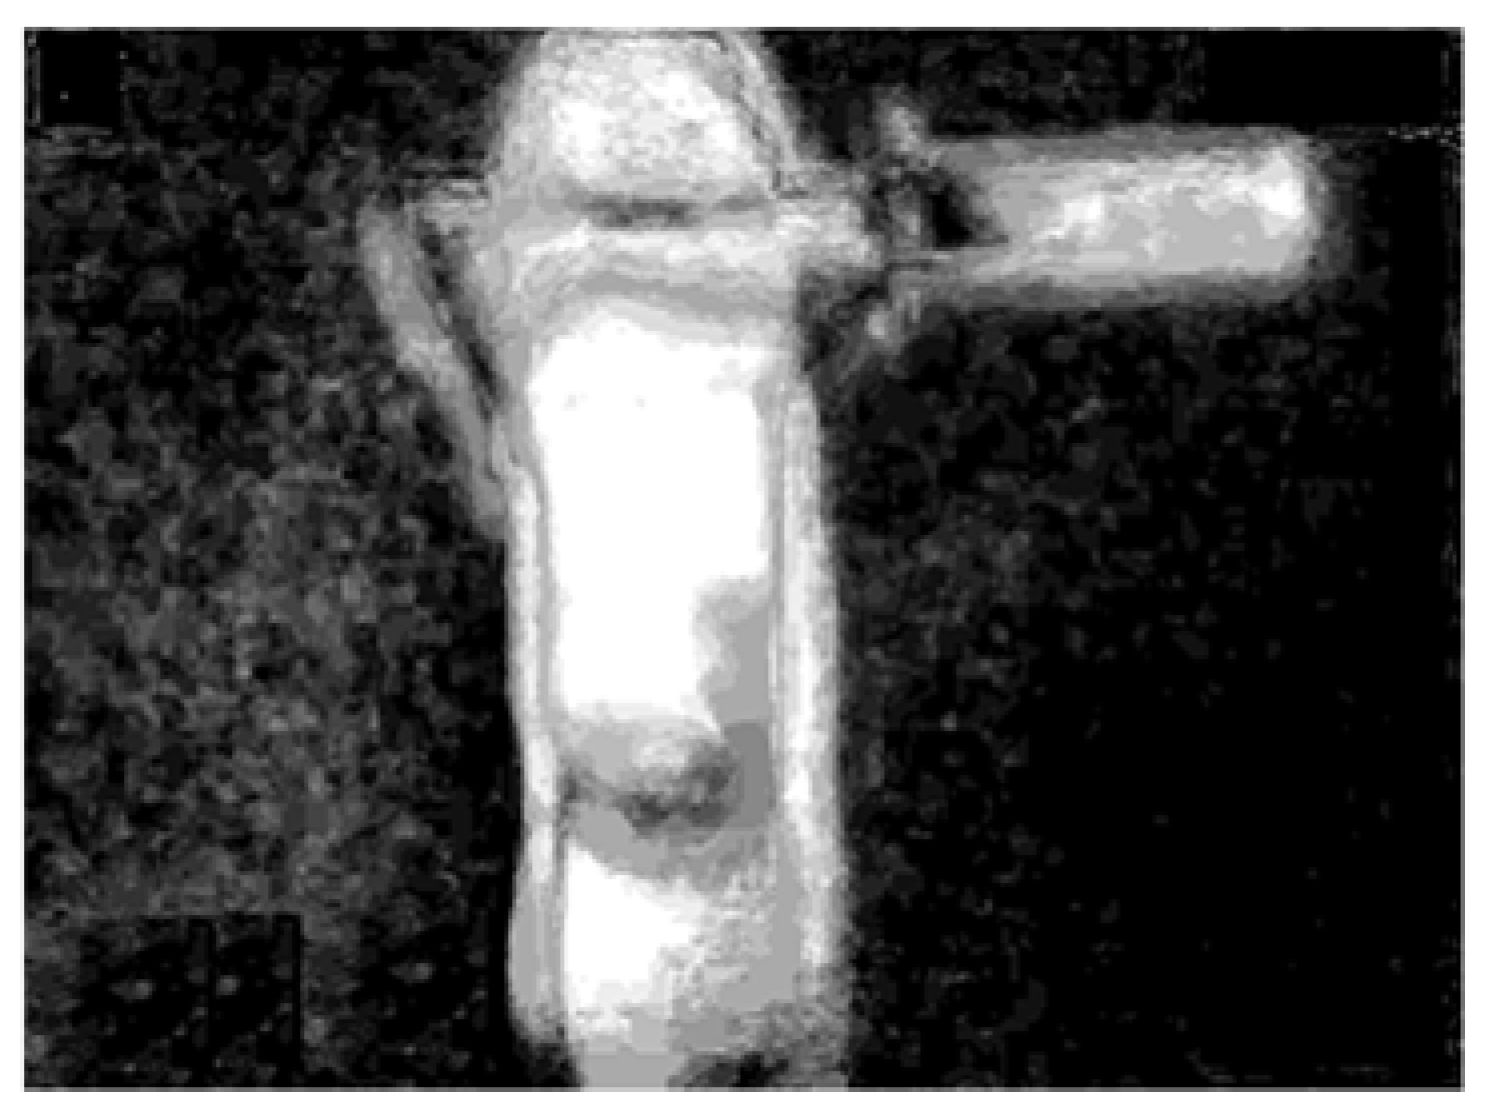
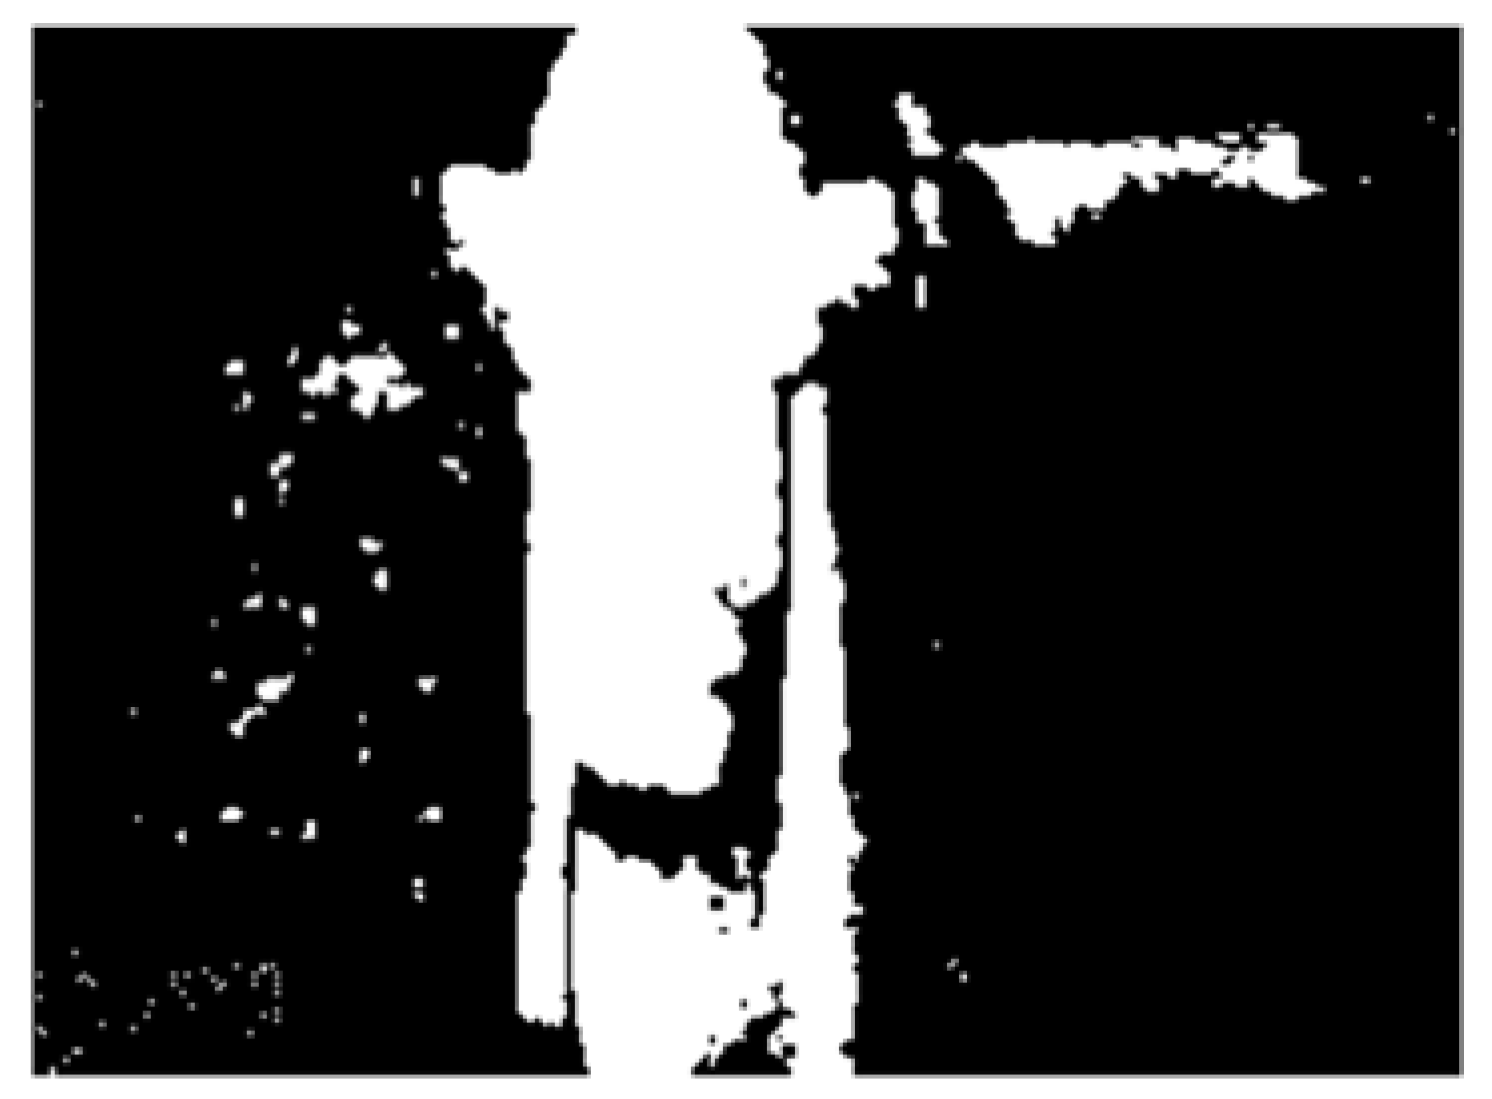
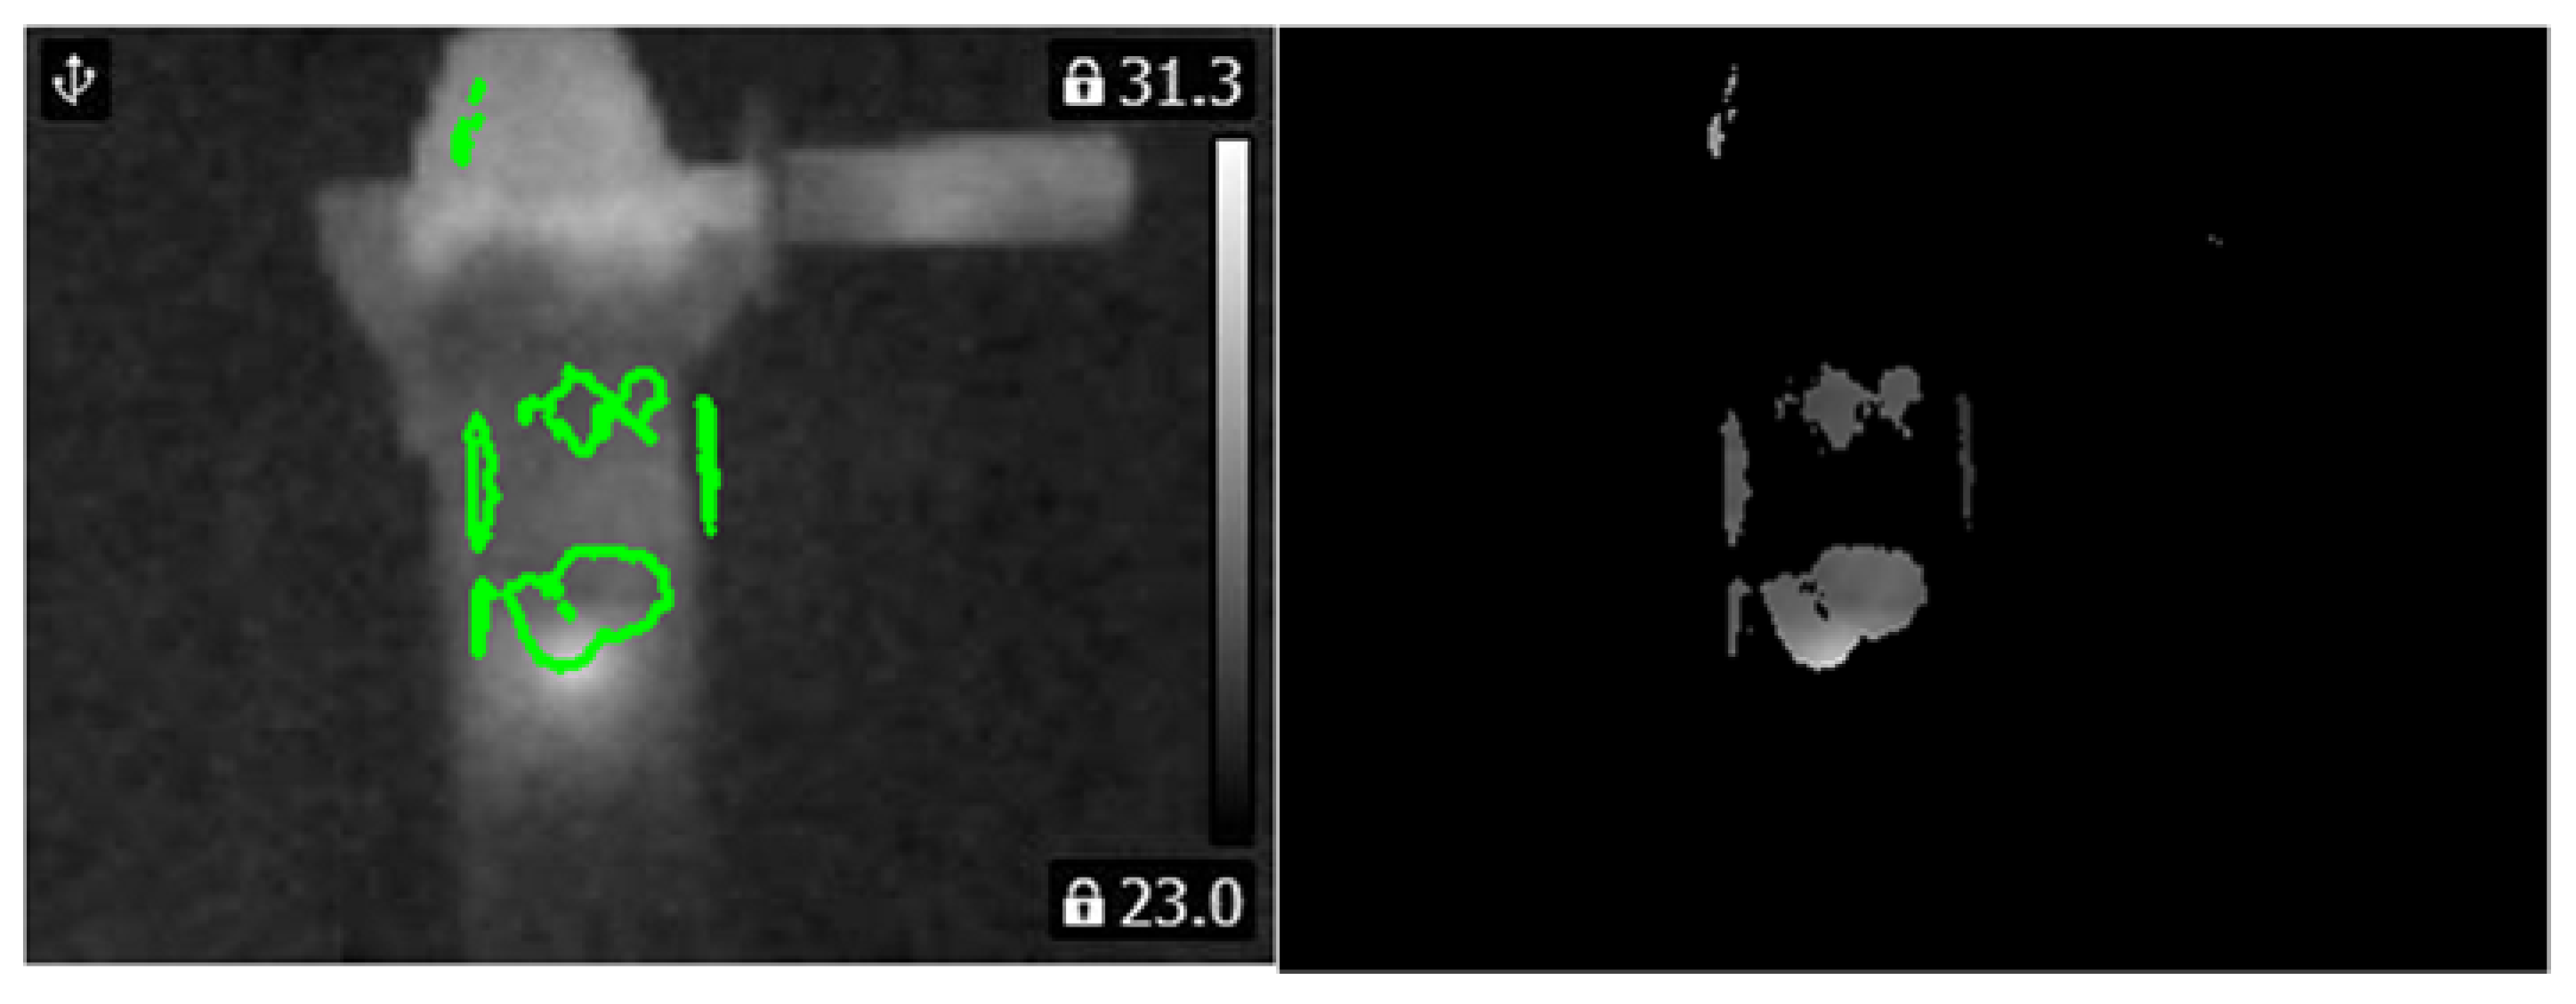
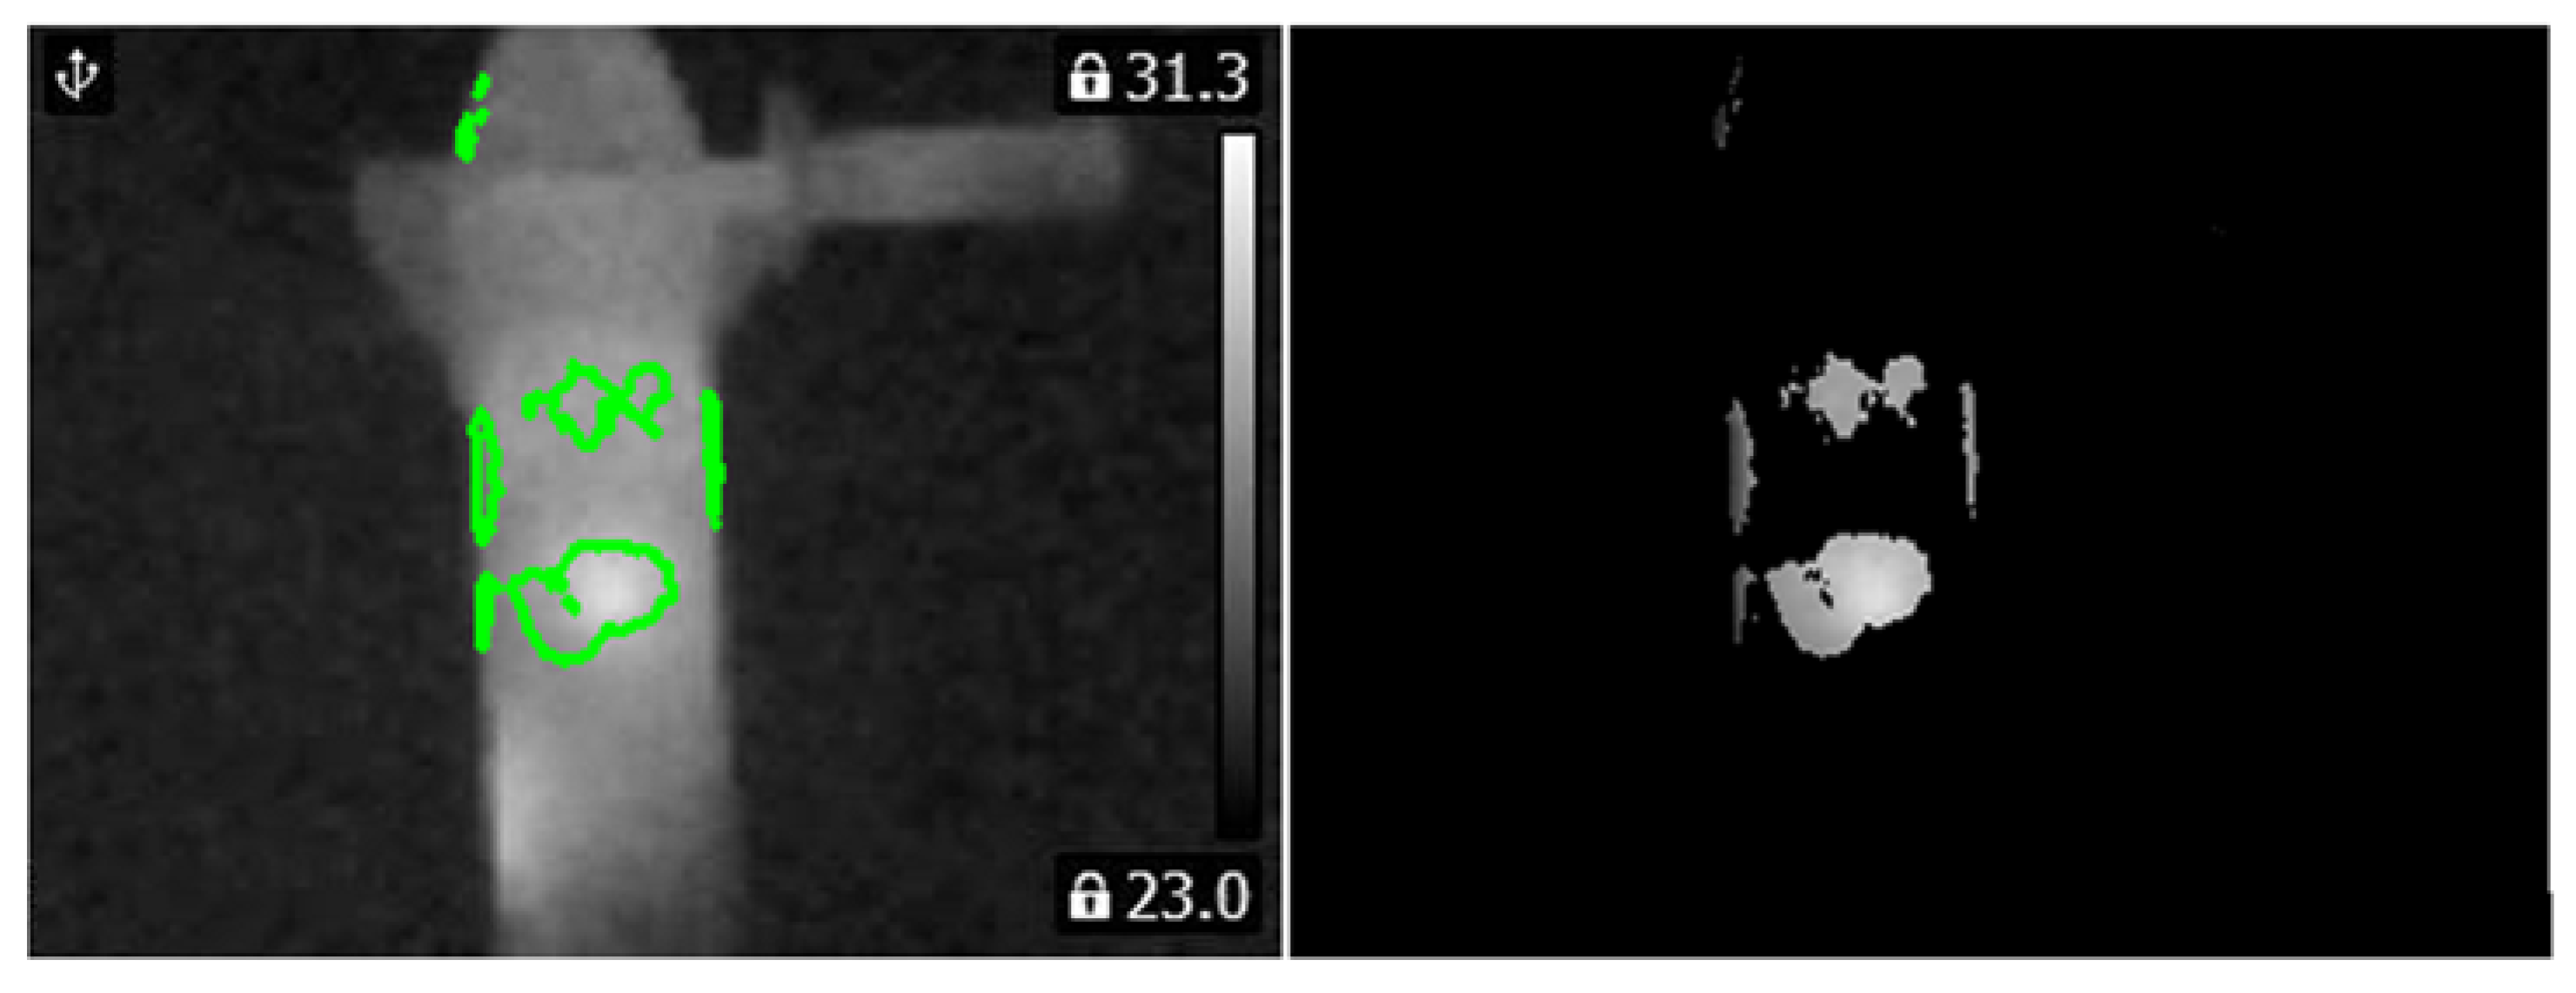
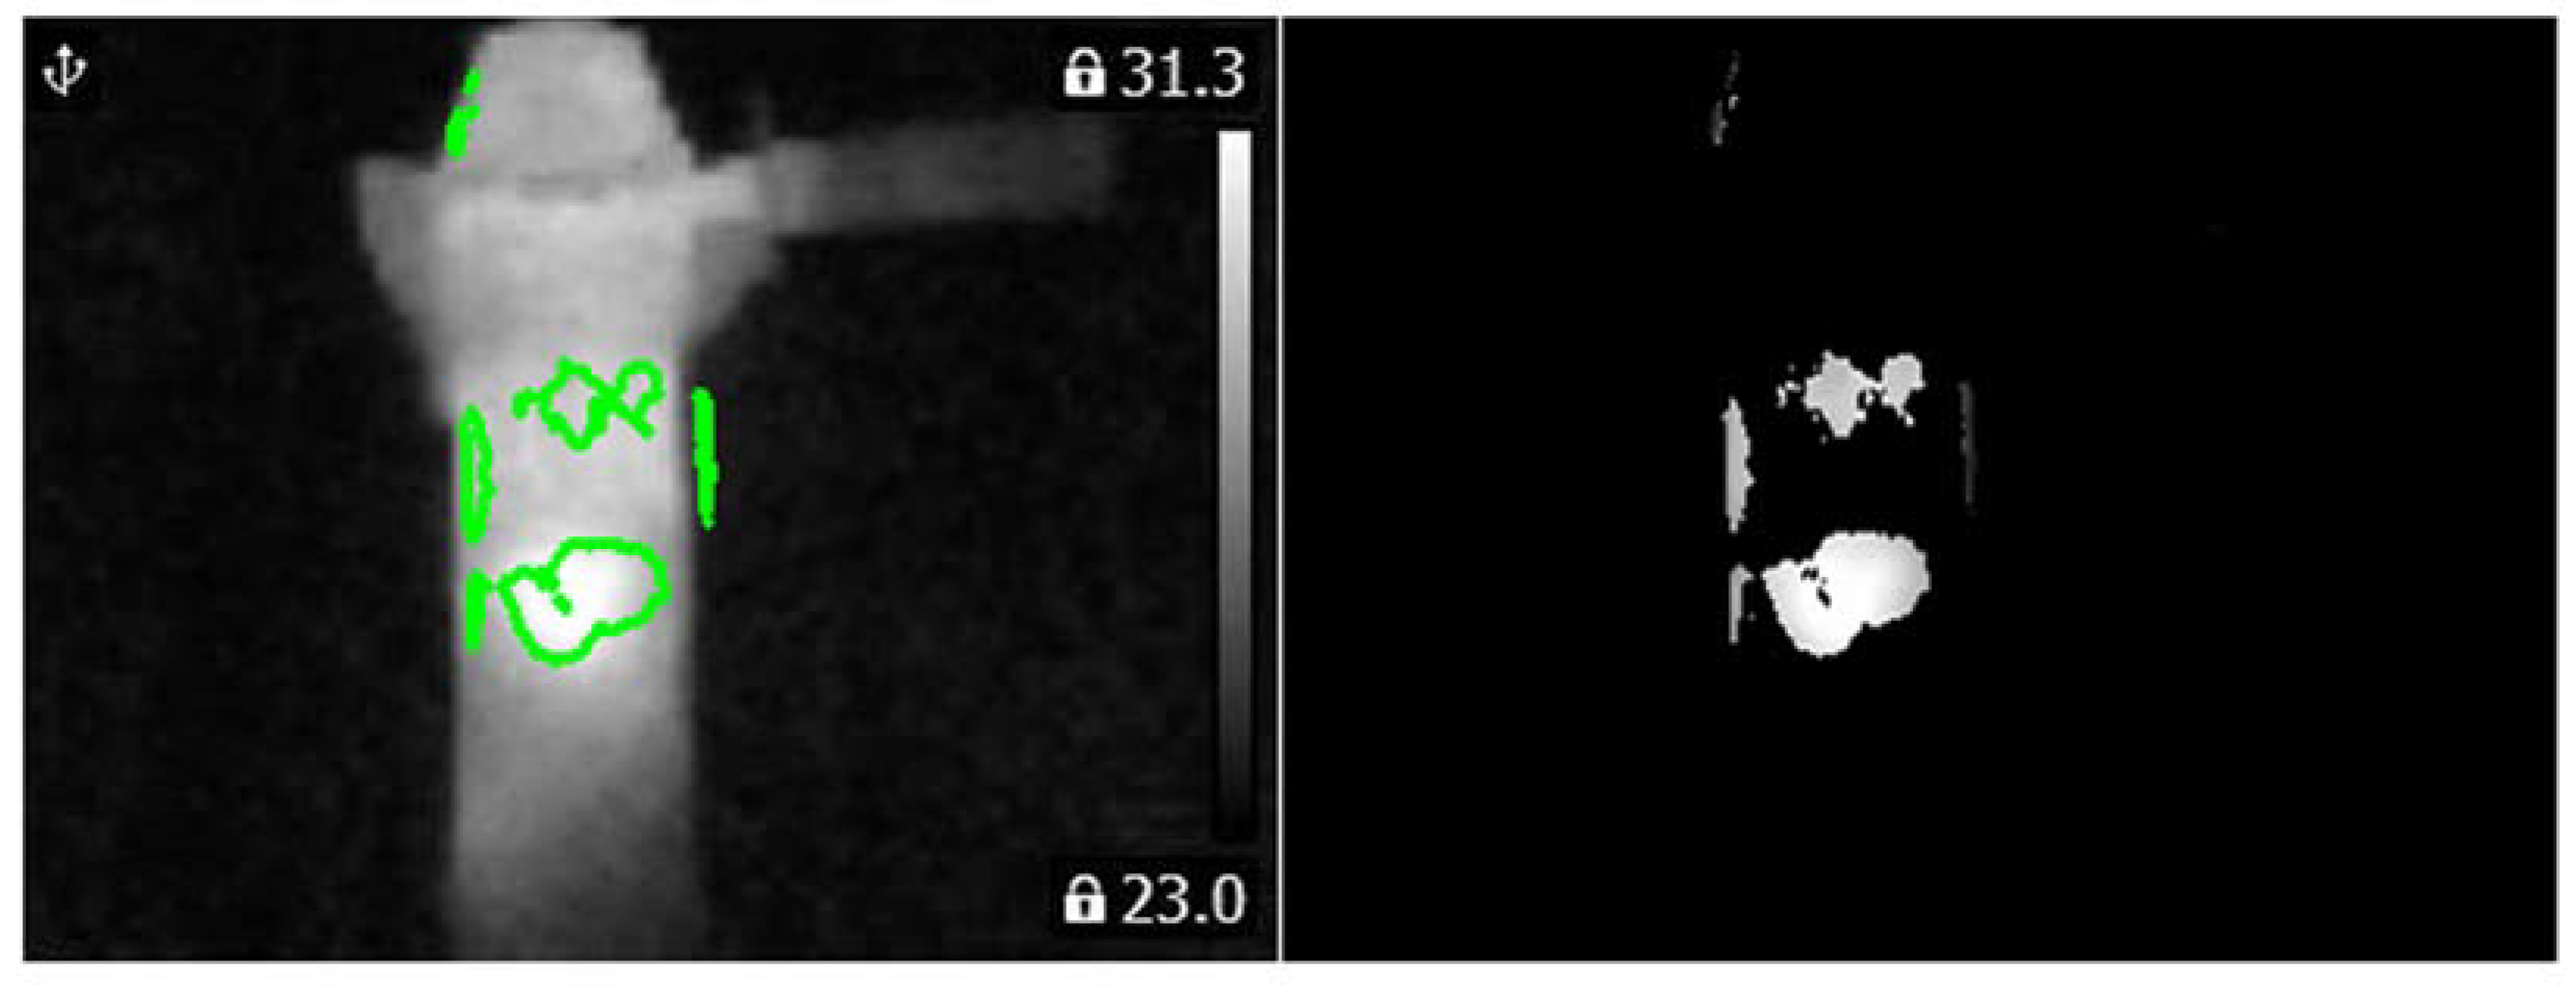
4.1. BCAoMID−F (Binarized Common Areas of Maximum Image Differences−Fusion)
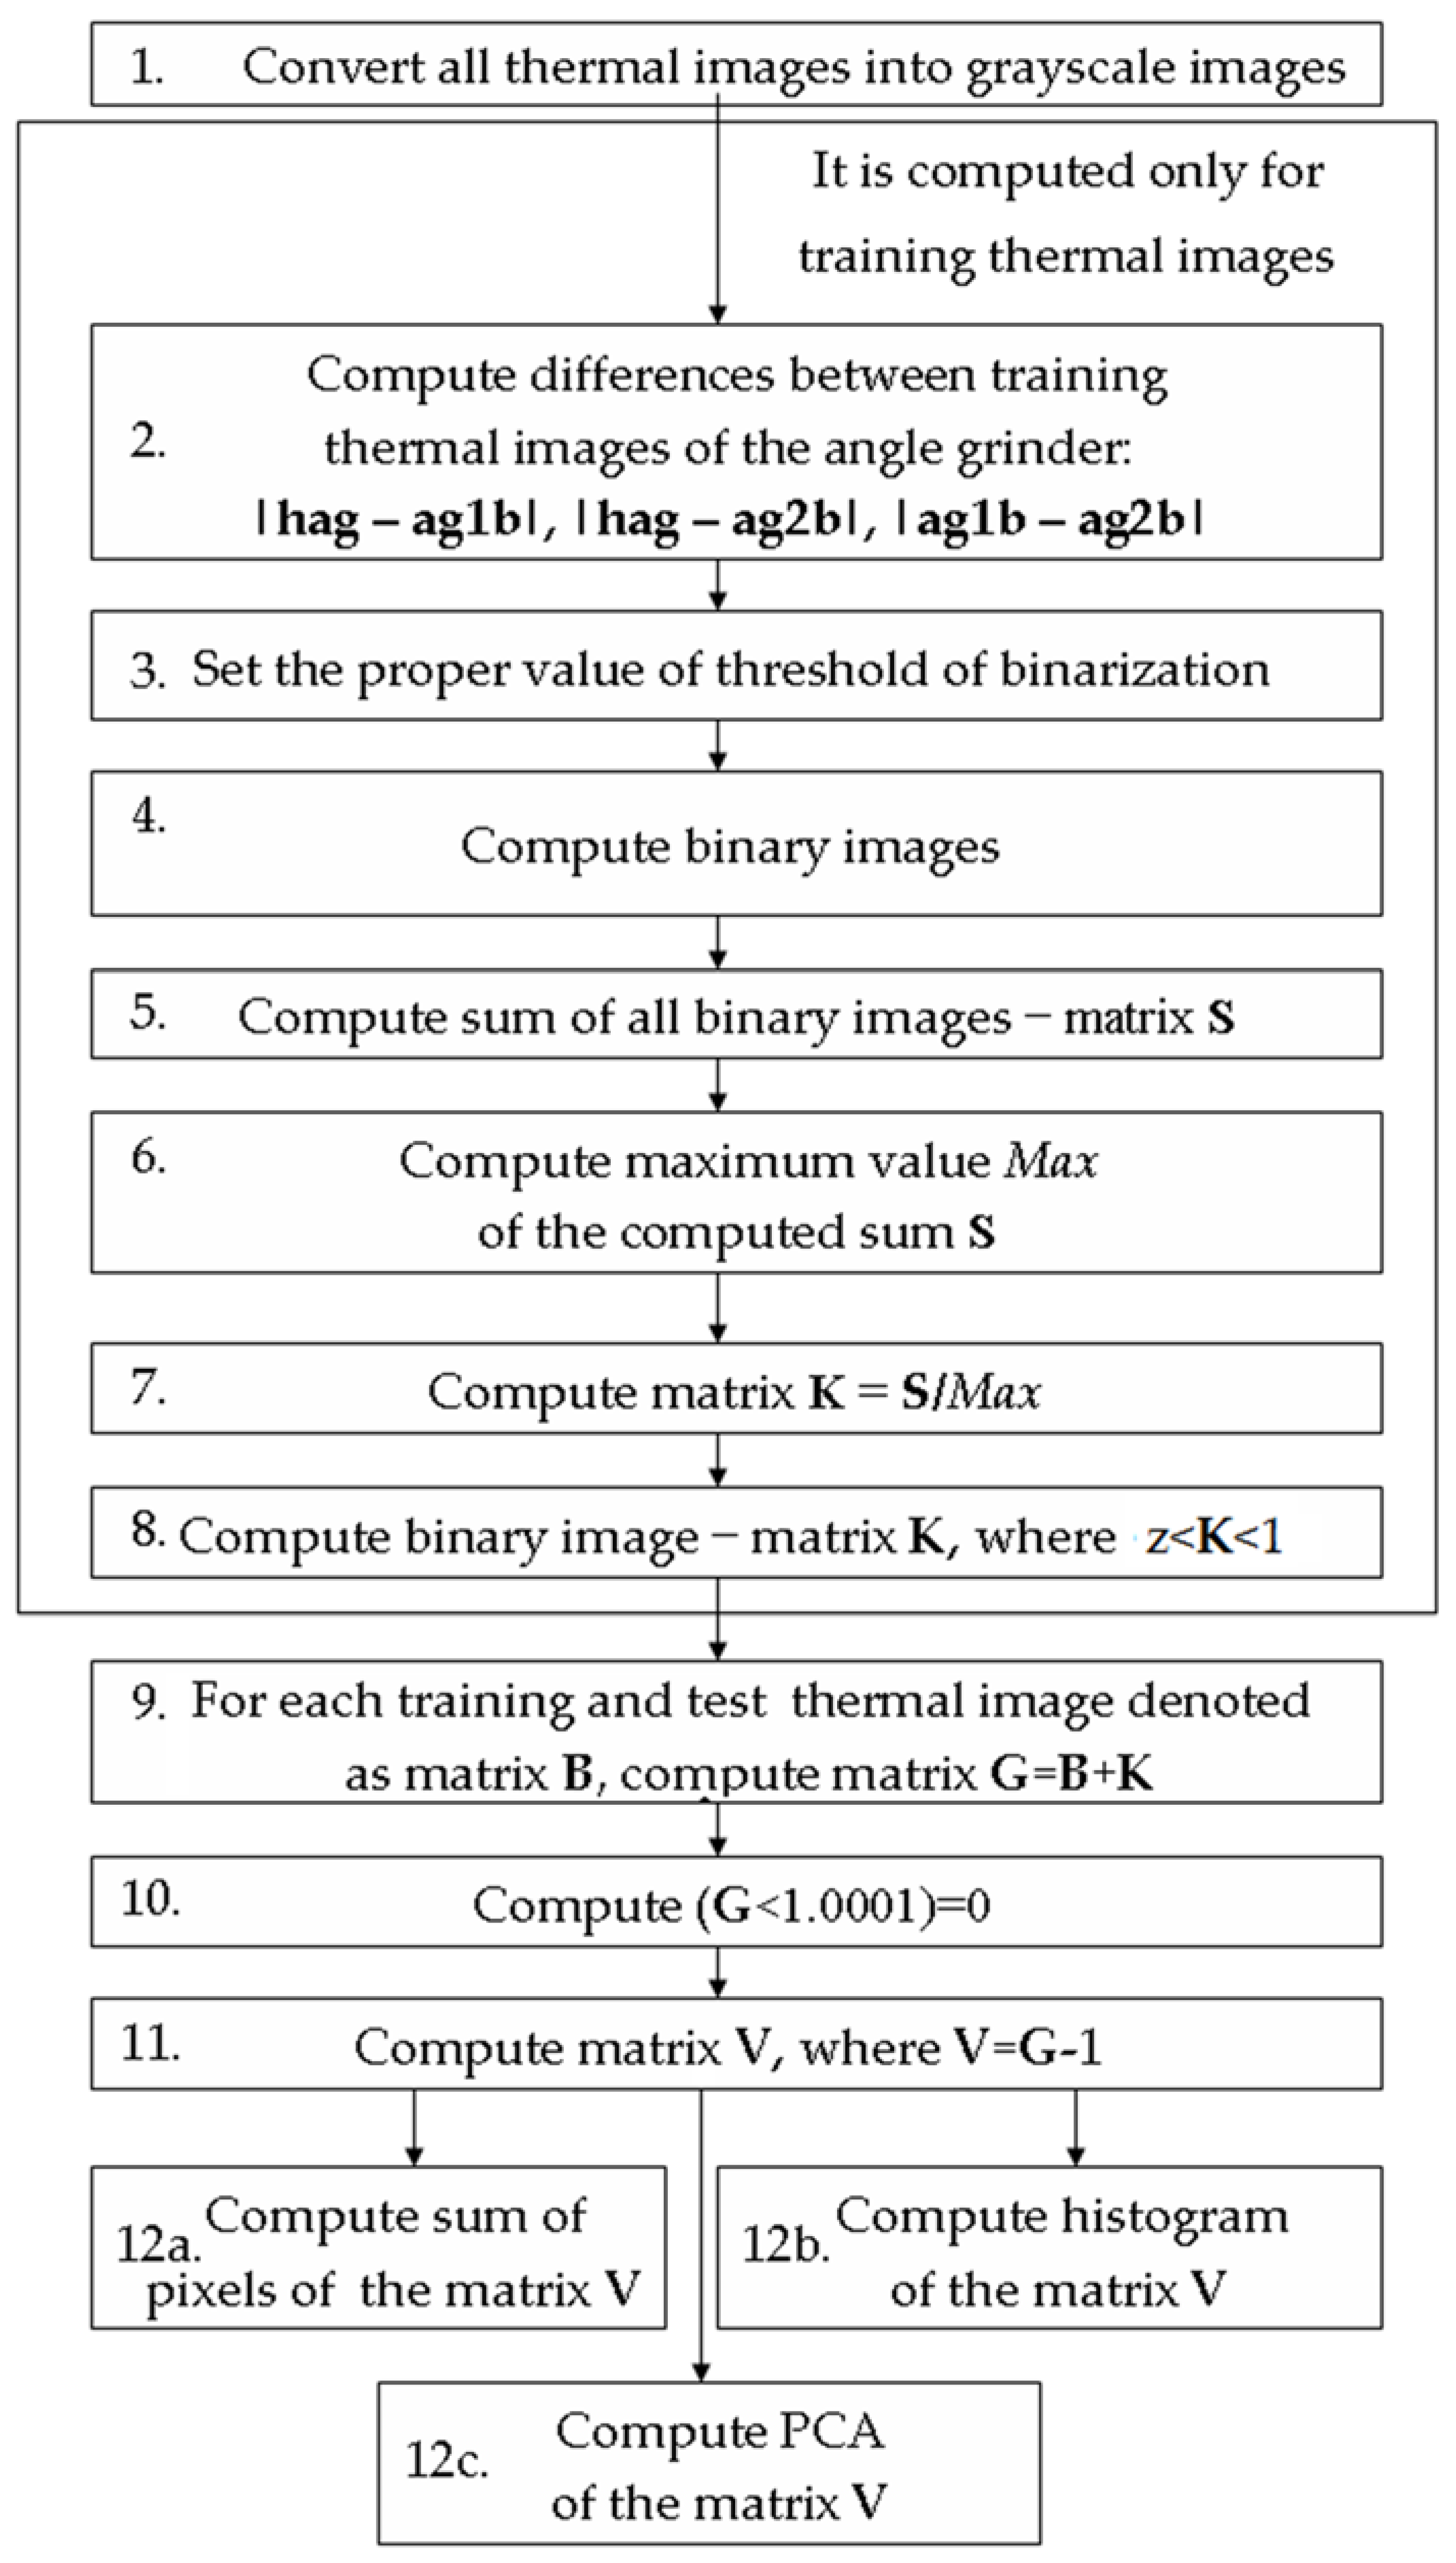
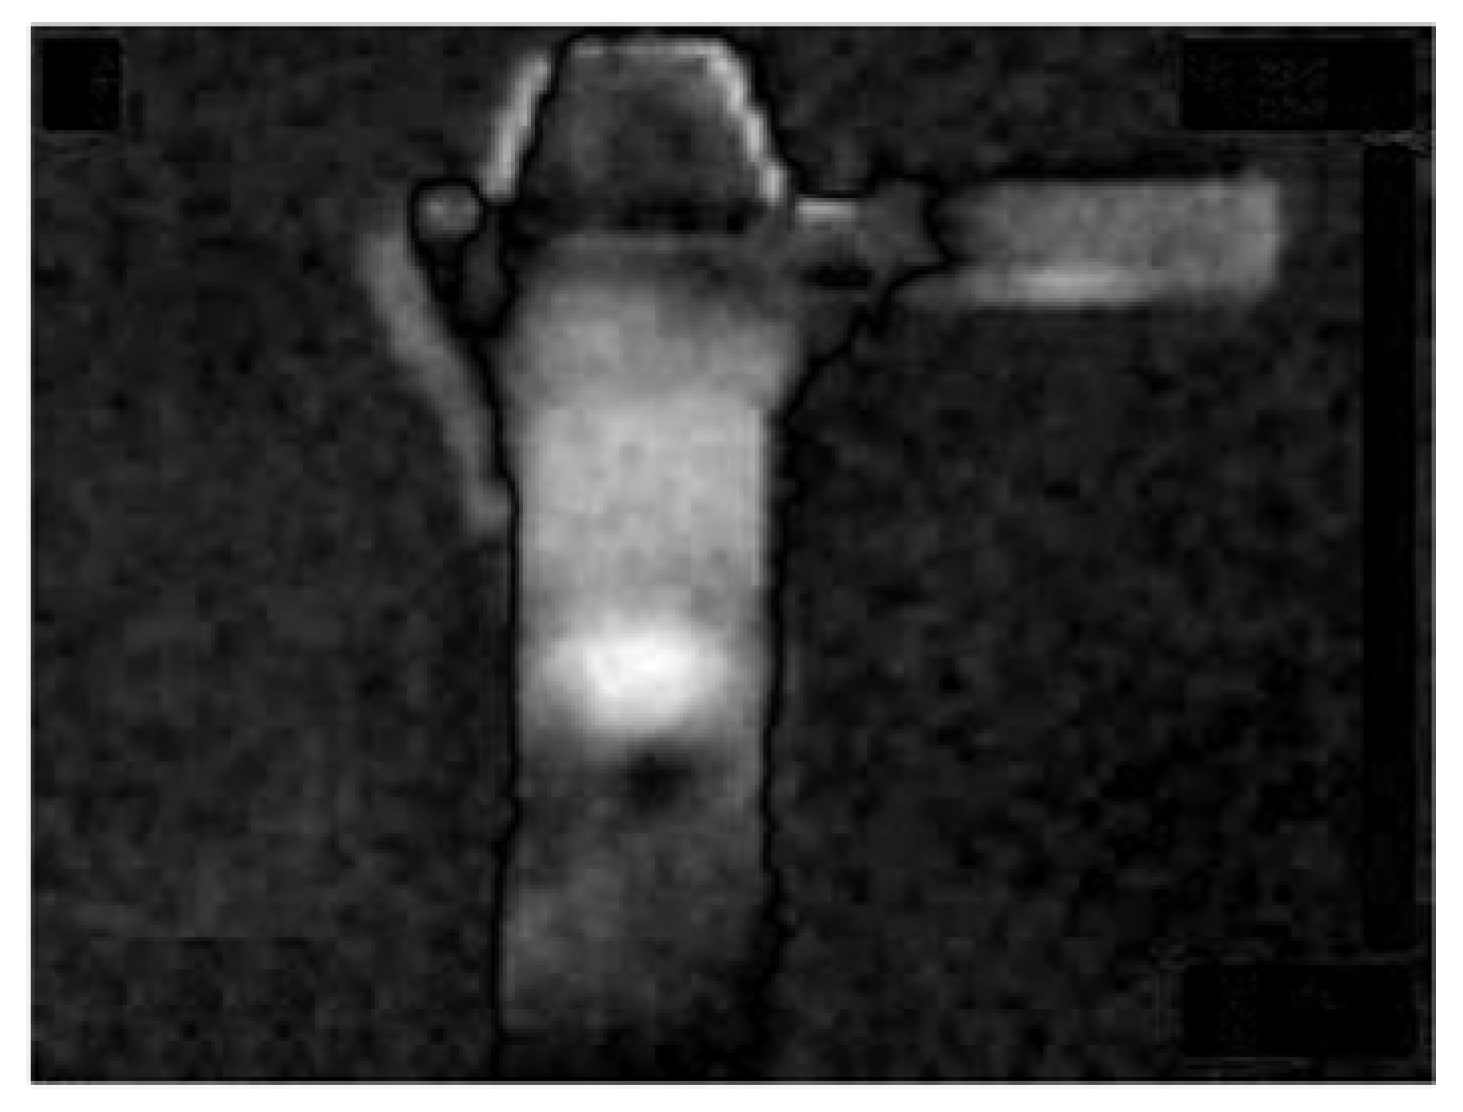
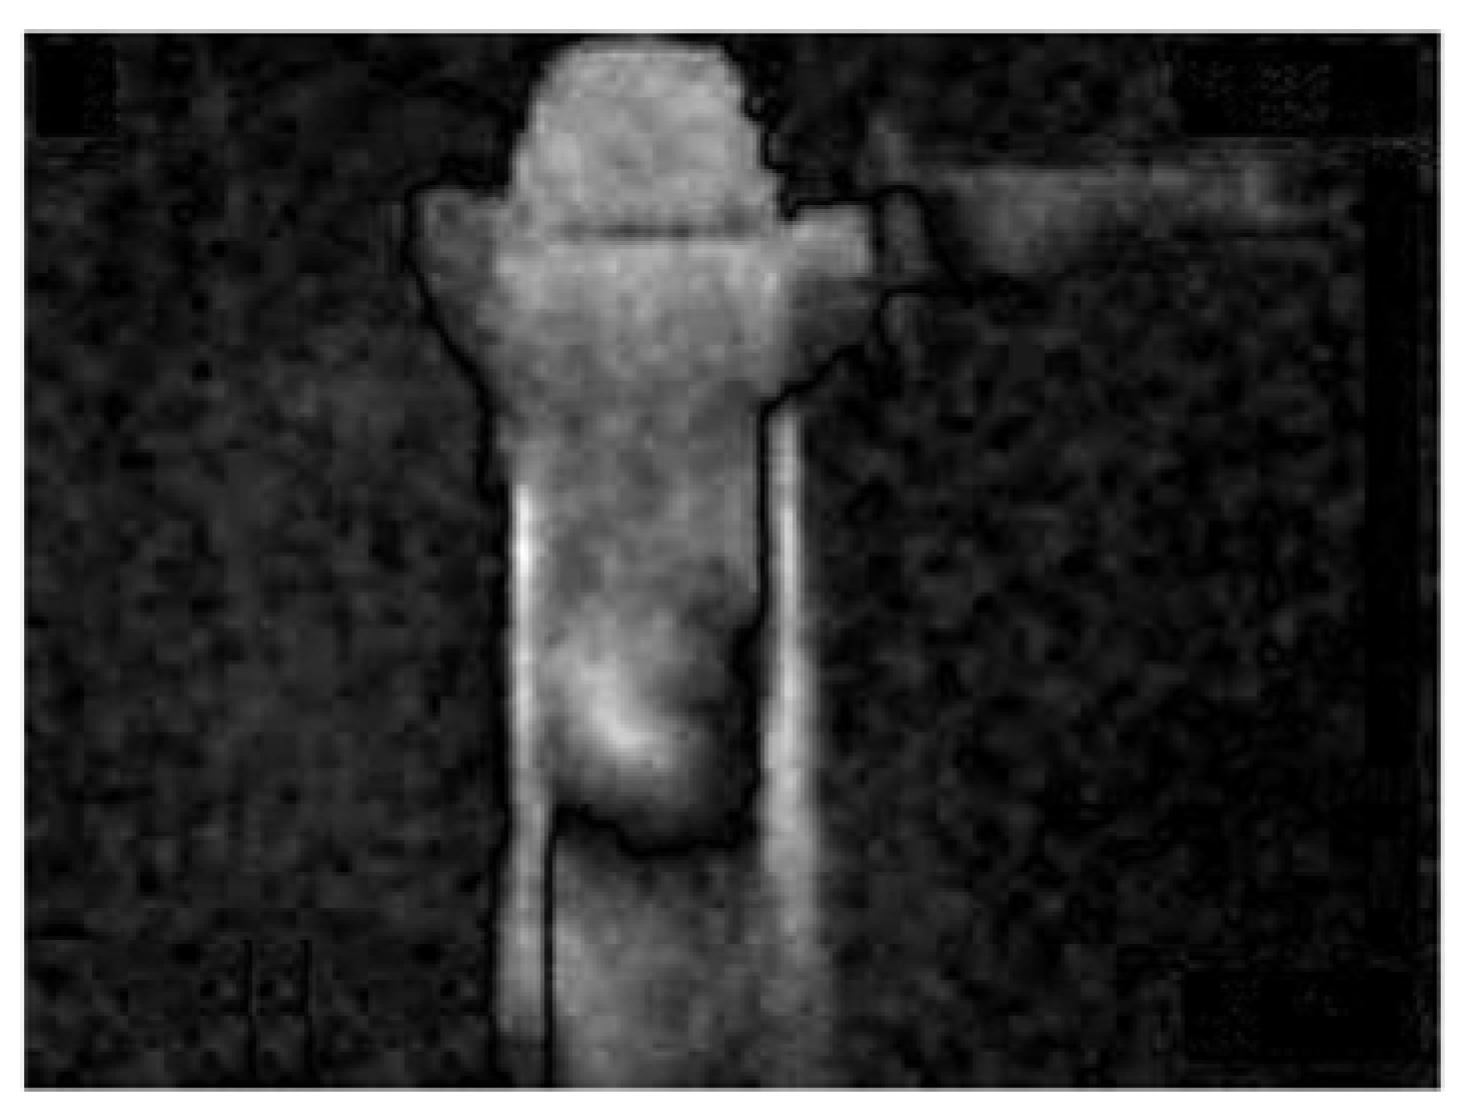
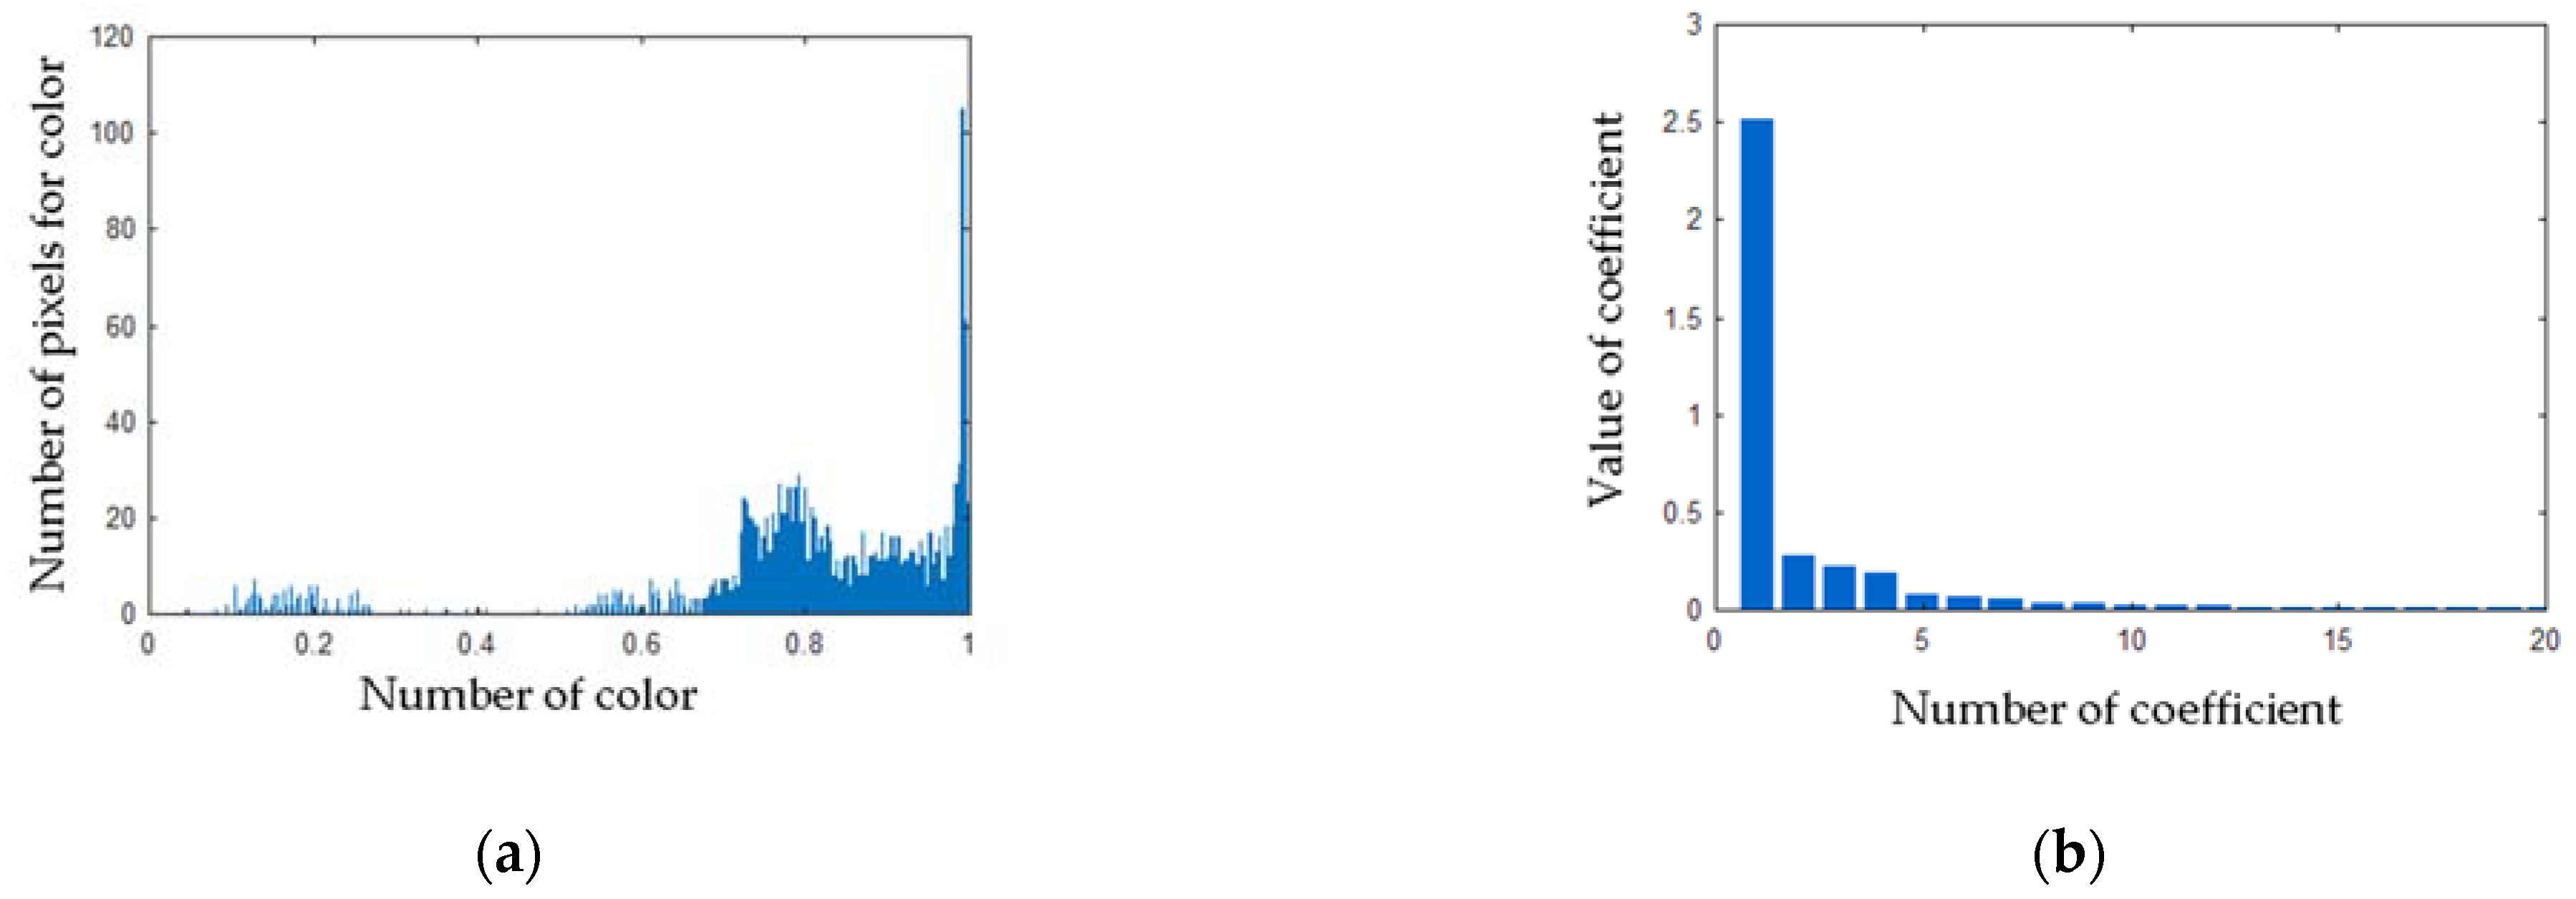
- Convert all thermal images into grayscale images (256 colors, value of the pixel is in the range of <0–1>).
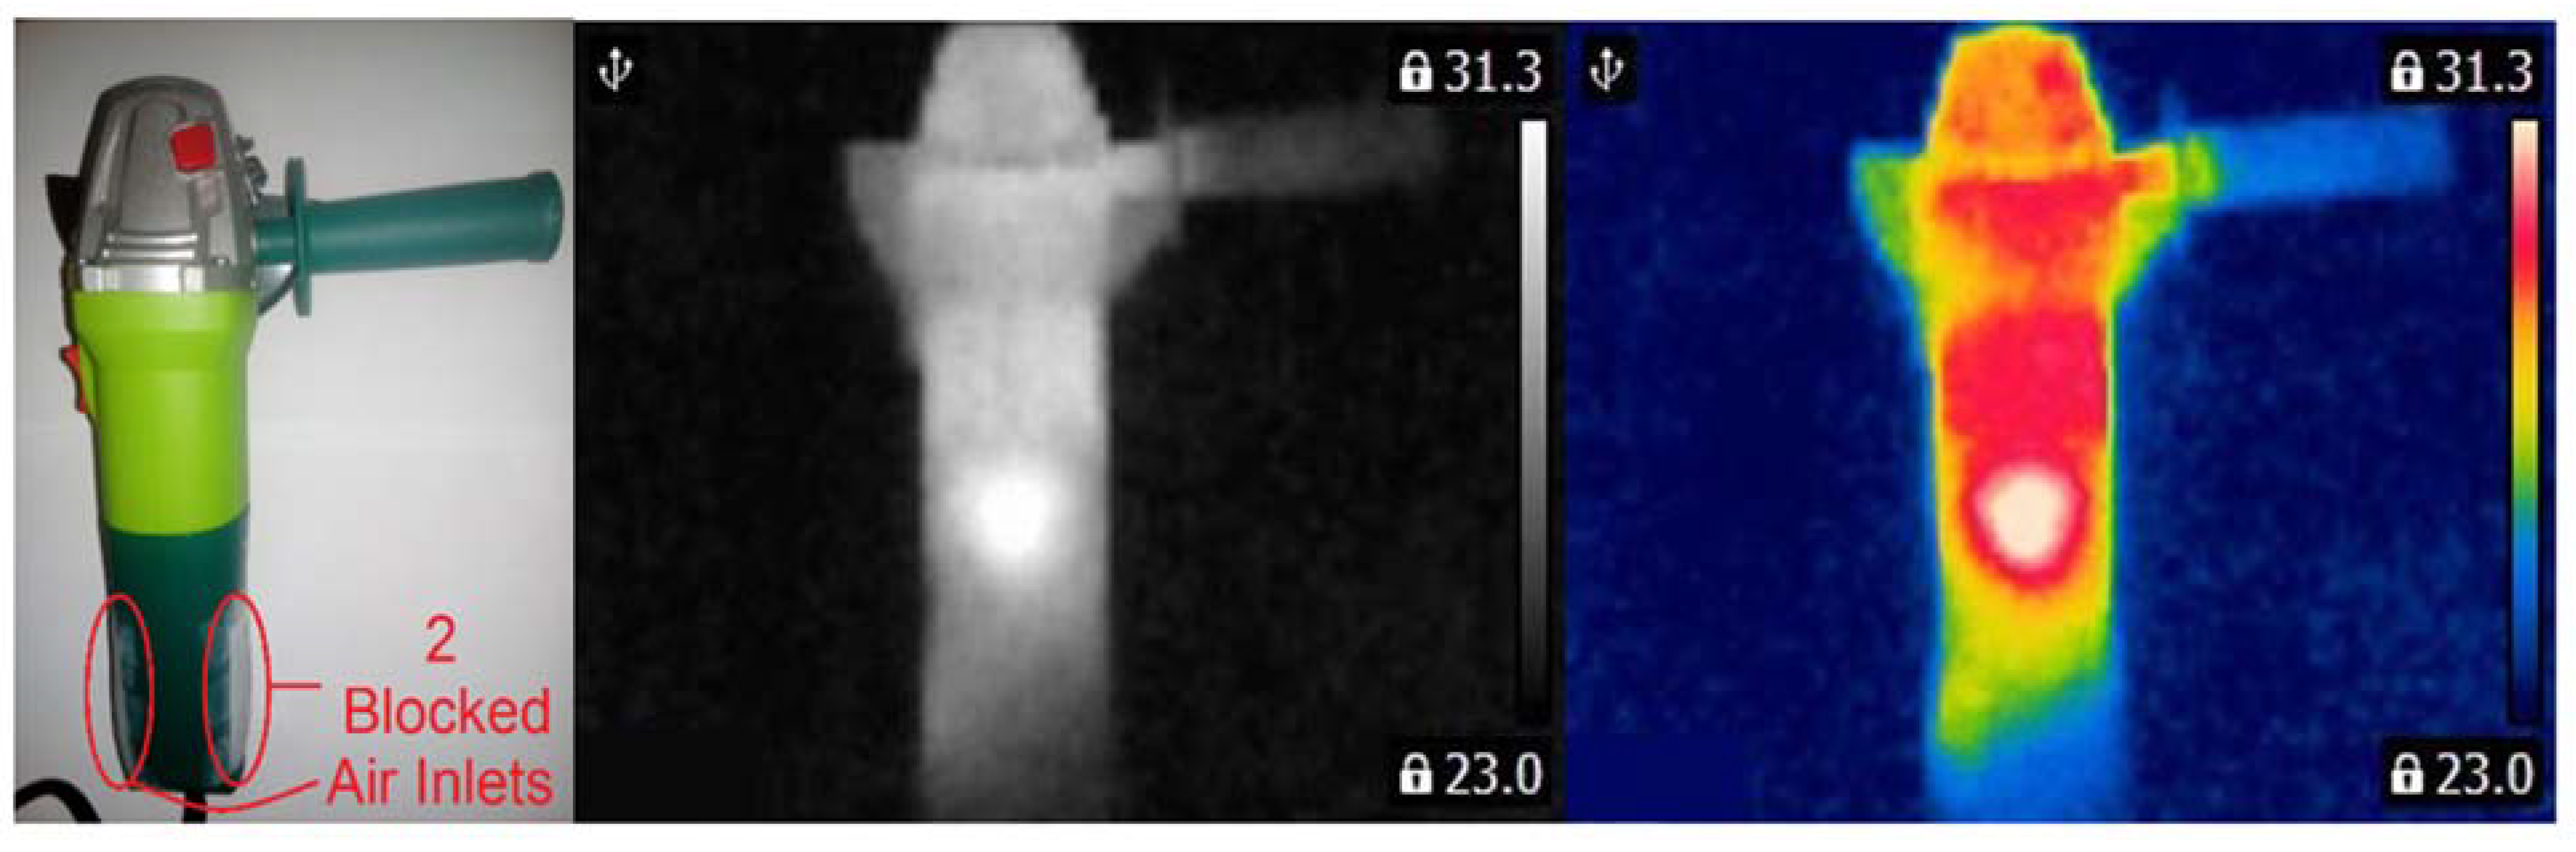
- Compute differences between training thermal images of the angle grinder: |hag-ag1b|, |hag-ag2b|, |ag1b-ag2b|, where hag − matrix (320 × 240) of the thermal image of the healthy angle grinder, ag1b−matrix (320 × 240) of the thermal image of the angle grinder with 1 blocked air inlet, ag2b−matrix (320 × 240) of the thermal image of the angle grinder with 2 blocked air inlets.
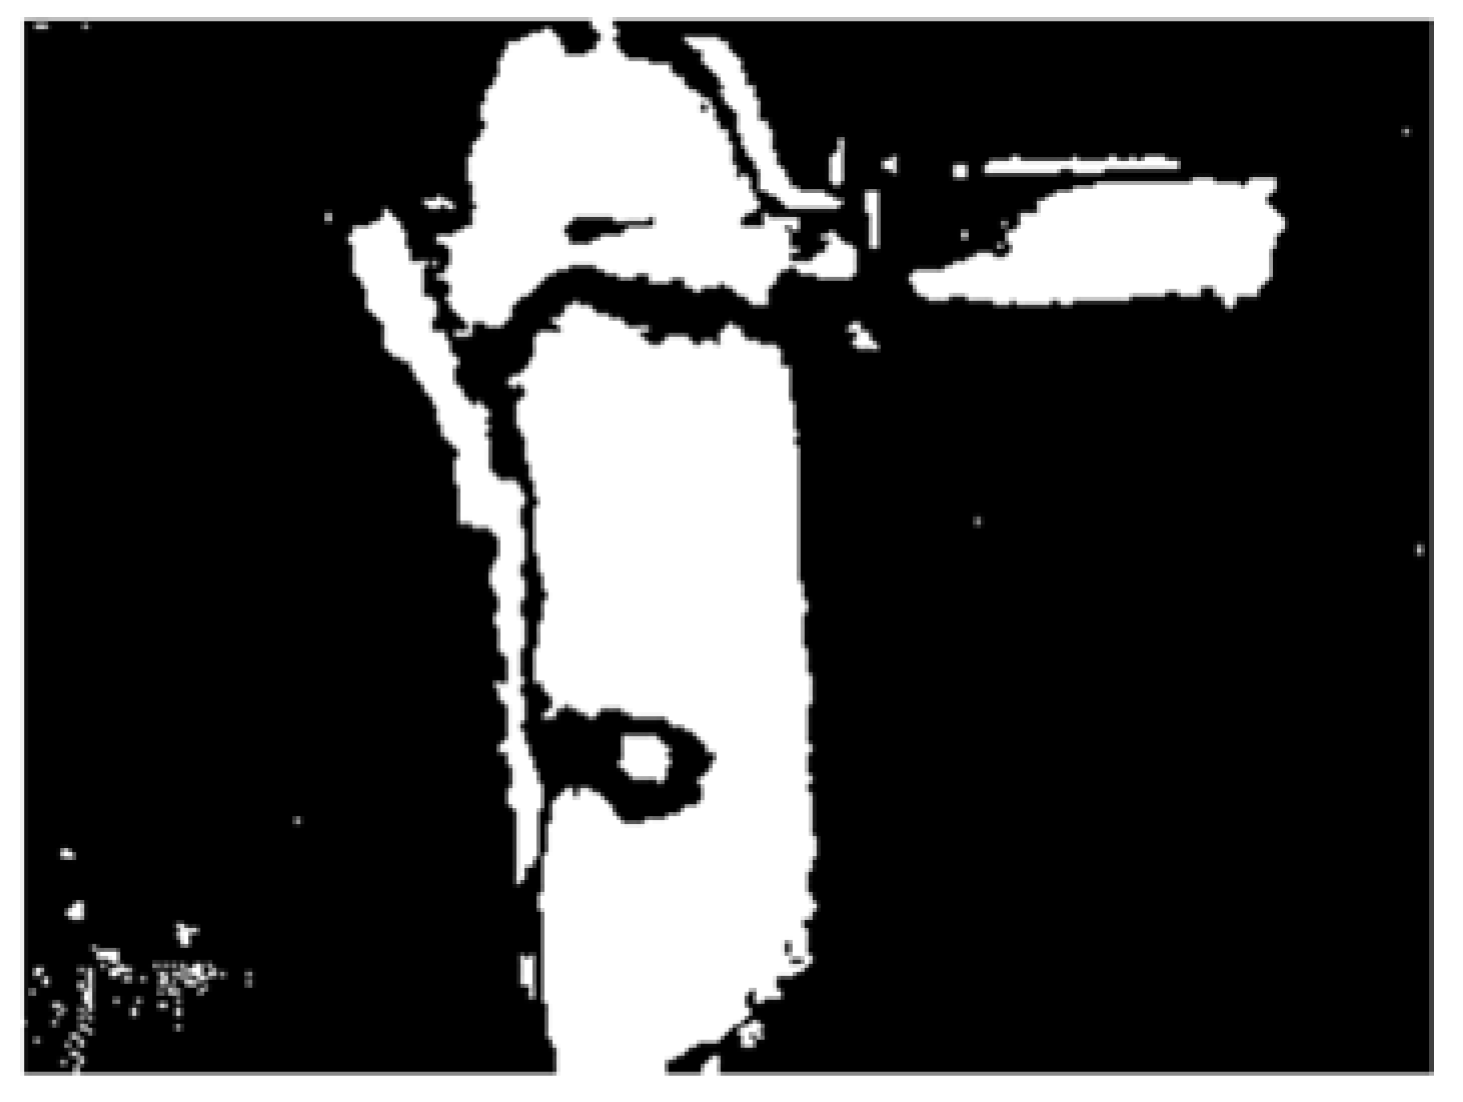
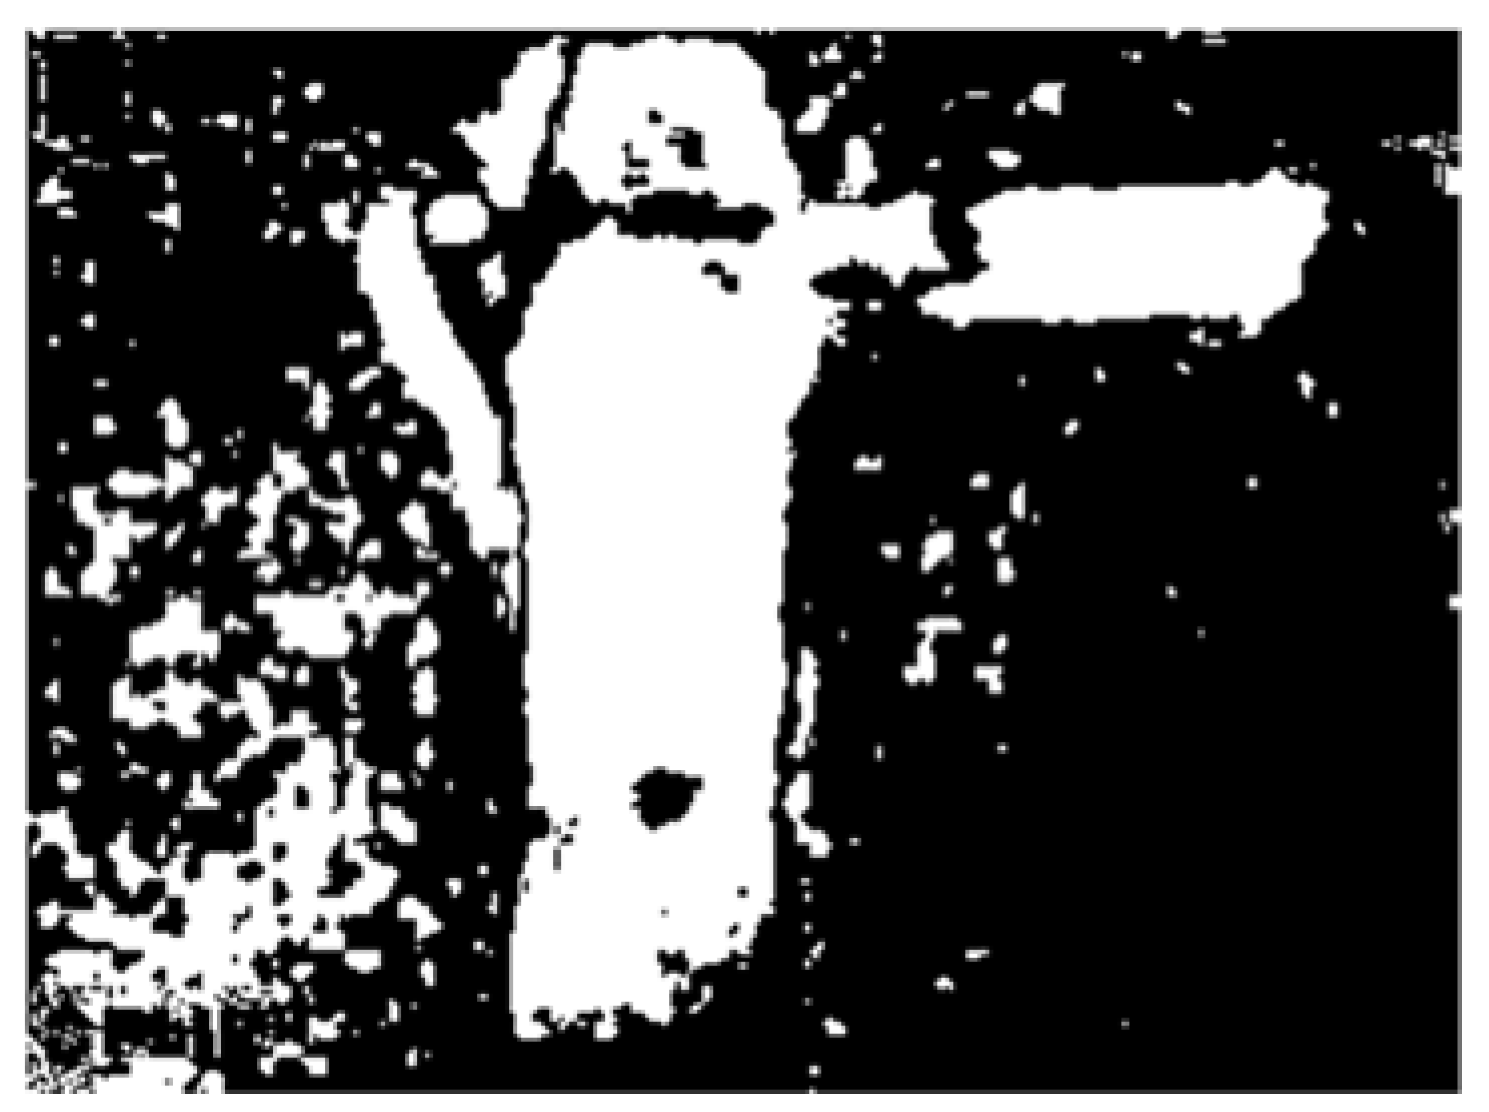
- For computed differences |hag-ag1b|, |hag-ag2b|, |ag1b-ag2b|, set the proper value of threshold of binarization (t<|hag-ag1b|<u, for example: t = 0.1, u = 1).
- Compute binary images (binarization threshold = 0.1).
- Compute the sum of all binary images of the computed differences. It is denoted as matrix S.
- Compute maximum value (Max) of the computed sum S.
- Compute matrix K = S/Max.
- Compute binary image−matrix K, where z < K < 1 (set 0 for values of matrix K less than z, set 1 for values of matrix K greater than z), z is set experimentally <0, 1>. For the analysis, the author set z = 0.5. Computed binary image K has values 0 and 1.
- For each training and test thermal image denoted as matrix B, compute matrix G = B + K.
- Compute matrix (G < 1.001) = 0 (set 0 for values of matrix G less than 1.001).
- Compute matrix V, where V = G − 1
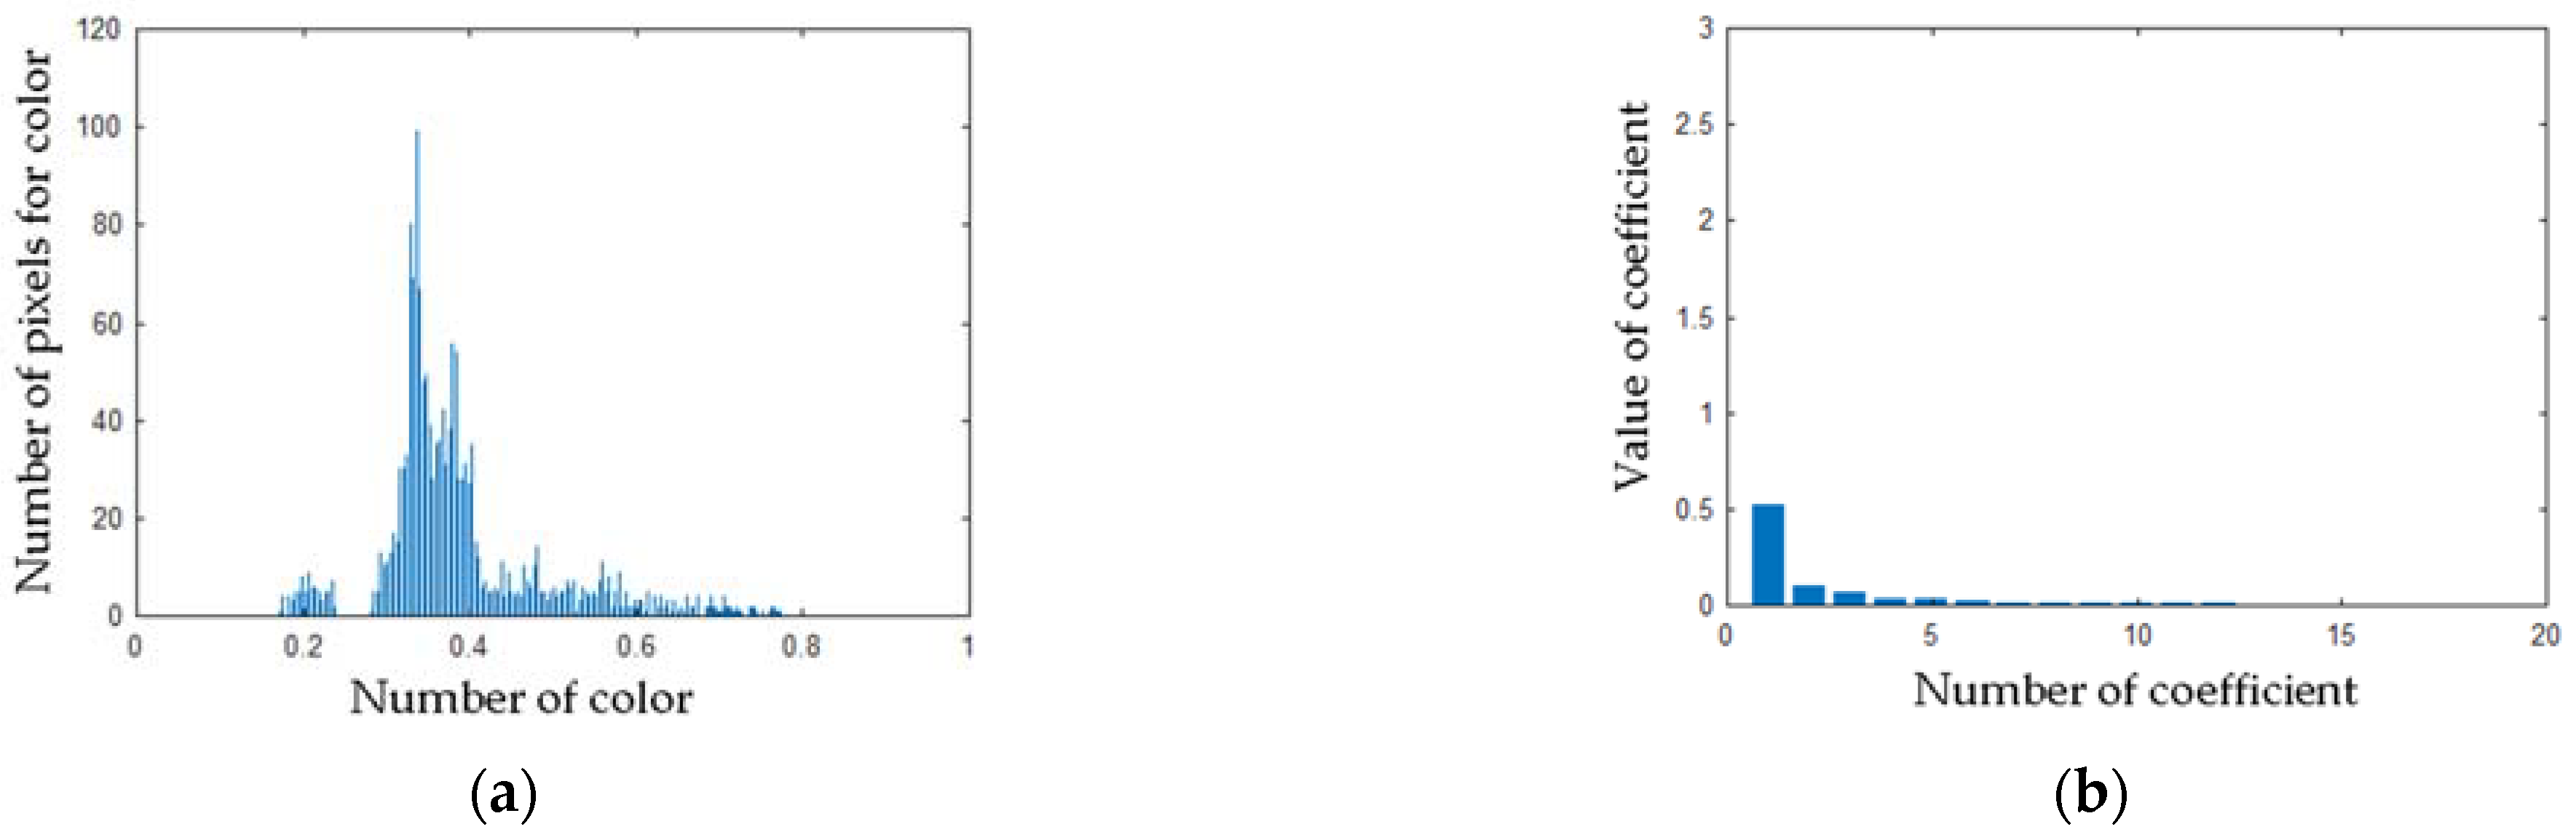
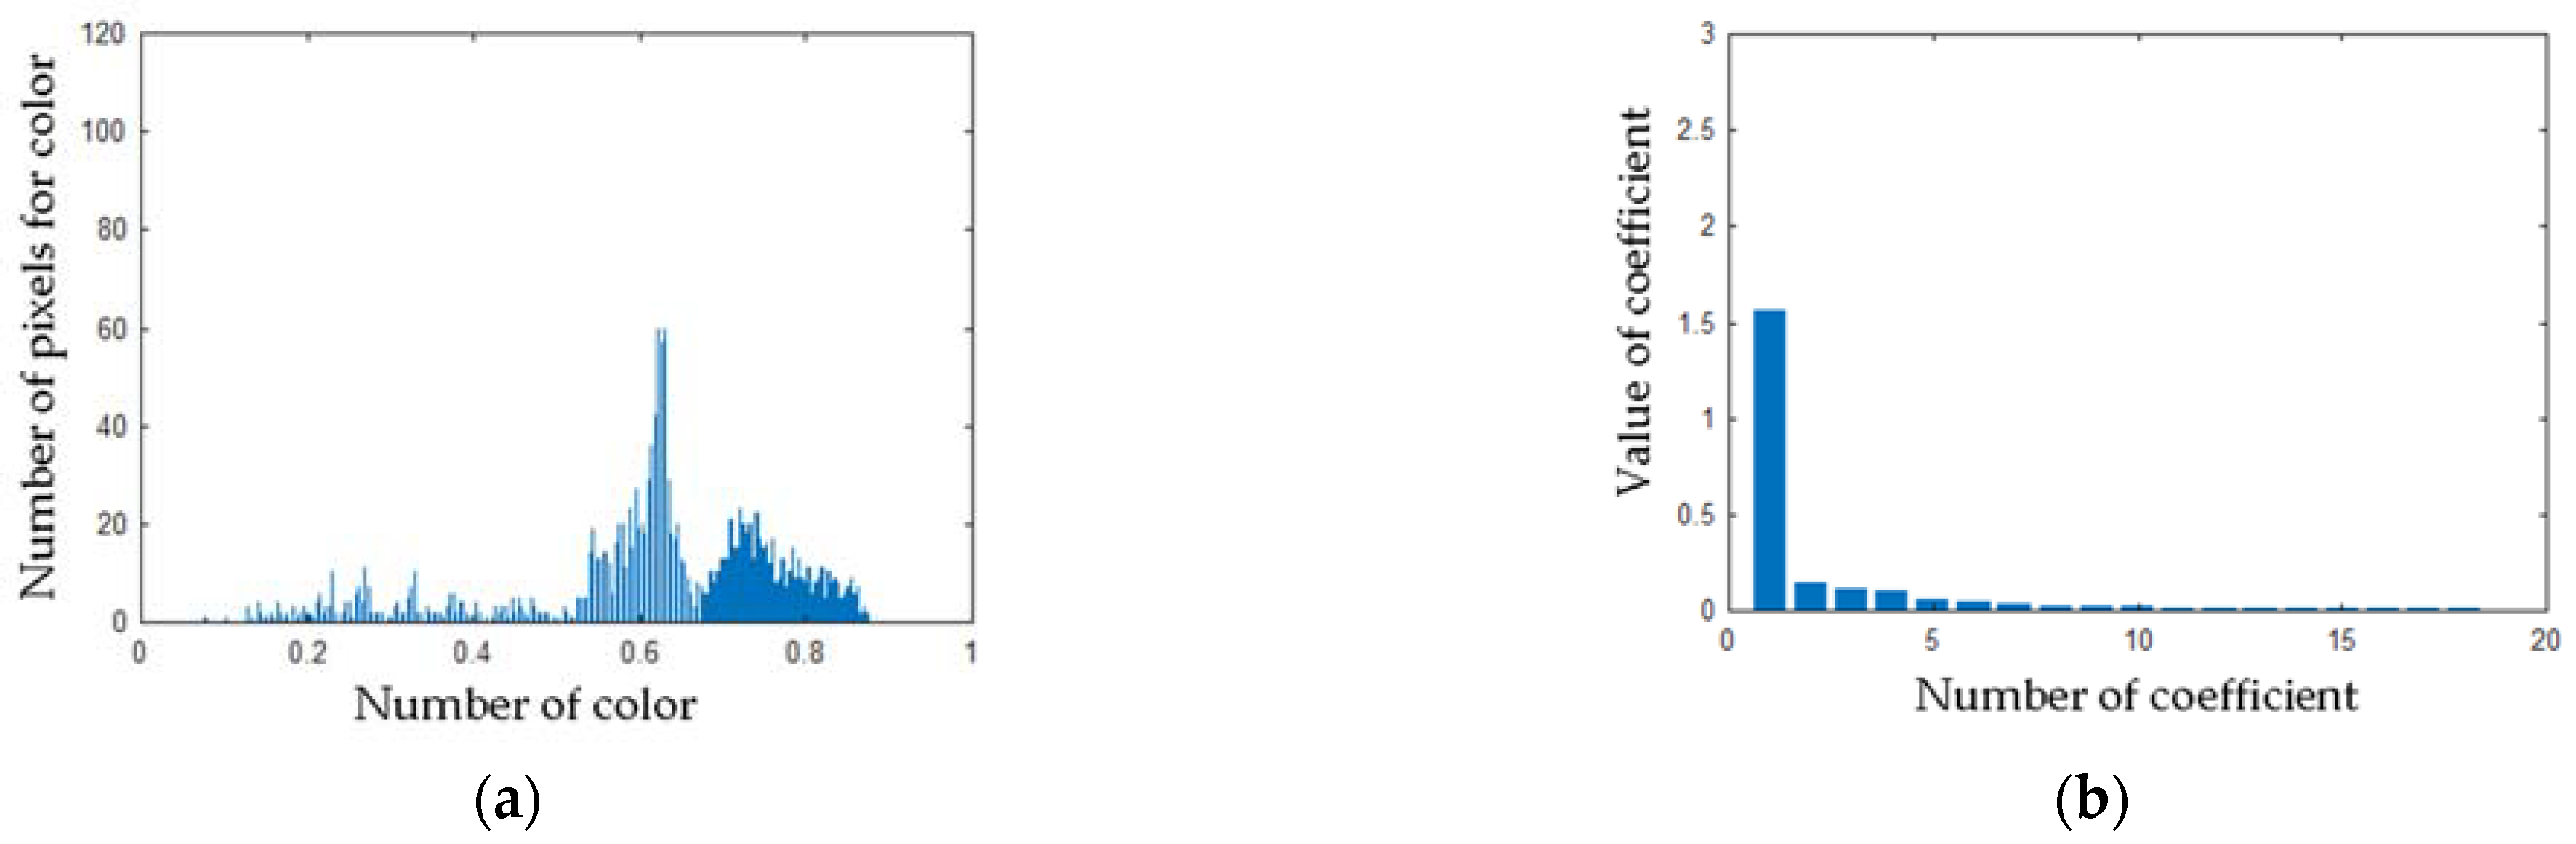
- Compute three features: compute the sum of pixels of the matrix V, compute a histogram of the matrix V, compute PCA (Principal Component Analysis) of the matrix V.
4.2. Principal Component Analysis
4.3. Classification Using the Nearest Neighbor
- (1)
- load training and test feature vectors,
- (2)
- set k = 1 (k − number of nearest neighbors),
- (3)
- Compute the distance d, where d = Σ|a-b|, a—test feature vector, b—training feature vector,
- (4)
- for all computed distances d, select the nearest distance,
- (5)
- select the label of the predicted class.
4.4. Support Vector Machine
5. Results of the Analysis of Thermal Images
6. Conclusions
- (1)
- Thermal images should be captured at the same distance (thermal imaging camera–analyzed motor).
- (2)
- The proposed method is efficient for measurement distance equal to 0.4 m. Slight shifts of thermal imaging camera(+/−0.1 m) do not cause major changes for recognition results.
- (3)
- Recognition rate for considered states was high (TRAG is in the range of 98.5–100%).
- (4)
- The same conditions and equipment should be used for measurements. The temperature of air in a room should be similar for all training and test thermal images.
- (5)
- Different types of motors can be diagnosed by the proposed method successfully.
- (6)
- The proposed method is fast. It can be implemented as a condition online monitoring system.
- (7)
- The method is non-invasive. It can be used for conditions of difficult access.
- (8)
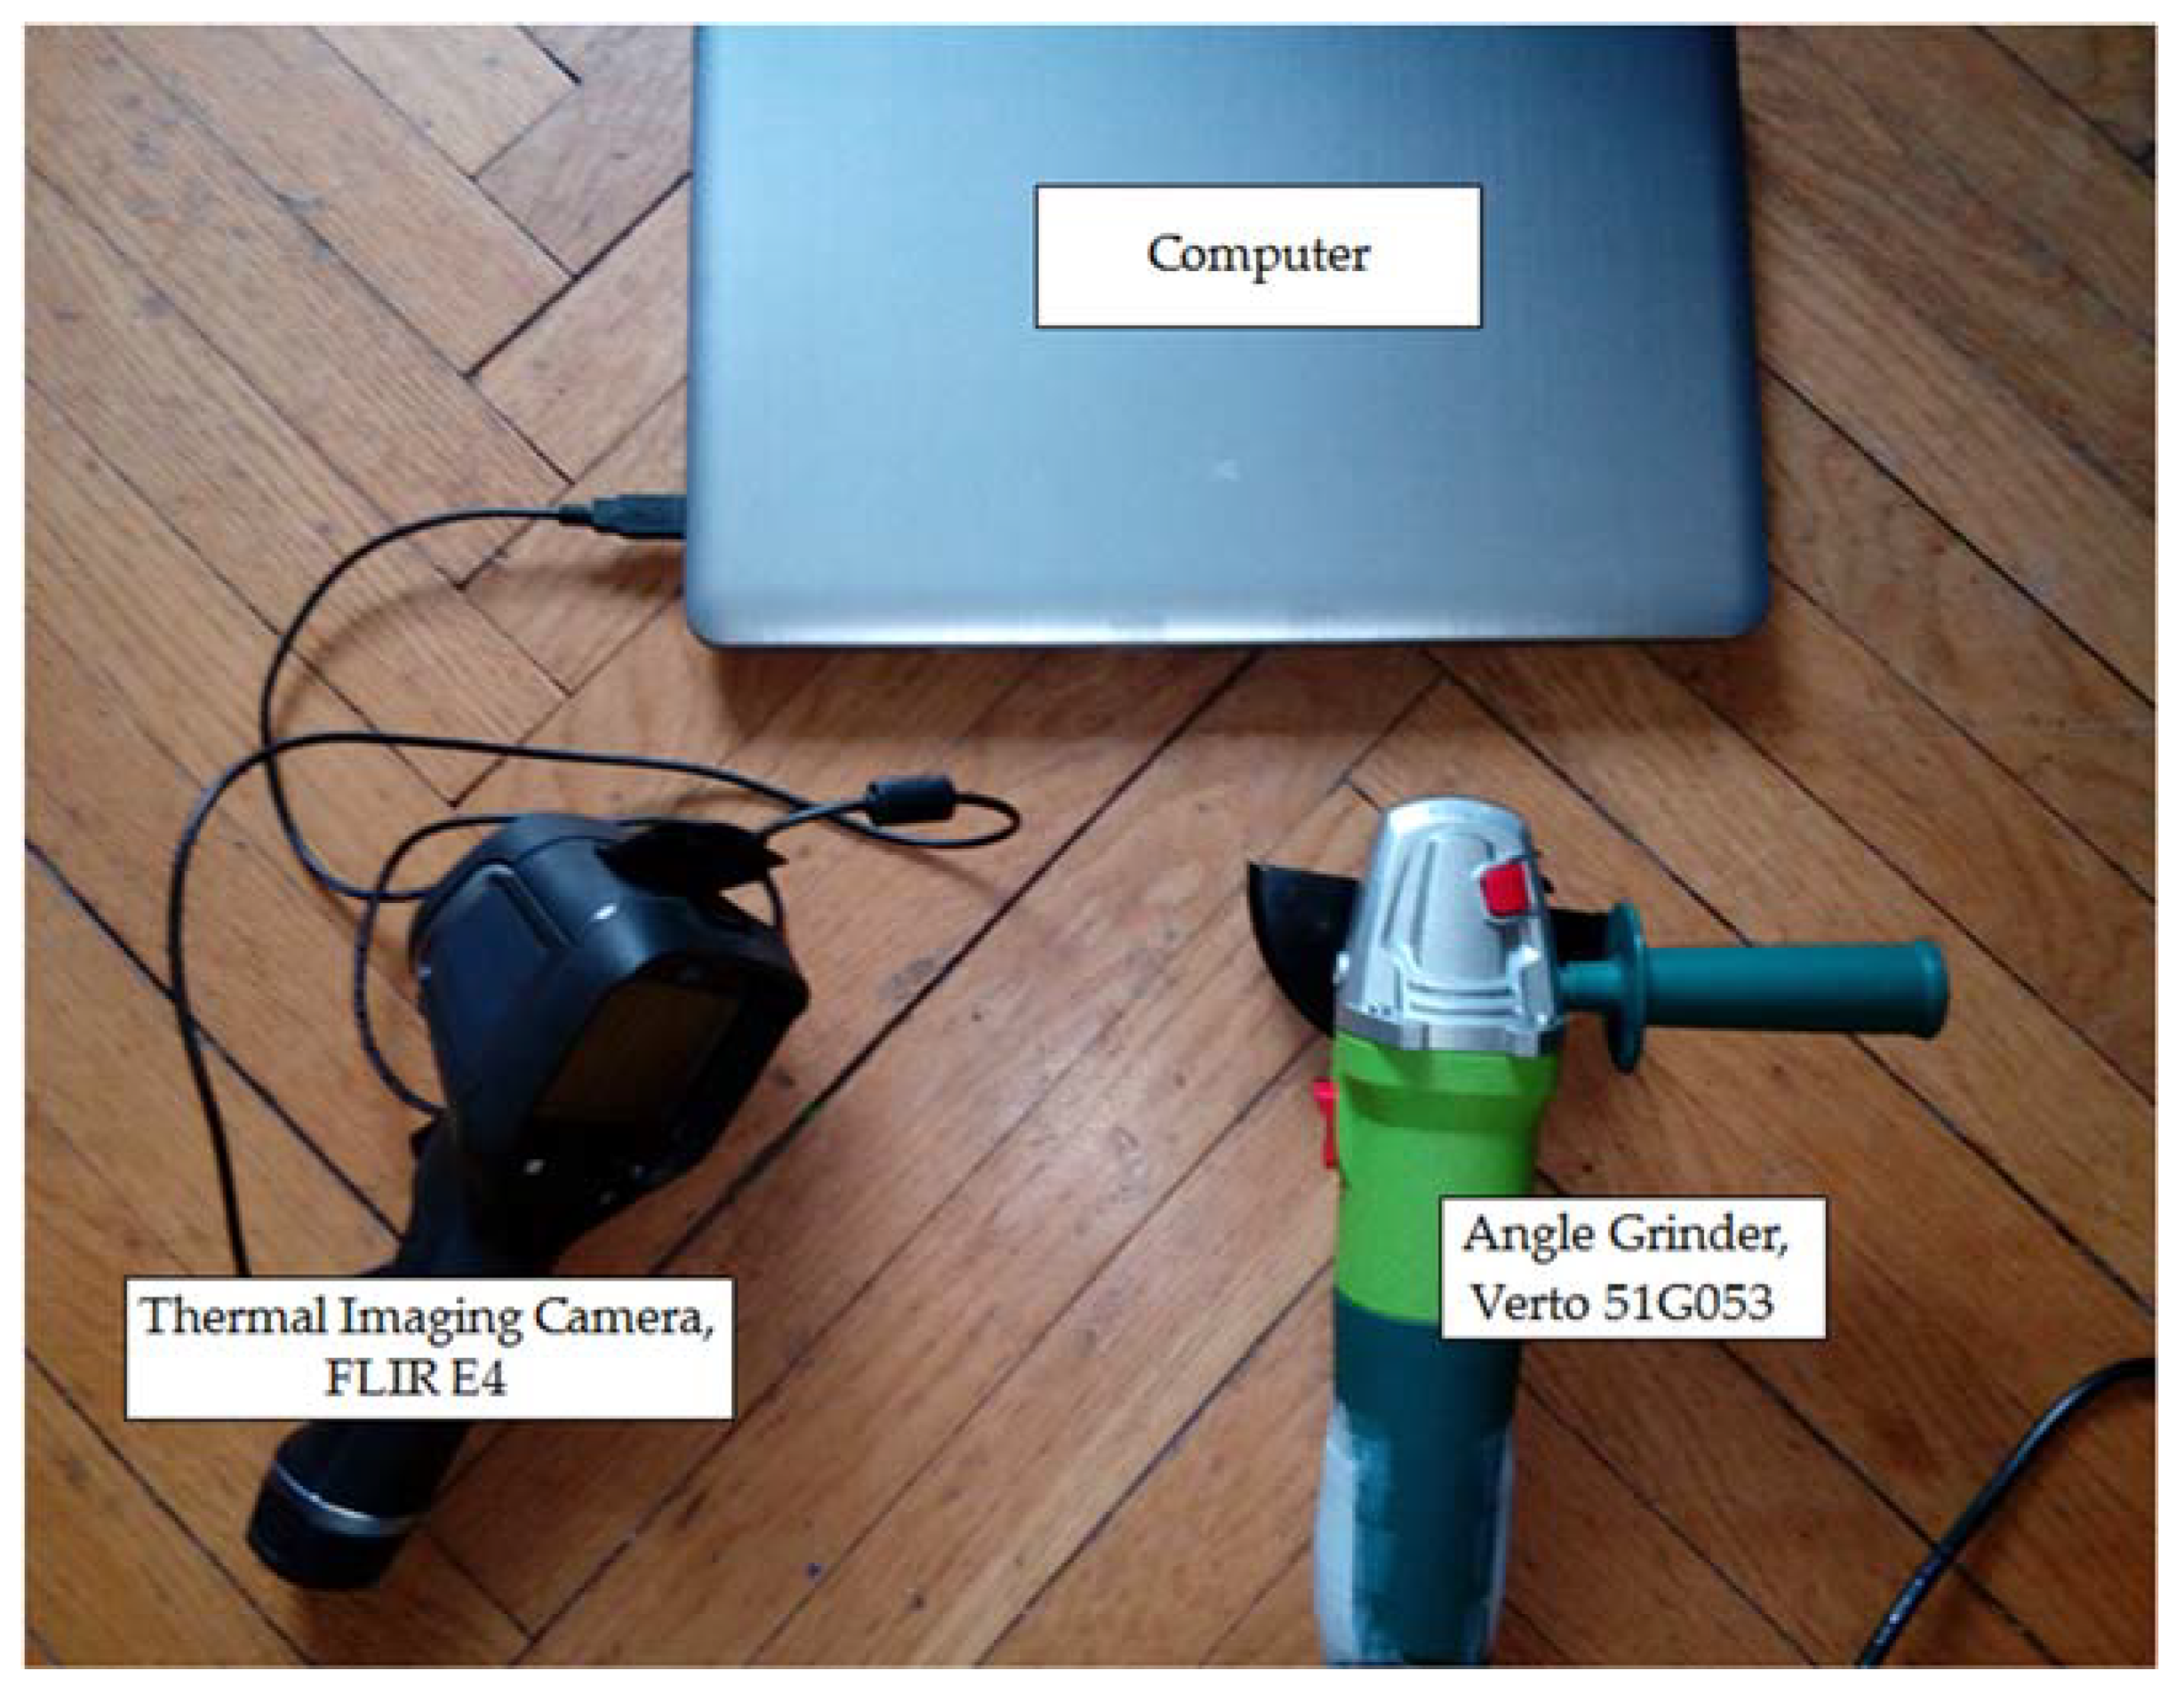
- The proposed method uses a computer and thermal imaging camera. The cost of the experimental setup is low (about 1400–1600$).
Funding
Institutional Review Board Statement
Informed Consent Statement
Data Availability Statement
Conflicts of Interest
References
- Jafari, A.; Faiz, J.; Jarrahi, M.A. A Simple and Efficient Current-Based Method for Interturn Fault Detection in BLDC Motors. IEEE Trans. Ind. Inform. 2021, 17, 2707–2715. [Google Scholar] [CrossRef]
- Purbowaskito, W.; Lan, C.Y.; Liu, M.K.; Fuh, K. A Novel Scheme on Fault Diagnosis of Induction Motors using Current per Voltage Bode Diagram. J. Chin. Soc. Mech. Eng. 2020, 41, 781–790. [Google Scholar]
- Liu, L.S.; Chen, L.Q.; Wang, Z.L.; Liu, D.T. Early Fault Detection of Planetary Gearbox Based on Acoustic Emission and Improved Variational Mode Decomposition. IEEE Sens. J. 2021, 21, 1735–1745. [Google Scholar] [CrossRef]
- Chen, L.; Choy, Y.S.; Tam, K.C.; Fei, C.W. Hybrid microphone array signal processing approach for faulty wheel identification and ground impedance estimation in wheel/rail system. Appl. Acoust. 2021, 172, 107633. [Google Scholar] [CrossRef]
- Meserkhani, A.; Jafari, S.M.; Rahi, A. Experimental comparison of acoustic emission sensors in the detection of outer race defect of angular contact ball bearings by artificial neural network. Measurement 2021, 168, 108198. [Google Scholar] [CrossRef]
- Motahari-Nezhad, M.; Jafari, S.M. ANFIS system for prognosis of dynamometer high-speed ball bearing based on frequency domain acoustic emission signals. Measurement 2020, 166, 108154. [Google Scholar] [CrossRef]
- Chen, B.; Xie, L.; Li, Y.Z.; Gao, B.C. Acoustical damage detection of wind turbine yaw system using Bayesian network. Renew. Energy 2020, 160, 1364–1372. [Google Scholar] [CrossRef]
- Glowacz, A. Recognition of acoustic signals of induction motor using Fft, Smofs-10 and LSVM. Eksploat. I Niezawodn. Maint. Reliab. 2015, 17, 569–574. [Google Scholar] [CrossRef]
- Glowacz, A. Fault diagnostics of acoustic signals of loaded synchronous motor using SMOFS-25-EXPANDED and selected classifiers. Teh. Vjesn. Tech. Gaz. 2016, 23, 1365–1372. [Google Scholar] [CrossRef] [Green Version]
- Glowacz, A.; Tadeusiewicz, R.; Legutko, S.; Caesarendra, W.; Irfan, M.; Liu, H.; Brumercik, F.; Gutten, M.; Sulowicz, M.; Daviu, J.A.; et al. Fault diagnosis of angle grinders and electric impact drills using acoustic signals. Applied Acoustics 2021, 179. [Google Scholar] [CrossRef]
- Inturi, V.; Shreyas, N.; Chetti, K.; Sabareesh, G.R. Comprehensive fault diagnostics of wind turbine gearbox through adaptive condition monitoring scheme. Appl. Acoust. 2021, 174, 107738. [Google Scholar] [CrossRef]
- Xing, S.B.; Lei, Y.G.; Wang, S.H.; Jia, F. Distribution-Invariant Deep Belief Network for Intelligent Fault Diagnosis of Machines Under New Working Conditions. IEEE Trans. Ind. Electron. 2021, 68, 2617–2625. [Google Scholar] [CrossRef]
- Ma, S.L.; Yuan, Y.; Wu, J.W.; Jiang, Y.; Jia, B.W.; Li, W.X. Multisensor Decision Approach for HVCB Fault Detection Based on the Vibration Information. IEEE Sens. J. 2021, 21, 985–994. [Google Scholar] [CrossRef]
- Barusu, M.R.; Deivasigamani, M. Non-Invasive Vibration Measurement for Diagnosis of Bearing Faults in 3-Phase Squirrel Cage Induction Motor Using Microwave Sensor. IEEE Sens. J. 2021, 21, 1026–1039. [Google Scholar] [CrossRef]
- Jeffali, F.; Ouariach, A.; El Kihel, B.; Nougaoui, A. Diagnosis of three-phase induction motor and the impact on the kinematic chain using non-destructive technique of infrared thermography. Infrared Phys. Technol. 2019, 102. [Google Scholar] [CrossRef]
- Li, Y.B.; Gu, J.X.; Zhen, D.; Xu, M.Q.; Ball, A. An Evaluation of Gearbox Condition Monitoring Using Infrared Thermal Images Applied with Convolutional Neural Networks. Sensors 2019, 19, 2205. [Google Scholar] [CrossRef] [Green Version]
- Al-Musawi, A.K.; Anayi, F.; Packianather, M. Three-phase induction motor fault detection based on thermal image segmentation. Infrared Phys. Technol. 2020, 104, 103140. [Google Scholar] [CrossRef]
- Morales-Perez, C.; Rangel-Magdaleno, J.; Peregrina-Barreto, H.; Ramirez-Cortes, J.; Vazquez-Pacheco, E. Bearing Fault Detection Technique by using Thermal Images: A case of Study. In Proceedings of the IEEE International Instrumentation and Measurement Technology Conference (I2MTC), Auckland, New Zealand, 20–23 May 2019; pp. 1797–1802. [Google Scholar]
- Misra, R.; Agarwal, A. Improving Motor Reliability by Thermal Imaging. In Proceedings of the IEEE International Conference on Sustainable Energy, Electronics, and Computing Systems (SEEMS), Greater Noida, India, 26–27 October 2018. [Google Scholar]
- Choudhary, A.; Shimi, S.L.; Akula, A. Bearing Fault Diagnosis of Induction Motor Using Thermal Imaging. In Proceedings of the International Conference on Computing, Power and Communication Technologies (GUCON), Greater Noida, India, 28–29 September 2018; pp. 950–955. [Google Scholar]
- Quattrocchi, A.; Freni, F.; Montanini, R. Self-heat generation of embedded piezoceramic patches used for fabrication of smart materials. Sens. Actuators A Phys. 2018, 280, 513–520. [Google Scholar] [CrossRef]
- Freni, F.; Quattrocchi, A.; Piccolo, S.A.; Montanini, R. Quantitative evaluation of eggs freshness using flash thermography. Quant. Infrared Thermogr. J. 2020, 17, 13–25. [Google Scholar] [CrossRef]
- Rani, M.F.H.; Razlan, Z.M.; Shahriman, A.B.; Ibrahim, Z.; Wan, W.K. Comparative study of surface temperature of lithium-ion polymer cells at different discharging rates by infrared thermography and thermocouple. Int. J. Heat Mass Transf. 2020, 153. [Google Scholar] [CrossRef]
- Duan, Z.H.; Wu, T.H.; Guo, S.W.; Shao, T.; Malekian, R.; Li, Z.X. Development and trend of condition monitoring and fault diagnosis of multi-sensors information fusion for rolling bearings: A review. Int. J. Adv. Manuf. Technol. 2018, 96, 803–819. [Google Scholar] [CrossRef] [Green Version]
- Zhang, Y.G.; Chen, B.; Pan, G.F.; Zhao, Y. A novel hybrid model based on VMD-WT and PCA-BP-RBF neural network for short-term wind speed forecasting. Energy Convers. Manag. 2019, 195, 180–197. [Google Scholar] [CrossRef]
- Gajewski, J.; Valis, D. The determination of combustion engine condition and reliability using oil analysis by MLP and RBF neural networks. Tribol. Int. 2017, 115, 557–572. [Google Scholar] [CrossRef]
- Nurmaini, S.; Partan, R.U.; Caesarendra, W.; Dewi, T.; Rahmatullah, M.N.; Darmawahyuni, A.; Bhayyu, V.; Firdaus, F. An Automated ECG Beat Classification System Using Deep Neural Networks with an Unsupervised Feature Extraction Technique. Appl. Sci. 2019, 9, 2921. [Google Scholar] [CrossRef] [Green Version]
- Sun, S.; Przystupa, K.; Wei, M.; Yu, H.; Ye, Z.; Kochan, O. Fast bearing fault diagnosis of rolling element using Levy Moth-Flame optimization algorithm and Naive Bayes. Eksploat. I Niezawodn. Maint. Reliab. 2020, 22, 730–740. [Google Scholar] [CrossRef]
- Ranjan, J.; Patra, K.; Szalay, T.; Mia, M.; Gupta, M.K.; Song, Q.H.; Krolczyk, G.; Chudy, R.; Pashnyov, V.A.; Pimenov, D.Y. Artificial Intelligence-Based Hole Quality Prediction in Micro-Drilling Using Multiple Sensors. Sensors 2020, 20, 885. [Google Scholar] [CrossRef] [Green Version]
- Peng, Y.H.; Albuquerque, P.H.M.; do Nascimento, I.F.; Machado, J.V.F. Between Nonlinearities. Complexity, and Noises: An Application on Portfolio Selection Using Kernel Principal Component Analysis. Entropy 2019, 21, 376. [Google Scholar] [CrossRef] [Green Version]
- Ye, B.G.; Qiu, T.R.; Bai, X.M.; Liu, P. Research on Recognition Method of Driving Fatigue State Based on Sample Entropy and Kernel Principal Component Analysis. Entropy 2018, 20, 701. [Google Scholar] [CrossRef] [Green Version]
- Li, Z.; Guan, X.R.; Zou, K.F.; Xu, C. Estimation of Knee Movement from Surface EMG Using Random Forest with Principal Component Analysis. Electronics 2020, 9, 43. [Google Scholar] [CrossRef] [Green Version]
- Geler, Z.; Kurbalija, V.; Ivanovic, M.; Radovanovic, M. Weighted kNN and constrained elastic distances for time-series classification. Expert Syst. Appl. 2020, 162, 113829. [Google Scholar] [CrossRef]
- Dong, Y.X.; Ma, X.J.; Fu, T.L. Electrical load forecasting: A deep learning approach based on K-nearest neighbors. Appl. Soft Comput. 2021, 99, 106900. [Google Scholar] [CrossRef]
- Ferreira, P.J.S.; Cardoso, J.M.P.; Mendes-Moreira, J. kNN Prototyping Schemes for Embedded Human Activity Recognition with Online Learning. Computers 2020, 9, 96. [Google Scholar] [CrossRef]
- Glowacz, A.; Glowacz, Z. Recognition of images of finger skin with application of histogram. image filtration and K-NN classifier. Biocybern. Biomed. Eng. 2016, 36, 95–101. [Google Scholar] [CrossRef]
- Xu, Z.; Huang, D.R.; Min, T.; Ou, Y.H. A Fault Diagnosis Method of Rolling Bearing Integrated with Cooperative Energy Feature Extraction and Improved Least-Squares Support Vector Machine. Math. Probl. Eng. 2020, 6643167. [Google Scholar] [CrossRef]
- Song, Q.S.; Yan, G.P.; Tang, G.W.; Ansari, F. Robust principal component analysis and support vector machine for detection of microcracks with distributed optical fiber sensors. Mech. Syst. Signal Process. 2021, 146, 107019. [Google Scholar] [CrossRef]
- Wang, J.; Shen, L.Z.; Bi, Y.H.; Lei, J.L. Modeling and optimization of a light-duty diesel engine at high altitude with a support vector machine and a genetic algorithm. Fuel 2021, 285, 119137. [Google Scholar] [CrossRef]
- Kim, J.S.; Choi, K.N.; Kang, S.W. Infrared Thermal Image-Based Sustainable Fault Detection for Electrical Facilities. Sustainability 2021, 13, 557. [Google Scholar] [CrossRef]
- Glowacz, A. Fault diagnosis of electric impact drills using thermal imaging. Measurement 2021, 171. [Google Scholar] [CrossRef]


| State of the Angle Grinder | RAG [%] |
|---|---|
| Healthy AG | 100 |
| AG with 1 blocked air inlet | 100 |
| AG with 2 blocked air inlets | 100 |
| TRAG [%] | |
| 3 states of the AG | 100 |
| State of the Angle Grinder | RAG [%] |
|---|---|
| Healthy AG | 100 |
| AG with 1 blocked air inlet | 100 |
| AG with 2 blocked air inlets | 100 |
| TRAG [%] | |
| 3 states of the AG | 100 |
| State of the Angle Grinder | RAG [%] |
|---|---|
| Healthy AG | 100 |
| AG with 1 blocked air inlet | 100 |
| AG with 2 blocked air inlets | 100 |
| TRAG [%] | |
| 3 states of the AG | 100 |
| State of the Angle Grinder | RAG [%] |
|---|---|
| Healthy AG | 100 |
| AG with 1 blocked air inlet | 100 |
| AG with 2 blocked air inlets | 100 |
| TRAG [%] | |
| 3 states of the AG | 100 |
| State of the Angle Grinder | RAG [%] |
|---|---|
| Healthy AG | 100 |
| AG with 1 blocked air inlet | 100 |
| AG with 2 blocked air inlets | 100 |
| TRAG [%] | |
| 3 states of the AG | 100 |
| State of the Angle Grinder | RAG [%] |
|---|---|
| Healthy AG | 100 |
| AG with 1 blocked air inlet | 97.7 |
| AG with 2 blocked air inlets | 97.7 |
| TRAG [%] | |
| 3 states of the AG | 98.5 |
Publisher’s Note: MDPI stays neutral with regard to jurisdictional claims in published maps and institutional affiliations. |
© 2021 by the author. Licensee MDPI, Basel, Switzerland. This article is an open access article distributed under the terms and conditions of the Creative Commons Attribution (CC BY) license (https://creativecommons.org/licenses/by/4.0/).
Share and Cite
Glowacz, A. Ventilation Diagnosis of Angle Grinder Using Thermal Imaging. Sensors 2021, 21, 2853. https://doi.org/10.3390/s21082853
Glowacz A. Ventilation Diagnosis of Angle Grinder Using Thermal Imaging. Sensors. 2021; 21(8):2853. https://doi.org/10.3390/s21082853
Chicago/Turabian StyleGlowacz, Adam. 2021. "Ventilation Diagnosis of Angle Grinder Using Thermal Imaging" Sensors 21, no. 8: 2853. https://doi.org/10.3390/s21082853
APA StyleGlowacz, A. (2021). Ventilation Diagnosis of Angle Grinder Using Thermal Imaging. Sensors, 21(8), 2853. https://doi.org/10.3390/s21082853