Article

Design and Characterization of Electrochemical Sensor for the Determination of Mercury(II) Ion in Real Samples Based upon a New Schiff Base Derivative as an Ionophore

by
Salman S. Alharthi
1,*,
Ahmed M. Fallatah
1 and
Hamed M. Al-Saidi
2
1
Department of Chemistry, College of Science, Taif University, P.O. Box 11099, Taif 21944, Saudi Arabia
2
Department of Chemistry, University College in Al–Jamoum, Umm Al–Qura University, Makkah 21955, Saudi Arabia
*
Author to whom correspondence should be addressed.
Sensors 2021, 21(9), 3020; https://doi.org/10.3390/s21093020
Submission received: 25 March 2021 / Revised: 19 April 2021 / Accepted: 20 April 2021 / Published: 25 April 2021
(This article belongs to the Section Chemical Sensors)

Abstract

:
The present paper provides a description of the design, characterization, and use of a Hg2+ selective electrode (Hg2+–SE) for the determination of Hg2+ at ultra-traces levels in a variety of real samples. The ionophore in the proposed electrode is a new Schiff base, namely 4-bromo-2-[(4-methoxyphenylimino)methyl]phenol (BMPMP). All factors affecting electrode response including polymeric membrane composition, concentration of internal solution, pH sample solution, and response time were optimized. The optimum response of our electrode was obtained with the following polymeric membrane composition (% w/w): PVC, 32; o-NPOE, 64.5; BMPMP, 2 and NaTPB, 1.5. The potentiometric response of Hg2+–SE towards Hg2+ ion was linear in the wide range of concentrations (9.33 × 10⁻⁸−3.98 × 10⁻³ molL–1), while, the limit of detection of the proposed electrode was 3.98 × 10⁻⁸ molL–1 (8.00 μg L–1). The Hg2+–SE responds quickly to Hg2+ ions as the response time of less than 10 s. On the other hand, the slope value obtained for the developed electrode was 29.74 ± 0.1 mV/decade in the pH range of 2.0−9.0 in good agreement with the Nernstian response (29.50 mV/decade). The Hg2+–SE has relatively less interference with other metal ions. The Hg2+–SE was used as an indicator electrode in potentiometric titrations to estimate Hg2+ ions in waters, compact fluorescent lamp, and dental amalgam alloy and the accuracy of the developed electrode was compared with ICP–OES measurement values. Moreover, the new Schiff base (BMPMP) was synthesized and characterized using ATR–FTIR, elemental analysis, 1H NMR, and 13C NMR. The PVC membranes containing BMPMP as an ionophore unloaded and loaded with Hg(II) are reported by scanning electron microscope images (SEM) along with energy-dispersive X-ray spectroscopy (EDX) spectra.

1. Introduction

Mercury exists in nature at trace and ultra-trace levels. However, it is one of the most toxic heavy metals on earth. Among the different valence states, Hg (II) is the most toxic even when present in very trace amounts [1]. Mercury can enter and accumulate in the human body through the food chain causing severe health problems such as vital organ damage, nervous system impairment, kidney failure, and cancer [2,3,4,5]. Thus, monitoring trace concentrations of this toxic element has become a vital necessity. Various analytical techniques have been developed and used for the determination of mercury species in different samples. These techniques include spectroscopic measurements in the UV-Vis region [6], cold vapor atomic absorption spectrometry (CV–AAS) [7], atomic emission spectroscopy (AES) [8], cold vapor atomic fluorescence spectrometry (CV-AFS) [9], measurements using inductively coupled plasma mass spectrometry (ICP–MS) [10], X-ray fluorescence [11], ion chromatography [12,13] and electrochemical sensors [14]. Despite the fact that these techniques have high sensitivity and accuracy, they have some disadvantages in terms of high costs, maintenance, and complicated data analysis. Furthermore, highly trained skilled technicians are needed for data interpretation and operation [15]. As a result, developing a simple, fast, low-cost, accurate, sensitive, and selective analytical technique is necessary. Since it is relatively inexpensive, simple to operate, and provides a real-time measurement, the ion-selective electrode (ISE) is one of the most popular electroanalytical techniques used to determine the concentration of a wide variety of metal ions in various samples such as food, soil, and waters. Therefore, ISE can monitor the change of activity of ion with time [16,17,18].
Many organic and inorganic compounds have been documented in the literature as ionophores for the synthesis of ion selective electrodes for the determination of Hg2+ ion in various samples over the last three decades. Crown ether derivatives [19,20], polyvinyl pyridine [21], calix[4]pyrrole amide derivative [22], calixarene derivatives [23,24,25,26,27,28], thiol functionalized ionic liquid [29], amines [30,31], thioureas [25,32], and dithio derivatives [33,34] have all been used as ionophores for designing ISEs of Hg2+ ions. It’s worth mentioning that, some ionic liquids, e.g., 1-n-butyl-3-methylimidazolium tetrafluoroborate (BMIMBF4) [35], polypyrrole (PPy) [36], O,O′-(2,2′-biphenylene)dithiophosphatepentyl (PenDTF) [37], 1-methyl-2-butylthioimidazolium combined with bis(trifluoromethanesulphonyl) imide [29], dimethylglyoxime [38], and 2-mercaptobenzimidazol (2MBI) [39] are widely employed as ionophores in ISEs of Hg(II) ions.
It is well known that Schiff bases can form stable complexes with most transition metal ions including mercury (II) ions [40,41]. Thus, many of these bases were prepared and used as ionophores for developing ISEs of mercury (II) [42,43,44,45,46]. Due to the good sensitivity of the selective electrodes dependent on Schiff bases, the present work will aim to prepare a new Schiff base and its use as a neutral ionophore for construction of Hg2+ selective electrode. Electrode membrane containing a new Schiff base will be characterized before and after loading Hg2+ ions using SEM micrographs and EDX spectra. The developed electrode will use for the determination of mercury in some real samples.

2. Experimental

2.1. Reagents and Chemicals

All reagents and chemicals used in this work were of analytical grade and used without further purification. Bromo-2-hydroxybenzaldehyde, 4-methoxyphenyl amine, o-nitro-phenyloctylether, sodium tetraphenylborate, high molecular weight polyvinyl chloride (PVC), and metal salts (as nitrates) were purchased from MilliporeSigma (Saint Louis, MO, USA). and used with no further purification. Organic solvents were obtained from Thermo Fisher Scientific (Hampton, NH, USA). All solutions were prepared using deionized water.

2.2. Instrumentation

A Perkin Elmer analyzer model 2400 (Waltham, MA, USA) was used for determining the elemental compositions of the BMPMP ligand. A 1H NMR and 13C NMR spectrum of the BMPMP ionophore was obtained in DMSO-d6 solvent using Bruker FT-NMR spectrometer (model DRX-500, Billerica, MA, USA). ATR-FTIR spectra of membrane used in Hg2+–SE was recorded in the range of 400–4000 cm–1 using JASCO 4600 FT-IR spectrometer (Tokyo, Japan). Samples were directly introduced using the unit of the attenuated total reflectance model ATR PRO ONE Single-Reflection. Morphological studies and elemental distributions on the synthesized electrode surface were investigated using a JEOL JEM-6390 scanning electron microscope combined with a unit of energy-dispersive X-ray spectroscopy (Peabody, MA, USA). Determination of concentration of mercury in aqueous solutions was carried out by Perkin Elmer ICP–OES spectrometry model Optima 2100 DV (Waltham, MA, USA). Acidic reaction (pH) measurements were performed using an advanced bench pH meter (model 3510, Jenway, Staffordshire, UK). pH–meter was calibrated by three different buffer solutions (pH 4.01-AD7004, pH 7.01-AD7007, and pH 10.01-AD7010). Potentiometric measurements (EMF, mV) of the designed Hg2+–SE were recorded under different conditions using a silver/silver chloride with Flexible Connector (MF-2052, RE-5B) filled with sodium chloride solution (3 molL–1) as an external reference electrode. The electrochemical cell used for carrying out potentiometric measurements consists of Ag(s), AgCl(s)/internal solution (1.0 × 10⁻² molL−1 Hg2+ ion in 0.1 molL–1 KCl)/ISE membrane/sample solution/pH glass electrode.

2.3. Synthesis of (4-Bromo-2-[(4-Methoxyphenyl-Imino)Methyl]Phenol, BMPMP

4-Bromo-2-[(4-methoxyphenylimino)methyl]phenol was synthesized according to the methodology reported in the literature [47]. A mixture of 4-methoxyphenyl amine (25 mmol) and 5-bromo-2-hydroxybenzaldehyde (25 mmol) was refluxed in methanol (50 mL) for 3 h at 70 °C. The precipitate was filtered, washed, and recrystallized by a mixture of methanol and diethyl ether. Yield, 0.259 g (71.7%), m.p.: 150 °C. MS: m/z 306.58 [M]+. Elemental analysis was carried out in duplicates; (CHN) for C14H12O2NBr (MW. 306.16): Calculated (C%, 54.92; H%, 3.95; N%, 4.57). Found (C%, 54.65; H%, 3.76; N%, 4.48). 1H NMR (500 MHz, DMSO-d6): δ = 2.60 (s, 3H, CH3), 7.55–7.98 (m, 7H, aromatic H), 9.05 (s, 1H, CH = N), 14.22 (s, 1H, OH). 13C-NMR (DMSO-d6, 500 Mz): δ = 67.00 (COCH3), 109.6 (Br-C), 112.4 (CHCHCOCH3), 119.1 (CHCHCOH), 121.6 (CHCCNC), 124.6 (NCCH), 129.7 (BrCHC), 133.7 (BrCHCH), 140.5 (NCCH), 157.1 (CHCOH), 159.8 (COCH3), 163.9 (CC = N) [supplementary file]. Scheme 1 shows the protocol of BMPMP synthesis.

2.4. Construction of Membrane Electrode

Nine membranes were prepared using the technique described in the literature, with different concentrations of polymer (PVC), ionophore (BMPMP), ionic additive (NaTPB), and plasticizer (o-NPOE). [42]. A mixture of previous components with various percentages shown in Table 1 was dissolved in 6 mL tetrahydrofuran (THF) with shaking for 5 min. The solution was transferred into a petri dish and left at room temperature (25 ± 2 °C) until solvent was evaporated. Thereafter, a tube with a diameter of 15 mm was immersed into the previous mixture for about 10 s to obtain a transparent membrane with the aid of an adhesive solution prepared by dissolving PVC in THF. After 24 h, the tube was separated from the mixture and filled with an internal solution of saturated KCl containing Hg(NO3)2 (1 × 10⁻³ molL–1). The internal reference electrode was Ag/AgCl electrode. The membranes were conditioned overnight in a solution of Hg(NO3)2 with a concentration of 110–2 molL–1.

2.5. Potentiometric Measurements

Potentiometric measurements were performed on the engineered PVC membranes, with the prepared Hg2+ selective electrode and reference electrode inserted in 50 mL of Hg(NO3)2 solution at concentration levels of 1.00 × 10⁻² to 1.00 × 10⁻⁸ molL–1 before the potential reading became stable. All measurements were carried out at 25 ± 2 °C and pH 6 with magnetic stirring. The potential of the electrochemical cell, including Hg2+–SE was calculated using the Nernst equation:
E c e l l = E o 2.303   R T z F l o g a
where Ecell, E°, R, T, and F are the potential of electrochemical cell potential, the standard potential, gas constant, absolute temperature, and Faraday constant, respectively, while, z is the ion charge, and a is its activity. The ion activities were calculated using Debye–Huckel equation [48]. Calibration curves of tested Hg2+–SEs were obtained by plotting Ecell in mV versus—log a Hg 2 + .

2.6. Selectivity Measurements

The potentiometric selectivity coefficients ( K H g , M p o t ) of the proposed Hg2+–SE against interfering ions were determined according to the separate solution method (SSM) [49]. It was conducted as follows: pH value of a solution of primary ion of Hg(NO3)2 (2.23 × 10⁻⁴ molL−1) was adjusted to an optimal value of 6.0 using HCl 1 molL−1 and/or NaOH 1 molL−1. A constant concentration of the interfering ion solution (2.23 × 10⁻⁴ molL−1) was added to a solution of primary ion of Hg(NO3)2 (2.23 × 10⁻⁴ molL−1) until the same potential change (ΔE) was achieved. For each interferent the selectivity factor K H g , M p o t was calculated using the following equation:
l o g k Hg , M p o t = E Hg E M 2.303 R T / Z A F + l o g a Hg l o g a M 1 / Z M
where EM is the standard potential of the interfering ion at the activity aM and EHg is the standard potential of the primary ion at the activity aM.

2.7. Potentiometric Titration

The PVC membrane achieved the optimized response was used for designing Hg2+ selective electrode (Hg2+–SE). The designed electrode (Hg2+–SE) was evaluated as an indicator electrode by the potentiometric titration of 60 mL of Hg(NO3)2 solution (2.00 × 10⁻³ molL–1) with standard EDTA solution (3.00 × 10⁻² molL–1). Calibration curve was employed to determine Hg2+ ion concentration accurately.

2.8. Preparation of Real Samples

Four real samples of tap water, sea water, compact fluorescent lamp, and dental amalgam alloy were used to evaluate the efficiency of Hg2+–SE as an indicator electrode for the potentiometric determination of Hg2+ ions.

2.8.1. Preparation of Water Samples

Tap water was sampled from laboratories of the department of chemistry, Taif University, KSA. Sea water was collected from the Red Sea, Jeddah City, western Saudi Arabia. Water samples were filtered through Whatman filter paper (No. 1 with a diameter of 150 mm). Each water sample was transferred into a clean 50-mL volumetric flask. The pH of samples was adjusted at 6 using a mixture of HCl and NaOH. The determination of Hg2+ ions in water samples was carried out at 25 ± 0.2 °C by potentiometric titration using the developed Hg2+–SE as an indicator electrode. For comparison, ICP-OES measurements were performed according to the method mentioned in [50].

2.8.2. Preparation of Compact Fluorescent Lamp

A compact fluorescent lamp sample was obtained from Alfanar Company, Riyadh city, KSA. The obtained sample was treated according to the mentioned procedure [51]. Briefly, the sample was digested using a mixture of concentrated nitric acid and H2O2 with a concentration of 30% for 1 h. The solution obtained after digestion was neutralized by NaOH (5 molL–1) and diluted to 50 mL. A part of solution was subjected to potentiometric titration using Hg2+–SE as an indicator electrode for the determination of mercury in a compact fluorescent lamp.

2.8.3. Preparation of a Dental Amalgam Alloy

A dental amalgam capsule alloy was purchased from Dentsply Sirona Company. According to the manufacturer, the alloy contains 33.0% Ag, 8.5% Sn, 16.5% Cu, and 42.0% Hg. An accurate weight of alloy was digested using HNO3 (20 mL, 60%) at 60–70 °C for 2 h. The residue was washed with deionized water and filtered into a 50-mL volumetric flask. The solution pH was adjusted at 6 using a mixture of HCl and NaOH solutions. The content of mercury in alloy was analyzed by standard addition method where change in voltage is monitored after each addition of the standard solution of Hg(NO3)2 (3.0 × 10⁻³ molL–1). Moreover, the mercury concentration in the dental amalgam sample was also determined using the ICP-OES method [6,45].

3. Results and Discussion

3.1. Optimization of PVC Membrane Compositions

BMPMP ligand, synthesized in this study, contains active sides (imine and phenolic OH) that may react with Hg (II) ions to form a stable complex. Therefore, this Schiff base was used as a new ionophore to prepare the selective electrode for Hg2+ ions. It was previously known that the potential of ion-selective electrodes (ISEs) is fundamentally dependent on the amount and nature of the ionophore, plasticizer, and lipophlic additives [52]. On the other hand, the plasticizer/PVC ratio plays a main role to obtain optimized response [53]. o-NPOE was chosen as plasticizer due to good solubility of membrane components as well as moderate dielectric constant while NaTPB was used as a lipophlic additive owing to its important role in increasing the sensitivity and selectivity of the electrode as well reduces anionic interference.
Thus, the impact of membrane composition on the performance of the proposed Hg2+–SE was investigated by designing nine ISEs containing different membranes as shown in Table 1. Calibration curves were plotted for each ISE and shown in Figure 1. Findings in Table 1 and Figure 1 reveal that the electrodes of ISE1 and ISE2 did not respond to the change in Hg2+ concentration. This behavior is most likely attributed to the absence of the BMPMP ionophore in the membrane matrix. However, membranes grafted with BMPMP as an ionophore provided better responses towards Hg2+ ion (ISEs 3–9). The response of these ISEs for Hg2+ ion may be attributed to interaction between Hg2+ ions and BMPMP molecule. ISE7 provided the optimized response where Nernstian slope was 29.78 ± 0.15 mV/decade in good agreement with the value of 29.5 mV/decade of the divalent ions. Moreover, ISE7 gives fast and linear response over a wide range of Hg2+ ion concentration (9.33 × 10⁻⁸–3.98 × 10⁻³ molL–1) with the detection limit of 3.98 × 10⁻⁸ molL–1 at optimized experimental conditions (Figure 2). Thus, PVC membrane of ISE7 was studied using ATR–FTIR, SEM micrographs, and EDX spectra before and after soaking in an aqueous solution of Hg2+ ions. The electrodes of ISE3, ISE4, ISE5, ISE6, ISE8, and ISE9 provided low performance compared with that of ISE7. This behavior is most likely attributed to saturation of membrane and its inhomogeneity [54]. The composition of ISE7 was selected for designing an ion-selective electrode for mercury determination in a variety of real samples.

3.2. ATR–FTIR Investigation of Hg2+–SE Membrane Based on BMPMP as an Ionophore

ATR–FTIR spectra of Hg2+–SE membrane containing optimized composition were recorded before and after using for sensing Hg2+ ions to obtain information on the ion–ligand interaction and specify the active sites available in BMPMP molecule that can coordinate with Hg2+ ion. A thin layer of membrane was used to record ATR–FTIR spectra shown in Figure 3. ATR–FTIR spectrum of PVC membrane that does not contain BMPMP was recorded and subtracted from the spectra shown in Figure 3A,B. Characteristics bands of PVC membrane before soaking with analyte solution (Figure 3A) are observed at 3400, 1642, 1523, and 1407 cm−1 corresponding to ν(O–H), ν(C = N), ν(C = C), and δ(O-CCH3), respectively. Significant changes in the spectrum of membrane loaded with Hg(II) indicate an interaction between BMPMP and Hg2+ ions in a PVC membrane matrix (Figure 3B). The disappearance of peak at 3400 cm−1 corresponding to ν(OH) and the appearance of a new peak of ν(Hg–O) at 549 cm−1 reveal that BMPMP ligand has coordinated with Hg2+ ions by the phenolic OH. Coordination of Hg2+ ions through nitrogen atom of BMPMP molecule is confirmed by the red shift of the ν(C = N) band from 1642 to 1600 cm−1 and the appearance of new peak at 510 cm−1 corresponding to ν(Hg–N) [55].

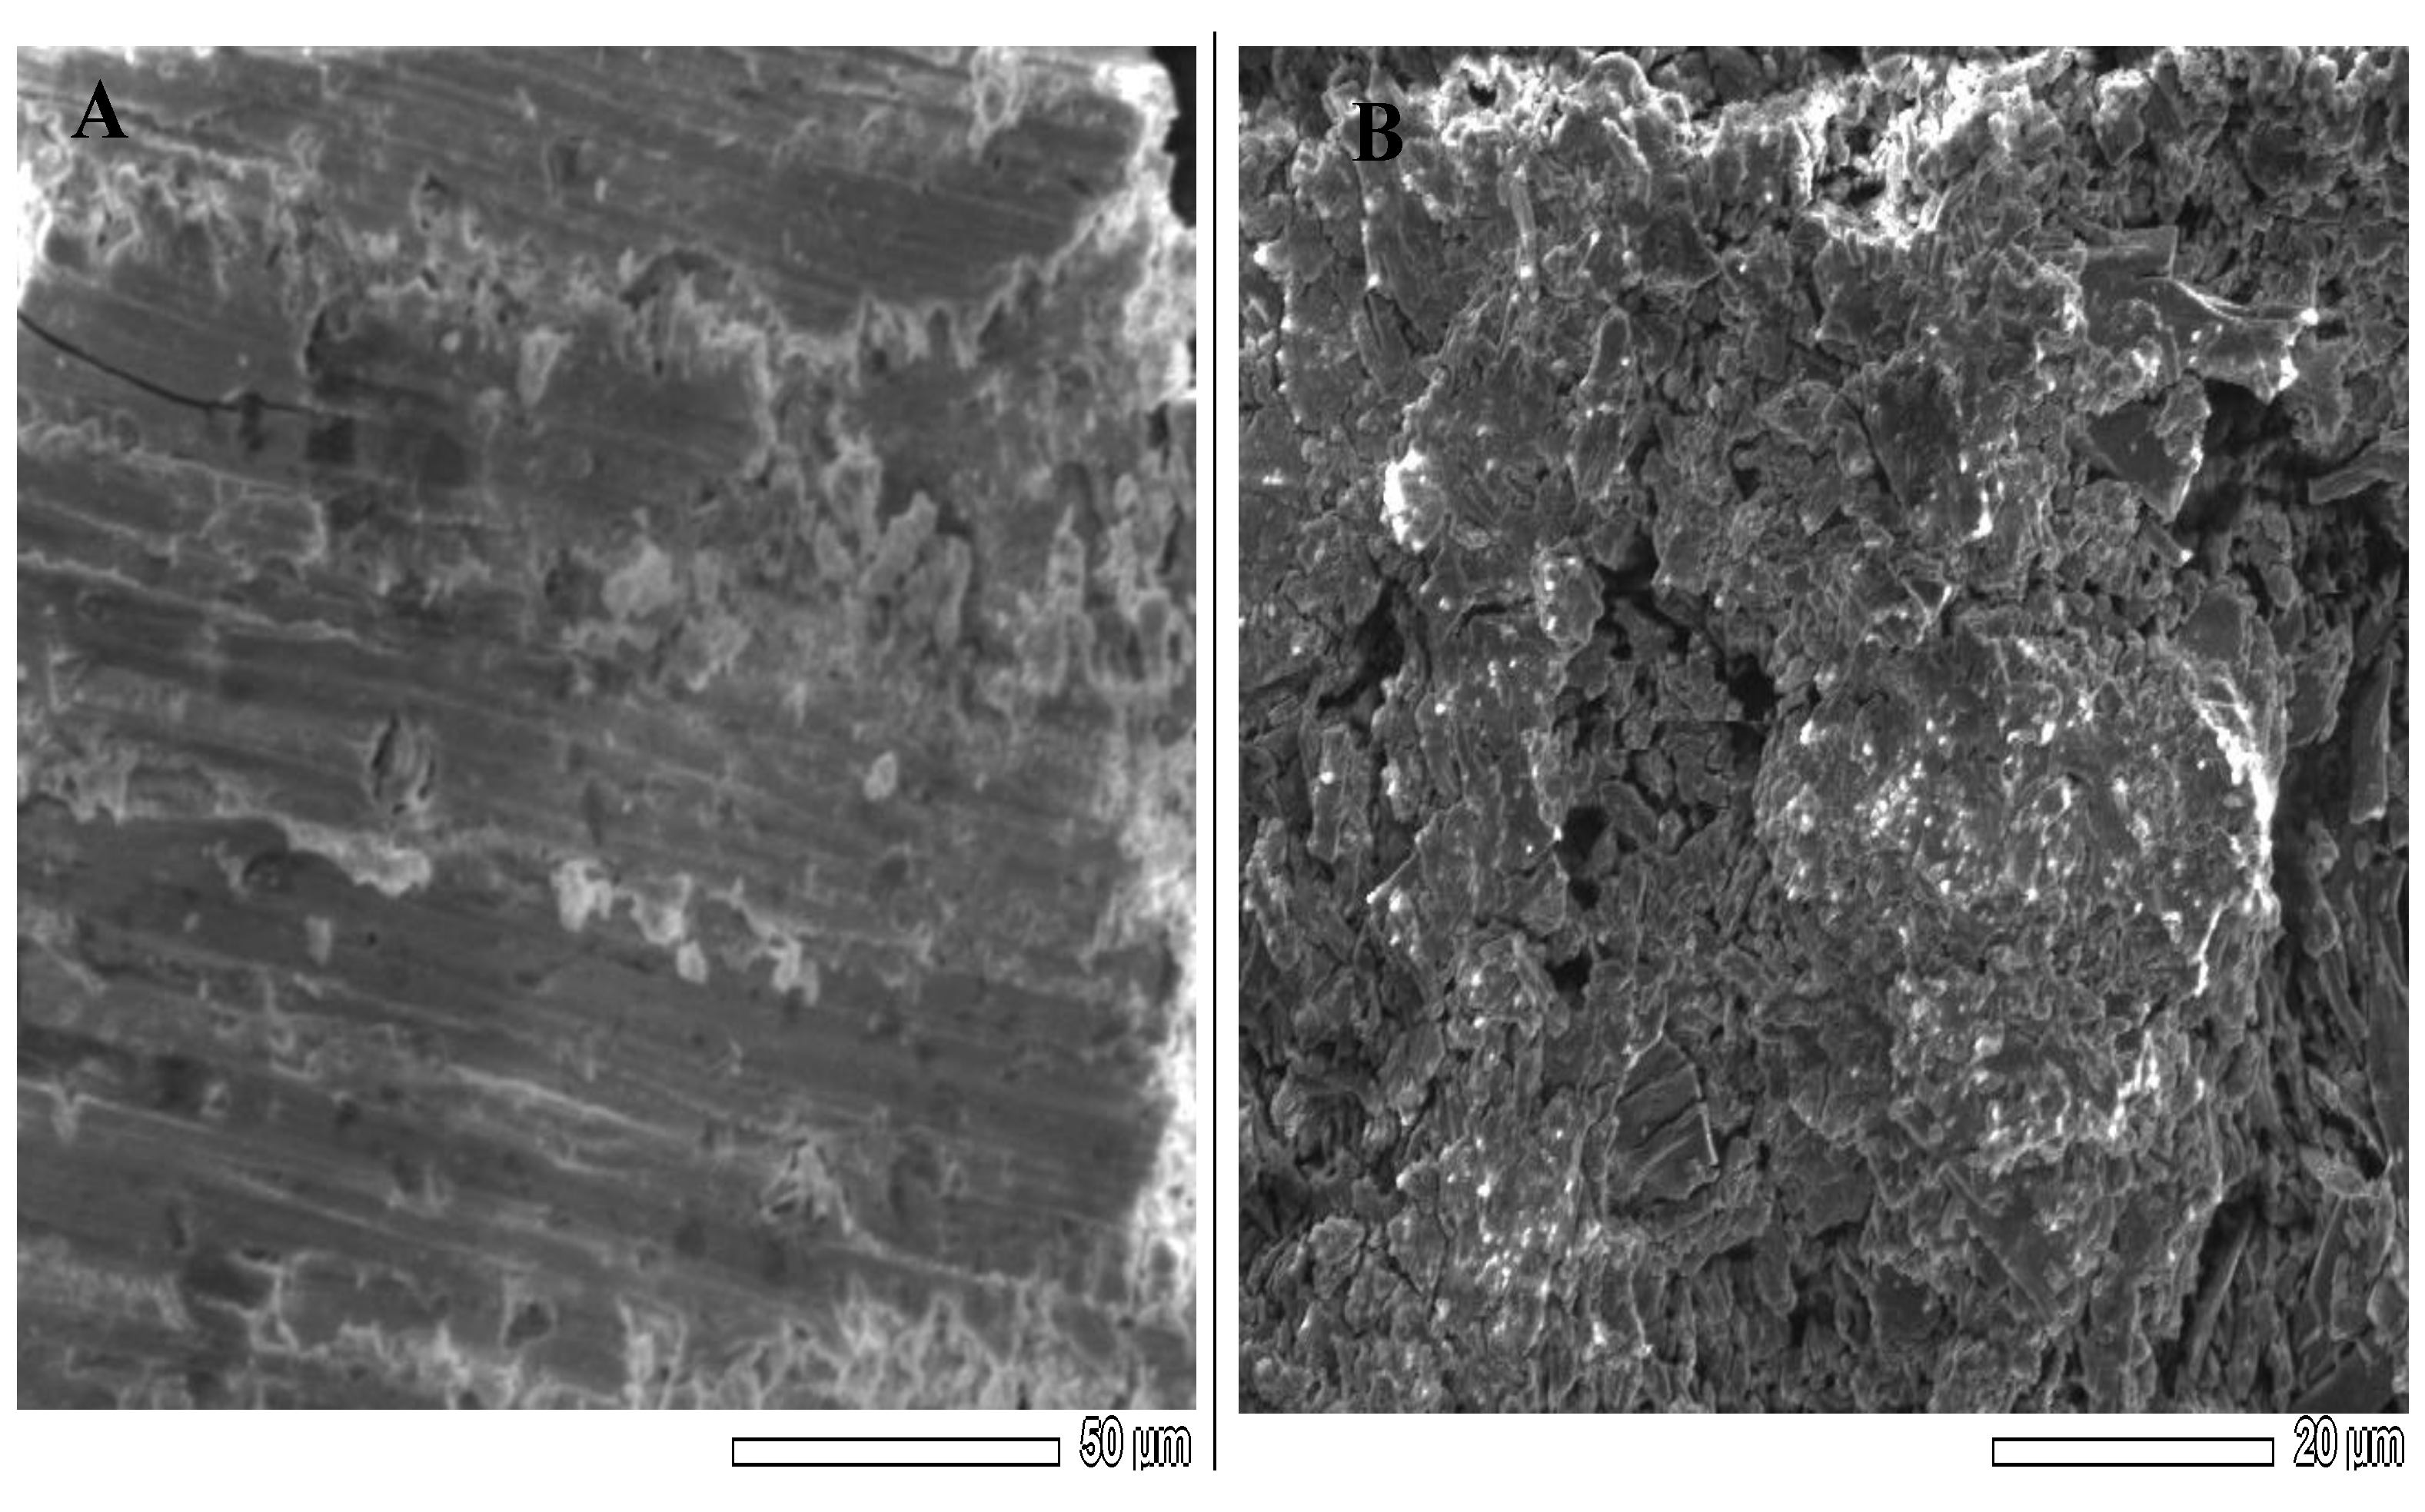
3.3. SEM-EDX Investigations of Hg2+–SE Membrane

The morphology of the PVC membrane containing BMPMP as the ionophore was studied by SEM images before being superimposed in the ISE. The SEM micrograph shows a microporous membrane (Figure 4A). The surface of the membrane is somewhat smooth with few small protrusions. There are significant changes in membrane morphology after soaking in an aqueous Hg2+ solution as demonstrated in Figure 4B. The surface of the electrode is rougher with white patches spreading over the surface of the membrane providing an indication of the presence of analyte in the membrane matrix. The presence of Hg2+ cation in the membrane used for sensing Hg2+ was confirmed by EDX analysis of SEM micrograph displayed in Figure 4B. The characteristic peaks of mercury at 1.7, 2.3, and 10.2 keV were observed in Figure 5A. EDX spectrum of control membrane was recorded and shown in Figure 5B for comparison. It should be noted that the absence of the Cl peak may be due to the leaching of anionic impurities [56,57].

3.4. The Influence of the Internal Solution Concentration

An aqueous solution of Hg(NO3)2 was employed as an internal solution in the developed Hg2+–SE. Therefore, the concentration influence of this solution on the potential of Hg2+–SE was studied in the range of 1.0 × 10⁻²–1.0 × 10⁻⁴ molL–1. The results outlined in Table 2 (Figure 6) reveal that the optimized slope, wide linear concentration range, lower detection limit, and fast response time were obtained with the concentration of 1.0 × 10⁻² molL–1. This is likely due to the high activity of Hg(NO3)2 solution at this concentration that enhanced the potential of Hg2+–SE. Thus, this concentration was employed in subsequent work.

3.5. The pH Effect on the Proposed Electrode Response

Two standard solutions containing 1.0 × 10⁻² and 1.0 × 10⁻³ molL–1 of Hg2+ ion were used to test the pH effect. The test solutions pH was adjusted to desired values (0.5–10.0) by adding HCl or NaOH (0.1 molL–1). Linear deficiency in the potential response was noticeable in pH range of 0.5 to 2 (Figure 7). However, the potential remains constant from pH 2.0 to 8.5. Then, a sharp deficiency was observed at higher pH values higher than 9. (Figure 7). The precipitation of Hg2+ ions as Hg(OH)2 at pH higher than 9 is a possible cause of this deficiency [58,59]. pH 6.0 was selected as the optimized value to adjust sample pH in the next work due to the fast response at this value.

3.6. Response Time of the Proposed Hg2+–SE

The response time of the proposed Hg2+–SE was investigated at a different concentration of Hg(NO3)2 (1.0 × 10⁻⁷ –1.0 × 10⁻⁴ molL–1). The potential versus response time was plotted in Figure 8. The response time of developed Hg2+–SE becomes fast upon the concentration increases. However, the response of the electrode reached a steady-state potential in less than 10 s after analyte addition. The steadiness attained in a short response time indicates fast kinetics of Hg2+ ions interaction with the ionophore (BMPMP) occurring at the test solution-membrane interphase to reach chemical equilibrium [60].

3.7. Life Time of the Proposed Hg2+–SE

Generally, the lifetime of ISE basically relies on the electrode compositions and the number of times of use [61]. The lifetime of our electrode was investigated by measuring the slope value weekly over a 16-week period (112 days). The results shown in Figure 9 reveal that there is no significant change in the slop value (29.78 mV/decade) during the first 10 weeks. Therefore, the developed Hg2+–SE can be used successfully during this period for determination of Hg2+ ions. However, the slope value of Hg2+–SE decreased dramatically from 22.85 after the twelfth week to 6.15 mV/decade at 16 weeks. The expected reason for the decrease in the value of the electrode slope over time is leaching plasticizer, ionophore, additive, or PVC as a matrix from the membrane into the sample solution during use [62].

3.8. Response of the Proposed Hg2+–SE towards Other Ions (Selectivity)

The selectivity coefficient ( K A , M p o t ) is used to describe the influence of interfering ions on the response of ISEs. When K A , M p o t is less than 1, ISE preferentially responds to primary ion (analyte). The selectivity coefficient of Hg(II)–SE ( K H g , M p o t ) was calculated according to IUPAC recommendations using the matched potential method. From findings in Table 3 and Figure 10, all tested metal ions have selectivity coefficient less than 3.0 × 10³ molL–1. Therefore, our electrode provides high selective to the Hg2+ ion in the presence of wide variety of cations.

3.9. Potentiometric Titrations Using Hg(II)-ISEs Based on BMPMP

The proposed Hg2+–SE based on BMPMP as an ionophore was employed as an indicator electrode in potentiometric titrations to test the electrode’s ability for monitoring mercury (II) concentration in aqueous solutions. Figure 11 shows potentiometric titration curve of 60 mL of Hg(NO3)2 (2.0 × 10³ molL–1) with 3.0 × 10² molL–1of EDTA as a titrant. As seen in Figure 11, the potential response before the end point remains almost steady, due to the low concentration of EDTA in the solution. After the end point, the potential response remains constant which is referred to the low concentration of free Hg2+ ions in the solution. The end point of the titration was found to be ~4.0 mL. This indicates that the developed Hg2+–SE at optimized conditions is a suitable analytical tool for the potentiometric determination of Hg2+ ion in aqueous solutions.

3.10. Analytical Applications

The accuracy of Hg2+–SE designed in this work was tested using a dental amalgam capsule alloy (Dentsply Sirona company). Mercury concentration in this alloy estimated by the proposed Hg2+–SE was 41.8% (w/w) with a small difference from certified value (42.0%). However, student’s t-test showed that no significant difference between the two concentrations at the 95% confidence level because the tabulated value of t (2.78) is greater than the calculated one (2.65) for five replicate measurements. Therefore, electrode accuracy is acceptable from the point of view of analytical chemistry. Four real samples shown in Table 4 were used to evaluate the developed electrode. All samples were treated as above—mentioned and part of their aqueous solutions was subjected to potentiometric measurements using the developed Hg2+–SE as an indicator electrode. All samples were analyzed before and after spiking with known concentrations of Hg(II) ions. According to the results shown in Table 4, it is clear that the recovered amounts of the mercury from the real samples were almost quantified. Moreover, the samples were analyzed using ICP-OES. The results of ICP-OES measurements were in good agreement with those of Hg2+–SE as shown in Table 4. The statistical evaluation using F–test has been applied, and the results revealed that no statistical difference between two methods where the calculated values of F were always less than the tabulated F value (3.179) for ten replicate measurements. Therefore, we can say that the precision of both methods is statistically acceptable and there is no significant difference between them at the 95% confidence level.

3.11. Comparison with Previous Studies

The efficiency of many ISEs that use different ionophores was compared with analytical performance of electrode developed in this study. Comparison shown in Table 5 includes slope, detection limit, working pH, and selectivity. The developed Hg2+–SE offers much better features than the electrodes mentioned in the comparison. Moreover, the analytical performance of the proposed electrode in terms of sensitivity, recovery, and linear concentration range was compared with different analytical techniques [63,64,65,66,67,68,69]. The Hg2+–SE designed in the present study provides better performance than some of the methods mentioned in Table 6 without the need to use the extraction or preconcentration methodology. Moreover, the proposed electrode can operate at a wide range of pH values, therefore, it is suitable for analysis without the need to adjust sample pH in most cases. The good selectivity of developed Hg2+–SE may be attributed to the PVC membrane composition containing BMPMP as an ionophore. BMPMP molecule serves as a selective ligand for Hg2+ ions.

4. Conclusions

For the first time, Schiff base (BMPMP) is synthesized and used as a neutral carrier to design a new PVC membrane for Hg2+ ions. The interaction between BMPMP and Hg2+ ions in the PVC membrane matrix was studied by ATR–FTIR spectra, SEM images, and EDX spectra. The study of ATR–FTIR spectra recorded using the electrode membrane revealed that the Hg2+ ion could be coordinated with a BMPMP molecule through nitrogen and oxygen atoms. The analysis of SEM images and EDX spectra confirmed the presence of analyte in the membrane matrix. The membrane composition of 32% PVC, 64.5% o-NPOE, 2% BMPMP, and 1.5% NaTPB provides a better analytical performance with high selectivity towards Hg2+ ions over a wide concentrations range 9.33 × 10⁻⁸–3.98 × 10⁻³ molL–1 (0.0933–3980 µM). The electrode developed in this work offers a relatively fast response, less interference, reasonable long-term stability, and potential stability. The fabricated electrode was successfully applied for the determination of Hg(II) in real samples.

Supplementary Materials

The following are available online at https://www.mdpi.com/article/10.3390/s21093020/s1.

Author Contributions

Data curation, H.M.A.-S.; Formal analysis, S.S.A.; Funding acquisition, A.M.F.; Investigation, S.S.A.; Methodology, S.S.A. and A.M.F.; Project administration, S.S.A.; Supervision, S.S.A.; Writing—original draft, S.S.A.; Writing—review & editing, S.S.A. and H.M.A.-S. All authors have read and agreed to the published version of the manuscript.

Funding

This paper was funded by a supportive program (Grant No. 1-438-5996) through of the deanship of scientific research at Taif University, Saudi Arabia.

Institutional Review Board Statement

Not Applicable.

Informed Consent Statement

Not Applicable.

Data Availability Statement

Not Applicable.

Acknowledgments

The authors are grateful to the Taif University for the financial support.

Conflicts of Interest

The authors declare no conflict of interest.

References

  1. Zhu, S.; Chen, B.; He, M.; Huang, T.; Hu, B. Speciation of mercury in water and fish samples by HPLC-ICP-MSafter magnetic solid phase extraction. Talanta 2017, 171, 213–219. [Google Scholar] [CrossRef] [PubMed]
  2. Cheng, H.; Wu, C.; Liu, J.; Xu, Z. Thiol-functionalized silica microspheres for online preconcentration and determination of mercury species in seawater by high performance liquid chromatography and inductively coupled plasma mass spectrometry. RSC Adv. 2015, 5, 19082–19090. [Google Scholar] [CrossRef]
  3. Gibb, M.; O’Leary, K.G. Mercury exposure and health impacts among individuals in the artisanal and small-scale goldmining community: A comprehensive review. Environ. Health Perspect. 2014, 122, 667–672. [Google Scholar] [CrossRef]
  4. Zhang, S.; Zhou, M. Comparison of DMA-80 and ICP-MS Combined with Closed-Vessel Microwave Digestion for the Determination of Mercury in Coal. J. Anal. Methods Chem. 2020, 2020, 1–9. [Google Scholar] [CrossRef]
  5. Du, J.; Jiang, L.; Shao, Q.; Liu, X.; Marks, R.S.; Ma, J.; Chen, X. Colorimetric Detection of Mercury Ions Based on Plasmonic Nanoparticles. Small 2013, 9, 1467–1481. [Google Scholar] [CrossRef] [PubMed]
  6. Hamza, A.; Bashammakh, A.; Al-Sibaai, A.; Al-Saidi, H.; El-Shahawi, M. Part 1. Spectrophotometric determination of trace mercury (II) in dental-unit wastewater and fertilizer samples using the novel reagent 6-hydroxy-3-(2-oxoindolin-3-ylideneamino)-2-thioxo-2H-1,3-thiazin-4(3H)-one and the dual-wavelength β-correction spectrophotometry. J. Hazard. Mater. 2010, 178, 287–292. [Google Scholar] [CrossRef]
  7. Yang, L.-L.; Zhang, D.-Q.; Zhou, Q.-X. Determination of Mercury in Biological Tissues by Graphite-furnace Atomic Absorption Spectrometry with an in-situ Concentration Technique. Anal. Sci. 2002, 18, 811–814. [Google Scholar] [CrossRef] [PubMed] [Green Version]
  8. Shekhar, R. Improvement of sensitivity of electrolyte cathode discharge atomic emission spectrometry (ELCAD-AES) for mercury using acetic acid medium. Talanta 2012, 93, 32–36. [Google Scholar] [CrossRef]
  9. Ai, X.; Wang, Y.; Hou, X.D.; Yang, L.; Zheng, C.B.; Wu, L. Advanced oxidation using Fe3O4 magnetic nanoparticles and its application in mercury speciation analysis by high performance liquid chromatography–cold vapor generation atomic fluorescence spectrometry. Analyst 2013, 138, 3494–3501. [Google Scholar] [CrossRef] [PubMed]
  10. Fong, B.M.W.; Siu, T.S.; Lee, J.S.K.; Tam, S. Determination of Mercury in Whole Blood and Urine by Inductively Coupled Plasma Mass Spectrometry. J. Anal. Toxicol. 2007, 31, 281–287. [Google Scholar] [CrossRef] [Green Version]
  11. Aranda, P.R.; Colombo, L.; Perino, E.; De Vito, I.E.; Raba, J. Solid-phase preconcentration and determination of mercury(II) using activated carbon in drinking water by X-ray fluorescence spectrometry. X-ray Spectrom. 2013, 42, 100–104. [Google Scholar] [CrossRef]
  12. Liu, Q. Determination of mercury and methylmercury in seafood by ion chromatography using photo-induced chemical vapor generation atomic fluorescence spectrometric detection. Microchem. J. 2010, 95, 255–258. [Google Scholar] [CrossRef]
  13. de Souza, S.S.; Campiglia, A.D.; Junior, F.B. A simple method for methylmercury, inorganic mercury and ethylmercury determination in plasma samples by high performance liquid chromatography-cold-vapor-inductively coupled plasma mass spectrometry. Anal. Chim. Acta 2013, 761, 11–17. [Google Scholar] [CrossRef] [PubMed]
  14. Yuan, S.; Peng, D.; Song, D.; Gong, J. Layered titanate nanosheets as an enhanced sensing platform for ultrasensitive stripping voltammetric detection of mercury(II). Sens. Actuators B Chem. 2013, 181, 432–438. [Google Scholar] [CrossRef]
  15. Silva, M.F.; Tóth, I.V.; Rangel, A.O. Determination of mercury in fish by cold vapor atomic absorption spectrophotometry using a multicommuted flow injection analysis system. Anal. Sci. 2006, 22, 861–864. [Google Scholar] [CrossRef] [Green Version]
  16. Cui, J.; Lisak, G.; Strzalkowska, S.; Bobacka, J. Potentiometric sensing utilizing paper-based microfluidic sampling. Analyst 2014, 139, 2133–2136. [Google Scholar] [CrossRef] [Green Version]
  17. Gupta, V.K.; Ganjali, M.R.; Norouzi, P.; Khani, H.; Nayak, A.; Agarwal, S. Electrochemical Analysis of Some Toxic Metals by Ion–Selective Electrodes. Crit. Rev. Anal. Chem. 2011, 41, 282–313. [Google Scholar] [CrossRef]
  18. Cui, L.; Wu, J.; Ju, H. Electrochemical sensing of heavy metal ions with inorganic, organic and bio-materials. Biosens. Bioelectron. 2014, 63, 276–286. [Google Scholar] [CrossRef] [PubMed]
  19. Gupta, V.K.; Jain, S.; Khurana, U. A PVC-based pentathia-15-crown-5 membrane potentiometric sensor for mercury(II). Electroanalysis 1997, 9, 478–480. [Google Scholar] [CrossRef]
  20. Javanbakht, M.; Ganjali, M.R.; Eshghi, H.; Sharghi, H.; Shamsipur, M. Mercury(II) ion-selective electrode based on dibenzodiazathia-18-crown-6-dione. Electroanalysis 1999, 11, 81–84. [Google Scholar] [CrossRef]
  21. Bakhtiarzadeh, F.; Ghani, S.A. An ion selective electrode for mercury (II) based on mercury (II) complex of poly (4-vinyl pyridine). J. Electroanal. Chem. 2008, 624, 139–143. [Google Scholar] [CrossRef]
  22. De Namor, A.F.D.; El Gamouz, A.; Alharthi, S.; Al Hakawati, N.; Varcoe, J.R. A ditopic calix[4]pyrrole amide derivative: Highlighting the importance of fundamental studies and the use of NaPh4B as additive in the design and applications of mercury(ii) ion selective electrodes. J. Mater. Chem. A 2015, 3, 13016–13030. [Google Scholar] [CrossRef] [Green Version]
  23. Lu, J.; Tong, X.; He, X. A mercury ion-selective electrode based on a calixarene derivative containing the thiazole azo group. J. Electroanal. Chem. 2003, 540, 111–117. [Google Scholar] [CrossRef]
  24. De Namor, A.F.D.; Alharthi, S.; El Gamouz, A.; Al Hakawati, N.; Cox, B.G. Calix[4] based Hg(II) ion selective electrodes: A thermodynamic protocol to address the selectivity versus the hosting capacity paradigm in the selection of the carrier. Electrochim. Acta 2018, 290, 686–694. [Google Scholar] [CrossRef]
  25. Perez-Marin, L.; Otazo-Sanchez, E.; Macedo-Miranda, G.; Avila-Perez, P.; Chamaro, J.A.; Lopez-Valdivia, H.L. Mercury (II) ion-selective electrode. Study of 1,3-diphenylthiourea as ionophore. Analyst 2000, 125, 1787–1790. [Google Scholar] [CrossRef]
  26. Gupta, V.K.; Sethi, B.; Sharma, R.; Agarwal, S.; Bharti, A. Mercury selective potentiometric sensor based on low rim functionalized thiacalix [4]-arene as a cationic receptor. J. Mol. Liq. 2013, 177, 114–118. [Google Scholar] [CrossRef]
  27. Mahajan, R.K.; Kaur, R.; Kaur, I.; Sharma, V.; Kumar, M. Mercury(II) ion-selective electrodes based on p-tert-butyl calix[4]crowns with imine units. Anal. Sci. 2004, 20, 811–814. [Google Scholar] [CrossRef] [Green Version]
  28. Kim, Y.; Kim, J.; Kim, K.N.; Chang, S.-K.; Chung, T.D. Potentiometric Response of a Neutral-carrier-based Membrane to Aqueous Mercury in Cl--rich Media. Anal. Sci. 2009, 25, 567–570. [Google Scholar] [CrossRef] [Green Version]
  29. Miao, J.; Wang, X.; Fan, Y.; Li, J.; Zhang, L.; Hu, G.; He, C.; Jin, C. Determination of total mercury in seafood by ion-selective electrodes based on a thiol functionalized ionic liquid. J. Food Drug Anal. 2018, 26, 670–677. [Google Scholar] [CrossRef] [Green Version]
  30. Gupta, V.K.; Chandra, S.; Lang, H. A highly selective mercury electrode based on a diamine donor ligand. Talanta 2005, 66, 575–580. [Google Scholar] [CrossRef]
  31. Abu-Shawish, H.M. A mercury(II) selective sensor based on N,N′-bis(salicylaldehyde)-phenylenediamine as neutral carrier for potentiometric analysis in water samples. J. Hazard. Mater. 2009, 167, 602–608. [Google Scholar] [CrossRef] [PubMed]
  32. Jumal, J.; Yamin, B.M.; Ahmad, M.A.; Heng, L.Y. Mercury Ion-Selective Electrode with Self-plasticizing Poly(n–buthylacrylate) Membrane Based On 1,2-Bis-(N’–benzoyl-thioureido) cyclohexane As Ionophore. Apcbee Procedia 2012, 3, 116–123. [Google Scholar] [CrossRef] [Green Version]
  33. Júarez-Gómez, J.; Ramírez-Silva, M.T.; Romero-Romo, M.; Rodríguez-Sevilla, E.; Pérez-García, F.; Palomar-Pardavé, M. Ion-Selective Electrodes for Mercury Determination at Low Concentrations: Construction, Optimization and Application. J. Electrochem. Soc. 2016, 163, B90–B96. [Google Scholar] [CrossRef]
  34. Patel, B.; Kumar, A.; Menon, S.K. Mercury selective membrane electrode based on dithio derivatized macrotricyclic compound. J. Incl. Phenom. Macrocycl. Chem. 2009, 64, 101–108. [Google Scholar] [CrossRef]
  35. Khani, H.; Rofouei, M.K.; Arab, P.; Gupta, V.K.; Vafaei, Z. Multi-walled carbon nanotubes-ionic liquid-carbon paste electrode as a super selectivity sensor: Application to potentiometric monitoring of mercury ion(II). J. Hazard. Mater. 2010, 183, 402–409. [Google Scholar] [CrossRef] [PubMed]
  36. Mai, P.T.N.; Hoa, P.T. Fabrication of solid contact ion selective electrode for mercury (II) using conductive polymer membrane (polypyrrole-PPy). Mater. Trans. 2015, 56, 1428–1430. [Google Scholar] [CrossRef] [Green Version]
  37. Juarez-Gomez, J.; Perez-Garcia, F.; Ramirez-Silva, M.; Rojas-Hernandez, A.; Galan-Vidal, C.; Paez-Hernandez, M. Solid-contact Hg(II)-selective electrode based on a carbon-epoxy composite containing a new dithiophosphate-based ionophore. Talanta 2013, 114, 235–242. [Google Scholar] [CrossRef]
  38. Ahmed, H.M.; Aboul-Enein, H.Y. New Simple Ion-Selective Membrane Electrode for Serious Environmental Pollutant, Mercury (II), Analysis in Aqueous Solution, Fluorescent Mercury Lamp White Dust, Mercurochrome and Dental Alloy. Curr. Anal. Chem. 2018, 14, 36–42. [Google Scholar] [CrossRef]
  39. Han, W.-S.; Wi, K.-C.; Park, W.-S.; Hong, T.-K. Mercury ion selective poly(aniline) solid contact electrode based on 2-mercaptobenzimidazol ionophore. Russ. J. Electrochem. 2012, 48, 525–531. [Google Scholar] [CrossRef]
  40. Salib, K.A.R.; Stefan, S.L.; Abu El-Wafa, S.M.; El-Shafiy, H.F. Metal complexes of novel symmetrical schiff base ligands. Synth. React. Inorg. Met. Chem. 2001, 31, 895–915. [Google Scholar] [CrossRef]
  41. Mishra, P.; Soni, M. Synthesis, Structural, and biological studies of some Schiff bases and their metal complexes. Met. Based Drugs 2008, 7, 2008. [Google Scholar] [CrossRef] [PubMed] [Green Version]
  42. Mashhadizadeh, M.H.; Sheikhshoaie, I. Mercury (II) ion-selective polymeric membrane sensor based on a recently synthesized Schiff base. Talanta 2003, 60, 73–80. [Google Scholar] [CrossRef]
  43. Mahajan, R.K.; Kaur, I.; Lobana, T.S. A mercury (II) ion-selective electrode based on neutral salicylaldehyde thiosemicarbazone. Talanta 2003, 59, 101–105. [Google Scholar] [CrossRef]
  44. Xu, L.; Yuan, R.; Chai, Y.-Q. Mercury(II) ion Potentiometric Sensor Based on a Sulfur Schiff’s Base 1-(2-Hydroxy-1,2-diphenylethylidene)thiosemicarbazide as Ionophore. Chem. Lett. 2005, 34, 440–441. [Google Scholar] [CrossRef]
  45. Gupta, V.; Singh, A.; Al Khayat, M.; Gupta, B. Neutral carriers based polymeric membrane electrodes for selective determination of mercury (II). Anal. Chim. Acta 2007, 590, 81–90. [Google Scholar] [CrossRef]
  46. Zhang, M.; Wu, X.; Chai, Y.Q.; Yuan, R.; Ye, G.R. A Novel Ion-Selective Electrode for Determination of the Mercury(II) Ion Based on Schiff Base as a Carrier. J. Chin. Chem. Soc. 2008, 55, 1345–1350. [Google Scholar] [CrossRef]
  47. Refat, M.S.; El-Sayed, M.Y.; Adam, A.M.A. Cu(II), Co(II) and Ni(II) complexes of new Schiff base ligand: Synthesis, thermal and spectroscopic characterizations. J. Mol. Struct. 2013, 1038, 62–72. [Google Scholar] [CrossRef]
  48. Debye, P.; Huckel, E. The theory of electrolytes. I. Freezing point depression and related phenomena. Phys. Z. 1923, 24, 185–206. [Google Scholar]
  49. Buck, R.P.; Lindner, E.; Kutner, W.; Inzelt, G. Piezoelectric chemical sensors (IUPAC Technical Report). Pure Appl. Chem. 2004, 76, 1139–1160. [Google Scholar] [CrossRef]
  50. Afkhami, A.; Bagheri, H.; Khoshsafar, H.; Saber-Tehrani, M.; Tabatabaee, M.; Shirzadmehr, A. Simultaneous trace-levels determination of Hg(II) and Pb(II) ions in various samples using a modified carbon paste electrode based on multi-walled carbon nanotubes and a new synthesized Schiff base. Anal. Chim. Acta 2012, 746, 98–106. [Google Scholar] [CrossRef]
  51. Kaushal, S.; Badru, R.; Kumar, S.; Mittal, S.K.; Singh, P. Fabrication of a mercury(II) ion selective electrodebased on poly-o-toluidine–zirconiumphosphoborate. RSC Adv. 2016, 6, 3150–3158. [Google Scholar] [CrossRef]
  52. Soleymanpour, A.; Shafaatian, B.; Hanifi, A.; Jarrahpour, A.A. Construction of a Solid Contact Polymeric Membrane Electrode for pH Measurements in Acidic Media. J. Electrochem. Soc. 2013, 161, B14–B18. [Google Scholar] [CrossRef]
  53. Gurtova, O.; Ye, L.; Chmilenko, F. Potentiometric propranolol-selective sensor based on molecularly imprinted polymer. Anal. Bioanal. Chem. 2012, 405, 287–295. [Google Scholar] [CrossRef] [PubMed]
  54. Demiral, A.; Dogan, A.; Cancel, E.; Memon, S.; Yilmaz, M.; Kilic, E. Hydrogen ion-selective poly(vinyl chloride) membrane electrode based on a p-tert-butylcalix[4]arene-oxacrown-4. Talanta 2004, 62, 123–129. [Google Scholar] [CrossRef]
  55. Nakamoto, K. Infrared and Raman Spectra of Inorganic and Coordination Compounds, 3rd ed.; Wiley: New York, NY, USA, 1978; p. 305. [Google Scholar]
  56. Socrstes, G. Infrared Characteristics Group Frequencies, 3rd ed.; John Wiley & Sons: Chichester, UK, 1980; p. 145. [Google Scholar]
  57. Li, X.-Q.; Liang, H.-Q.; Cao, Z.; Xiao, Q.; Xiao, Z.-L.; Song, L.-B.; Chen, D.; Wang, F.-L. Simple and rapid mercury ion selective electrode based on 1-undecanethiol assembled Au substrate and its recognition mechanism. Mater. Sci. Eng. C 2017, 72, 26–33. [Google Scholar] [CrossRef]
  58. Cotton, F.A.; Wilkinson, G. Quimica Inorganica Avanzada, 4th ed.; Editorial Limusa: Mexico City, Mexico, 1996; pp. 731–732. [Google Scholar]
  59. Gupta, V.; Jain, A.; Kumar, P.; Agarwal, S.; Maheshwari, G. Chromium(III)-selective sensor based on tri-o-thymotide in PVC matrix. Sens. Actuators B Chem. 2006, 113, 182–186. [Google Scholar] [CrossRef]
  60. Abu Ismaiel, A.; Aroua, M.K.; Yusoff, R. A New Electrochemical Sensor Based on Task-Specific Ionic Liquids-Modified Palm Shell Activated Carbon for the Determination of Mercury in Water Samples. Sensors 2014, 14, 13102–13113. [Google Scholar] [CrossRef]
  61. Ganjali, M.R.; Ghafarloo, A.; Faridbod, F.; Norouzi, P. Copper-Selective PVC Membrane Sensor. Int. J. Electrochem. Sci. 2012, 7, 3706–3716. [Google Scholar]
  62. Sadeghi, S.; Dashti, G.R.; Shamsipur, M. Lead-selective poly(vinyl cholride) membrane electrode based on piroxicam as a neutral carrier. Sens. Actuators B Chem. 2002, 81, 223–228. [Google Scholar] [CrossRef]
  63. Xing, Y.; Han, J.; Wu, X.; Pierce, D.T.; Zhao, J.X. Aggregation-based determination of mercury(II) using DNA-modified single gold nanoparticle, T-Hg(II)-T interaction, and single-particle ICP-MS. Microchim. Acta 2019, 187, 56. [Google Scholar] [CrossRef]
  64. Achadu, O.J.; Revaprasadu, N. Microwave-assisted synthesis of thymine-functionalized graphitic carbon nitride quantum dots as a fluorescent nanoprobe for mercury(II). Microchim. Acta 2018, 185, 461. [Google Scholar] [CrossRef]
  65. Liang, P.; Yu, J.; Yang, E.; Mo, Y. Determination of Mercury in Food and Water Samples by Displacement-Dispersive Liquid-Liquid Microextraction Coupled with Graphite Furnace Atomic Absorption Spectrometry. Food Anal. Methods 2014, 8, 236–242. [Google Scholar] [CrossRef]
  66. Xie, Y. Colorimetric determination of Hg(II) via the gold amalgam induced deaggregation of gold nanoparticles. Microchim. Acta 2018, 185, 351. [Google Scholar] [CrossRef] [PubMed]
  67. Silva, N.A.; Nobre, N.F.; Lopes, G.S. Rapid and Low Cost Determination of Total Mercury in Cat Foods by Photochemical Vapor Generation Coupled to Atomic Absorption Spectrometry. Biol. Trace Elem. Res. 2021, 199, 1161–1169. [Google Scholar] [CrossRef] [PubMed]
  68. Agarwal, A.; Verma, A.K.; Yoshida, M.; Naik, R.M.; Prasad, S. A novel catalytic kinetic method for the determination of mercury(ii) in water samples. RSC Adv. 2020, 10, 25100–25106. [Google Scholar] [CrossRef]
  69. Duval, B.; Gredilla, A.; de Vallejuelo, S.F.-O.; Tessier, E.; Amouroux, D.; de Diego, A. A simple determination of trace mercury concentrations in natural waters using dispersive Micro-Solid phase extraction preconcentration based on functionalized graphene nanosheets. Microchem. J. 2020, 154, 104549. [Google Scholar] [CrossRef]
  70. Hosseini, M.; Rahimi, M.; Sadeghi, H.B.; Taghvaei-Ganjali, S.; Abkenar, S.D.; Ganjali, M.R. Determination of Hg(II) ions in water samples by a novel Hg(II) sensor, based on calix[4]arene derivative. Int. J. Environ. Anal. Chem. 2009, 89, 407–422. [Google Scholar] [CrossRef]
  71. Khan, A.A.; Shaheen, S.; Habiba, U. Synthesis and characterization of poly-o-anisidine Sn(IV) tungstate: A new and novel ‘organic–inorganic’ nano-composite material and its electro-analytical applications as Hg(II) ion-selective membrane electrode. J. Adv. Res. 2012, 3, 269–278. [Google Scholar] [CrossRef] [Green Version]
Scheme 1. Synthetic protocol of (4-bromo-2-[(4-methoxyphenylimino)methyl]phenol, BMPMP.
Sensors 21 03020 sch001
Figure 1. The influence of membrane composition on the potential response of the Hg2+-ISEs.
Sensors 21 03020 g001
Figure 2. Calibration curve of the Hg2+-SE (ISE7) based on the BMPMP as ionophore.
Sensors 21 03020 g002
Figure 3. ATR–FTIR spectra of Hg2+–SE membrane: (A) membrane before being superimposed in Hg2+–SE and (B) the membrane after using for sensing Hg2+ ions.
Sensors 21 03020 g003
Figure 4. SEM micrographs of (A) control membrane and (B) optimized membrane used for sensing mercury (II).
Sensors 21 03020 g004
Figure 5. EDX spectra of (A) control membrane and (B) membrane selected for sensing mercury (II).
Sensors 21 03020 g005aSensors 21 03020 g005b
Figure 6. The relation between −log [Hg2+] and the potential of Hg2+–SE at different concentrations of internal solution.
Sensors 21 03020 g006
Figure 7. Role of test solution’s pH on the potential response of Hg2+–SE at different concentrations: (blue) 1.0 × 10⁻² and (red) 1.0 × 10⁻³ molL–1.
Sensors 21 03020 g007
Figure 8. The relation of response time with Hg2+–SE potential at different concentrations of analyte and 298K: The curves of a, b, c, d, e, and f shows this relation at the Hg2+ concentrations of 1.06 × 10⁷, 1.06 × 10⁶, 1.06 × 10⁵, 1.0 × 10⁴, 1.0 × 10³ and 1.0 × 10² molL–1, respectively.
Sensors 21 03020 g008
Figure 9. Life time of the proposed Hg2+-SE for a period of 112 days.
Sensors 21 03020 g009
Figure 10. The values of K H g , M p o t of proposed Hg2+–SE for variety of different cations.
Sensors 21 03020 g010
Figure 11. Potentiometric titration curve of standard solution of Hg(NO3)2 with EDTA solution using our proposed electrode as an indicator electrode at optimized conditions. The concentrations used are mentioned in the text.
Sensors 21 03020 g011
Table 1. Optimization of membrane composition of the proposed Hg2+-ISE based on the BMPMP ionophore.
ISE No.Membrane Composition (%)Slope
(mV/Decade) a
D.L. b
(mol.L−1)
L.R. b
(mol.L−1)
R.T. b
(s)
BMPMPPVCPlasticizer
o-NPOE
Additive
NaTPB
10326800.61 ± 0.2---
20326714.30 ± 0.2---
313267017.07 ± 0.21.78 × 10−63.16 × 10⁻⁶–5.62 × 10−420
413266122.62 ± 0.23.16 × 10−54.47 × 10⁻⁵–3.16 × 10−310–15
51.532660.525.92 ± 0.21.58 × 10−62.51 × 10⁻⁶–1.0 × 10−310–15
61.532651.5 27.78 ± 0.21.58 × 10−76.31 × 10⁻⁷–7.08 × 10⁻³>10
723264.51.529.74 ± 0.23.98 × 10−89.33 × 10⁻⁸–3.98 × 10⁻³<10
823363.51.534.41 ± 0.21.58 × 10−72.82 × 10⁻⁷–1.00 × 10−310–15
923462.51.532.62 ± 0.21.26 × 10−53.16 × 10⁻⁵–7.94 × 10−310–15
a All slope values reported represent the mean and ±SD of three measurements. b D.L., L.R., and R.T. denote the lower detection limit, linear working range and response time respectively. The results are based on three replicate measurements.
Table 2. The influence of internal solution concentration on the potential of the optimized Hg2+–SE.
Concentration of
Internal Solution (molL–1)
Slope
(mV/Decade)
D.L.
(molL–1)
L.R.
(molL–1)
R.T.
(s)
0.0129.74 ± 0.23.98 × 10−89.33 × 10⁻⁸–3.98 × 10⁻³⁵
0.00127.16 ± 0.25.01 × 10−51.15 × 10⁻⁴–1.95 × 10−210
0.000117.63 ± 0.27.08 × 10−61.26 × 10⁻⁵–3.16 × 10−37
Table 3. Selectivity coefficients of proposed Hg2+–SE (ISE-7) for different interfering ions calculated using MPM at optimized conditions.
Interfering Ion, M K H g , M p o t Interfering Ion, M K H g , M p o t
Hg2+1.00Fe3+1.9 × 10⁻⁴
Na+2.81 × 10⁻⁵Ag+1.5 × 10⁻³
K+1.94 × 10⁻⁵Cu2+2.55 × 10⁻⁴
Ca2+5.71 × 10⁻⁵Zn2+1.85 × 10⁻⁵
Mg2+3.67 × 10⁻⁶Co2+7.67 × 10⁻⁶
Ba2+1.86 × 10⁻⁵Ni2+1.98 × 10⁻⁵
Al3+1.33 × 10⁻⁵Fe3+9.59 × 10⁻⁵
Cd2+2.65 × 10⁻⁵Cr3+1.06 × 10⁻⁶
Mn2+1.19 × 10⁻⁵Pb2+1.40 × 10⁻⁵
Table 4. The analysis of mercury in some real samples.
Sample *Hg2+ Added (µM)Hg2+ Ions Concentration (µM)
Hg2+–SEICP-OES
Found Recovery (%)FoundRecovery (%)
Tap water0ND-ND-
2019.97 ± 0.1599.8520.03 ± 0.15100.15
Red sea water0ND-0.040 ± 0.001-
2625.77 ±0.2599.1126.1 ± 0.2100.23
Compact fluorescent lamp (CFL)01.89 ± 0.65-1.95 ± 0.18-
2627.86 ± 0.3699.8828.1 ± 0.22100.58
* Results are based on the average of four measurements ± standard deviation, ND: not detected.
Table 5. Comparison between some responses characteristics of the proposed Hg2+-SE based on BMPMP with the previously reported for Hg2+-SES based on various ionophores with the reported electrodes.
IonophoreSlope
(mV/decade)
L.R.
(mol.L−1)
D.L.
(mol.L1)
Working
pH
R.T.
(s)
Significant
Interference
( K H g , M p o t )
Ref.
meso-tetramethyl-tetrakis-(4N,N-diethylacetamide) phenoxymethyl] calix[4]pyrrole29.01.81 × 10−7–1.78 × 10−31 × 1054.3–8.510Ag+ (4.2 × 10²)[22]
calix[4]pyrrole amide derivative29.106.15 × 10−8–2.28 × 10−26.0 × 1083.2–8.85–8-[24]
1,3-diphenylthiourea30.82.00 × 10−6–2.10 × 10−41.0 × 1064.0 < 30Ag+ (3.1 × 10²)[25]
1-methyl-2-butylthioimidazolium bis(trifluoromethanesulphonyl)imide6.701.00 × 10−10–1.00 × 10−54.1 × 10112.0–3.05-[29]
1,2-bis-(N’-benzoylthioureido)cyclohexane28.11.00 × 10−5–1.00 × 10−12.5 × 1067.050–100-[32]
O,O-(2,2_-biphenylene) dithiophosphate alkyl29.801.00 × 10−9–1.00 × 10−19.1 × 10100.0–6.030Fe3+ (1.2 × 10⁵)[33]
1-n-butyl-3-methylimidazolium tetrafluoroborate29.35.00 × 10−9–1.00 × 10−42.5 × 1092.0–4.3~5-[35]
polypyrrole-PPy23.7 ± 1.41.0 × 10−9–1.0 × 10−26.0 × 10103.060Ag+ (1.0 × 10³)[36]
bis [5-((4-nitrophenyl) azo salicylaldehyde)]30 ± 1.07.00 × 10−7–5.00 × 10−27.0 × 1081.0–3.5 < 10-[42]
salicylaldehyde thiosemicarbazone291.78 × 10−6–1.00 × 10−11.0 × 1061.0–3.0 < 30Ag+ (3.1 × 10²)[43]
1-(2-hydroxy-1,2-diphenylethylidene)thiosemicarbazide30.52.00 × 10−6–1.00 × 10−21.0 × 1062.0–5.0 < 30Ag+ (2.7 × 101)[44]
2-amino-6-purinethiol29.47.00 × 10−8–1.00 × 10−14.4 × 10−82.0–4.510Ag+ (1.5 × 10²); Cu2+ (3.1 × 10²); Pb2+ (5.0 × 10²)[45]
bis-salicyladehydediaminjodipropylamine30.5 ± 0.49.50 × 10−7–6.40 × 10−27.0 × 1071.5–3.510–25Ag+ (3.1 × 10²)[46]
poly-o-toluidine into zirconium phosphoborate28.01.0 × 10−7–1.0 × 10−17.08 × 1082.5–10.06K+ (6.4 × 10²)[51]
1-undecanethiol assembled Au substrate28.831.00 × 10−8–1.00 × 10−44.5 × 1096.0~30-[54]
trioctylmethylammonium thiosalicylate44.081.00 × 10−9–1.00 × 10−21.0 × 10103.0–9.0~5Ag+ (8.9 × 10⁴); Cu2+ (8.9 × 10⁴); Pb2+ (9.6 × 10⁴)[60]
dithio derivatized macrotricyclic29.4 ± 0.41.00 × 10−6–1.00 × 10−14.0 × 1071.5–4.0<10Ag+ (1.3 × 10²)[70]
poly-o-anisidine Sn(IV) tungstate21.01.00 × 10−7–1.00 × 10−11.00 × 10−74.0–8.030_____[71]
4-Bromo-2-[(4-methoxyphenylimino)methyl]phenol29.749.33 × 10−8–3.98 × 10−33.98 × 10−83.0–7.0 < 10_____P.W.
Table 6. Comparisons of analytical results for the detection of Hg2+ by using other methods.
MaterialsMethodSampleL.R. (molL−1)D.L. (mgL1)pHRecoveryRef.
AuNPs, DNAspICP-MStap water1.0 × 10−7–1.0 × 10−63.1 × 108-110 ± 10[63]
T-gCNQDsFluorescencepond water1.0 × 10−8–5.0 × 10−71.5 × 10−107.295[64]
pyrrolidinedithiocarbamate (PDC)D-DLLME/GFAASrice 0.01–0.31.8 × 10−76.098[65]
AuNPs, APTESColorimetricriver water0–9.23 × 10−81.0 × 10−87.296.4[66]
-PVG-CVAASDORM-11.75 × 10⁻⁷–1.69 × 10−61.4 × 10−9-92.7[67]
-CKMwastewater1.0–30.0 × 10−61.5 × 10−7497.93[68]
graphene nanosheetsDMSPEFresh water1.9 × 10−9–5.19 × 10−61.9 × 10−9-95.0<[69]
spICP-MS: single-particle inductively-coupled plasma/mass spectrometry; D-DLLME/GFAAS: displacement-dispersive liquid-liquid microextraction-graphite furnace atomic absorption spectrometry; PVG-CVAAS: Photochemical Vapor Generation-Cold Vapor Atomic Absorption Spectrometry; CKM: catalytic kinetic method; DMSPE: Dispersive Micro-Solid Phase Extraction.
Publisher’s Note: MDPI stays neutral with regard to jurisdictional claims in published maps and institutional affiliations.

