Research on Multiple Spectral Ranges with Deep Learning for SpO2 Measurement
Abstract
:1. Introduction
2. Materials and Methods
2.1. Materials
2.1.1. Light Source
2.1.2. Light Sensor
2.1.3. Architecture of Light Sensing and Signal Processing
2.2. Measurement
3. Architecture of 1D-CNN and Hyperparameters Optimization
3.1. Data Establishment
3.1.1. Data Augmentation
3.1.2. Preprocessing and Construction of Dataset
3.2. 1D-CNN Model Configuration and Training
3.3. Configuration of Optomechanical Sensing System
4. Analysis of Multiple Spectral Ranges
4.1. Analysis of Hyperparameters
4.2. Optimization Procedures
4.2.1. Investigation of the Validity of Spectral Regions
4.2.2. Analysis of Data Augmentation with Noise Addition
4.2.3. Analysis of Model Optimization
4.3. Dynamic Measurement and Verification
5. Discussions and Conclusions
Author Contributions
Funding
Institutional Review Board Statement
Informed Consent Statement
Data Availability Statement
Conflicts of Interest
References
- Gupta, R.; Ahluwalia, S.; Randhawa, S. Design and development of pulse oximeter. In Proceedings of the First Regional Conference, IEEE Engineering in Medicine and Biology Society and 14th Conference of the Biomedical Engineering Society of India, An International Meet, New Delhi, India, 6 August 2002; pp. 1/13–1/16. [Google Scholar]
- Lindberg, L.G.; Öberg, P.Å. Photoplethysmography. Med. Biol. Eng. Comput. 1991, 29, 48–54. [Google Scholar] [CrossRef] [PubMed]
- Anant, J.; Sujay, D.; Dharitri, G.; Alok, B.; Jimut, M.; Saswat, C. Determination of SpO2 by Spectral Analysis of Data from a Low Cost Pulse Oximeter. 2015. Available online: https://www.researchgate.net/publication/267689546_DETERMINATION_OF_SpO_2_BY_SPECTRAL_ANALYSIS_OF_DATA_FROM_A_LOW_COST_PULSE_OXIMETER?_sg=hvtAwMVKY2P42qyUA3nAGXOgwcH7O2FBuRzfVbgAbcugX4vs4QpWu2JH-I-zbTucGEVRYltCZC1sRIU (accessed on 20 May 2015).
- Aoyagi, T.; Fuse, M.; Kobayashi, N.; Machida, K.; Miyasaka, K. Multiwavelength pulse oximetry: Theory for the future. Anesth. Analg. 2007, 105, S53–S58. [Google Scholar] [CrossRef] [PubMed]
- Schweitzer, D.; Leistritz, L.; Hammer, M.; Scibor, M.; Bartsch, U.; Strobel, J. Calibration-free measurement of the oxygen saturation in human retinal vessels. Ophthalmic Technol. V 1995, 2393, 210–219. [Google Scholar] [CrossRef]
- Zonios, G.; Shankar, U.; Iyer, V. Pulse oximetry theory and calibration for low saturations. IEEE Trans. Biomed. Eng. 2004, 51, 818–822. [Google Scholar] [CrossRef] [PubMed]
- Chugh, S.; Kaur, J. Low cost calibration free Pulse oximeter. In Proceedings of the 2015 Annual IEEE India Conference (INDICON), New Delhi, India, 17–20 December 2015; pp. 1–5. [Google Scholar]
- Reddy, K.A.; George, B.; Mohan, N.M.; Kumar, V.J. A novel method of measurement of oxygen saturation in arterial blood. In Proceedings of the 2008 IEEE Instrumentation and Measurement Technology Conference, Victoria, BC, Canada, 12–15 May 2008; pp. 1627–1630. [Google Scholar]
- Reddy, K.A.; George, B.; Mohan, N.M.; Kumar, V.J. A novel calibration-free method of measurement of oxygen saturation in arterial blood. IEEE Trans. Instrum. Meas. 2009, 58, 1699–1705. [Google Scholar] [CrossRef]
- Ileri, R.; Latifoglu, F.; Demirci, E. New method to diagnosis of dyslexia using 1D-CNN. In Proceedings of the Medical Technologies Congress (TIPTEKNO), Izmir, Turkey, 19–20 November 2020; pp. 1–4. [Google Scholar]
- Sagga, D.; Echtioui, A.; Khemakhem, R.; Ghorbel, M. Epileptic seizure detection using EEG signals based on 1D-CNN Approach. In Proceedings of the 20th International Conference on Sciences and Techniques of Automatic Control and Computer Engineering (STA), Monastir, Tunisia, 20–22 December 2020; pp. 51–56. [Google Scholar]
- Thompson, S.; Fergus, P.; Chalmers, C.; Reilly, D. Detection of obstructive sleep apnoea using features extracted from segmented time-series ECG signals using a one dimensional convolutional neural network. In Proceedings of the 2020 International Joint Conference on Neural Networks (IJCNN), Glasgow, UK, 19–24 July 2020; pp. 1–8. [Google Scholar]
- Lim, C.; Kim, J.-Y.; Nam, Y. ECG signal analysis for patient with metabolic syndrome based on 1D-convolution neural network. In Proceedings of the International Conference on Computational Science and Computational Intelligence (CSCI), Cagliari, Italy, 1–4 July 2020; pp. 731–733. [Google Scholar]
- Hui, Y.; Yin, Z.; Wu, M.; Li, D. Wearable devices acquired ECG signals detection method using 1D convolutional neural network. In Proceedings of the 2021 15th International Symposium on Medical Information and Communication Technology (ISMICT), Xiamen, China, 14–16 April 2021; pp. 81–85. [Google Scholar]
- Chen, W.L.; Shen, C.H. Analysis of SpO2 concentration measurement based on multi-wavelength with CNN and DNN model. In Proceedings of the International Conference on Advanced Technology Innovation (ICATI), Taoyuan, Taiwan, 9 October–2 November 2021. [Google Scholar]
- Roggan, A.; Friebel, M.; Dörschel, K.; Hahn, A.; Müller, G. Optical properties of circulating human blood in the wavelength range 400–2500 nm. J. Biomed. Opt. 1999, 4, 36–46. [Google Scholar] [CrossRef] [PubMed] [Green Version]
- Botero-Valencia, J.-S.; Valencia-Aguirre, J.; Durmus, D.; Davis, W. Multi-channel low-cost light spectrum measurement using a multilayer perceptron. Energy Build. 2019, 199, 579–587. [Google Scholar] [CrossRef]
- Mazumdar, A.; Rawat, A.S. Learning and recovery in the ReLU model. In Proceedings of the 57th Annual Allerton Conference on Communication, Control, and Computing (Allerton), Monticello, IL, USA, 24–27 September 2019; pp. 108–115. [Google Scholar]
- Glorot, X.; Bordes, A.; Bengio, Y. Deep sparse rectifier neural networks. In Proceedings of the Fourteenth International Con-ference on Artificial Intelligence and Statistics, Ft. Lauderdale, FL, USA, 11–13 April 2011; pp. 315–323. [Google Scholar]
- Zang, F.; Zhang, J.-S. Softmax discriminant classifier. In Proceedings of the 2011 Third International Conference on Multimedia Information Networking and Security, Washington, DC, USA, 4–6 November 2011; pp. 16–19. [Google Scholar]
- de Chazal, P.; Celler, B.G. Selecting a neural network structure for ECG diagnosis. In Proceedings of the 20th Annual International Conference of the IEEE Engineering in Medicine and Biology Society, Vol. 20 Biomedical Engineering Towards the Year 2000 and Beyond (Cat. No.98CH36286), Hong Kong, China, 1 November 1998; Volume 3, pp. 1422–1425. [Google Scholar]
- Shuai, Y.; Zheng, Y.; Huang, H. Hybrid software obsolescence evaluation model based on PCA-SVM-GridSearchCV. In Proceedings of the IEEE 9th International Conference on Software Engineering and Service Science (ICSESS), Beijing, China, 23–25 November 2018; pp. 449–453. [Google Scholar]
- Nguyen, V. Bayesian optimization for accelerating hyper-parameter tuning. In Proceedings of the 2019 IEEE Second International Conference on Artificial Intelligence and Knowledge Engineering (AIKE), Cagliari, Italy, 3–5 June 2019; pp. 302–305. [Google Scholar]
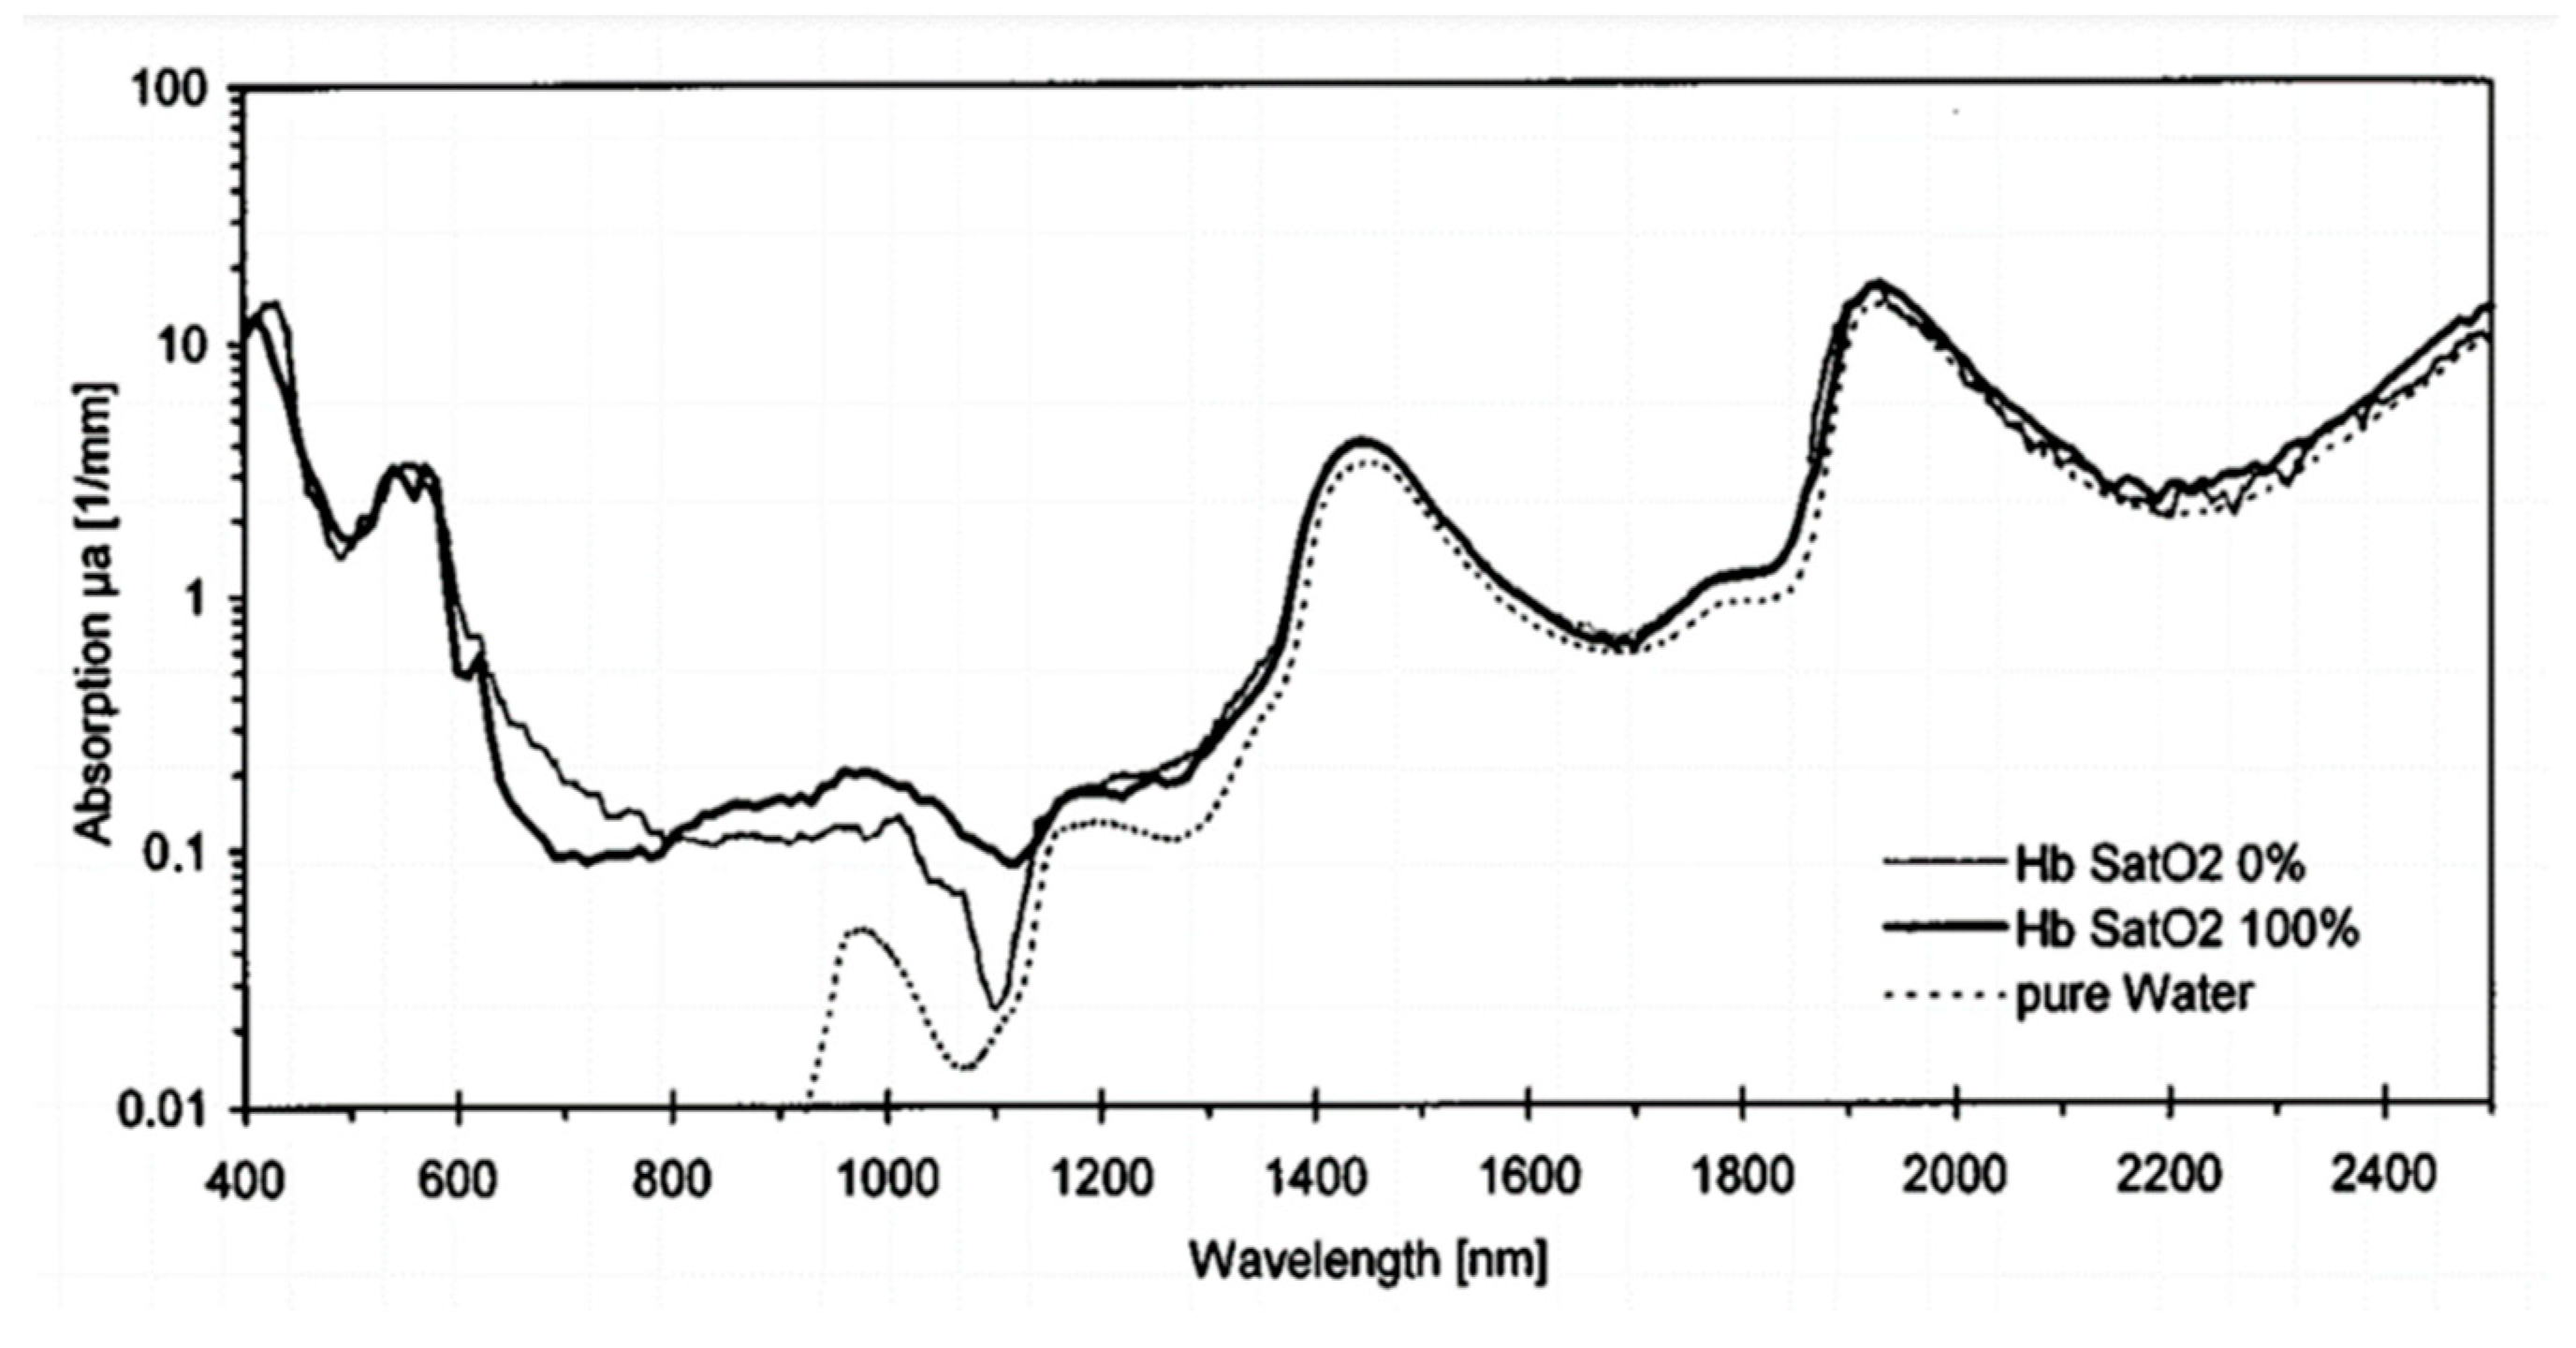


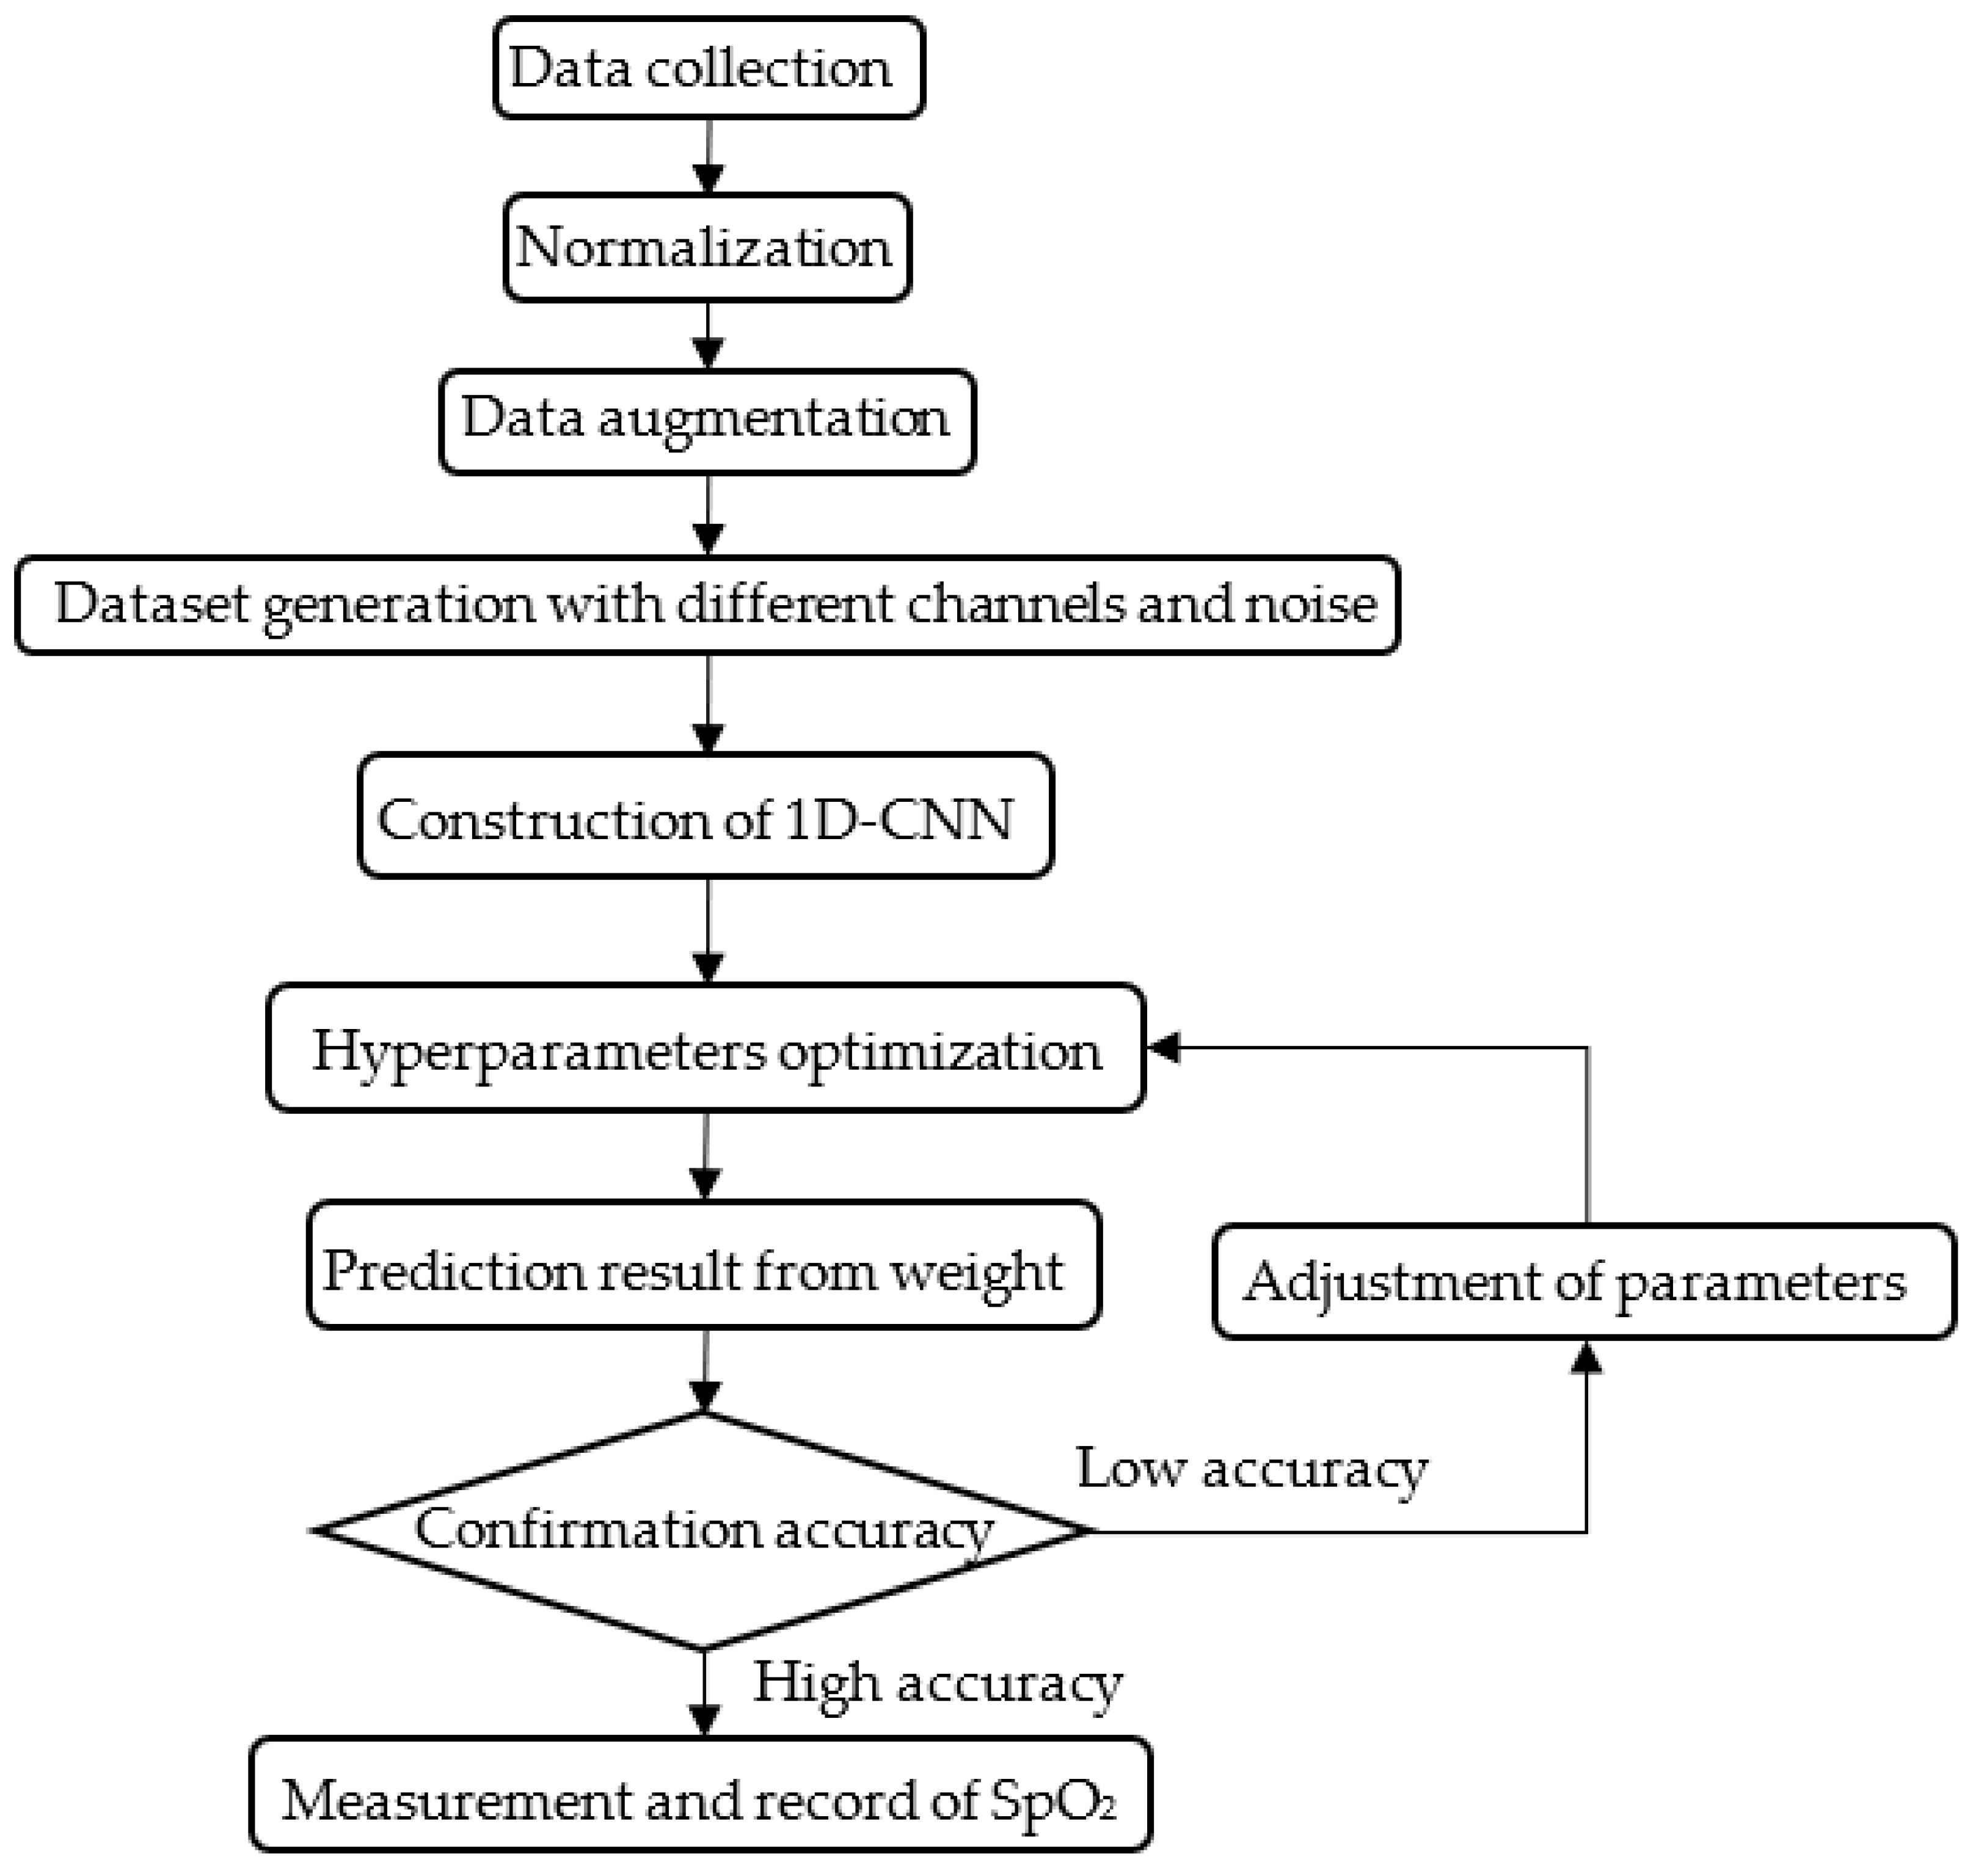
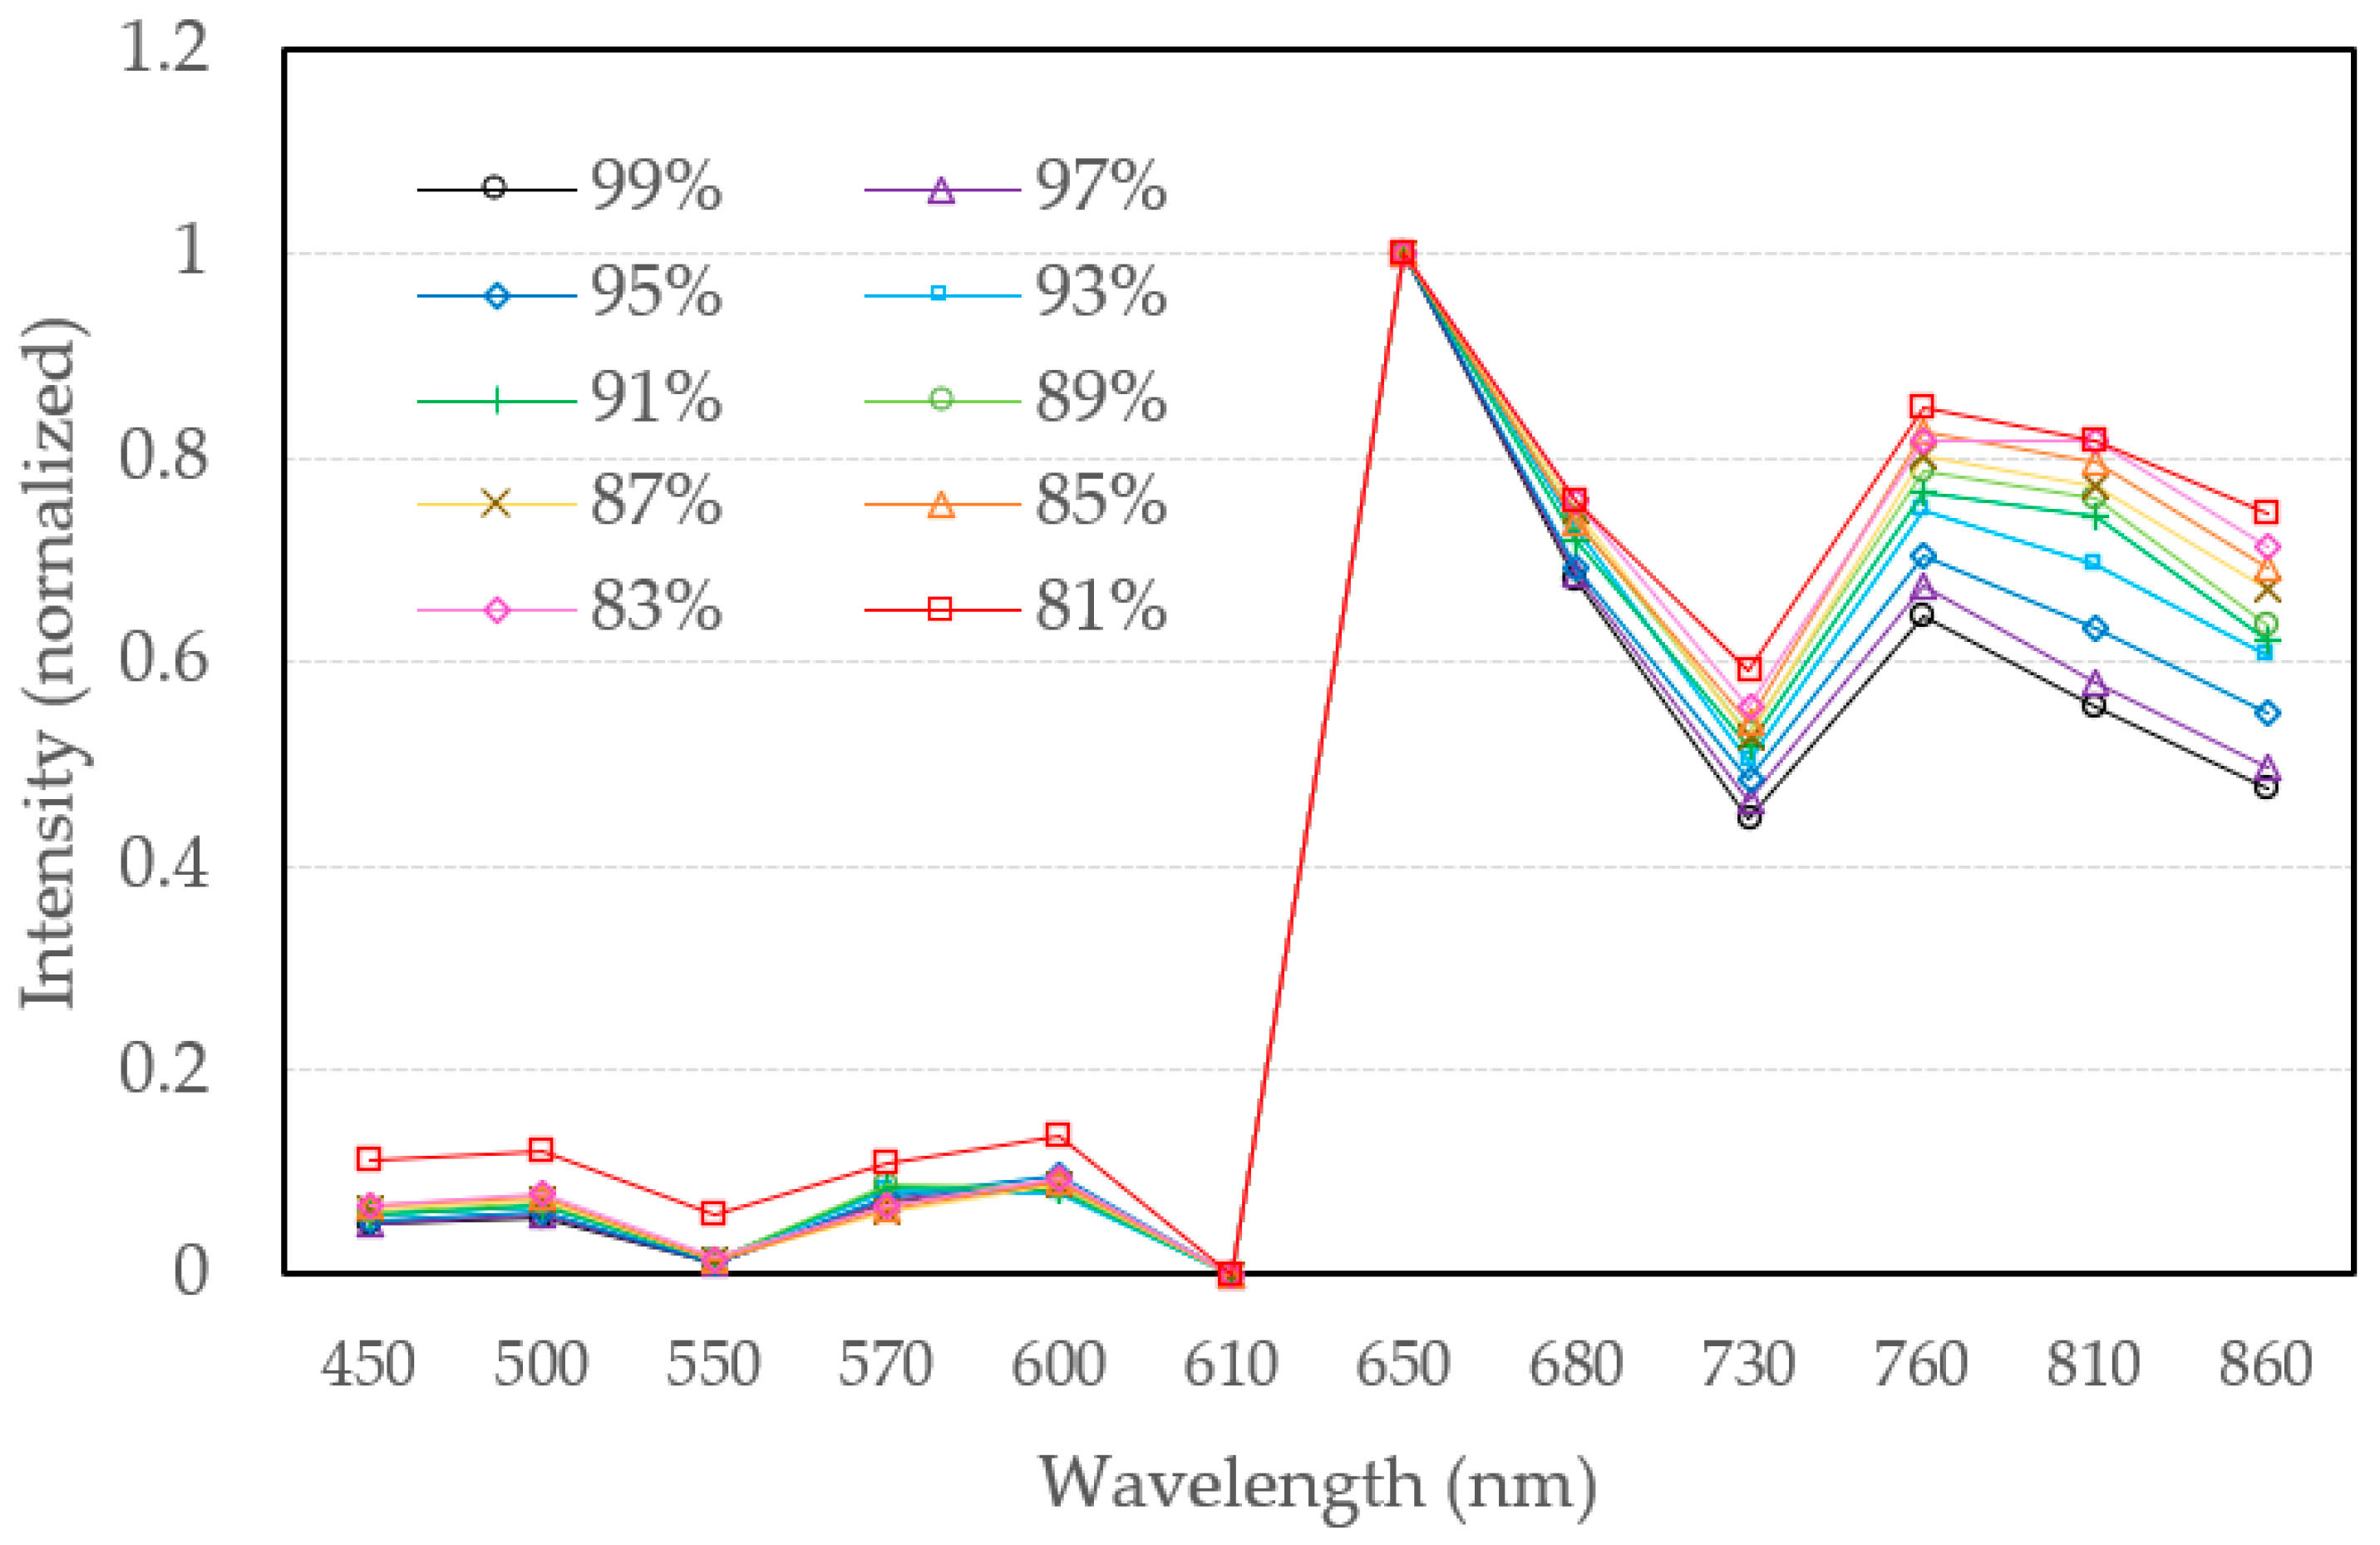

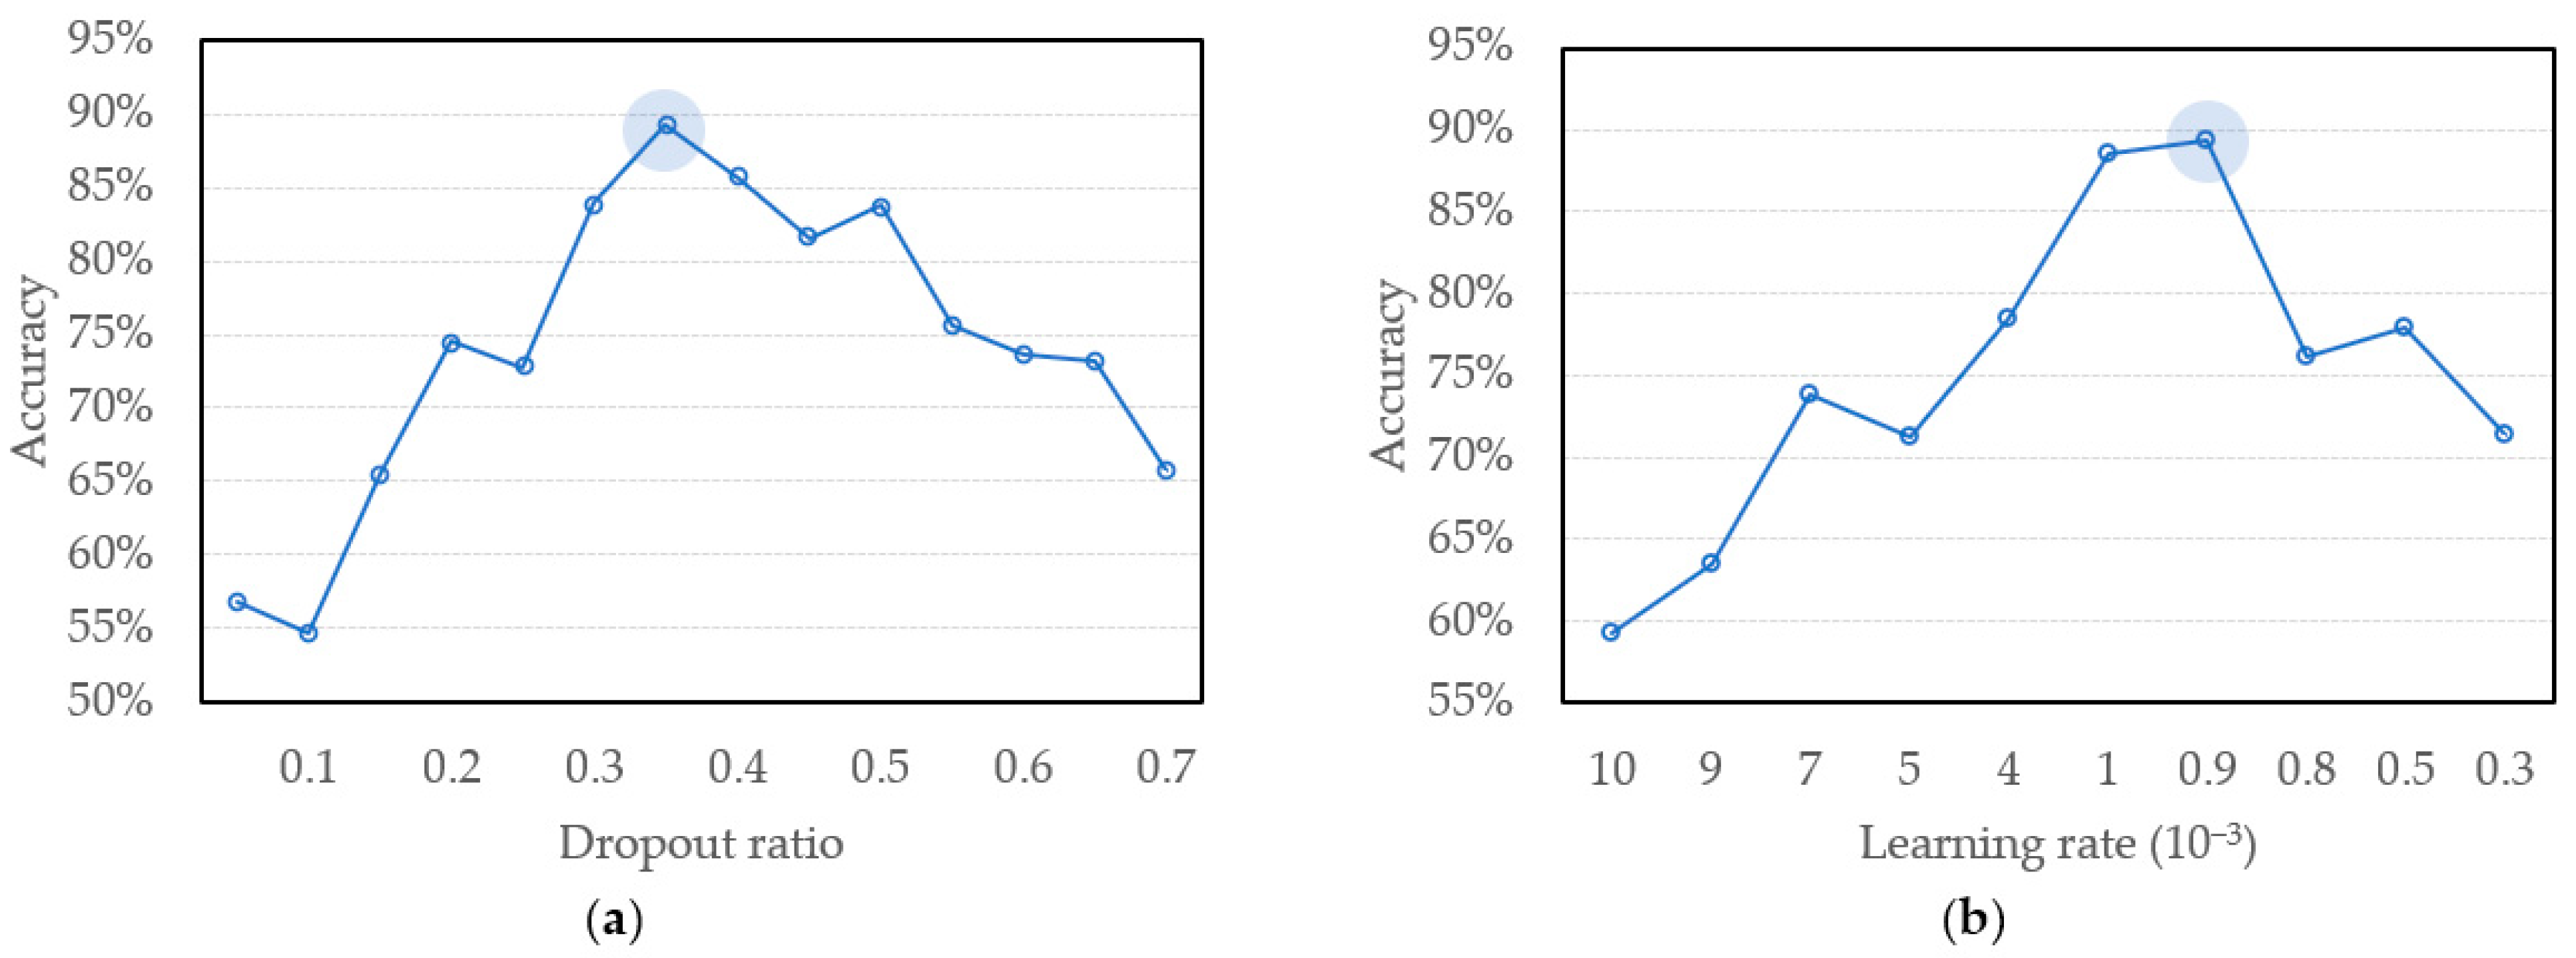


| Characteristic | AS7262 | AS7263 | Unit |
|---|---|---|---|
| Sensor | Photodiode | [NA] | |
| A/D Resolution | 16 | [bits] | |
| Communication | UART or I2C | [NA] | |
| Operating voltage | 2.7–3.6 | [V] | |
| Temperature | −40 to 85 | [°C] | |
| FWHM | 40 | 20 | [nm] |
| Angle of incidence | ±20 | [°] | |
| Integration time | 2.8–714 | [ms] | |
| Channels | 450, 500, 550, 570, 600, 650 | 610, 680, 730, 760, 810, 860 | [nm] |
| Name | Range |
|---|---|
| Number of filters in 1st and 2nd CNN layers | 2, 4, 8, 16, 32, 64 |
| Number of filters in 3rd and 4th CNN layers | 2, 4, 8, 16, 32, 64 |
| Number of in full connect hidden layers | 2, 4, 6, 8, 10 |
| Kernel size | 2, 4, 8, 16, 32 |
| Dropout ratio | 0.1, 0.2, …, 1 |
| Number of nodes in full connect hidden layers | 10, 20, …, 100 |
| Learning rate | 0.0001, 0.001, 0.01, 0.1 |
| Batch size | 10, 50, 100, 200, 300 |
| epochs | 10, 50, 100, 200, 300, 400, 500 |
| Name | Range |
|---|---|
| Number of filters in 1st and 2nd CNN layers | 2 to 64 |
| Number of filters in 3rd and 4th CNN layers | 2 to 64 |
| Number of in full connect hidden layers | 1 to 10 |
| Kernel size | 2 to 32 |
| Dropout ratio | 0.01 to 1 |
| Number of nodes in full connect hidden layers | 1 to 100 |
| Learning rate | 0.0001 to 0.1 |
| Batch size | 10 to 300 |
| epochs | 10 to 500 |
| Dataset | Random Noise | ||||
|---|---|---|---|---|---|
| 0% | 1% | 2% | 5% | 10% | |
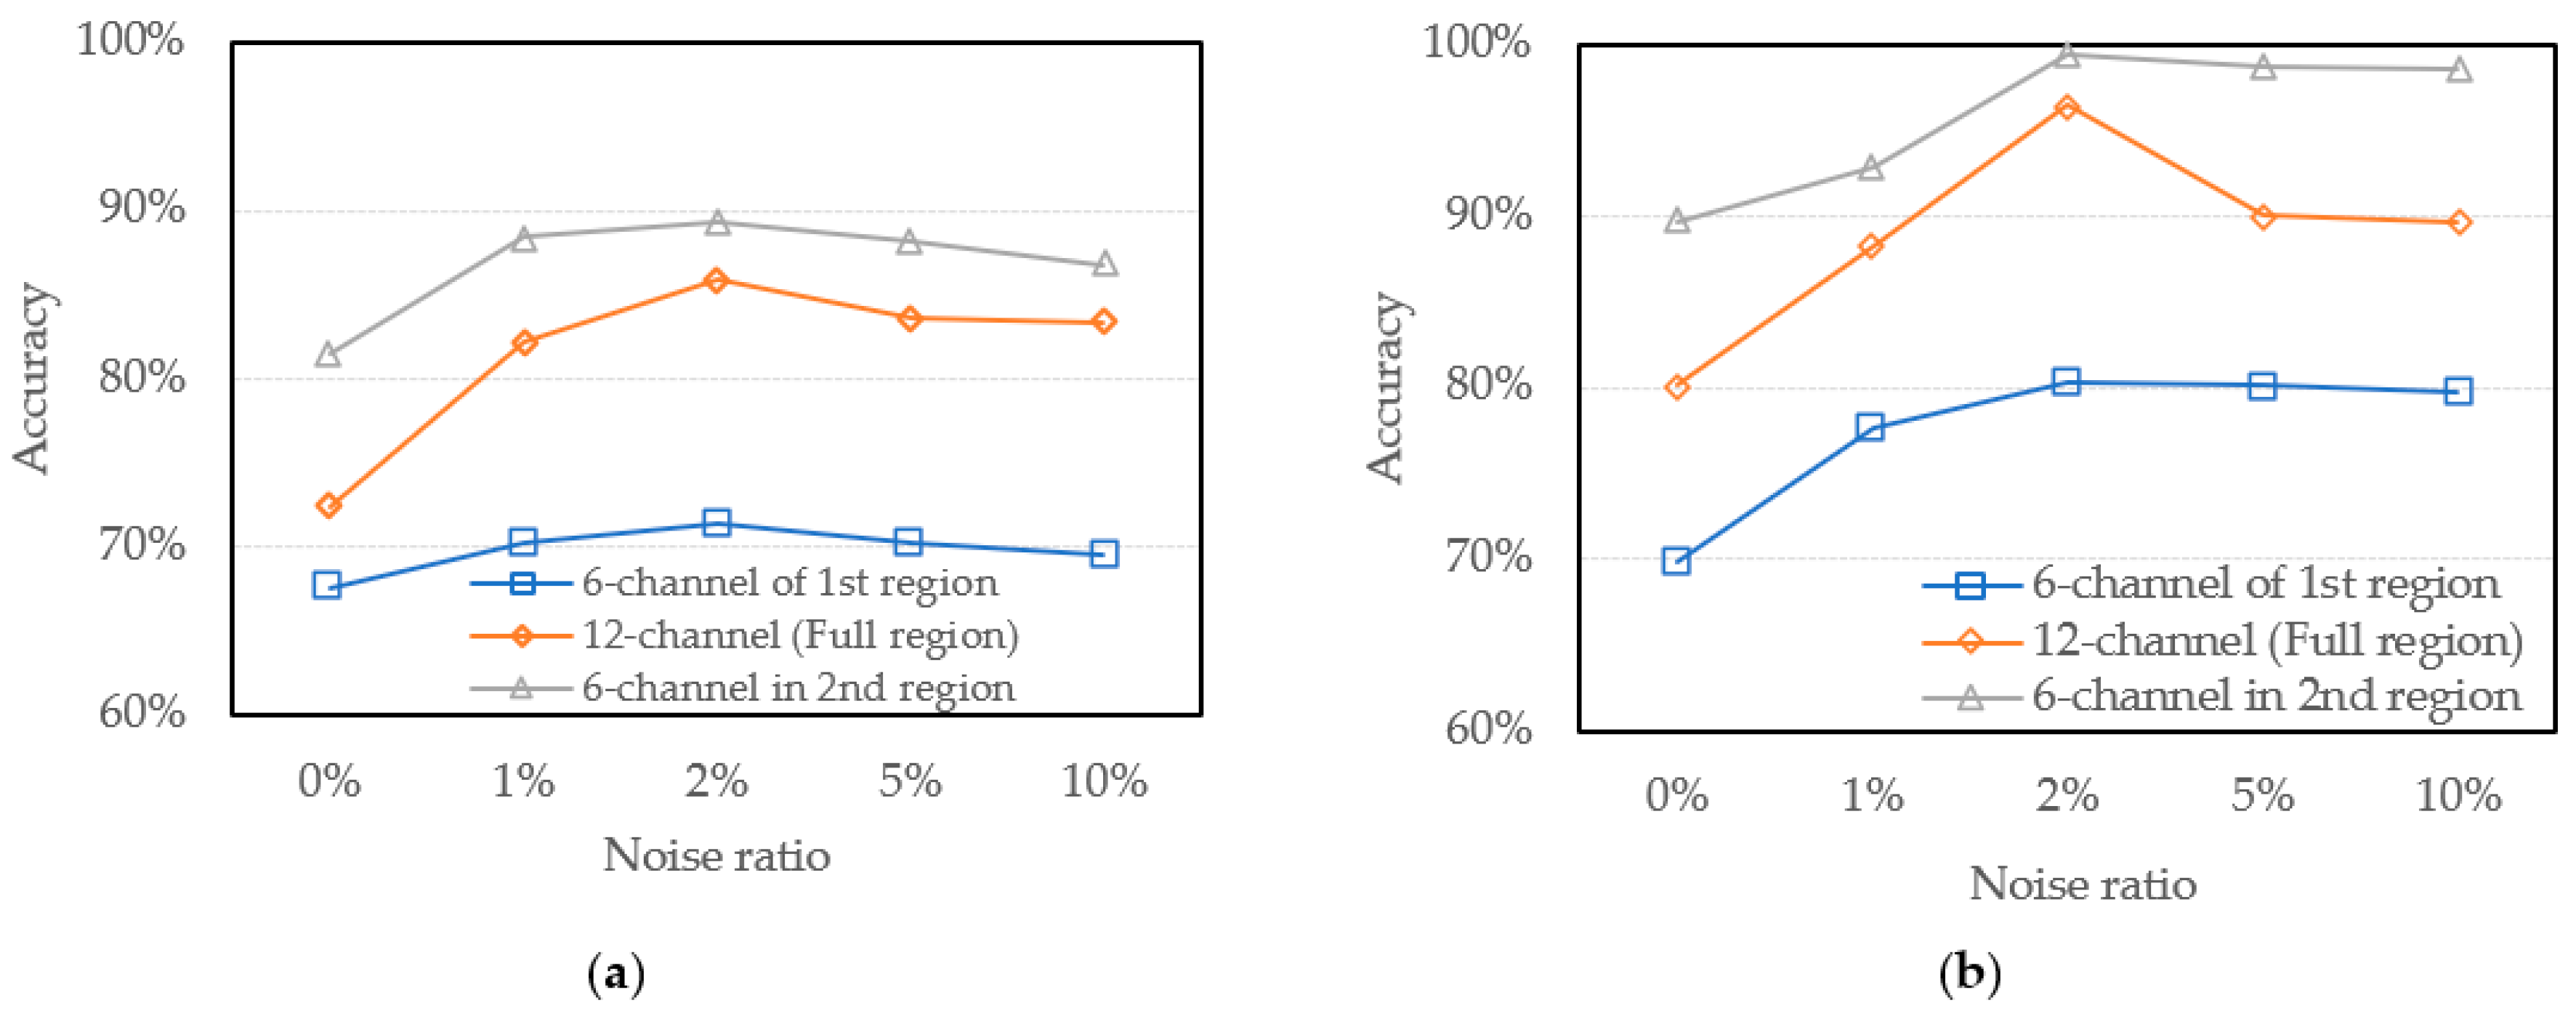
| 6-channel (1st region) | 67.6% | 70.3% | 71.4% | 70% | 69.5% |
| 12-channel (Full region) | 72.4% | 82.2% | 85.9% | 83.6% | 83.4% |
| 6-channel (2nd region) | 81.5% | 88.4% | 89.3% | 88.1% | 86.8% |
| Dataset | Random Noise | ||||
|---|---|---|---|---|---|
| 0% | 1% | 2% | 5% | 10% | |
| 6-channel (1st region) | 69.9% | 77.6% | 80.3% | 80.1% | 79.7% |
| 12-channel (Full region) | 80.1% | 88.3% | 96.4% | 90% | 89.6% |
| 6-channel (2nd region) | 89.7% | 92.9% | 99.4% | 98.7% | 98.6% |
| Parameters | Value |
|---|---|
| Dataset | 6-channel constructed by the 2nd region |
| Random noise ratio | 2% |
| Number of filters in 1st and 2nd CNN layers | 10 |
| Number of filters in 3rd and 4th CNN layers | 16 |
| Number of full connect hidden layers | 3 |
| Kernel size | 6 |
| Dropout ratio | 0.37 |
| Number of nodes in full connect hidden layers | 40 |
| Learning rate | 0.098 |
| Batch size | 85 |
| epochs | 100 |
| SpO2 (%) | Maximum Deviation (%) | Average Deviation ± Standard Deviation (%) |
|---|---|---|
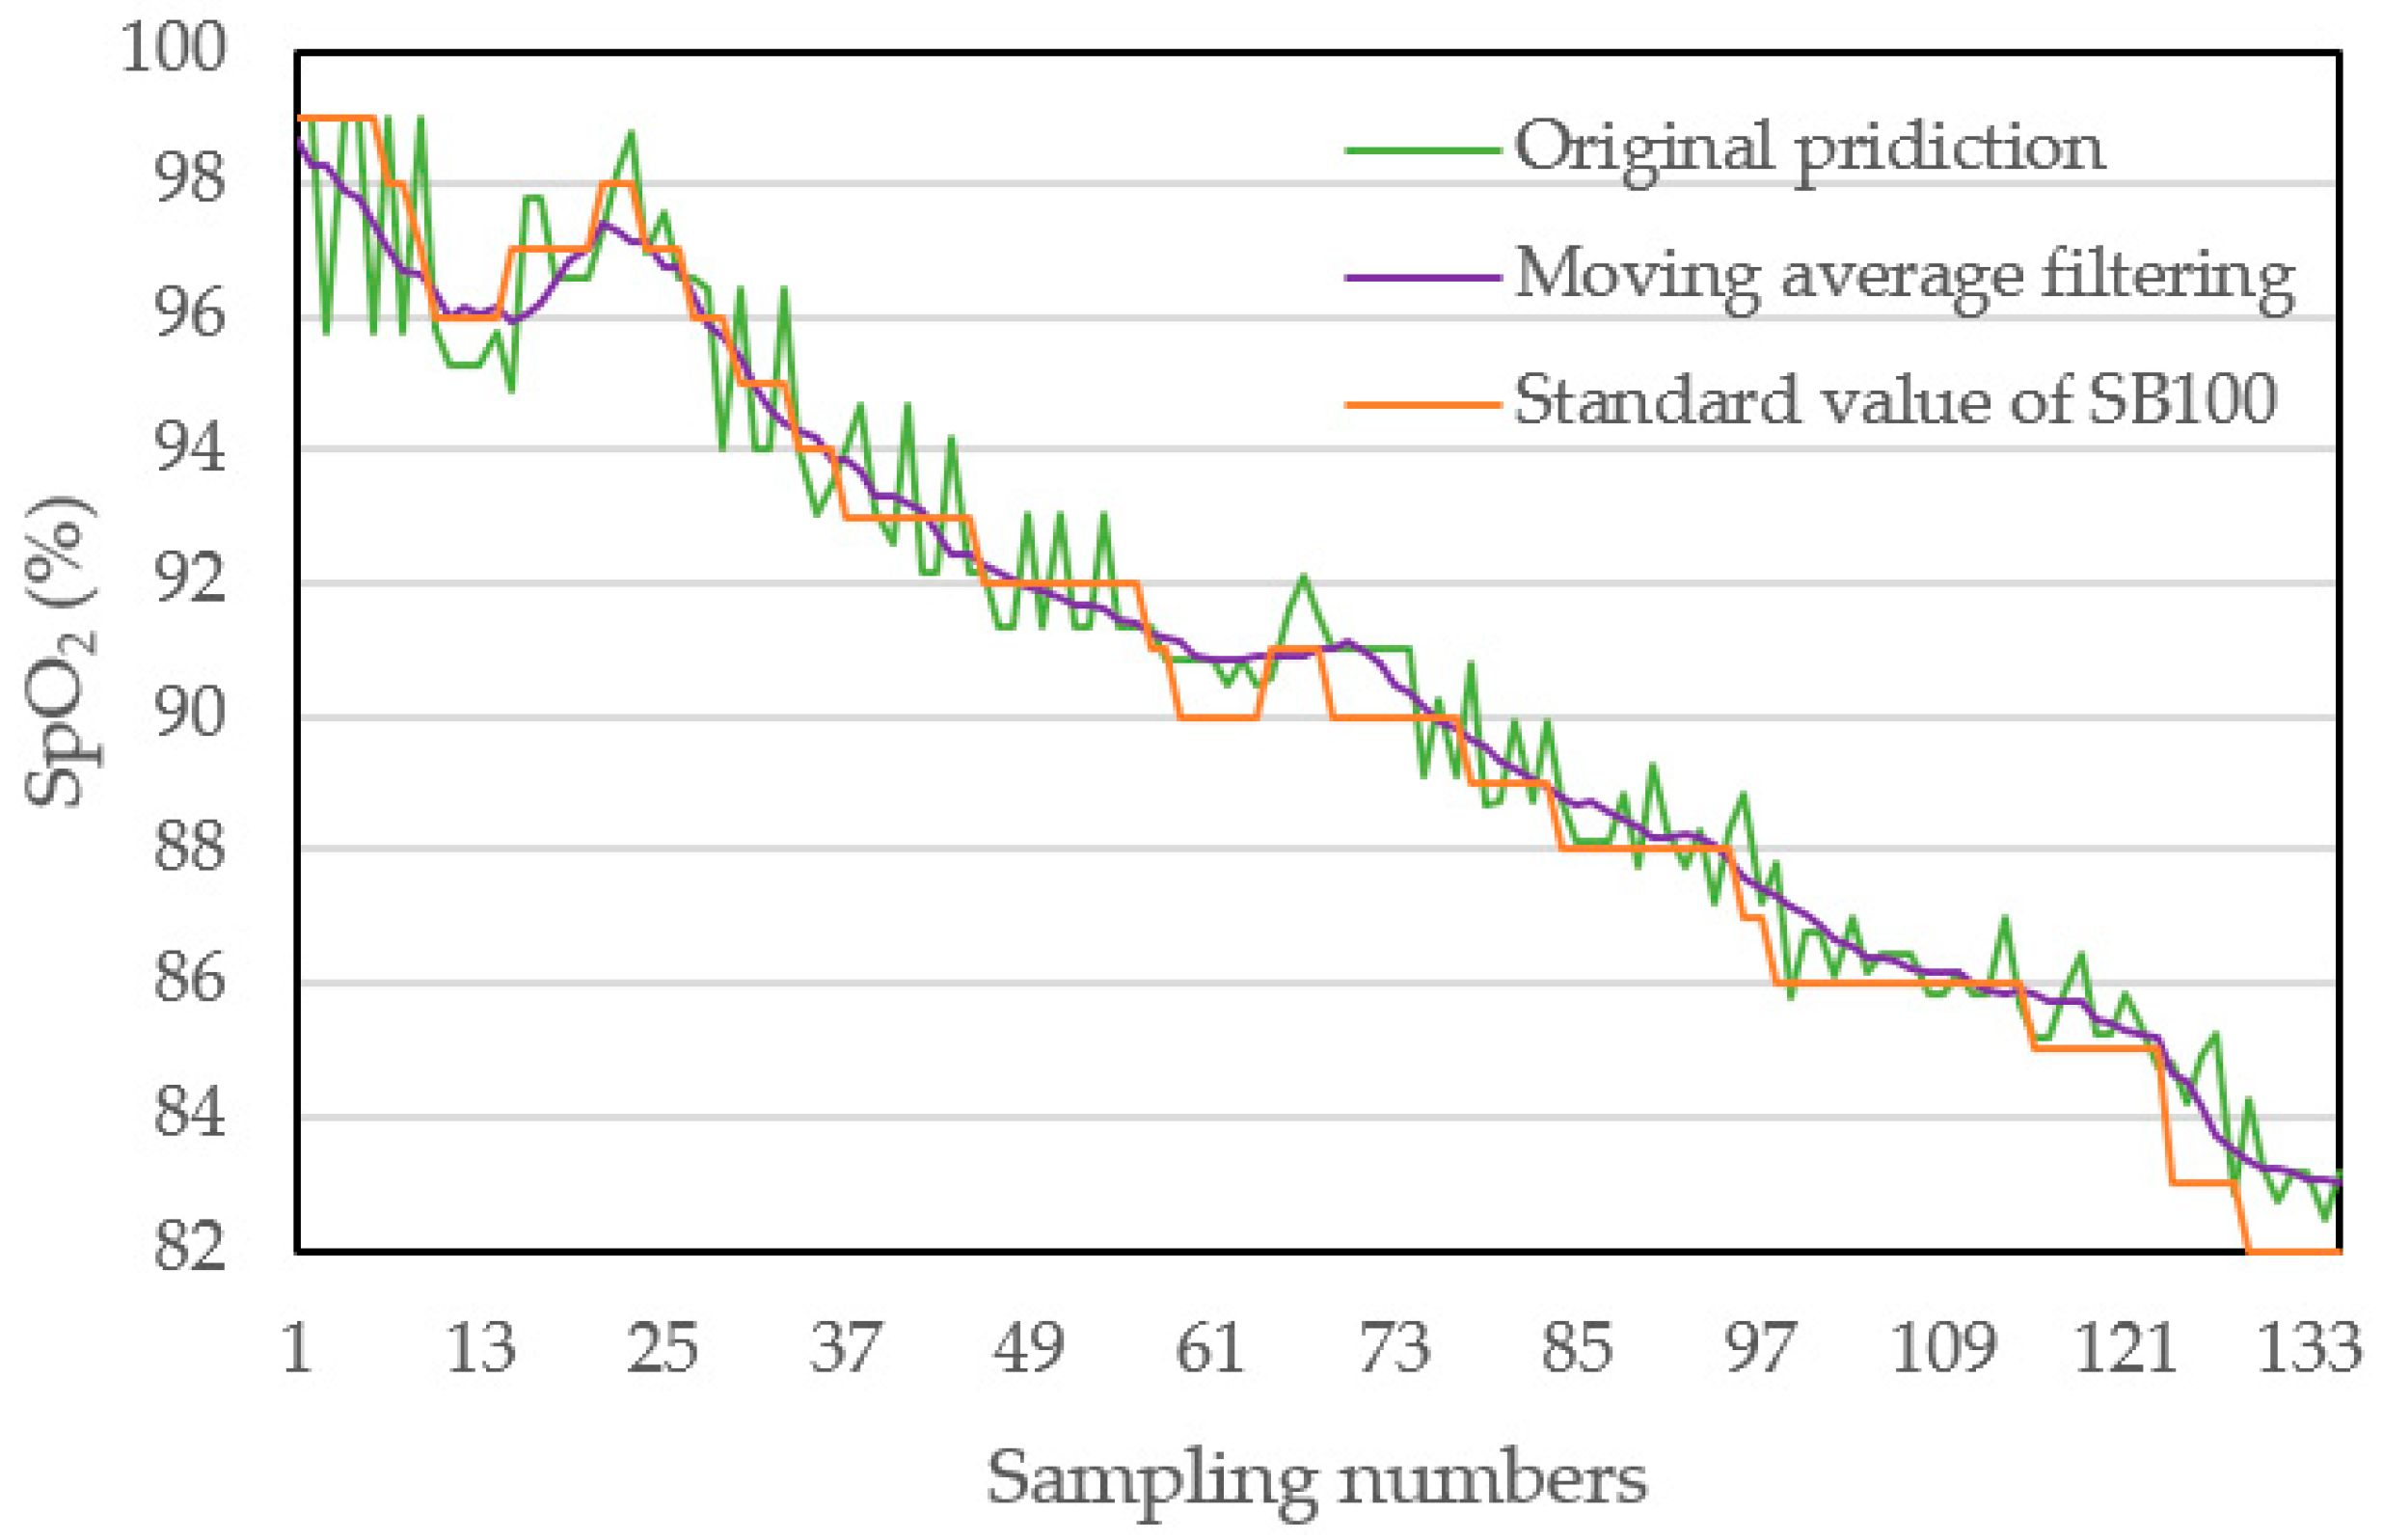
| 99 | 0.41 | 0.31 ± 0.18 |
| 98 | 0.77 | 0.46 ± 0.38 |
| 97 | 0.54 | 0.35 ± 0.27 |
| 96 | 1.08 | 0.45 ± 0.58 |
| 95 | 0.79 | 0.44 ± 0.36 |
| 94 | 1.14 | 0.56 ± 0.39 |
| 93 | 0.61 | 0.43 ± 0.22 |
| 92 | 1.51 | 0.58 ± 0.67 |
| 91 | 0.72 | 0.41 ± 0.34 |
| 90 | 1.43 | 0.61 ± 0.51 |
| Total error: 0.46% | ||
Publisher’s Note: MDPI stays neutral with regard to jurisdictional claims in published maps and institutional affiliations. |
© 2022 by the authors. Licensee MDPI, Basel, Switzerland. This article is an open access article distributed under the terms and conditions of the Creative Commons Attribution (CC BY) license (https://creativecommons.org/licenses/by/4.0/).
Share and Cite
Shen, C.-H.; Chen, W.-L.; Wu, J.-J. Research on Multiple Spectral Ranges with Deep Learning for SpO2 Measurement. Sensors 2022, 22, 328. https://doi.org/10.3390/s22010328
Shen C-H, Chen W-L, Wu J-J. Research on Multiple Spectral Ranges with Deep Learning for SpO2 Measurement. Sensors. 2022; 22(1):328. https://doi.org/10.3390/s22010328
Chicago/Turabian StyleShen, Chih-Hsiung, Wei-Lun Chen, and Jung-Jie Wu. 2022. "Research on Multiple Spectral Ranges with Deep Learning for SpO2 Measurement" Sensors 22, no. 1: 328. https://doi.org/10.3390/s22010328
APA StyleShen, C.-H., Chen, W.-L., & Wu, J.-J. (2022). Research on Multiple Spectral Ranges with Deep Learning for SpO2 Measurement. Sensors, 22(1), 328. https://doi.org/10.3390/s22010328


