3.1. Pre-Experimental Trials
In the experiment, we assume that the mental fatigue of each subject was the same at the beginning of each experiment. As there was enough rest time between every two experiments, the 12 paradigms were divided into three groups according to the screen brightness. The experimental order of the three groups of brightness modes was randomly selected by the subjects. Therefore, in order to test this hypothesis, we estimated the initial mental fatigue values of 12 experiments corresponding to 12 paradigms, in which the initial fatigue value was to prepare for the normalization of the subsequent objective data. The average fatigue level of the first three trials was considered to be the initial mental fatigue of this experiment because the test of the first three stimulations was to watch a white “x” cursor in the black background without flashing.
Figure 4 and
Figure 5 show the related comparison of the pupil diameter and θ + α band for twelve paradigms over fifteen subjects. One-way repeated-measures ANOVA was used to test the mean diameter of the pupil and the average amplitude difference of the θ + α band in the first three trials. As shown in
Figure 4, there is a certain difference in pupil diameter, and the difference is not significant in the θ + α band [Greenhouse–Geisser correction: F
(3.526, 49.367) = 11.989,
p < 0.001 *** for the pupil diameter; F
(5.326, 74.558) = 1.285,
p = 0.278 for the θ + α band]. At the same time, post-hoc tests were also made to prove that there is a significant difference in pupil diameter under the same color but different brightness (the pupil diameter is the largest at the low brightness mode), which is also supported by the data in
Figure 4. The results of the frequency band analysis verify our hypothesis. As for the pupil diameter, we conducted a more in-depth analysis. According to the different screen brightness, we divided the twelve paradigms into three groups by different screen brightness modes. Each group has four colors (green, blue, red, and black) and conducted one-way repeated measures ANOVA for each group again [Greenhouse–Geisser correction: F
(2.536, 35.498) = 1.631,
p = 0.205 for the low brightness mode; F
(1.840, 25.765) = 0.529,
p = 0.581 for the medium brightness mode; F
(1.422, 19.915) = 0.662,
p = 0.477 for the high brightness mode]. Therefore, we summarize two points: first, at the same brightness, the mental fatigue of the subjects at the beginning of each experiment is the same and can be trusted; second, pupil diameter is sensitive to the brightness of the screen, but the EEG of θ + α band is not sensitive to screen brightness, as
Figure 5 shows.
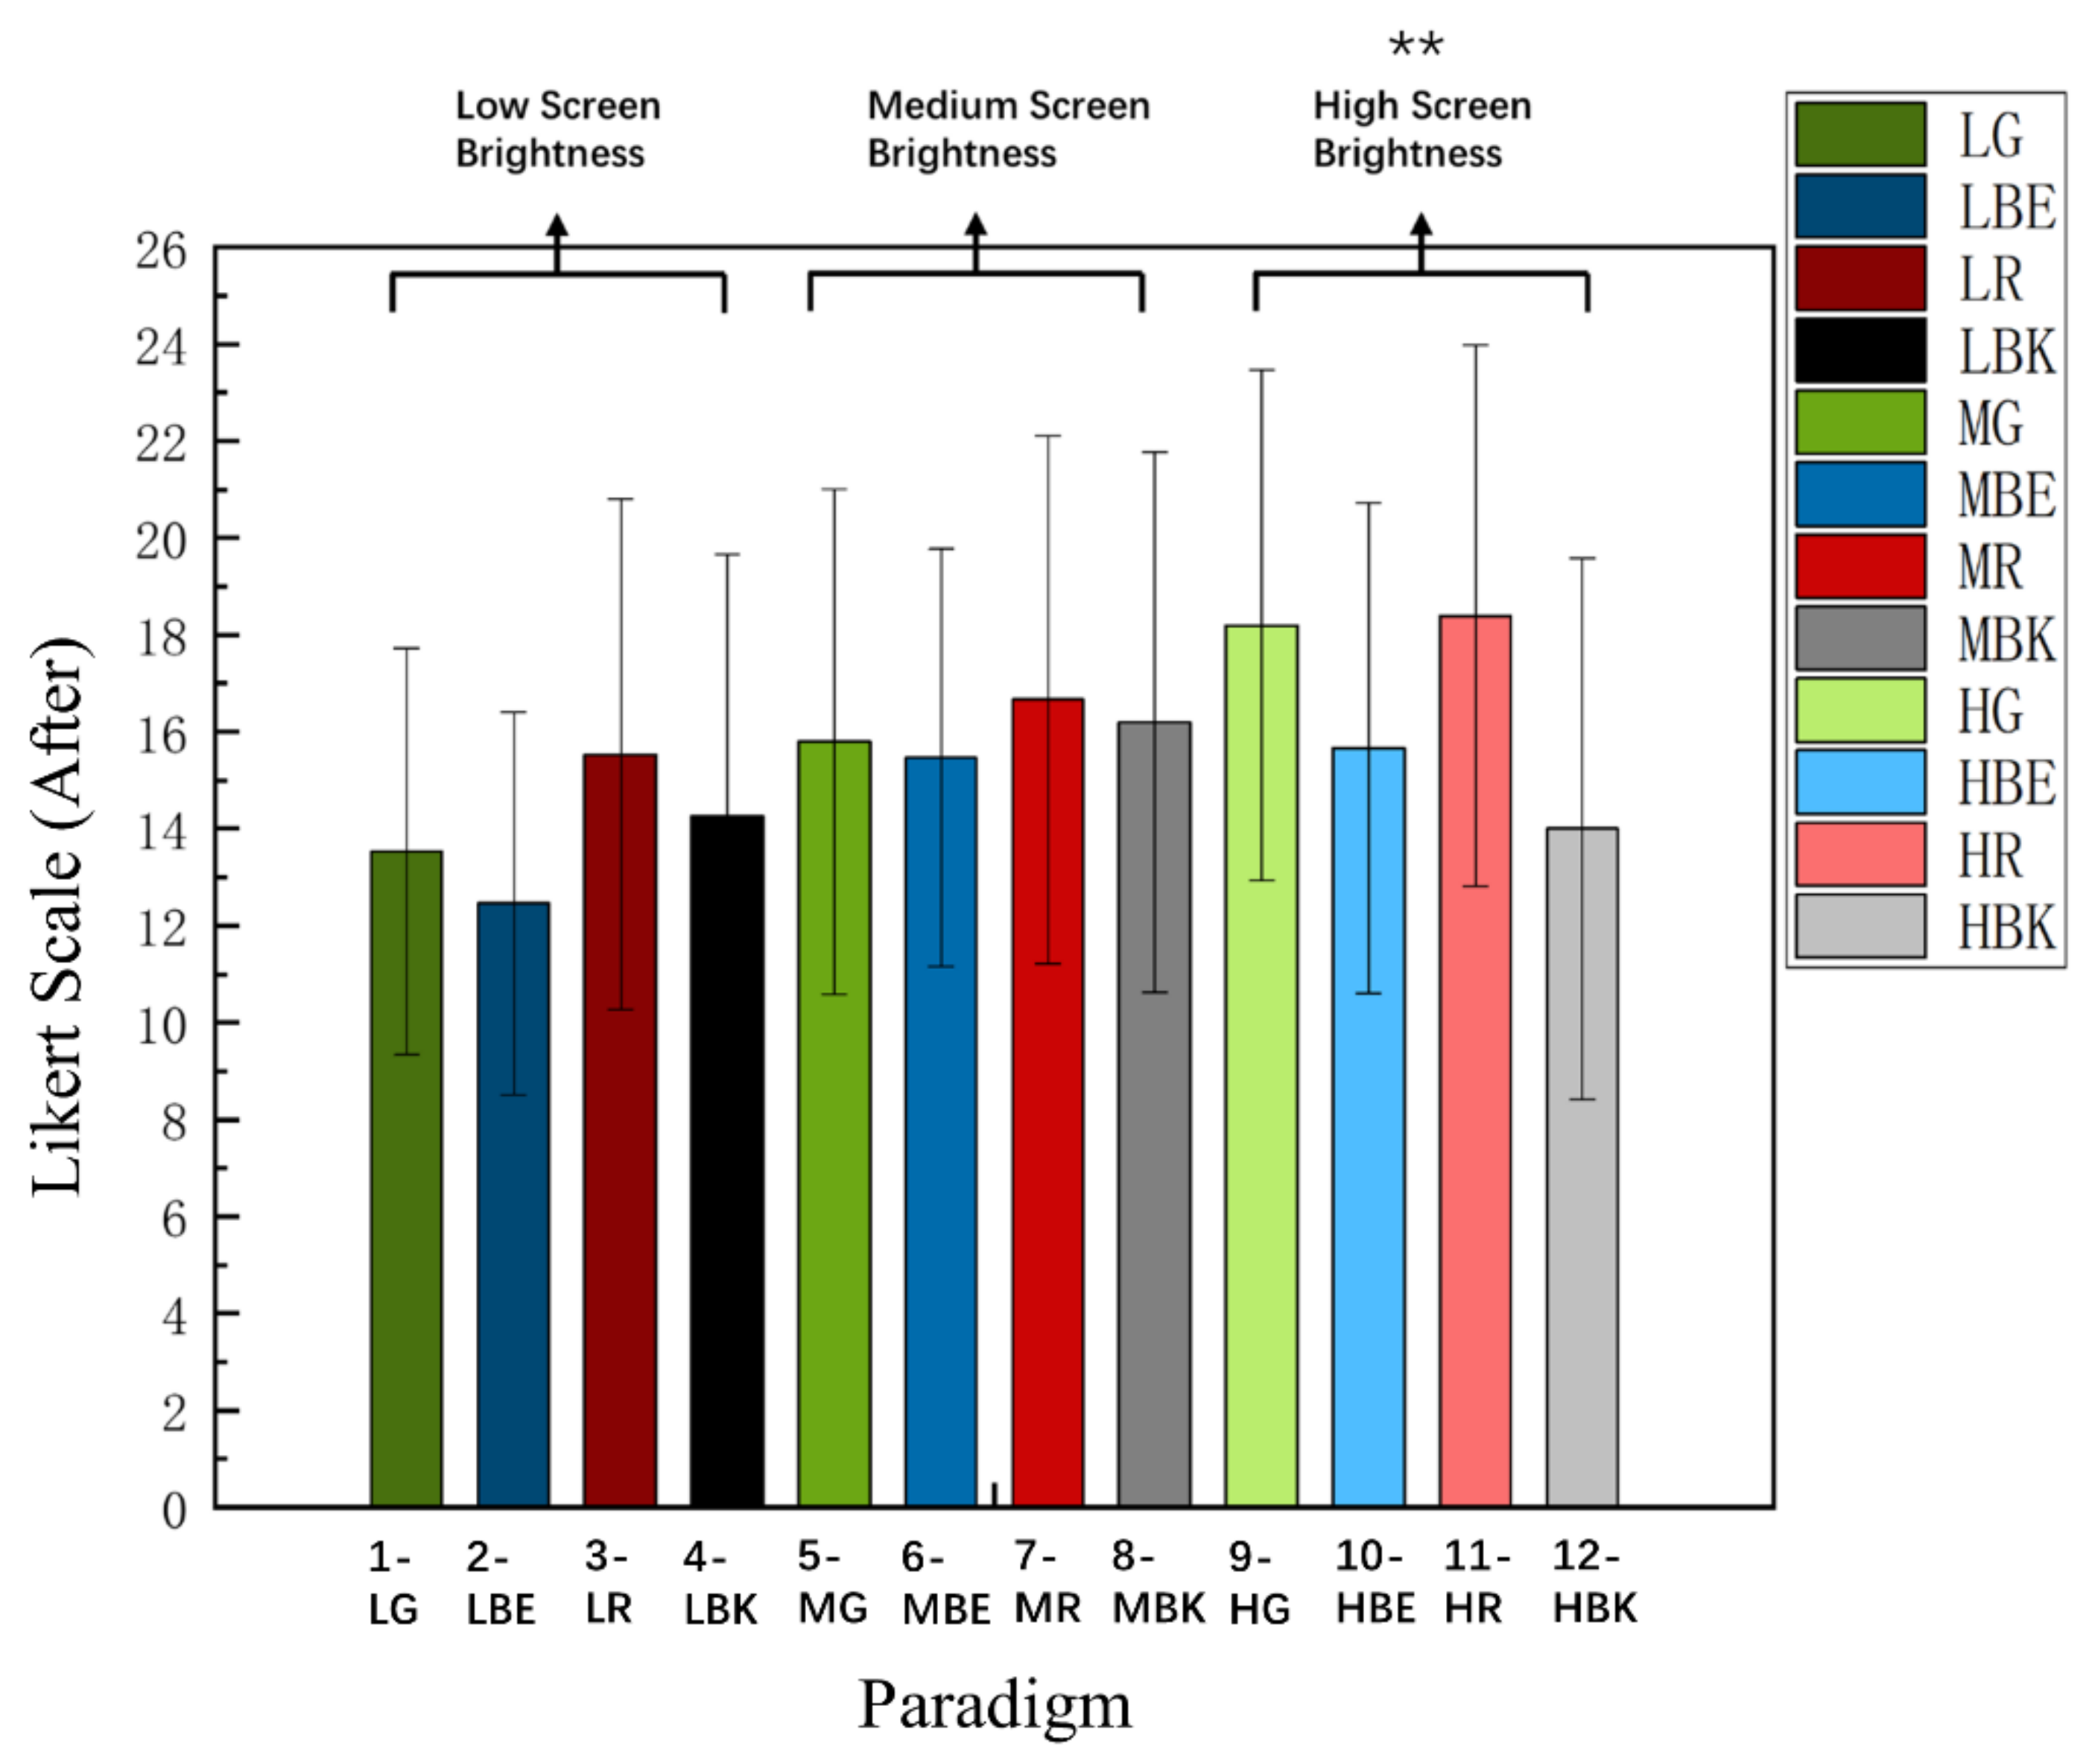
3.2. Comparison of Likert Scale
Figure 6 shows the subjective visual fatigue scores of 15 subjects after the experiment. ANOVA analysis showed that there was a significant difference between the score of subjective visual fatigue and different stimulus paradigms after the experiment [F
(5.582, 78.145) = 3.044,
p = 0.012 *]. Meanwhile, two-way repeated-measures ANOVA showed that the interaction of two factors of “screen brightness” and “paradigm color” yielded significance in the visual fatigue scale [F
(4.515, 63.217) =2.649,
p = 0.035 *]. For the in-depth analysis, 12 stimulus paradigms were divided into three groups by the same brightness and different colors (low brightness (paradigm 1, 2, 3, 4), medium brightness (paradigm 5, 6, 7, 8), high brightness (paradigm 9, 10, 11, 12)). The low brightness group [F
(2.529, 35.405) = 1.855,
p = 0.163] and medium brightness group [F
(2.291, 32.073) = 0.300,
p = 0.772] had no significant difference, but the high brightness group [F
(2.421, 33.897) = 6.875,
p = 0.002 **] and further analysis showed that there were significant differences (Bonferroni Post-Hoc Analysis,
p = 0.003 **) between paradigm 10 (VFS = 14) and paradigm 11 (VFS = 18.4), (Bonferroni Post-Hoc Analysis,
p = 0.044 *) and between paradigm 10 (VFS = 14) and paradigm 12 (VFS = 18.2), indicating that the subjects preferred paradigm 10 (HBK) to paradigm 11 (HR) or paradigm 12 (HG) in the high brightness mode.
Meanwhile, the 12 stimulus paradigms were divided into four groups (green group (paradigm 1, 7, 12), blue group (paradigm 2, 6, 9), red group (paradigm 3, 8, 11), and black group (paradigm 4, 5, 10)) by the same color and different brightness. The green group [F(1.589, 22.243) = 6.918, p = 0.007 **] showed significant differences. Further analysis revealed that there were differences (Bonferroni Post-Hoc Analysis, p = 0.007 **) between paradigm 1 and paradigm 12; the higher the score was, the more the participants felt visual fatigue under the combination of current brightness and current color. The average score of paradigm 1 was 13.5, and that of paradigm 12 was 18.2. The participants preferred paradigm 1 (LG).
More specific analysis of the other three color-groups were shown in the following: blue group [F(1.709, 23.922) = 2.834, p = 0.086]; red group [F(1.732, 24.246) = 2.225, p = 0.135]; black group [F(1.855, 25.965) = 0.921, p = 0.404], which means there was no significant difference between them and no need for further analysis.
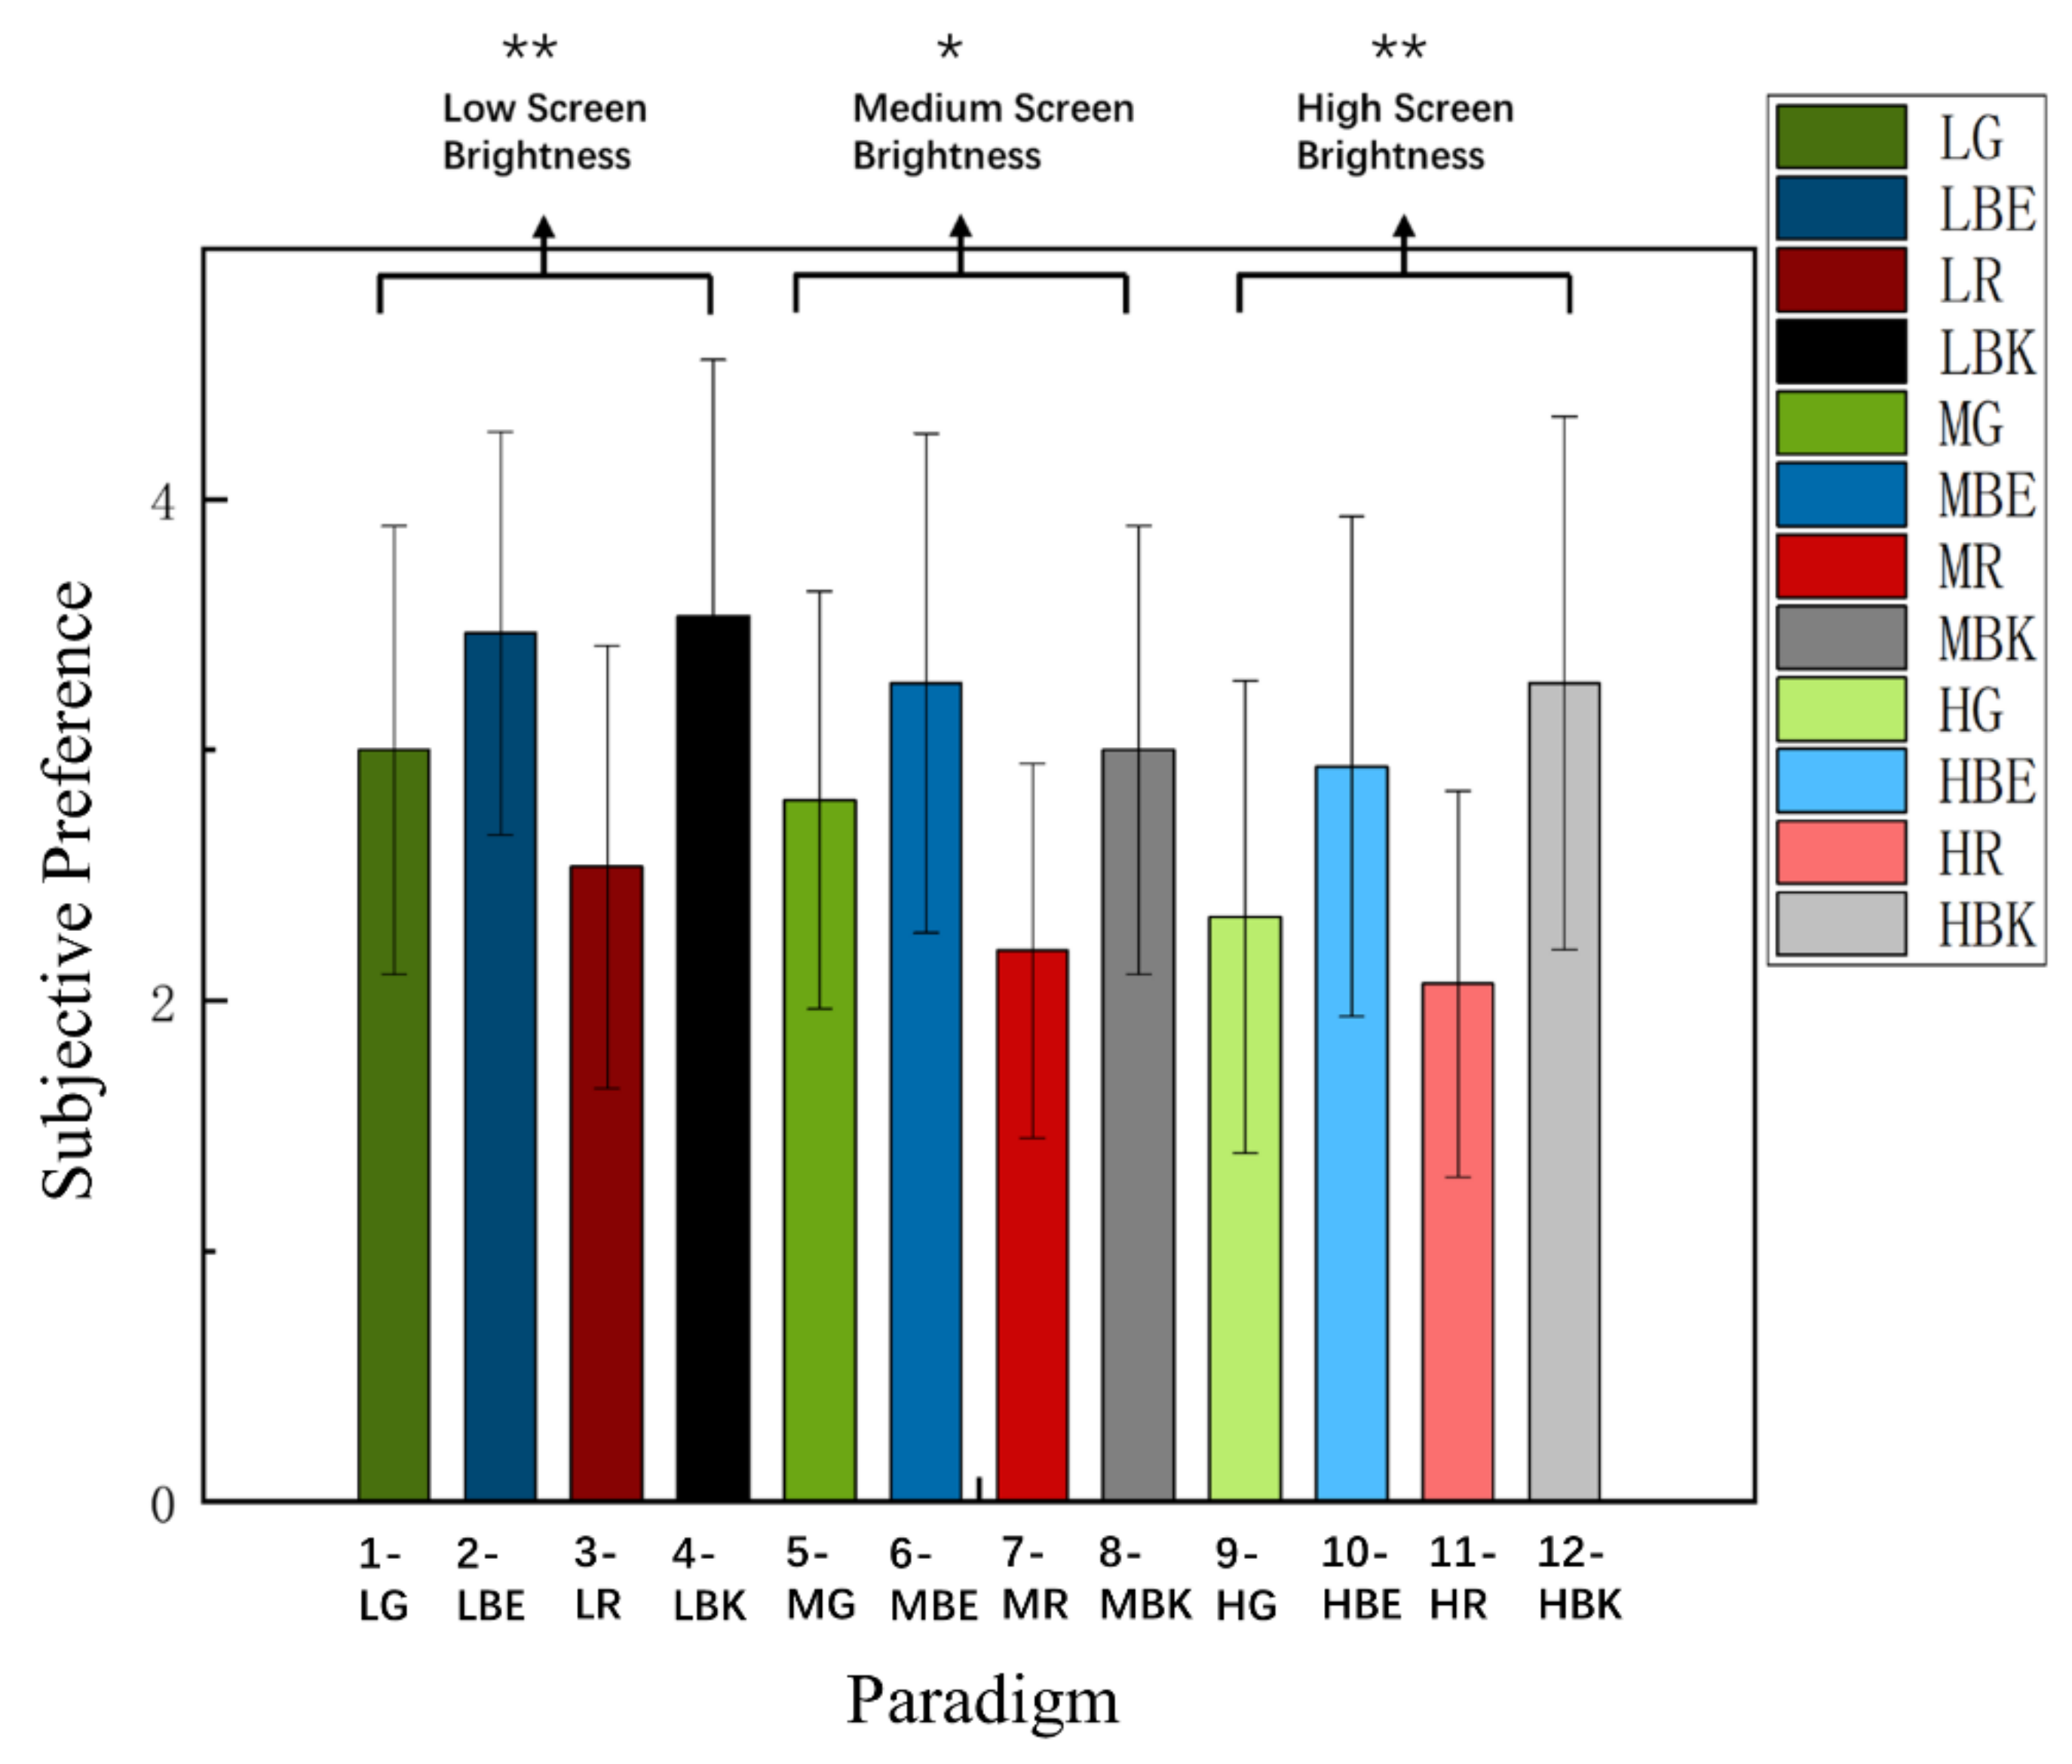
As shown in
Figure 7, it can be found that there are differences in SP scores among different paradigms [F
(5.433, 76.059) =5.284,
p < 0.001 ***]. Two-way repeated-measures ANOVA revealed that the interaction of the two factors of “screen brightness” and “paradigm color” yielded significance in subjective preferences [F
(3.893,54.499) = 4.383,
p = 0.004 **]. The analysis result of the low brightness group [F
(2.009, 28.130) = 5.734,
p = 0.008 **] showed significant differences that led the further analysis. There were significant differences (Bonferroni Post-Hoc Analysis,
p = 0.046 *) between paradigm 2 (SP = 3.5) and paradigm 3 (SP = 2.5), which indicated that the subjects preferred paradigm 2 (LBE) to paradigm 3 (LR) in the low brightness mode.
The same as before, there was a significant difference in the medium brightness group [F(2.683, 37.561) = 4.466, p = 0.011 *], to be more specific, there were significant differences (Bonferroni Post-Hoc Analysis, p = 0.004 **) between paradigm 6 (SP = 3.3) and paradigm 8 (SP = 2.2), which indicated that the subjects preferred paradigm 6 (MBE) to paradigm 8 (MR) in the medium brightness mode.
Similarly, in the high brightness group [F(2.176, 30.459) = 7.499, p = 0.002 **], there was a significant difference. Further analysis showed that there were significant differences (Bonferroni Post-Hoc Analysis, p = 0.003 **) between paradigm 9 (SP = 2.9) and paradigm 11 (SP = 2.1), as well as (Bonferroni Post-Hoc Analysis, p = 0.001 **) between paradigm 10 (SP = 3.3) and paradigm 11 (SP = 2.1), indicating that the subjects preferred paradigm 9 (HBE) and paradigm 10 (HBK) to paradigm 11 (HR) in the high brightness mode.
Meanwhile, the 12 stimulus paradigms were divided into four groups (green group (paradigm 1, 7, 12), blue group (paradigm 2, 6, 9), red group (paradigm 3, 8, 11), and black group (paradigm 4, 5, 10)) by the same color and different brightness. The green group [F(1.662, 14.962) = 4.442, p = 0.036 *] showed significant differences. Further analysis revealed that there were differences (Bonferroni Post-Hoc Analysis, p = 0.045 *) between paradigm 1 and paradigm 12, the higher the score was, the more the participants liked the combination of current brightness and current color. The average score of paradigm 1 was 3, and that of paradigm 12 was 2. The participants preferred paradigm 1 (LG).
Furthermore, the analysis data showed few significances of three other color-groups separately: blue group [F(1.603, 14.429) = 1.000, p = 0.375]; red group [F(1.854, 16.686) = 0.265, p = 0.754], and black group [F(1.597, 14.377) = 2.629, p = 0.114], in which there was no in-depth analysis because of there being no significant difference.
3.3. Comparison of Pupil Diameter Index
For the convenience and standardization of data analysis, in each experiment, the first three experiments (a total of 23 paradigm stimulations, the first three trials were prepared for standard normalization, and the last 20 trials were formal experimental stimuli) were designed to normalize the pupil diameter data of experimental participants.
Figure 8 shows the normalized pupil diameter index between fatigue level 1 and fatigue level 4 of 12 stimulus paradigms among 15 subjects. Two-way repeated-measures ANOVA revealed that the interaction of the two factors of “stimulus paradigm” and “fatigue level” had no significance in the normalized pupil diameter index [F
(2.375, 33.248) = 1.813,
p = 0.173]. Meanwhile, two-way repeated-measures ANOVA illustrated that the interaction of the two factors of “screen brightness” and “paradigm color” yielded significance in the pupil diameter among level 1 and level 4, respectively [F
(3.893,54.499) = 4.383,
p = 0.004 **] and [F
(2.271,31.790) = 9.549,
p < 0.001 ***]. Subsequently, one-way repeated measures ANOVA pointed out a significant difference in the pupil diameter index among twelve paradigms at fatigue level 1 [F
(2.576,36.058) = 8.022,
p < 0.001 ***] and fatigue level 4 [F
(2.936, 41.099) = 14.934,
p < 0.001 ***], respectively. From the above analysis, it can be seen that there is no significant difference in the pupil diameter index under the “stimulation paradigm” and “fatigue level”, but it can be seen from
Figure 8 that the pupil diameter index under a low background brightness is the largest, regardless of whether it is in fatigue level 1 or fatigue level 4; on the contrary, there is no significant difference between the medium background brightness and the high background brightness. In conclusion, visual fatigue was the lightest in the low brightness mode during the whole experiment.
In the in-depth analysis, 12 stimulus paradigms were divided into three groups by the same brightness and different colors as before (low brightness (paradigm 1, 2, 3, 4), medium brightness (paradigm 5, 6, 7, 8), high brightness (paradigm 9, 10, 11, 12)). The low brightness group [F(1.355, 18.974) = 0.148, p = 0.780] showed no significant differences. Similarly, there was no significant difference in the medium brightness group [F(1.163, 16.276) = 0.097, p = 0.797] and high brightness group [F(1.122, 15.714) = 0.857, p = 0.381]. Therefore, further analysis was not necessary.
Meanwhile, the twelve stimulus paradigms were divided into four groups (green group (paradigm 1, 7, 12), blue group (paradigm 2, 6, 9), red group (paradigm 3, 8, 11), and black group (paradigm 4, 5, 10)) by the same color and different brightness. The green group [F(1.614, 22.593) = 16.674, p < 0.001 ***] showed significant differences. Further analysis revealed that under the same color stimulus paradigm, there were significant differences in the pupil diameter data after different brightness experiments. There were significant differences (Bonferroni Post-Hoc Analysis, p < 0.001 ***; Bonferroni Post-Hoc Analysis, p < 0.001 ***) between paradigms 1 and 12, and paradigms 7 and 12, respectively. It can be concluded that the experimental participants were more prone to visual fatigue in a high brightness mode when they were stimulated by the green paradigm under different screen brightness.
Meanwhile, the blue group [F(1.358, 19.005) = 4.469, p = 0.038 *] inferred that there was a significance. There were significant differences (Bonferroni Post-Hoc Analysis, p = 0.004 **; Bonferroni Post-Hoc Analysis, p = 0.001 **) between paradigms 2 and 9, and paradigms 6 and 9, respectively. It can be induced that the experimental participants were more prone to visual fatigue in the high brightness mode when they were stimulated by the blue paradigm with different background brightness.
Similarly, the red group [F(1.402, 19.634) = 21.919, p < 0.001 ***] explained significant differences. There were significant differences (Bonferroni Post-Hoc Analysis, p < 0.001 ***; Bonferroni Post-Hoc Analysis, p < 0.001 ***) between paradigms 3 and 11, and paradigms 8 and 11, respectively. It can be summed up that the experimental participants were more prone to visual fatigue in the high brightness mode when they were stimulated by the red paradigm with different background brightness.
Finally, the black group [F(1.480, 20.715) = 34.599, p < 0.001 ***] illustrated that there was a significance. There were significant differences (Bonferroni Post-Hoc Analysis, p < 0.001 ***; Bonferroni Post-Hoc Analysis, p < 0.001 ***) between paradigms 4 and 10, and paradigms 5 and 10, respectively. It could also be concluded that the experimental participants were more prone to visual fatigue in the high brightness mode when they were stimulated by the black paradigm with different background brightness.
To summarize, under the same brightness mode, different color paradigm stimulation does not cause a significant difference in the pupil diameter index, that is to say, the degree of the visual fatigue of the subjects is unrelated to the color of the stimulation paradigm. On the contrary, under the same color paradigm stimulation, the pupil diameter index is directly affected by the background brightness mode, not only in the low brightness background, the eyes of subjects are more relaxed, and during the experiment, the subjects are more likely to feel visual fatigue in the high brightness mode.
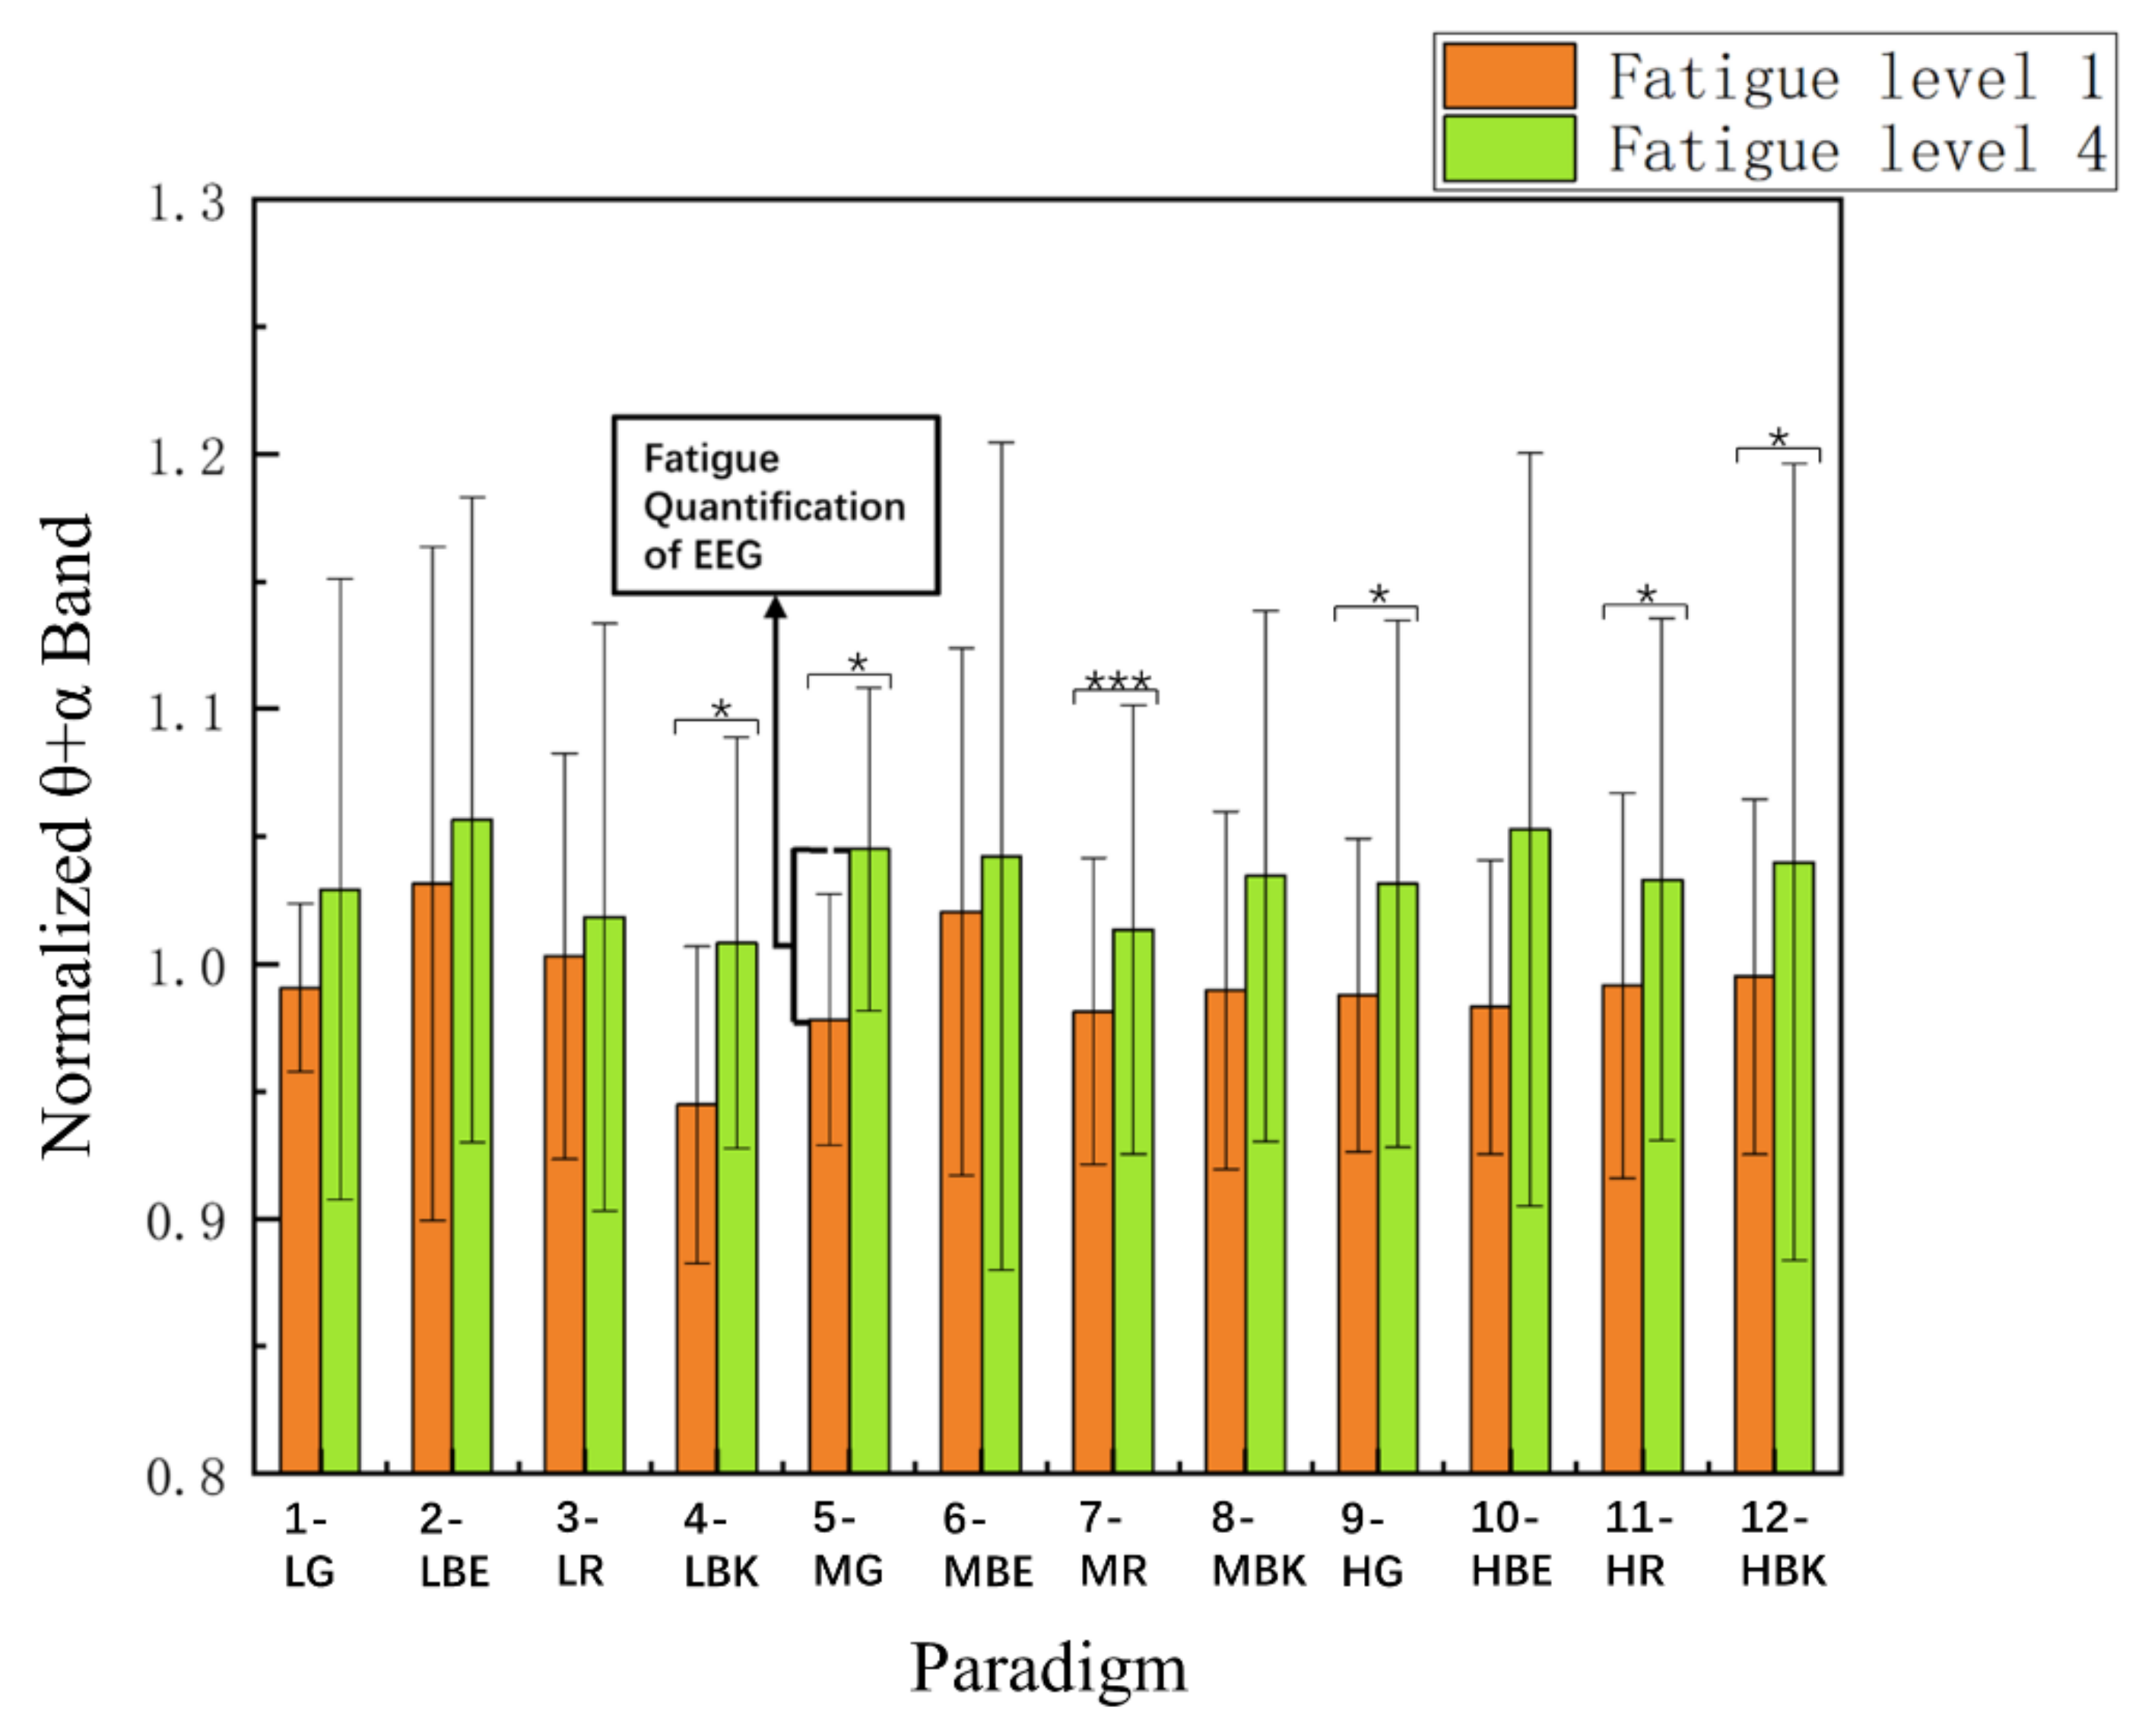
3.4. Comparison of θ + α Index
The θ + α frequency band index is an objective quantitative index of the EEG signal for the visual fatigue of subjects [
41,
42]. According to the baseline data of the first three trials of each paradigm according to each subject, the standardized θ + α frequency band index of each paradigm is calculated.
Figure 9 shows the normalized θ + α frequency band index between fatigue level 1 and fatigue level 4 of 12 paradigm stimulation modes among 15 subjects.
Two-way repeated-measures ANOVA indicated that the interaction of the two factors of the “stimulus paradigm” and “fatigue level” was non-significant in the normalized θ + α index [F(4.388, 61.433) = 1.170, p = 0.334]. The factor of the “stimulus paradigm” had an insignificant effect on the θ + α index [Greenhouse–Geisser F(3.449, 48.288) = 2.658, p = 0.051], and the factor of the “fatigue level” had an insignificant effect on the θ + α index [F(1.000, 14.000) = 0.006, p = 0.938]. Meanwhile, two-way repeated-measures ANOVA illustrated that the interaction of the two factors of the “screen brightness” and “paradigm color” yielded significance in the θ + α index among level 1 and level 4, respectively [F(3.258,45.615) = 1.631, p = 0.192] and [F(2.763,38.678) = 0.849, p = 0.467].
It could be clearly seen that the changing trend of the 12 paradigms is the same, they all increase from fatigue level 1 to fatigue level 4, and the change variables (Mean = 0.042 ± SD = 0.017) tend to be the same. It also can be seen that the objective index of the θ + α frequency band EEG signal induced by the 12 paradigms is unrelated to the screen brightness and paradigm color. All of them can cause almost the same amount of visual fatigue.
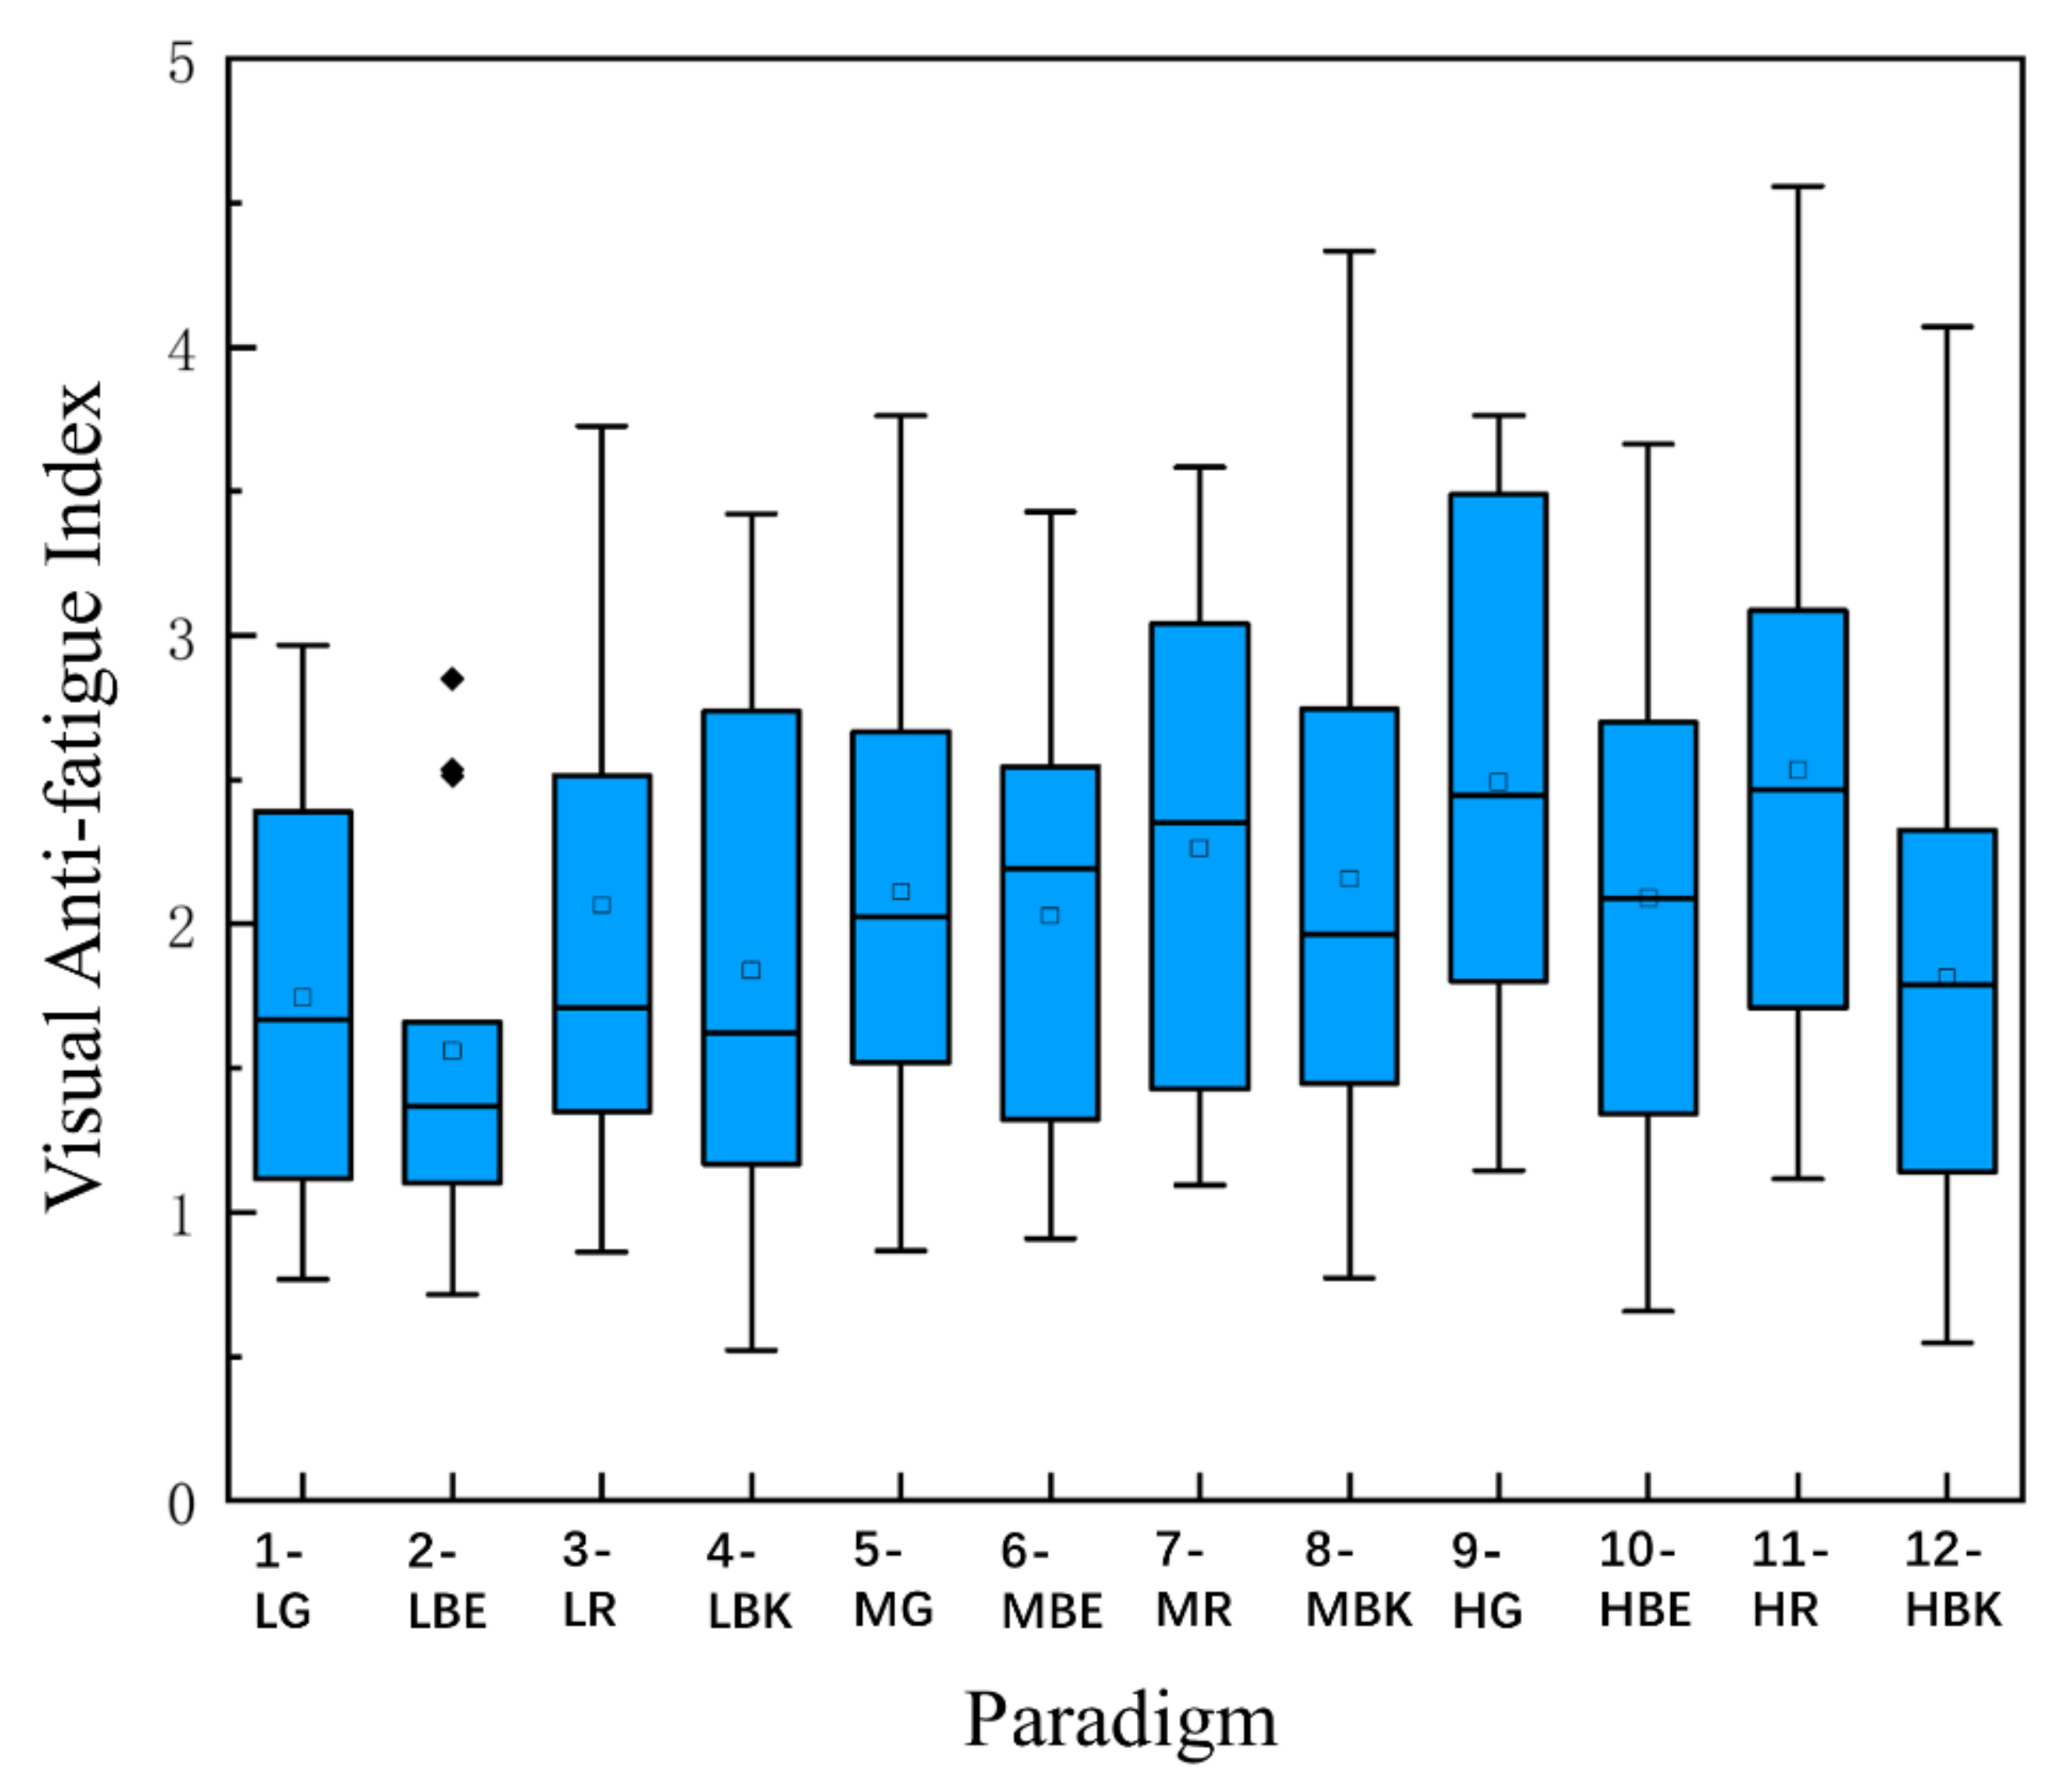
3.5. Visual Anti-Fatigue Index
In order to unify the index and measure visual fatigue more intuitively, a new definition named the visual anti-fatigue index (VAI) is proposed, which combines the four indexes mentioned earlier in this paper. Considering the previous literature [
48,
49] and the practical experience in the experiment, the relevant parameters corresponding to the four indexes are determined:
where
represents the
-th subject, n denotes the number of subjects in total,
a = 0.5,
b = 0.3,
c = 0.15,
d = 0.05,
is the normalized pupil diameter at fatigue level 1,
is the normalized pupil diameter at fatigue level 4,
is the normalized α + θ frequency band amplitude value of fatigue level 1,
is the normalized α + θ frequency band amplitude value of fatigue level 4,
is the subjective visual fatigue score of subjects on Likert scale before the experiment,
is the subjective visual fatigue score of subjects on the Likert scale after the experiment, and
is the subjective preference score.
The weight coefficients a (pupil diameter weight), b (θ + α band CCA coefficient weight), c (visual fatigue scale weight), and d (subjective preference weight) were set as 0.5, 0.3, 0.15, and 0.05, subjectively. The following are reasons for this setting: firstly, subjective factors are more easily affected by the mood, state, sleep, and other uncertain factors of subjects; therefore, the subjective weight should be less than the objective weight. Secondly, the questionnaire of VFS refers to other scientific works, which is more in line with general cognition and makes VFS more credible than SP. Thirdly, it is obvious that one of the most intuitive manifestations of visual fatigue is a change in the pupil diameter, thus PD deserves the maximum weight. Fourthly, the weight of the θ + α band is set between the weight of PD and the weight of VFS.
The lower the visual anti-fatigue index, the better the anti-fatigue effect of this mode. It can be seen from
Figure 10 that the general anti-fatigue performance of the low screen brightness mode is better than that of the medium and high screen brightness modes [F
(5.625, 78.744) = 3.347,
p = 0.006 **]. Further analysis under the same brightness but different colors situation, which includes the low screen brightness mode (Mean = 1.802 ± SD = 0.766), medium screen brightness mode (Mean = 2.140 ± SD = 0.792), and high screen brightness mode (Mean = 2.233 ± SD = 0.881), shows that the anti-fatigue performance of the low screen brightness mode is better than the other two modes. Under the same color but different brightness situation, which includes the green group (Mean = 2.117 ± SD = 0.825), blue group (Mean = 1.892 ± SD = 0.720), red group (Mean = 2.288 ± SD = 0.860), and black group (Mean = 1.937 ± SD = 0.868), it is indicated that, in the visual anti-fatigue index dimension, red > green > black > blue, and moreover, the anti-fatigue effect of blue is the best, and the anti-fatigue effect of red is the worst.


 ,
, 