
An Electrochemical Sensor Based on Carbon Paper Modified with Graphite Powder for Sensitive Determination of Sunset Yellow and Tartrazine in Drinks

 ,
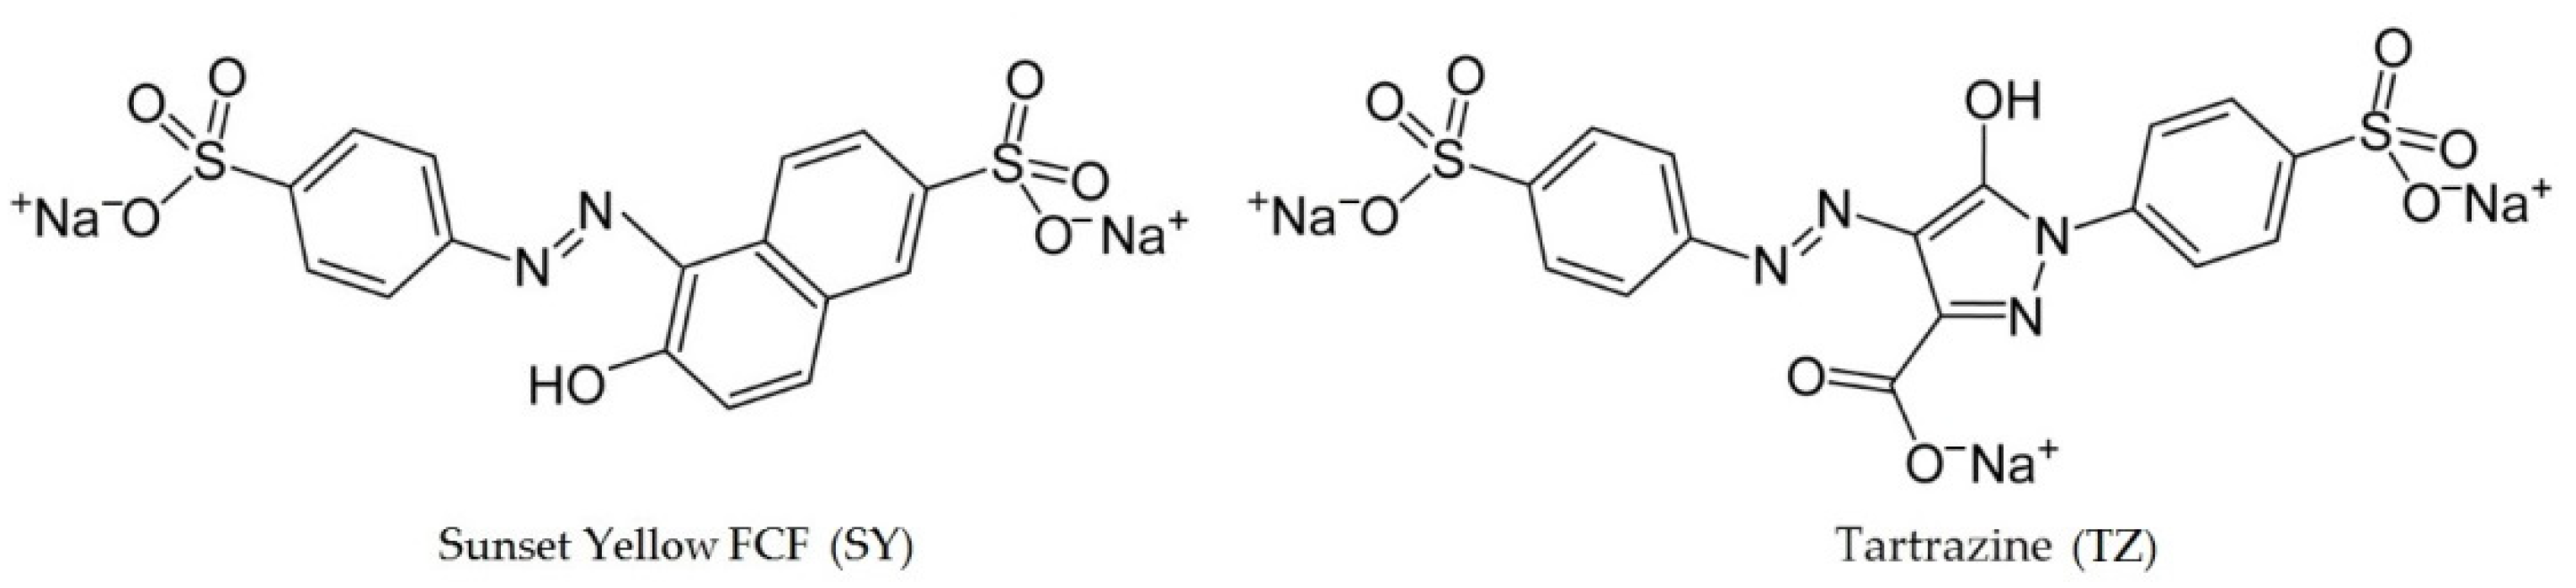
,  , and
, and 
Abstract
:
1. Introduction
- -
- To select a CP modifier,
- -
- To specify optimal conditions and study the mechanism of electrochemical transformation of azo colorants on a modified CP electrode,
- -
- To evaluate the analytical capabilities of the developed sensor,
- -
- To test the developed sensor in the electroanalysis of beverages.
2. Materials and Methods
2.1. Chemicals and Materials
2.2. Equipment and Electrodes
2.3. Procedures
2.3.1. Electrodes Preparation
2.3.2. Electrochemical Measurements
2.3.3. Sample Preparation
2.3.4. Calculations and Result/Data Processing
3. Results
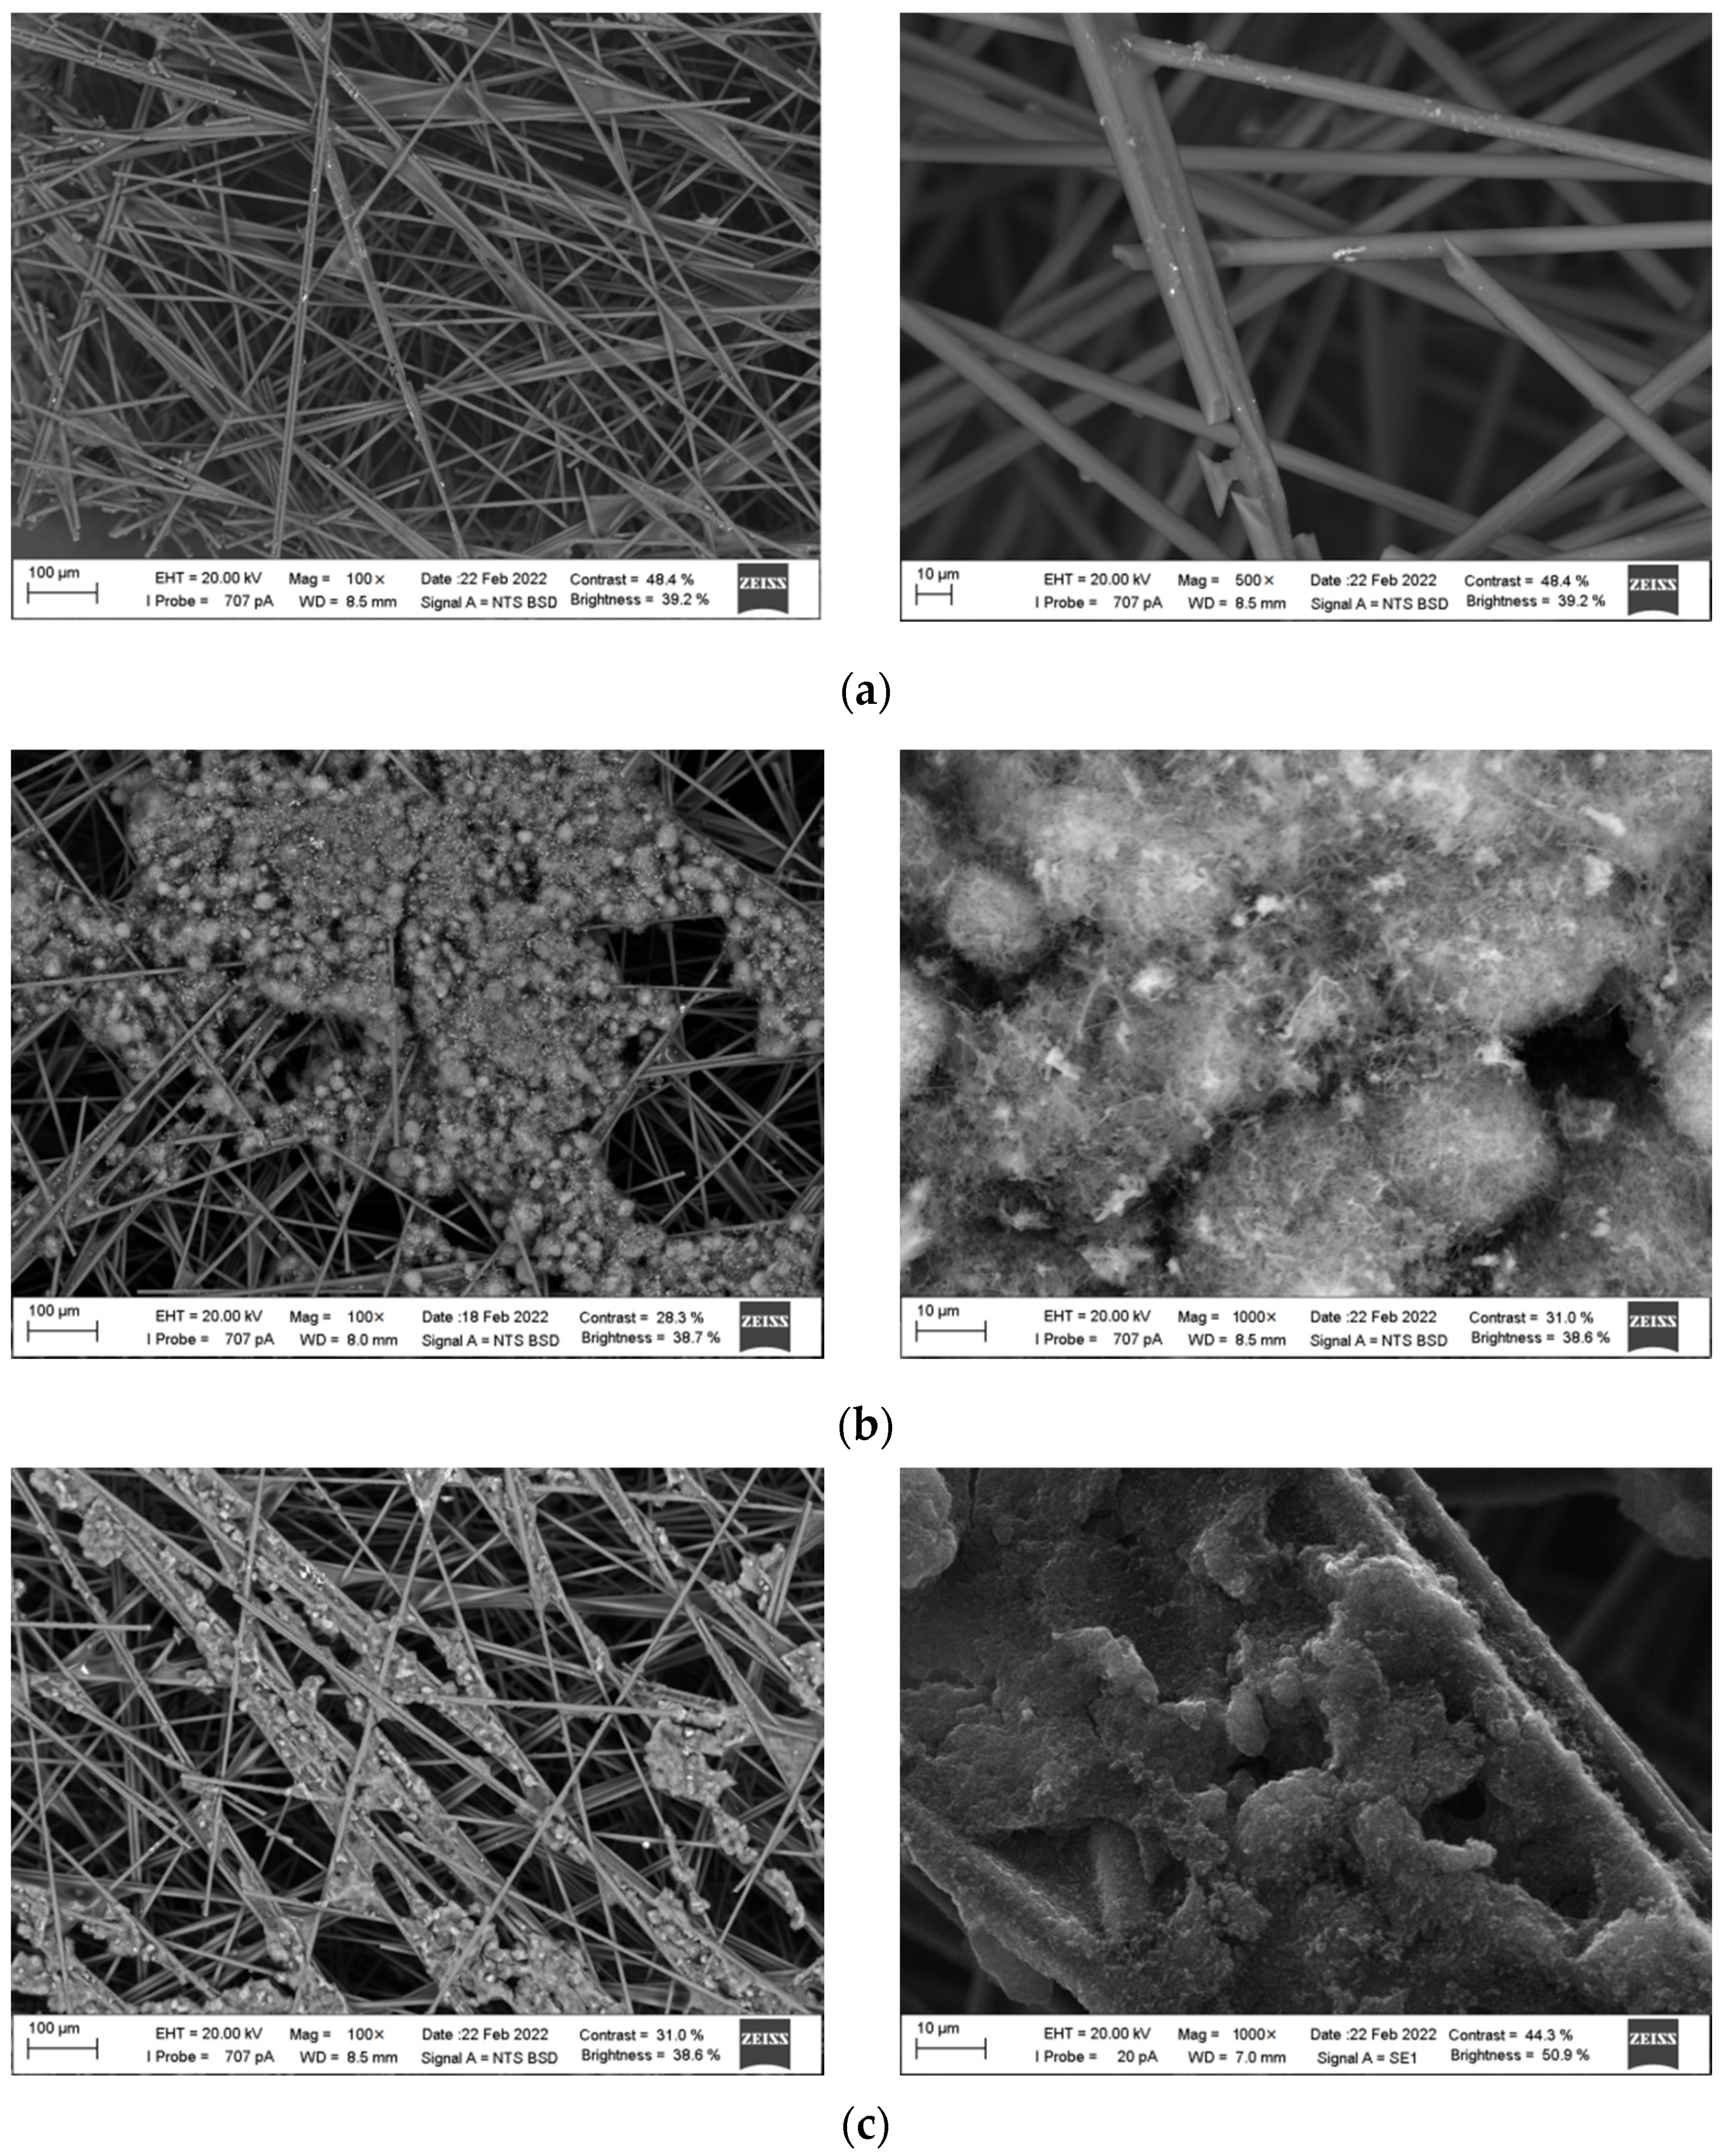
3.1. Electronic Microscopy of Electrodes
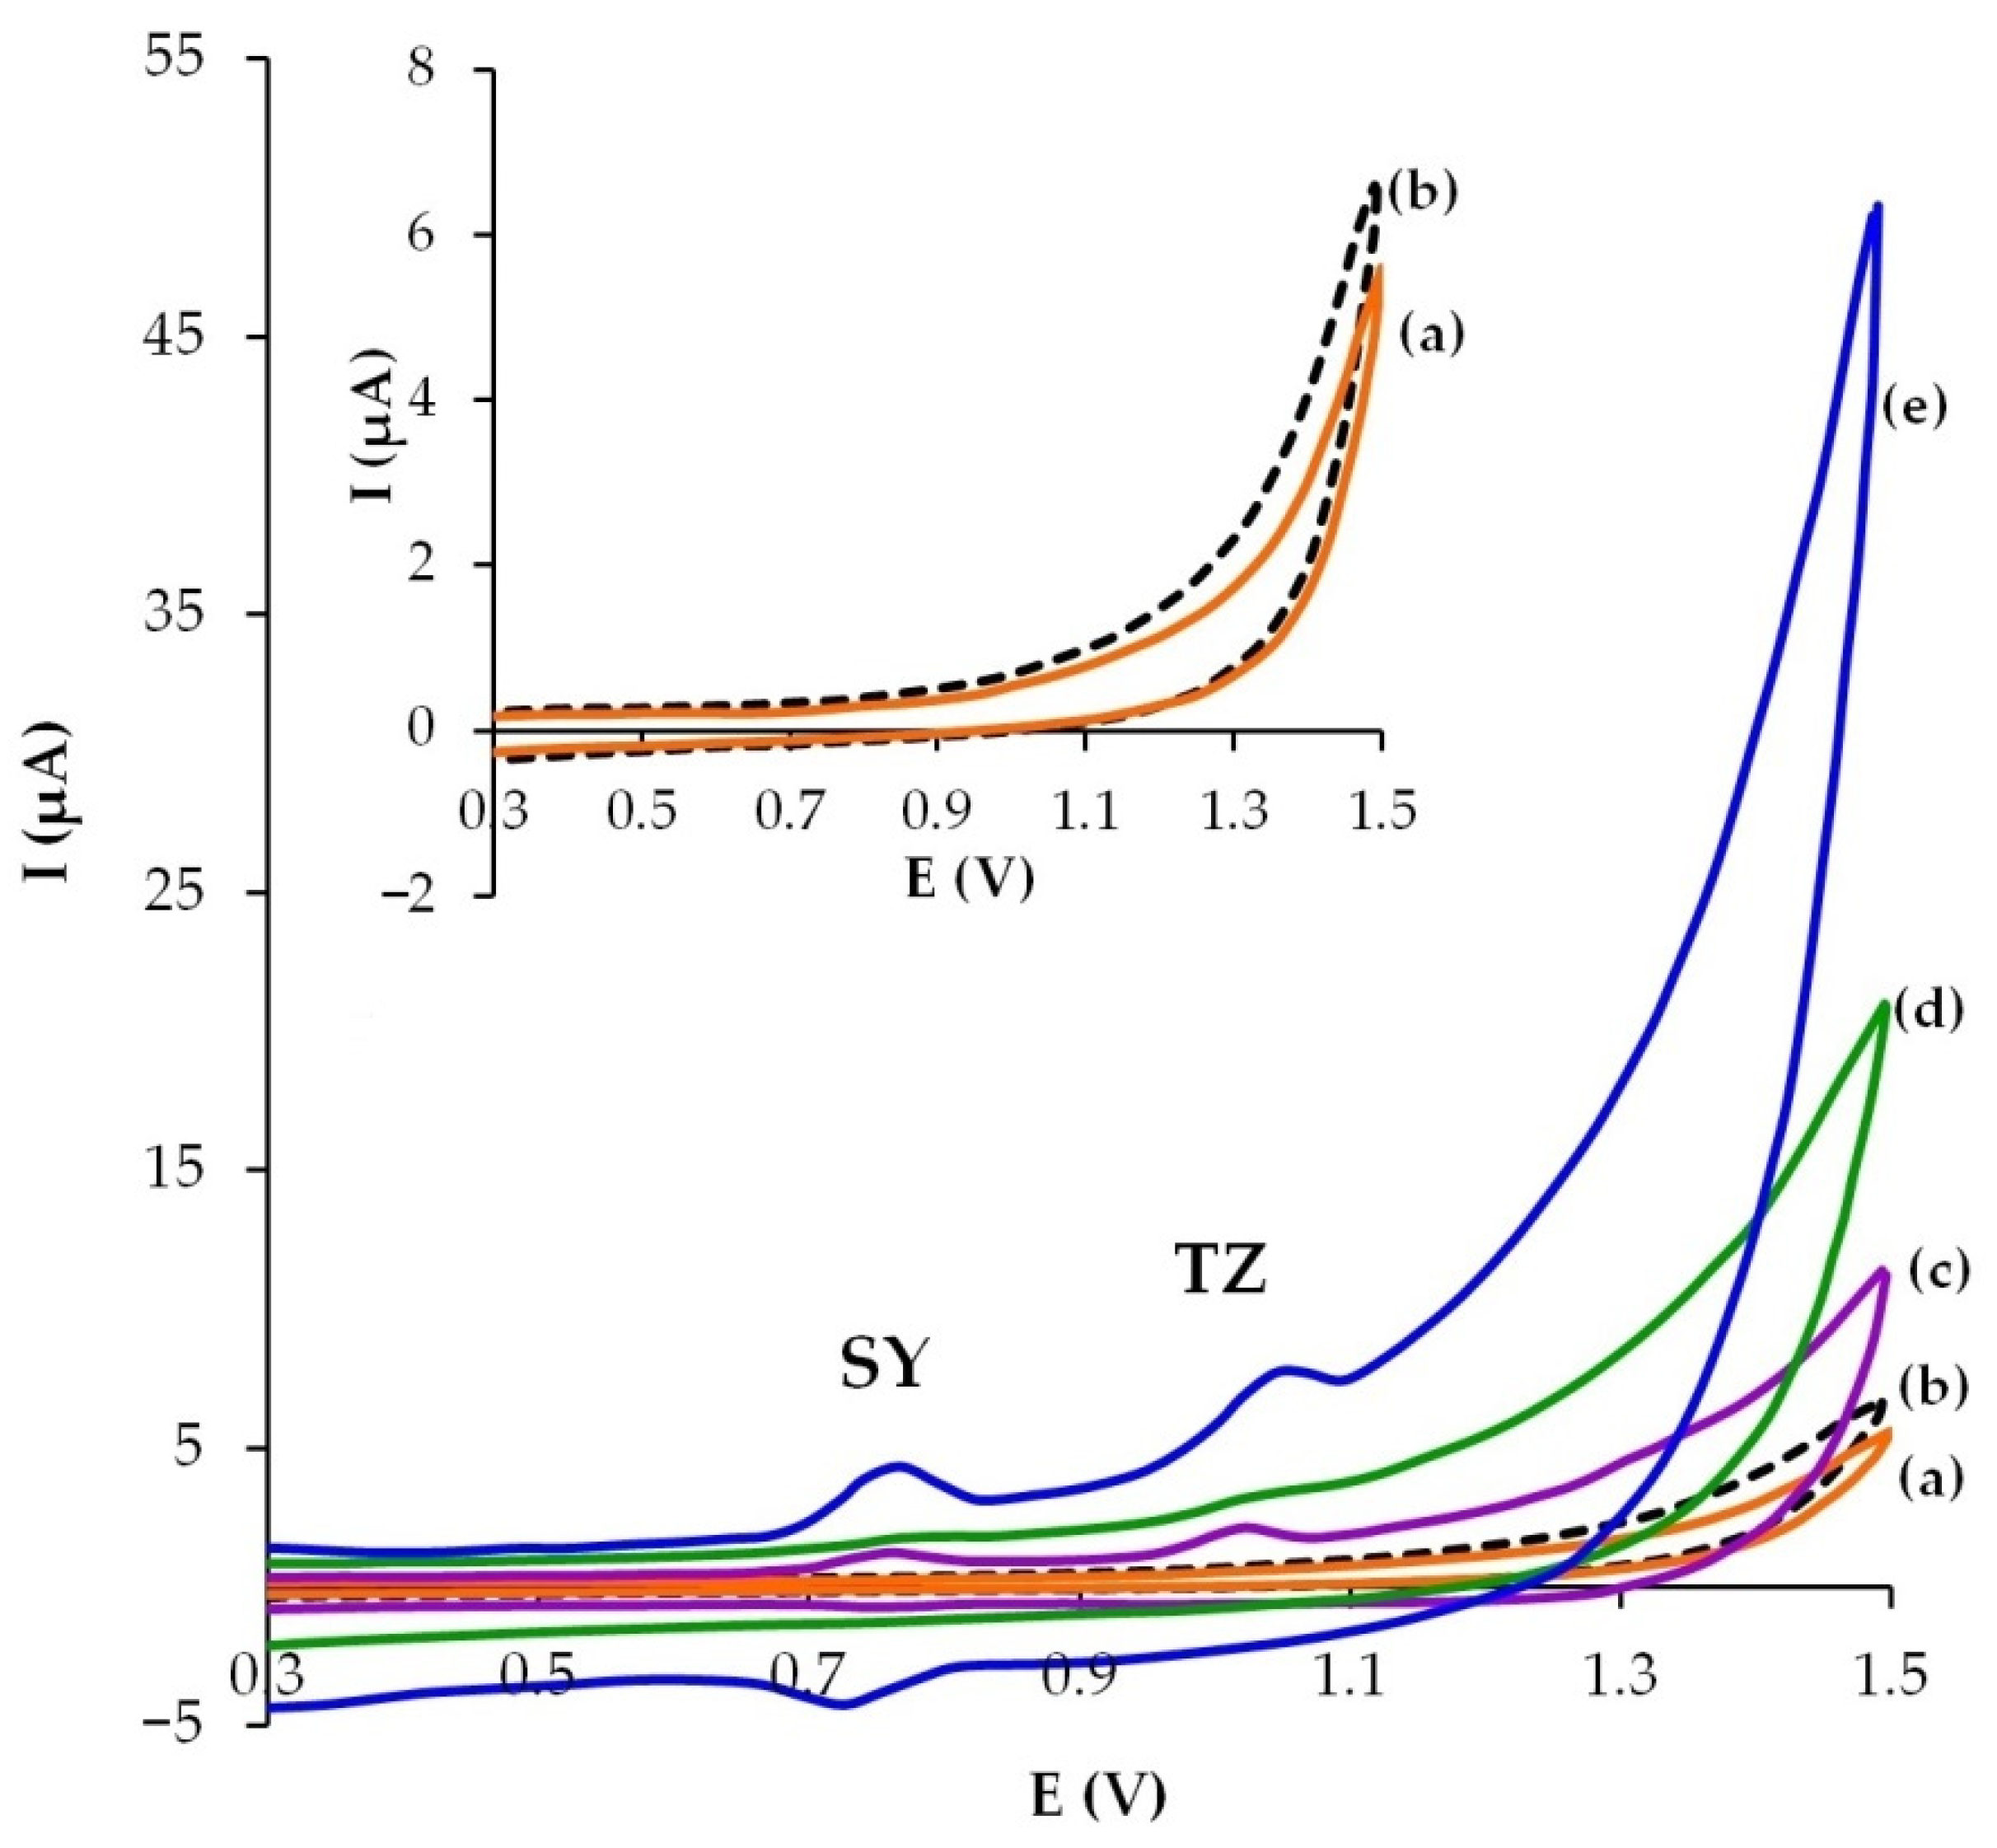
3.2. Electrochemical Behavior of SY and TZ on Modified CP Electrodes
3.3. Selection of the Optimum Volume of Modifier
3.4. Characteristics of CP and GrP/CP Electrodes
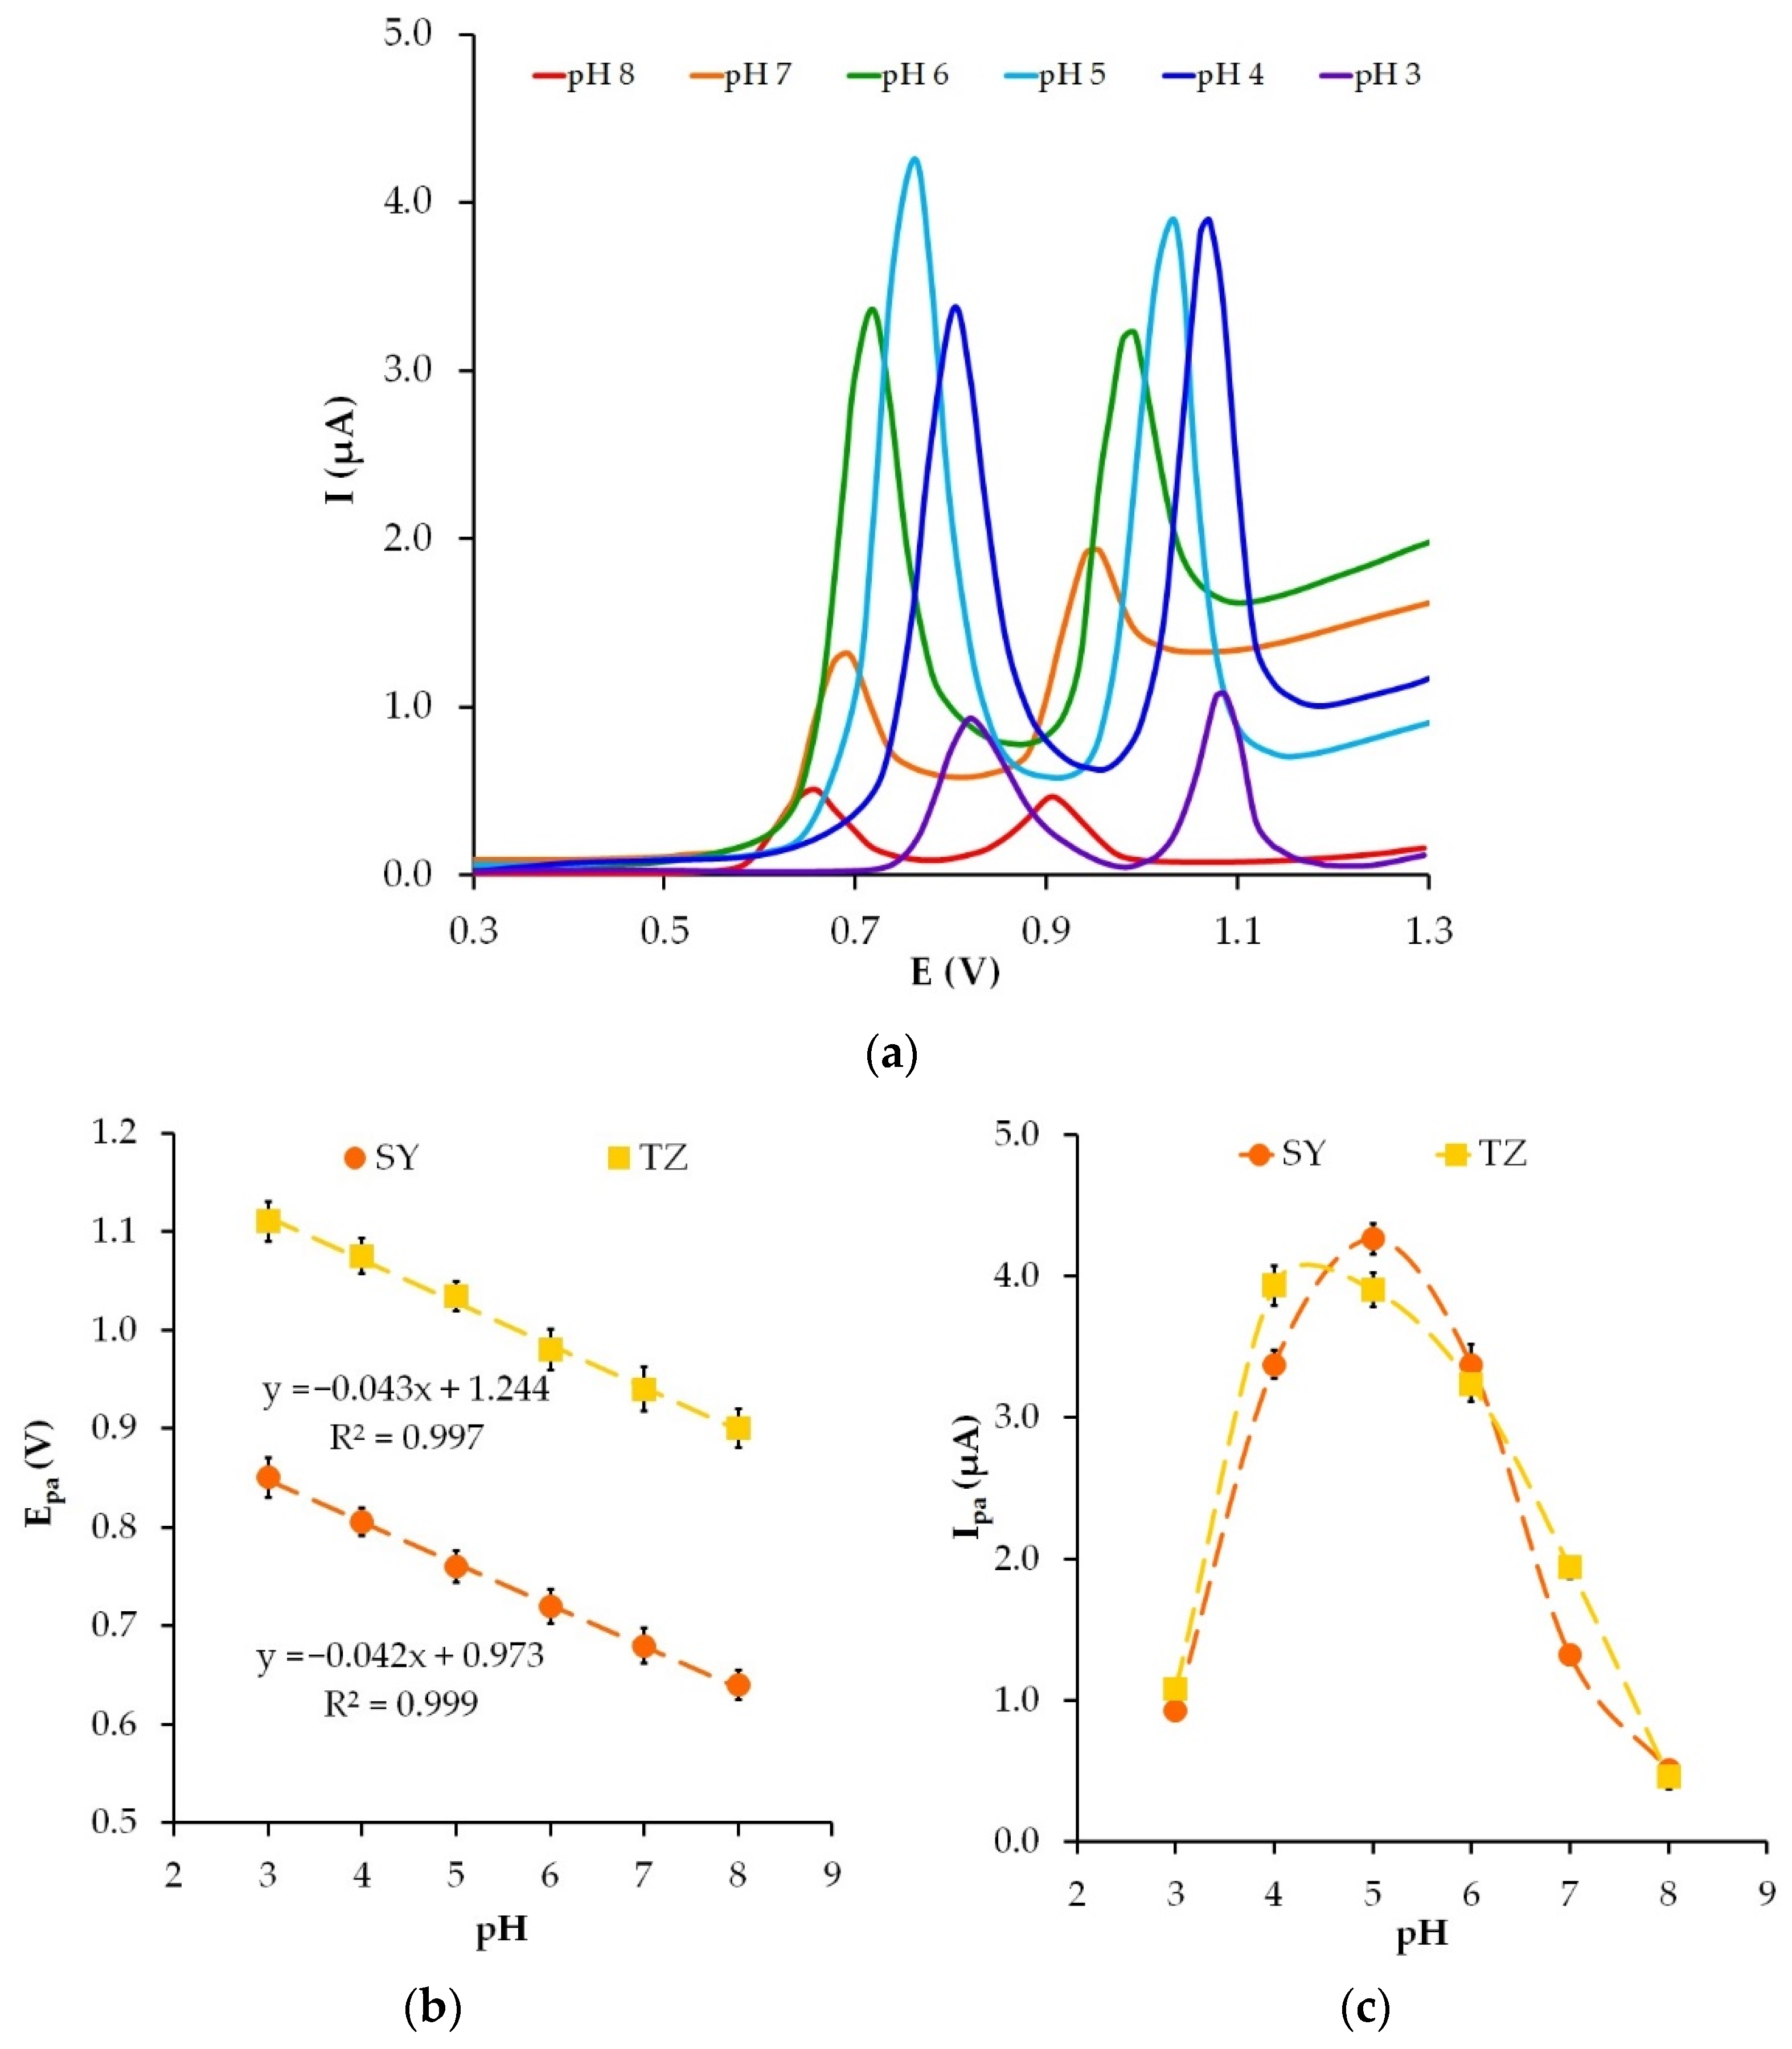
3.5. The pH Effect
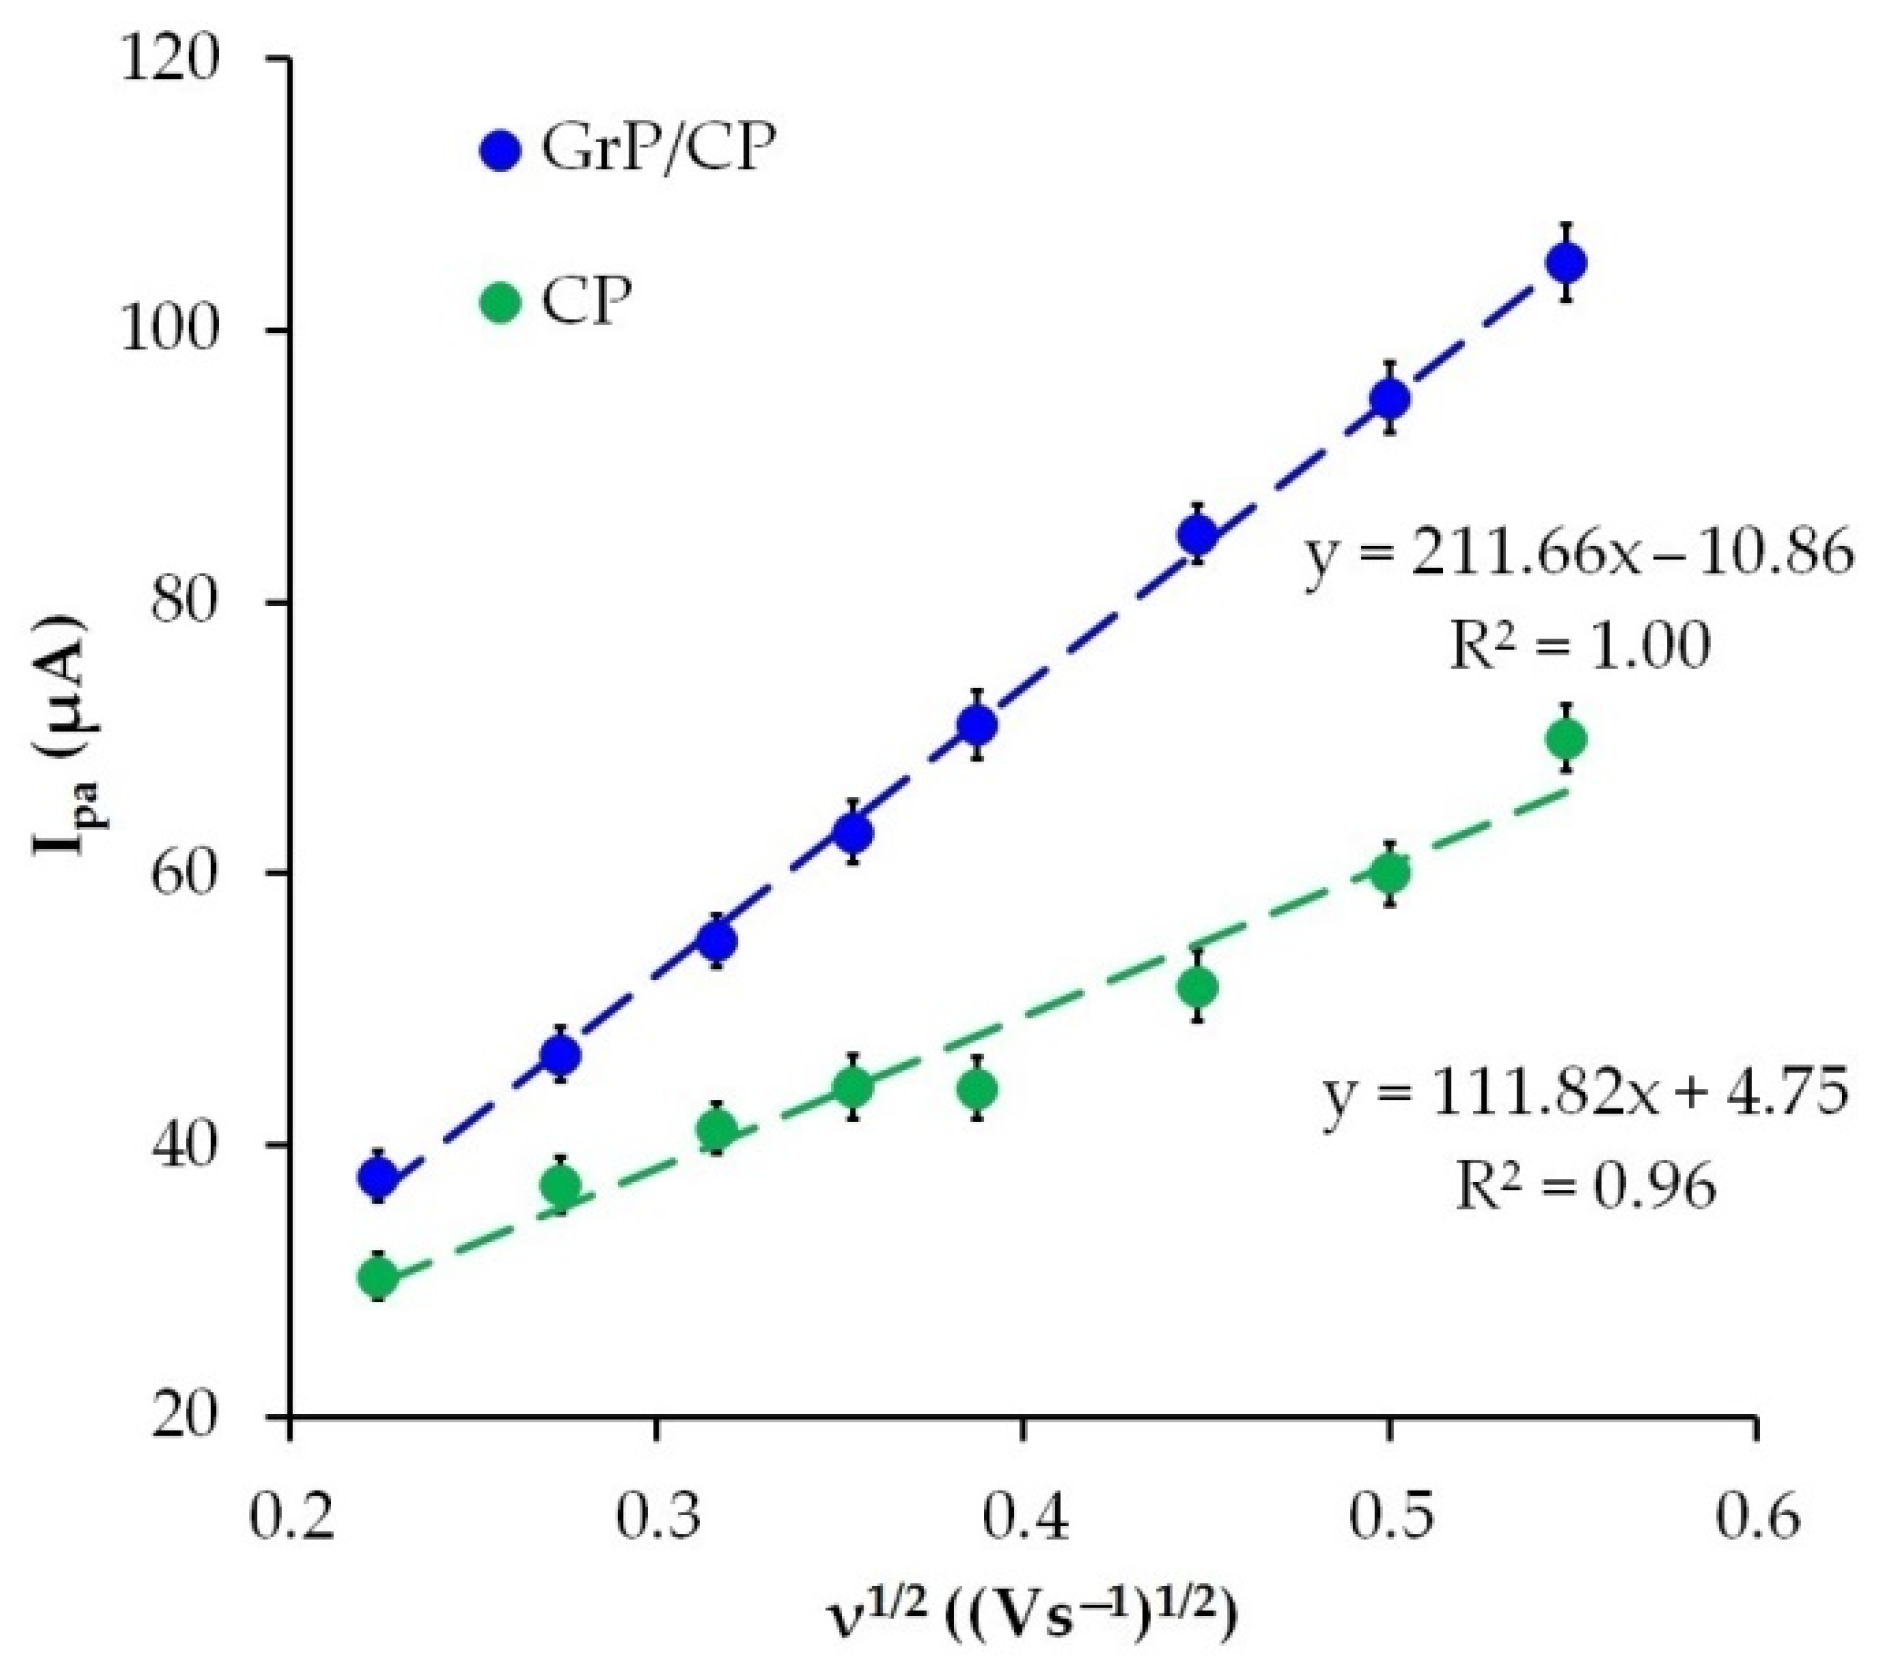
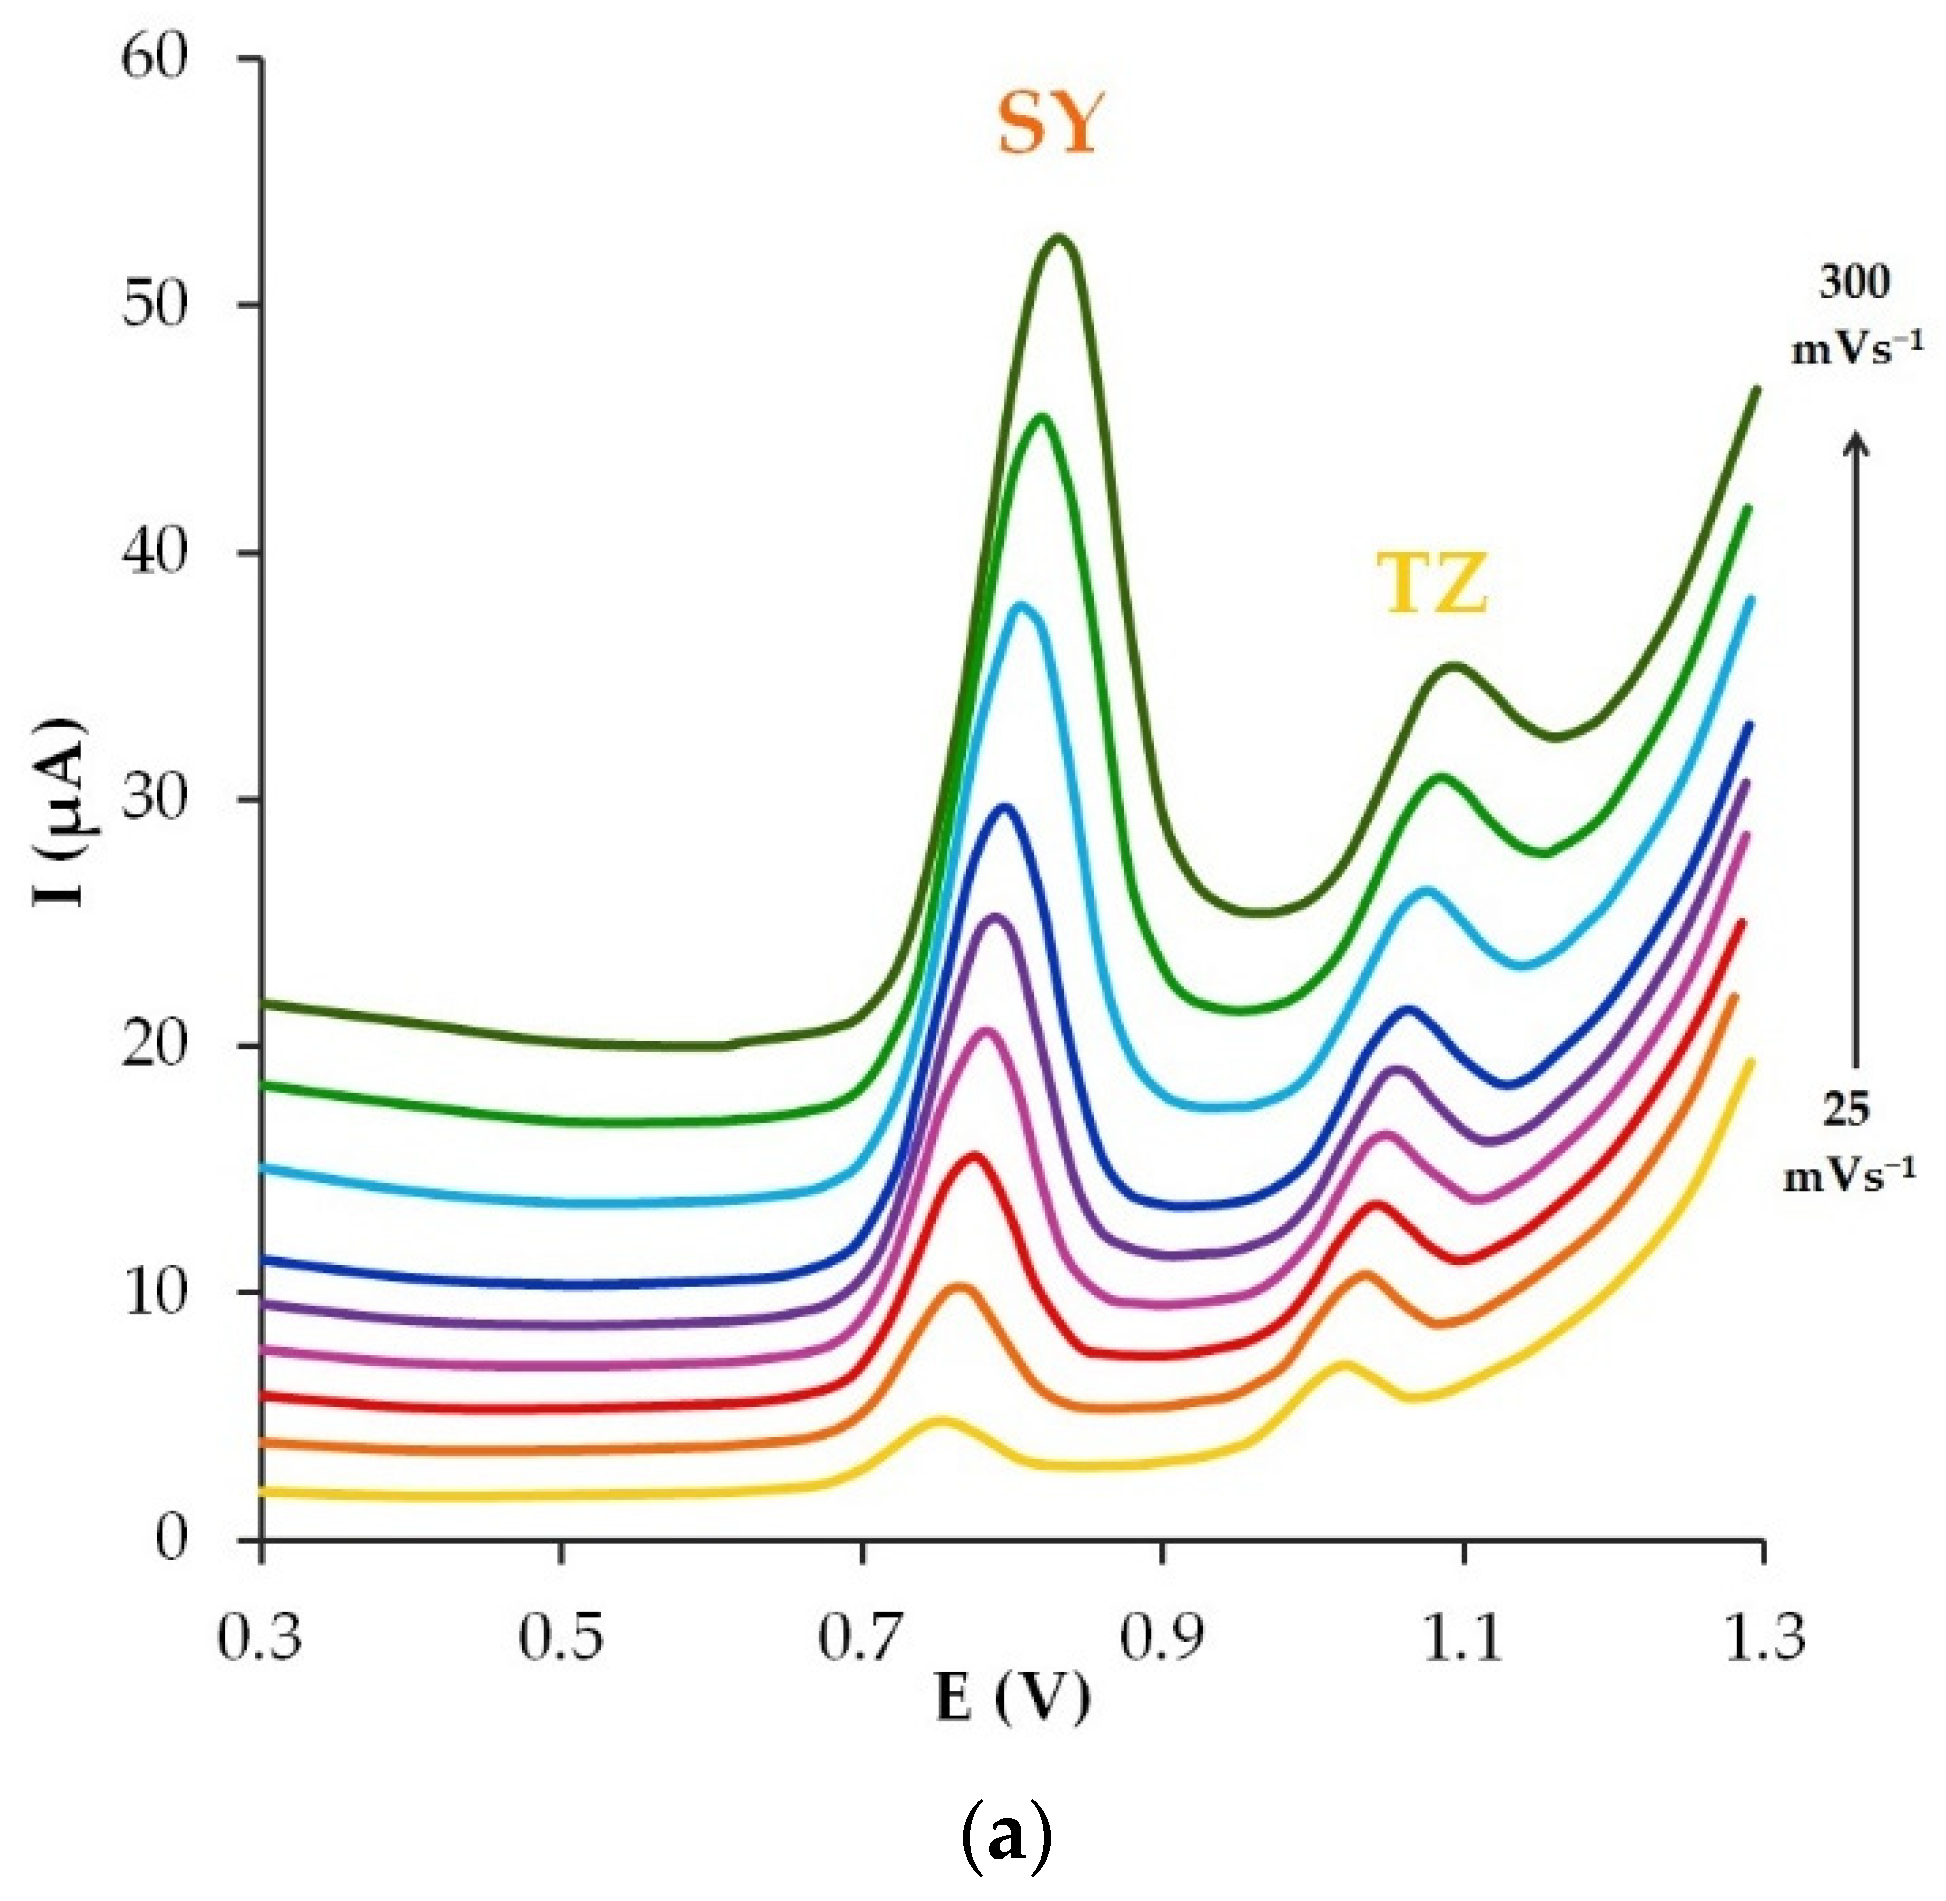
3.6. The Scan Rate Effect
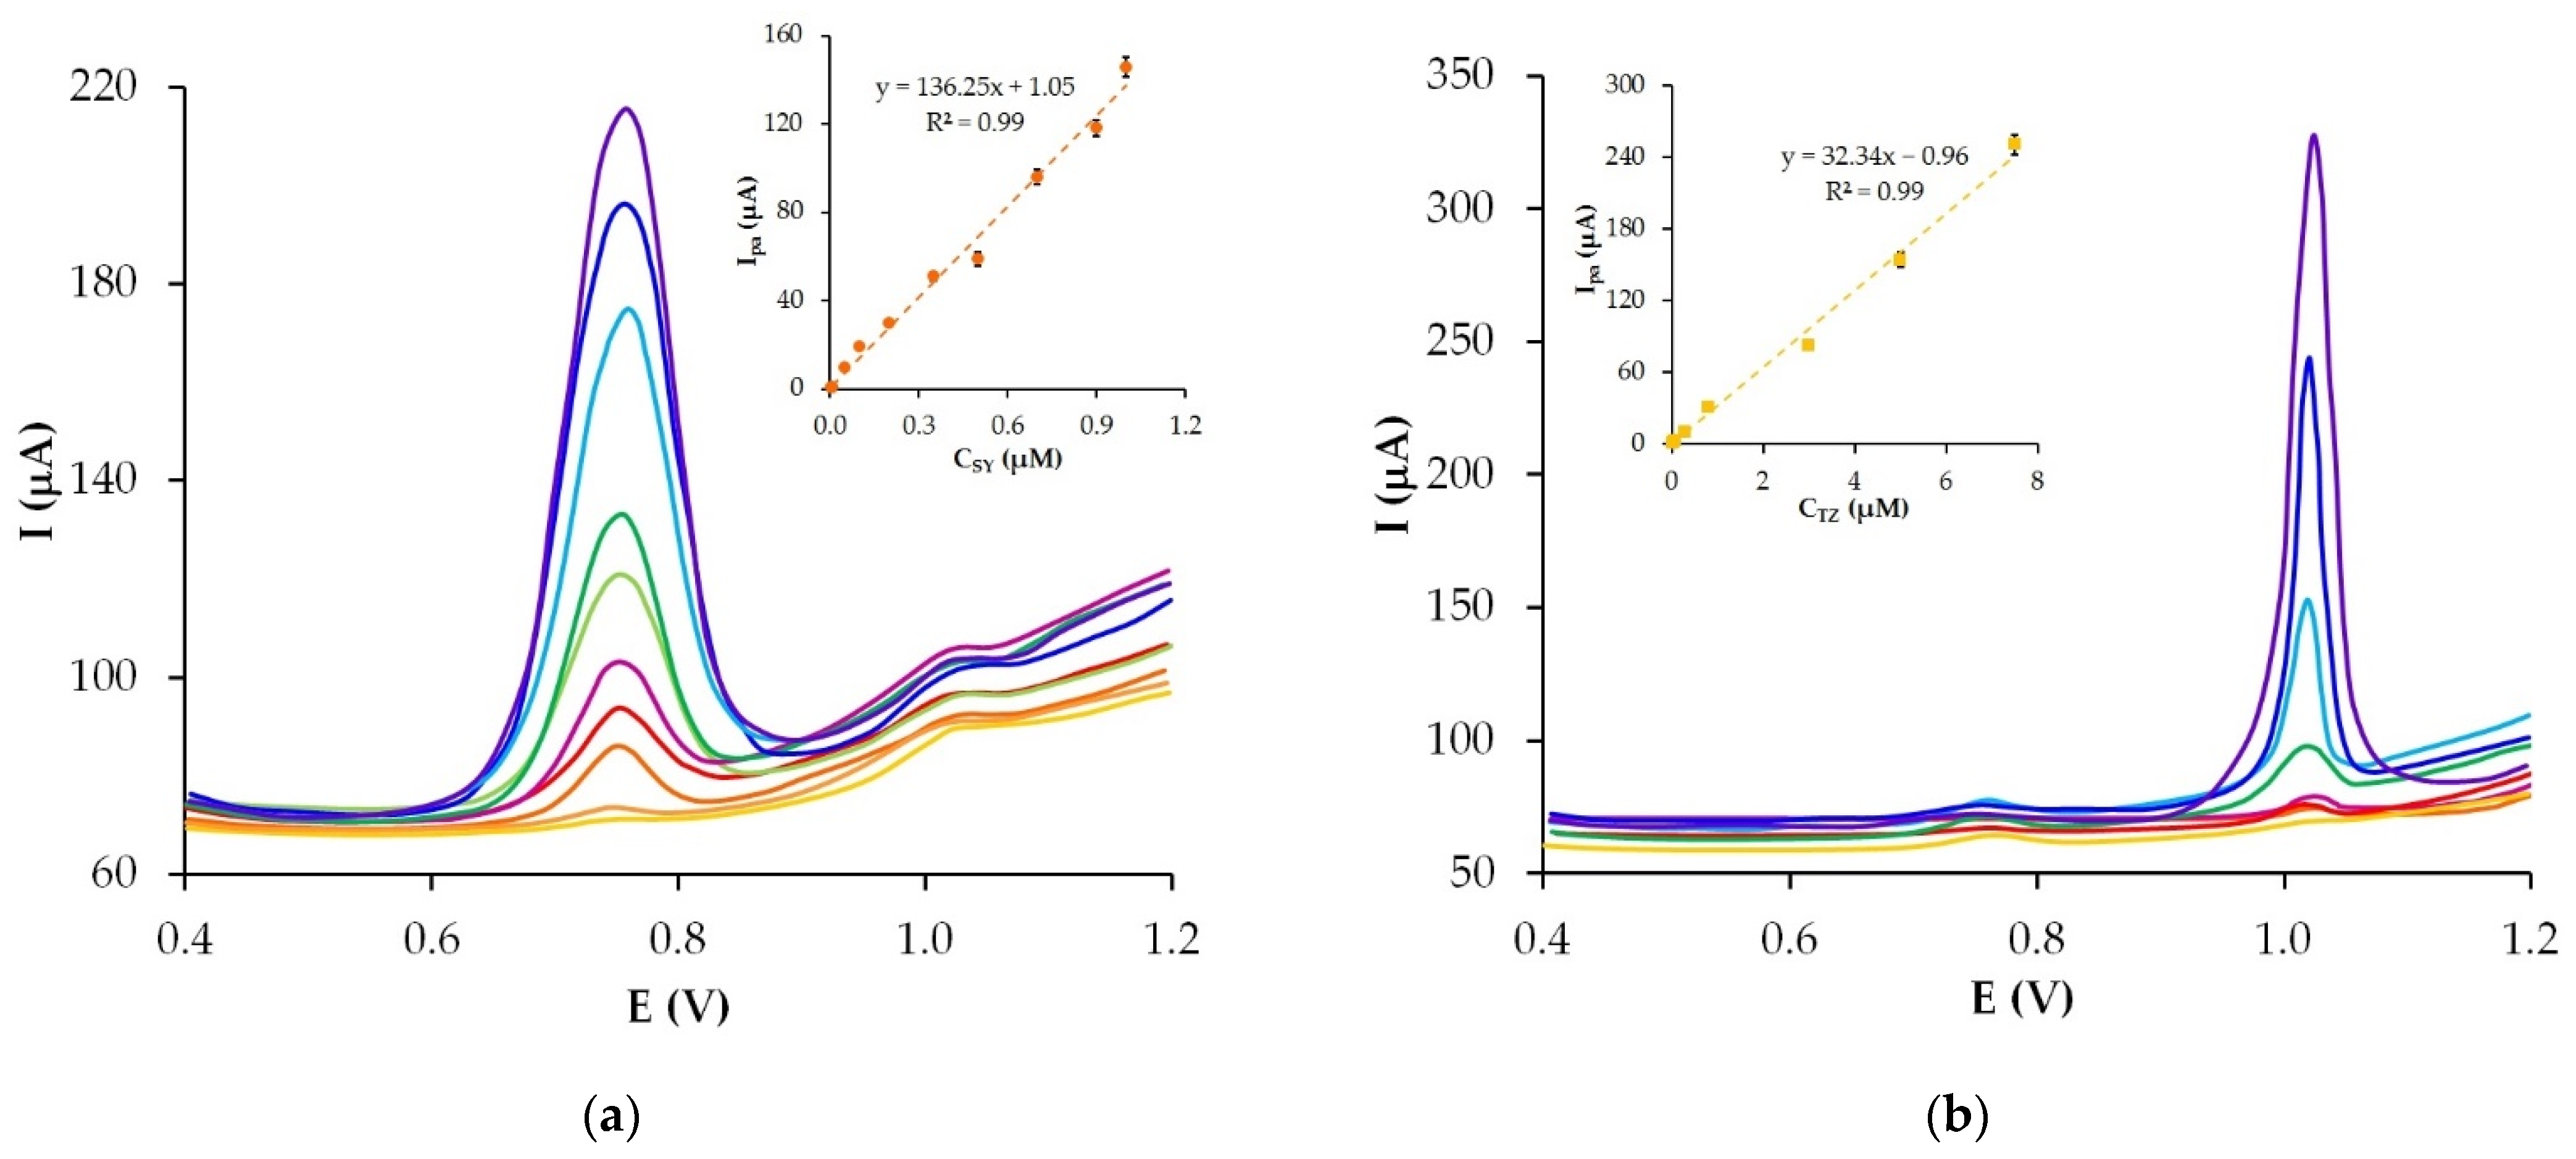
3.7. Analytic Characteristics of the GrP/CP Electrode
- -
- The potential of accumulation: 0–0.2 V for TZ and 0 mV for SY;
- -
- The modulation amplitude: 70–80 mV for TZ and 80 mV for SY;
- -
- The step potential: 12.5–20 mV for TZ and 15 mV for SY;
- -
- The modulation time: 120 ms for TZ and SY.
3.8. Interference
3.9. Determination of SY and TZ in Real Samples
4. Conclusions
Supplementary Materials
Author Contributions
Funding
Institutional Review Board Statement
Informed Consent Statement
Data Availability Statement
Acknowledgments
Conflicts of Interest
References
- Martins, N.; Roriz, C.L.; Morales, P.; Barros, L.; Ferreira, I.C. Food colorants: Challenges, opportunities and current desires of agroindustries to ensure consumer expectations and regulatory practices. Trends Food Sci. Technol. 2016, 52, 1–15. [Google Scholar] [CrossRef] [Green Version]
- Rovina, K.; Acung, L.A.; Siddiquee, S.; Akanda, J.H.; Shaarani, S.M. Extraction and analytical methods for determination of Sunset Yellow (E110)—A review. Food Anal. Methods 2017, 10, 773–787. [Google Scholar] [CrossRef]
- Okafor, S.N.; Obonga, W.; Ezeokonkwo, M.A.; Nurudeen, J.; Orovwigho, U.; Ahiabuike, J. Assessment of the health implications of synthetic and natural food colourants—A critical review. Pharm. Biosci. J. 2016, 4, 1–11. [Google Scholar] [CrossRef]
- Chung, K.T. Azo dyes and human health: A review. J. Environ. Sci. Health Part C 2016, 34, 233–261. [Google Scholar] [CrossRef]
- Amchova, P.; Kotolova, H.; Ruda-Kucerova, J. Health safety issues of synthetic food colorants. Regul. Toxicol. Pharm. 2015, 73, 914–922. [Google Scholar] [CrossRef] [PubMed]
- Masone, D.; Chanforan, C. Study on the interaction of artificial and natural food colorants with human serum albumin: A computational point of view. Comp. Biol. Chem. 2015, 56, 152–158. [Google Scholar] [CrossRef]
- Basu, A.; Kumar, G.S. Binding of carmoisine, a food colorant, with hemoglobin: Spectroscopic and calorimetric studies. Food Res. Int. 2015, 72, 54–61. [Google Scholar] [CrossRef]
- Stevens, L.J.; Kuczek, T.; Burgess, J.R.; A Stochelski, M.; Arnold, L.E.; Galland, L. Mechanisms of behavioral, atopic, and other reactions to artificial food colors in children. Nutr. Rev. 2013, 71, 268–281. [Google Scholar] [CrossRef] [Green Version]
- World Health Organization. Sunset Yellow FCF (addendum). In Safety Evaluation of Certain Food Additives and Contaminants: Prepared by the Seventy-Fourth Meeting of the Joint FAO/WHO Expert Committee on Food Additives (JECFA); WHO Food Additives Series No. 65; World Health Organization: Geneva, Switzerland, 2012; pp. 141–167. [Google Scholar]
- World Health Organization. Tartrazine (addendum). In Safety Evaluation of Certain Food Additives: Prepared by the Eighty-Second Meeting of the Joint FAO/WHO Expert Committee on Food Additives (JECFA); WHO Food Additives Series No. 73; World Health Organization: Geneva, Switzerland, 2017; pp. 219–267. [Google Scholar]
- Heidarizadi, E.; Tabaraki, R. Simultaneous spectrophotometric determination of synthetic dyes in food samples after cloud point extraction using multiple response optimizations. Talanta 2016, 148, 237–246. [Google Scholar] [CrossRef]
- Rovina, K.; Siddiquee, S.; Shaarani, S.M. Toxicology, extraction and analytical methods for determination of Amaranth in food and beverage products. Trends Food Sci. Technol. 2017, 65, 68–79. [Google Scholar] [CrossRef]
- Saleh, M.M.S.; Hashem, E.Y.; Al Salahi, N.O.A. Advanced spectrophotometric analysis of sunset yellow dye E110 in commercial food samples. Food Anal. Methods 2016, 10, 865–875. [Google Scholar] [CrossRef]
- Tsai, C.F.; Kuo, C.H.; Shih, D. Determination of 20 synthetic dyes in chili powders and syrup-preserved fruits by liquid chromatography/tandem mass spectrometry. J. Food Drug Anal. 2015, 23, 453–462. [Google Scholar] [CrossRef] [PubMed] [Green Version]
- Rovina, K.; Siddiquee, S.; Shaarani, S.M. Extraction, analytical and advanced methods for detection of allura red AC (E129) in food and beverages products. Front. Microbiol. 2016, 7, 798. [Google Scholar] [CrossRef] [PubMed] [Green Version]
- Stephen, W.C. Chung Quantification of permitted synthetic colours in food by liquid chromatographic methods: A review on analytical methods and their performance. Food Addit. Contam. Part A 2021, 38, 1636–1655. [Google Scholar] [CrossRef]
- Yamjala, K.; Nainar, M.S.; Ramisetti, N.R. Methods for the analysis of azo dyes employed in food industry—A review. Food Chem. 2016, 192, 813–824. [Google Scholar] [CrossRef] [PubMed]
- Liu, F.-J.; Liu, C.-T.; Li, W.; Tang, A.-N. Dispersive solid-phase microextraction and capillary electrophoresis separation of food colorants in beverages using diamino moiety functionalized silica nanoparticles as both extractant and pseudo stationary phase. Talanta 2015, 132, 366–372. [Google Scholar] [CrossRef]
- Antoniazzi, C.; de Lima, C.A.; Marangoni, R.; de Castro, E.G.; Santana, E.R.; Spinelli, A. Molybdenum trioxide incorporated in a carbon paste as a sensitive device for bisphenol: A monitoring. Microchem. J. 2020, 159, 105528. [Google Scholar] [CrossRef]
- Hudari, F.F.; Brugnera, M.F.; Zanoni, M.V.B. Advances and Trends in Voltammetric Analysis of Dyes. In Applications of the Voltammetry; Stoytcheva, M., Ed.; Intech Open: London, UK, 2017; Chapter 4, pp. 75–108. [Google Scholar] [CrossRef] [Green Version]
- Bessegato, G.G.; Brugnera, M.F.; Zanoni, M.V.B. Electroanalytical sensing of dyes and colorants. Curr. Opin. Electrochem. 2019, 16, 134–142. [Google Scholar] [CrossRef]
- Lipskikh, O.; Korotkova, E.; Khristunova, Y.; Barek, J.; Kratochvil, B. Sensors for voltammetric determination of food azo dyes—A critical review. Electrochim. Acta 2018, 260, 974–985. [Google Scholar] [CrossRef]
- Mahale, R.S.; Shashanka, R.; Vasanth, S.; Vinaykumar, R. Voltammetric determination of various food azo dyes using different modified carbon paste electrodes. Biointerface Res. Appl. Chem. 2022, 12, 4557–4566. [Google Scholar] [CrossRef]
- Ji, L.; Peng, L.; Chen, T.; Li, X.; Zhu, X.; Hu, P. Facile synthesis of Fe-BTC and electrochemical enhancement effect for sunset yellow determination. Talanta Open 2022, 5, 100084. [Google Scholar] [CrossRef]
- Jampasa, S.; Siangproh, W.; Duangmal, K.; Chailapakul, O. Electrochemically reduced graphene oxide-modified screen-printed carbon electrodes for a simple and highly sensitive electrochemical detection of synthetic colorants in beverages. Talanta 2016, 160, 113–124. [Google Scholar] [CrossRef] [PubMed]
- Qiu, X.; Lu, L.; Leng, J.; Yu, Y.; Wang, W.; Jiang, M.; Bai, L. An enhanced electrochemical platform based on graphene oxide and multi-walled carbon nanotubes nanocomposite for sensitive determination of Sunset Yellow and Tartrazine. Food Chem. 2016, 190, 889–895. [Google Scholar] [CrossRef] [PubMed]
- Gan, T.; Sun, J.; Cao, S.; Gao, F.; Zhang, Y.; Yang, Y. One-step electrochemical approach for the preparation of graphene wrapped-phosphotungstic acid hybrid and its application for simultaneous determination of sunset yellow and tartrazine. Electrochim. Acta 2012, 74, 151–157. [Google Scholar] [CrossRef]
- Wu, T.; Wang, Q.; Peng, X.; Guo, Y. Facile Synthesis of Gold/Graphene Nanocomposites for Simultaneous Determination of Sunset Yellow and Tartrazine in Soft Drinks. Electroanalysis 2022, 34, 83–90. [Google Scholar] [CrossRef]
- Deng, K.; Li, C.; Li, X.; Huang, H. Simultaneous detection of sunset yellow and tartrazine using the nanohybrid of gold nanorods decorated graphene oxide. J. Electroanal. Chem. 2016, 780, 296–302. [Google Scholar] [CrossRef]
- Ghoreishi, S.M.; Behpour, M.; Golestaneh, M. Simultaneous determination of Sunset yellow and Tartrazine in soft drinks using gold nanoparticles carbon paste electrode. Food Chem. 2012, 132, 637–641. [Google Scholar] [CrossRef]
- Gan, T.; Sun, J.; Meng, W.; Song, L.; Zhang, Y. Electrochemical sensor based on graphene and mesoporous TiO2 for the simultaneous determination of trace colourants in food. Food Chem. 2013, 141, 3731–3737. [Google Scholar] [CrossRef]
- Moarefdoust, M.M.; Jahani, S.; Moradalizadeh, M.; Motaghi, M.M.; Foroughi, M.M. An electrochemical sensor based on hierarchical nickel oxide nanostructures doped with indium ions for voltammetric simultaneous determination of sunset yellow and tartrazine colorants in soft drink powders. Anal. Methods 2021, 13, 2396–2404. [Google Scholar] [CrossRef]
- Dorraji, P.S.; Jalali, F. Electrochemical fabrication of a novel ZnO/cysteic acid nanocomposite modified electrode and its application to simultaneous determination of sunset yellow and tartrazine. Food Chem. 2017, 227, 73–77. [Google Scholar] [CrossRef]
- Arvand, M.; Parhizi, Y.; Mirfathi, S.H. Simultaneous Voltammetric Determination of Synthetic Colorants in Foods Using a Magnetic Core–Shell Fe3O4@SiO2/MWCNTs Nanocomposite Modified Carbon Paste Electrode. Food Anal. Methods 2016, 9, 863–875. [Google Scholar] [CrossRef]
- Balram, D.; Lian, K.-Y.; Sebastian, N.; Al-Mubaddel, F.S.; Noman, M.T. Ultrasensitive detection of food colorant sunset yellow using nickel nanoparticles promoted lettuce-like spinel Co3O4 anchored GO nanosheets. Food Chem. Toxicol. 2022, 159, 112725. [Google Scholar] [CrossRef] [PubMed]
- Garkani Nejad, F.; Sheikhshoaie, I.; Beitollahi, H. Simultaneous detection of carmoisine and tartrazine in food samples using GO-Fe3O4-PAMAM and ionic liquid based electrochemical sensor. Food Chem. Toxicol. 2022, 162, 112864. [Google Scholar] [CrossRef]
- Wang, J.; Yang, B.; Zhang, K.; Bin, D.; Shiraishi, Y.; Yang, P.; Du, Y. Highly sensitive electrochemical determination of Sunset Yellow based on the ultrafine Au-Pd and reduced graphene oxide nanocomposites. J. Colloid Interface Sci. 2016, 481, 229–235. [Google Scholar] [CrossRef]
- Ma, X.; Chao, M.; Wang, Z. Electrochemical determination of Sudan I in food samples at graphene modified glassy carbon electrode based on the enhancement effect of sodium dodecyl sulphonate. Food Chem. 2013, 138, 739–744. [Google Scholar] [CrossRef] [PubMed]
- Medeiros, R.A.; Lourencao, B.C.; Rocha-Filho, R.C.; Fatibello-Filho, O. Simultaneous voltammetric determination of synthetic colorants in food using a cathodically pretreated boron-doped diamond electrode. Talanta 2012, 97, 291–297. [Google Scholar] [CrossRef]
- Tran, Q.T.; Phung, T.T.; Nguyen, Q.T.; Le, T.G.; Lagrost, C. Highly sensitive and rapid determination of sunset yellow in drinks using a low-cost carbon material-based electrochemical sensor. Anal. Bioanal. Chem. 2019, 411, 7539–7549. [Google Scholar] [CrossRef]
- Yang, H.; Bao, J.; Qi, Y.; Zhao, J.; Hu, Y.; Wu, W.; Wu, X.; Zhong, D.; Huo, D.; Hou, C. A disposable and sensitive non-enzymatic glucose sensor based on 3D graphene/Cu2O modified carbon paper electrode. Anal. Chim. Acta 2020, 1135, 12–19. [Google Scholar] [CrossRef]
- Yan, L.; Ma, P.; Liu, Y.; Ma, X.; Chen, F.; Li, M. 3D coral-like gold/carbon paper electrode modified with covalent and cross-linked enzyme aggregates for electrochemical sensing of glucose. Microchem. J. 2020, 159, 105347. [Google Scholar] [CrossRef]
- Xiang, X.; Pan, F.; Du, Z.; Feng, X.; Gao, C.; Li, Y. MgAl-layered double hydroxide flower arrays grown on carbon paper for efficient electrochemical sensing of nitrite. J. Electroanal. Chem. 2019, 855, 113632. [Google Scholar] [CrossRef]
- Zhou, J.; Yin, H.; Wang, L.; Zhao, H.; Zhang, Z.; Gong, J.; Zheng, Y.; Nie, Q. Electrodeposition of bimetallic NiPt nanosheet arrays on carbon papers for high performance nonenzymatic disposable glucose sensors. J. Mater. Sci. Mater. Electron. 2021, 32, 22493–22505. [Google Scholar] [CrossRef]
- Torrinha, A.; Morais, S. Electrochemical (bio)sensors based on carbon cloth and carbon paper: An overview. Trends Anal. Chem. 2021, 142, 116324. [Google Scholar] [CrossRef]
- Stozhko, N.Y.; Bukharinova, M.A.; Khamzina, E.I.; Tarasov, A.V.; Sokolkov, S.V. Film Carbon Veil-Based Electrode Modified with Triton X-100 for Nitrite Determination. Chemosensors 2020, 8, 78. [Google Scholar] [CrossRef]
- Bukharinova, M.A.; Stozhko, N.Y.; Novakovskaya, E.A.; Khamzina, E.I.; Tarasov, A.V.; Sokolkov, S.V. Developing Activated Carbon Veil Electrode for Sensing Salivary Uric Acid. Biosensors 2021, 11, 287. [Google Scholar] [CrossRef] [PubMed]
- Brainina, K.Z.; Bukharinova, M.A.; Stozhko, N.Y.; Sokolkov, S.V.; Tarasov, A.V.; Vidrevich, M.B. Electrochemical sensor based on a carbon veil modified by phytosynthesized gold nanoparticles for determination of ascorbic acid. Sensors 2020, 20, 1800. [Google Scholar] [CrossRef] [Green Version]
- Jakubowska, M. Signal processing in electrochemistry. Electroanalysis 2011, 23, 553–572. [Google Scholar] [CrossRef]
- Burns, D.T.; Danzer, K.; Townshend, A. Use of the terms “Recovery” and “Apparent recovery” in analytical procedures (IUPAC Recommendations 2002). Pure Appl. Chem. 2002, 74, 2201–2205. [Google Scholar] [CrossRef]
- Postnov, V.N.; Rodinkov, O.; Moskvin, L.N.; Novikov, A.; Bugaichenko, A.S.; Krokhina, O.A. From carbon nanostructures to high-performance sorbents for chromatographic separation and preconcentration. Russ. Chem. Rev. 2016, 85, 115–138. [Google Scholar] [CrossRef]
- Michalkiewicz, S.; Skorupa, A.; Jakubczyk, M. Carbon Materials in Electroanalysis of Preservatives: A Review. Materials 2021, 14, 7630. [Google Scholar] [CrossRef]
- Bard, A.J.; Faulkner, L.R. Electrochemical Methods: Fundamentals and Applications, 2nd ed.; John Wiley & Sons: New York, NY, USA, 2001; p. 831. [Google Scholar]
- Baytak, A.K.; Akbaş, E.; Aslanoglu, M. A novel voltammetric platform based on dysprosium oxide for the sensitive determination of sunset yellow in the presence oftartrazine. Anal. Chim. Acta 2019, 1087, 93–103. [Google Scholar] [CrossRef]
- Saleh, M.; Hashem, E.; Salahi, N. Oxidation and Complexation-Based Spectrophotometric Methods for Sensitive Determination of Tartrazine E102 in Some Commercial Food Samples. Comput. Chem. 2016, 4, 51–64. [Google Scholar] [CrossRef] [Green Version]
- Rovina, K.; Siddiquee, S.; Shaarani, S.M. Highly sensitive electrochemical determination of sunset yellow in commercial food products based on CHIT/GO/MWCNTs/AuNPs/GCE. Food Control 2017, 82, 66–73. [Google Scholar] [CrossRef]
- El-Sheikh, A.H.; Al-Degs, Y.S. Spectrophotometric determination of food dyes in soft drinks by second order multivariate calibration of the absorbance spectra-pH data matrices. Dyes Pigm. 2013, 97, 330–339. [Google Scholar] [CrossRef]
- Bonyadi, S.; Ghanbari, K. Development of highly sensitive and selective sensor based on molecular imprinted polydopamine-coated silica nanoparticles for electrochemical determination of sunset yellow. Microchem. J. 2021, 167, 106322. [Google Scholar] [CrossRef]
- Taei, M.; Salavati, H.; Fouladgar, M.; Abbaszadeha, E. Simultaneous determination of sunset yellow and tartrazine in soft drinks samples using nanocrystallites of spinel ferrite-modified electrode. Iran. Chem. Commun. 2020, 8, 67–79. [Google Scholar] [CrossRef]
- Santana, E.R.; Spinelli, A. Electrode modified with graphene quantum dots supported in chitosan for electrochemical methods and non-linear deconvolution of spectra for spectrometric methods: Approaches for simultaneous determination of triclosan and methylparaben. Microchim. Acta 2020, 187, 250. [Google Scholar] [CrossRef]
- Tang, Y.; Wang, Y.; Liu, G.; Sun, D. Determination of sunset yellow and tartrazine using silver and poly (L-cysteine) composite film modified glassy carbon electrode. Indian J. Chem. A 2016, 55, 298–303. [Google Scholar]
- Wu, J.-H.; Lee, H.-L. Determination of sunset yellow and tartrazine in drinks using screen-printed carbon electrodes modified with reduced graphene oxide and NiBTC frameworks. Microchem. J. 2020, 158, 105133. [Google Scholar] [CrossRef]
- Li, Y.; Li, Y.; Jia, L.; Li, Y.; Wang, Y.; Zhang, P.; Liu, X. A simple sensor based on 1-butylpyridinium hexafluorophosphate@glassy carbon microspheres composites for the quantitative analysis of azo dyes. J. Iran. Chem. Soc. 2022, 19, 1251–1260. [Google Scholar] [CrossRef]


| Carbon Material | Characteristic |
|---|---|
| CP | d = 5–10 µm |
| C > 95% | |
| surface density—30 gm−2 | |
| surface electrical resistivity—8–10 Ω | |
| MWCNTs | d = 110–170 nm |
| l = 5–9 µm | |
| C > 90% | |
| CB | 20–25 nm |
| C > 97% | |
| density 1.7–1.9 gcm−3 | |
| surface area 30–300 m2g−1 | |
| GR | d = 5–10 µm |
| h = 3–10 nm | |
| C ≥ 99% | |
| GrP | d = 1–2 μm |
| C ≥ 96% (Figure S1) |
| Electrode | SY | TZ | pH | Method | tacc, s | Eacc, V | Ref. | ||
|---|---|---|---|---|---|---|---|---|---|
| LR, μM | LOD, nM | LR, μM | LOD, nM | ||||||
| GO/MWCNTs/GCE | 0.09–8 | 25 | 0.09–8 | 10 | 5 | LSV | 70 | - | [26] |
| ERGO-AuNRs/GCE | 0.01–3.0 | 2.4 | 0.03–6.0 | 8.6 | 6 | DPV | 300 | 0.3 | [29] |
| ERGO/SPCE | 0.01–20 | 5 | 0.02–20 | 4.5 | 6 | DPV | 180 | - | [25] |
| Fe3O4@SiO2/MWCNTs/CPE | 0.5–20, 20–100 | 50 | 0.5–14, 14–100 | 40 70 | 6 | SWV | 180 | 0.2 | [34] |
| PLC/Ag/GCE | 0.5–10, 10–300 | 75 | 0.75–75, 75–750 | 250 | 4.5 | DPV | - | - | [61] |
| ZnO/Cysteic acid | 0.1–3.0 | 30 | 0.07–1.86 | 10 | 5 | DPV | 120 | −0.05 | [33] |
| rGO/NiBTC/SPCE | 0.05–5.0 | 25 | 0.075–5.0 | 50 | 8 | DPV | 360 | 0.1 | [62] |
| ZnCrFeO4/CPE | 0.05–19 | 2 | 0.07–47.5 | 10 | 6 | DPV | - | - | [59] |
| AuNPs/PDDA/Gr/GCE | 0.006–5.0 | 2 | 0.008–3.0 | 2.5 | 7 | DPV | 360 | - | [28] |
| GCILE | 0.02–5 | 10 | 0.5–15 | 100 | 7 | DPV | 150 | 0.5 | [63] |
| GrP/CP | 0.005–1.0 | 0.78 | 0.02–7.5 | 8.2 | 5 | DPV | 180 | 0 | This work |
| Interferent | Excess | Response Change, % | |
|---|---|---|---|
| SY | TZ | ||
| Taurine | 200 | −4 | −3 |
| Ascorbic acid | 300 | −5 | −2 |
| Caffeine | 300 | −3 | −6 |
| Glucose | 400 | −2 | 0 |
| Tartaric acid | 400 | −6 | −3 |
| Sodium citrate | 400 | 0 | −7 |
| Ammonium chloride | 800 | −4 | 0 |
| Sodium carbonate | 1000 | 0 | 0 |
| Calcium Chloride | 1000 | 0 | 0 |
| Sample | Analyte | Detected, μM | RSD, % | Added, μM | Found, μM | RSD, % | Recovery, % |
|---|---|---|---|---|---|---|---|
| Alcoholic drink (beer) | SY | 1.13 ± 0.1 | 5.1 | 1 | 2.09 ± 0.07 | 1.4 | 96 |
| Non-alcoholic carbonated drink | TZ | 10.3 ± 1.7 | 3.7 | 10 | 20.4 ± 1.4 | 2.8 | 101 |
| Non-alcoholic energy drink | SY | 11.3 ± 1.6 | 5.7 | 10 | 21.4 ± 2.0 | 3.8 | 101 |
| TZ | 6.1 ± 1.1 | 7.1 | 5 | 11.3 ± 1.2 | 3.2 | 104 | |
| Alcoholic drink (liqueur) | SY | 0.74 ± 0.04 | 2.3 | 0.5 | 1.24 ± 0.06 | 2.0 | 100 |
| TZ | 0.046 ± 0.005 | 4.3 | 0.05 | 0.094 ± 0.008 | 3.9 | 96 | |
| Carbonated drink | SY | 0.35 ± 0.04 | 4.2 | 0.2 | 0.55 ± 0.03 | 2.1 | 100 |
| TZ | 0.103 ± 0.015 | 6.3 | 0.1 | 0.200 ± 0.009 | 5.2 | 97 |
Publisher’s Note: MDPI stays neutral with regard to jurisdictional claims in published maps and institutional affiliations. |
© 2022 by the authors. Licensee MDPI, Basel, Switzerland. This article is an open access article distributed under the terms and conditions of the Creative Commons Attribution (CC BY) license (https://creativecommons.org/licenses/by/4.0/).
Share and Cite
Stozhko, N.Y.; Khamzina, E.I.; Bukharinova, M.A.; Tarasov, A.V. An Electrochemical Sensor Based on Carbon Paper Modified with Graphite Powder for Sensitive Determination of Sunset Yellow and Tartrazine in Drinks. Sensors 2022, 22, 4092. https://doi.org/10.3390/s22114092
Stozhko NY, Khamzina EI, Bukharinova MA, Tarasov AV. An Electrochemical Sensor Based on Carbon Paper Modified with Graphite Powder for Sensitive Determination of Sunset Yellow and Tartrazine in Drinks. Sensors. 2022; 22(11):4092. https://doi.org/10.3390/s22114092
Chicago/Turabian StyleStozhko, Natalia Yu., Ekaterina I. Khamzina, Maria A. Bukharinova, and Aleksey V. Tarasov. 2022. "An Electrochemical Sensor Based on Carbon Paper Modified with Graphite Powder for Sensitive Determination of Sunset Yellow and Tartrazine in Drinks" Sensors 22, no. 11: 4092. https://doi.org/10.3390/s22114092
APA StyleStozhko, N. Y., Khamzina, E. I., Bukharinova, M. A., & Tarasov, A. V. (2022). An Electrochemical Sensor Based on Carbon Paper Modified with Graphite Powder for Sensitive Determination of Sunset Yellow and Tartrazine in Drinks. Sensors, 22(11), 4092. https://doi.org/10.3390/s22114092