
Pulse Oximeter Performance during Rapid Desaturation


Department of Biomedical Technology, Faculty of Biomedical Engineering, Czech Technical University in Prague, 272 01 Kladno, Czech Republic
*
Author to whom correspondence should be addressed.
Sensors 2022, 22(11), 4236; https://doi.org/10.3390/s22114236
Submission received: 7 May 2022
/
Revised: 26 May 2022
/
Accepted: 30 May 2022
/
Published: 2 June 2022
(This article belongs to the Section Biomedical Sensors)
Abstract
:The reliability of pulse oximetry is crucial, especially in cases of rapid changes in body oxygenation. In order to evaluate the performance of pulse oximeters during rapidly developing short periods of concurrent hypoxemia and hypercapnia, 13 healthy volunteers underwent 3 breathing phases during outdoor experiments (39 phases in total), monitored simultaneously by five different pulse oximeters. A significant incongruity in values displayed by the tested pulse oximeters was observed, even when the accuracy declared by the manufacturers were considered. In 28.2% of breathing phases, the five used devices did not show any congruent values. The longest uninterrupted congruent period formed 74.4% of total recorded time. Moreover, the congruent periods were rarely observed during the critical desaturation phase of the experiment. The time difference between the moments when the first and the last pulse oximeter showed the typical study endpoint values of SpO2 85% and 75% was 32.1 ± 23.6 s and 24.7 ± 19.3 s, respectively. These results suggest that SpO2 might not be a reliable parameter as a study endpoint, or more importantly as a safety limit in outdoor experiments. In the design of future studies, more parameters and continuous clinical assessment should be included.
1. Introduction
Pulse oximetry is a standard monitoring method assessing oxygenation during anesthesia, critical care, and also in out-of-hospital settings. The peripheral saturation of hemoglobin in blood with oxygen (SpO2) can be assessed using an ear, finger, forehead, or nostril probe. The most commonly applied one is the finger probe where any finger can be used without significant differences in readings [1]. Although this method is challenged by numerous limitations [1], it is successfully used even in outdoor environment for assessment of acclimatization process at high altitude or development of acute mountain sickness [2].
Non-invasive monitoring of blood oxygen saturation is especially important in situations where rapid changes in oxygenation may occur. In clinical practice, this is crucial, for example, in airway management in anesthesia and critical care [3,4,5,6]. Nevertheless, in some sports disciplines, we can also encounter situations accompanied by rapid desaturation, such as during static apnea practiced by breath-hold divers [7].
Another situation when close monitoring of oxygenation is essential is during physiological experiments, for instance, in simulated avalanche snow breathing trials where the subjects usually experience rapidly developing short periods of hypoxia and hypercapnia. Moreover, the levels of oxygen (O2) and carbon dioxide (CO2) in the organism often serve as study endpoints. The limits are set at different values; for pulse oximetry from SpO2 75% [8,9,10] to 85% [11,12], or even 88% [13] and for end-tidal carbon dioxide (EtCO2) at 8% [10,14], or 60 mmHg [15].
However, the evaluation of these parameters—SpO2 and EtCO2—in simulated avalanche experiments is burdensome [16,17,18]. The reliability of the end-tidal CO2 monitoring during simulated avalanche experiments, in which high level of gas rebreathing occurs, has already been assessed by Roubik and Filip [16]. They conducted a laboratory experiment using a snow model with a standard gas analyzer in Datex-Ohmeda S/5 (Datex-Ohmeda, Madison, WI, USA) anesthetic monitor and discovered that in as much as 71% of the time for which the volunteers were breathing into this model, the software of the monitor was displaying incorrect values of EtCO2, compared with the capnographic curve. Similar behavior was observed with the CareScape B650 (GE Healthcare, Helsinki, Finland) monitor.
An apparent discrepancy among different pulse oximeters has been described in a field avalanche experiment [17]. The specificity of these experiments is that the changes in oxygen saturation occur within a couple of seconds, and the dynamic response capability of the device very likely interferes with the embedded software.
To date, an evaluation of the accuracy of pulse oximetry in simulated avalanche breathing trials, similar to the experiment with capnometry [16], has not been performed. Several studies addressed the correlation of SpO2 with arterial blood oxygen saturation (SaO2), the probe location, and the method-limiting factors (e.g., hypoxia, poor perfusion, dyshemoglobinemia, hypothermia, skin pigmentation, and hyperbilirubinemia) [1]. Trivedi and his colleagues [19] tested the performance of pulse oximeters during rapid desaturation and resaturation induced by breathing of a gas mixture containing only 10% of oxygen. None of the tested oximeters displayed constantly accurate values throughout the profound hypoxia. However, no study investigated the SpO2 monitoring response to hypoxia associated with increased work of breathing—a frequent combination of pathological factors seen in volunteers undergoing outdoor studies assessing the gas exchange in avalanche snow.
The aim of this study is to document the behavior of five different pulse oximeters during short-term rapidly developing changes in oxygenation occurring in breathing experiments in simulated avalanche snow.
2. Materials and Methods
The data were recorded as a part of a prospective randomized double-blind crossover field study assessing breathing into simulated avalanche snow and into a snow model—perlite [20]. The study was approved by the Institutional Ethical and Review Board of the Faculty of Biomedical Engineering, Czech Technical University (No. A001/018, issued on 22 January 2018) and registered in ClinicalTrials.gov (NCT03413878, last updated: 25 February 2021). All subjects were asked for their written consent for inclusion before they participated in the study.
All recruited volunteers underwent an entrance examination performed by an experienced physician, including assessment of the past medical history, smoking history, physical examination, and spirometry. The exclusion criteria were a Tiffeneau index (FEV1/FVC ratio) less than 0.70, any acute respiratory infection, and a history of a moderate or severe cardiovascular or respiratory disease.
The subjects were continuously monitored throughout the whole experiment. Datex-Ohmeda S/5 (Datex-Ohmeda, Madison, WI, USA) anesthesia monitor [21] served as a primary monitor of physiological and ventilatory parameters, including peripheral saturation of blood with oxygen (SpO2). Another vital sign monitor, CareScape B650 (GE Healthcare, Helsinki, Finland) [22], provided additional monitoring of SpO2. Besides those two anesthetic monitors, there were three other monitoring devices in use: Edan M3B (Edan Instruments, Nanshan, Shenzhen, China) [23], Masimo Radical-7 Pulse CO-Oximeter (Masimo, Irvine, CA, USA) [24] and a hand-held pulse oximeter Nonin PalmSAT 2500 (Nonin Medical Inc., Plymouth, MN, USA) [25]. All devices are certified for medical use, have valid periodic safety and technical checks (including validation on a pulse oximeter tester), and are a property of the Faculty of Biomedical Engineering, Czech Technical University in Prague.
Each subject had SpO2 levels monitored simultaneously by five different finger oxygen saturation probes, placed on right-hand fingers in a standardized manner, presented in Table 1. The position of the finger probe was not randomized. To eliminate possible erroneous readings due to low perfusion or motion artifacts, the volunteer’s hand with all probes was placed into a preheated insulated glove and the participants were instructed to minimize hand and finger movements during the experiments.
The data from all pulse oximeters and monitors were logged and the screens of the monitors were simultaneously filmed to document the SpO2 values displayed by all oximeters at the same moment. The response times of the individual oximeters were set to minimal possible averaging (in Table 1); this parameter is used in clinical practice to minimize false alarms, but during rapid changes in SpO2, minimal setting prevents erroneous readings.
Each volunteer underwent three breathing experiments in a random order: ‘S’—breathing into the snow, ‘PD’—breathing into the dry perlite, and ‘PW’—breathing into the wet perlite. Perlite served as a snow model. During each experiment, the study subject was in a prone position, lying on an insulated mat, connected to all sensors of above-mentioned vital sign monitors. At the initiation of the stabilization phase, the subject was connected to the mouthpiece with a nose clip, breathing the ambient air; ventilation parameters with the gas analysis results were recorded. After five minutes, the customized tubing was attached to a cone-shaped container [26] filled with the tested material (snow or perlite) and the main part—the breathing phase—was initiated. Throughout the whole experiment, a clinical assessment of consciousness level of the volunteer was performed by a supervising physician: the physician asked the subject to calculate simple mathematical operations and show the result using their fingers which were not attached to the pulse oximeter probes.
The breathing into the test material was terminated by a subject’s request, by the supervising physician’s command, when the study safety limit was reached (EtCO2 62.5 mmHg), or when a gas leak from the tubing was detected using a tracing gas (nitrous oxide). The participant was then disconnected from the test material and allowed to breathe ambient air through the mouthpiece with the respiratory sensor still attached (recovery phase). When all parameters stabilized and returned close to the baseline values, the subject was detached from the mouthpiece and the experiment was ceased. The timeline of the experiment is showed in Figure 1.
The data from pulse oximetry measurements were obtained from simultaneous video recordings of the screens of all the pulse oximeters, in 10-s intervals. All data were processed in MATLAB R2019a (MathWorks, Natick, MA, USA). The values are expressed as mean ± standard deviation, with minimum and maximum values indicated.
Data from all breathing experiments (S, PD, PW) were analyzed together, as according to the already performed analyses [20,26], there are only minor differences in peripheral saturation trends and values among the experiments when subjects breathe into snow and its surrogate materials simulating avalanche snow.
For the analysis, firstly, graphs for all five pulse oximeters measurements in all breathing experiments of all subjects were constructed. Secondly, the graphs were complemented with the interval of accuracy stated by the manufacturers (as summarized in Table 1) [27,28]. Then, the areas of congruent intervals were assessed using an algorithm programmed in MATLAB.
The algorithm for evaluation of the congruency of the SpO2 signals assessed only those time periods when signals of all five pulse oximeters were present and the accuracy interval was programmed according to manufacturer’s technical specification (in Table 1). In case the measured SpO2 value was out of the interval for which the manufacturer stated the accuracy, the algorithm used the accuracy stated for the previous interval of peripheral oxygen saturation values.
Finally, all five pulse oximeters were assessed together. Every 60 s, starting at the point when the subject was connected to the breathing circuit (time 0 s), the average value from all SpO2 measurements from all five pulse oximeters in all subjects was calculated and formed the baseline value. Afterwards, the average for each pulse oximeter for all subjects in all experiments was calculated every 60 s and depicted in the graph with error bars representing standard deviation.
3. Results
The clinical trial was conducted between 29 January and 1 February 2018 in Spindleruv Mlyn, Krkonose Mountains, Czech Republic (altitude 762 m above sea level). Written informed consent was obtained from all volunteers before entering the study. All volunteers were members of the Czech Army forces and students at the Military Department of the Faculty of Physical Education and Sport, Charles University in Prague. Thirteen recruited volunteers were fit and well; their characteristics are presented in Table 2.
All 13 volunteers were included in the data analysis; in total, 39 breathing experiments were analyzed. The predominant reason for termination of the breathing phase was due to subject’s request (n = 24). In five cases, the breathing phase was terminated due to an accidental disconnection of the breathing circuit, due to a detection of the tracing gas—nitrous oxide in the breathing gas—and in the same number of cases the experiment was ceased upon the physician’s decision. No harm occurred to any of the subjects of the experiment. The total length of recorded data in one breathing phase was 419.5 ± 92.4 (230–620) s. A photo from the experiment is in Figure 2.
The oxygen saturation readings displayed by the five different pulse oximeter devices used in this experiment were significantly variable. They varied at the time of onset of desaturation, in the lowest SpO2 value, and in the duration of the recovery phase, i.e., the period after the subject was disconnected from the test material, breathing ambient air and the oxygen saturation values were returning to baseline. The heart rate and respiratory rate analysis during all phases is available in the Supplementary material.
An example of changes in SpO2 over time in one subject during breathing into simulated avalanche snow is presented in Figure 3. The time difference between the moment when the first (Nonin PalmSAT 2500) and the last pulse oximeter (CareScape B650) showed the SpO2 value of 85% was 90 s. A similar situation occurred at SpO2 75%, where the difference was 50 s. The lowest recorded values varied from 69% (CareScape B650) to 43% (Edan M3B), and the screen of Edan M3B was displaying the lowest value constantly for 70 s.
In the whole dataset of all breathing experiments, the time difference between the moment when the first and the last pulse oximeter showed the theoretical study endpoint value of SpO2 85% or 75% was 32.1 ± 23.6 s and 24.7 ± 19.3 s, respectively. Moreover, the pulse oximeter embedded in Edan M3B vital sign monitor had a tendency to show the lowest detected SpO2 value for a prolonged period of time, despite the fact that other four devices were already displaying normal SpO2 values (as showed in Figure 3). This behavior was observed in 16 out of 39 breathing experiments (in 41% of cases).
When the declared accuracy of the individual pulse oximeter devices was considered (values for each device are in Table 1), in none of the experimental phases did the pulse oximeters show identical values throughout the entirety of the recorded time. Eleven experiments (28.2%) showed no time period when signals from all five pulse oximeters were congruent. Only in one case the devices were in agreement in 86.67% of recorded time. However, on average the congruent periods formed 30.51 ± 26.35 (5.45–86.67) per cent of the recorded time. The total duration of the congruent signals was 115.64 ± 94.00 (30–290) s, with the length of individual segments lasting from 10 s to 260 s. Most often, the signal had two or three separated congruent segments (n = 8), seven signals had only one of these segments. The maximum number of observed congruent segments was four in four cases.
Three examples of evaluation of the congruent segments using an automated algorithm are showed in Figure 4. In Figure 4a the signals are incongruent most of the time, however, there are three short congruent segments (depicted as bright green lines)—two segments at the beginning of the breathing phase and one at the end of the resaturation. The graph in Figure 4b shows the longest uninterrupted congruent segment lasting 260 s with additional 30 s segment at the end of the recovery phase, which forms nearly three quarters of the total recorded time (74.4%). The graph in Figure 4c shows another breathing phase, where the signals seem to be congruent, however, following the analysis, only two congruent segments, lasting in total only 50% of time, were identified. Moreover, these congruent segments were present outside periods of rapid changes in SpO2.
In Figure 5, all breathing phases were analyzed together and the global difference among the individual pulse oximetry devices is presented. For every 60 s, the difference between the average value displayed by the particular device in all breathing phases and the average value across all the devices is shown. From this graph, it is apparent that with the time course of desaturation, the variance among the devices increases.
4. Discussion
The main finding of the study is that oxygen saturation readings displayed by the five pulse oximeter devices during short periods of rapid onset hypoxemia and hypercapnia were significantly different. They varied in the time of desaturation onset, in the lowest measured SpO2 value, and in the duration of the recovery phase, when the subject was already breathing ambient air and the oxygen saturation was returning to pre-experimental values.
The results suggest that if SpO2 is chosen as a study endpoint for an outdoor breathing trial, the selection of a particular device can prolong or shorten the trial by tens of seconds (Figure 3). If we consider that most of the volunteers in this study managed to complete 240 s to 300 s of breathing into the material simulating avalanche snow, the change in the testing period by, e.g., 50 s is a significant intrusion into the course of the whole clinical trial.
Not only the rate of the SpO2 changes, but also the minimal values reached following the disconnection from the test material can pose a significant drawback. Manufacturers usually guarantee the accuracy ± 2% in the interval of SpO2 70% to 100% (Masimo Radical-7, Edan M3B, Nonin PalmSAT 2500 [23,24,25]), anesthetic monitors Datex-Ohmeda S/5 and CareScape B650 have declared the accuracy ± 3% in the range between 50% and 80% [21,22] (Table 1). However, even when the declared accuracy of the devices was considered (Figure 4), the values from the pulse oximeters were often not comparable. In fact, in 28.2% of the breathing experiments (n = 11) there was no congruent signal identified and in the rest of the experiments, the congruent intervals covered on average only less than a third of the total recorded time (30.51 ± 26.35%). The intervals of congruent signals were observed mainly at the beginning of the breathing phase and at the end during the resaturation. However, in the course of the desaturation, which is the potentially risky experimental phase, the congruity among the devices was infrequent.
The resaturation phase also exhibited considerable differences among the pulse oximeters. Moreover, one device (Edan M3B) had a tendency to show the lowest measured value for a prolonged period of time, whereas the SpO2 level was within the normal range according to the other devices (as in Figure 3). This behavior can be potentially dangerous because the displayed low value could spur the physician to undertake unnecessary measures. However, the manufacturers guarantee a certain accuracy only to 50% [21,22], or even 70% [23,24,25], and the accuracy of the lower values is questionable.
As a part of the settings of each device, it is possible to select data averaging and display refreshment time, usually referred to as ‘response’. This equates to the speed at which the displayed value appears following the measurement of the parameter. For SpO2, the monitor can display the values beat-to-beat, or it can present an average of results from the set time period, e.g., 20 s. The latter is a default setting for Datex-Ohmeda S/5 monitors, because in anesthesia it helps to eliminate distracting artifacts and false alarms. However, in breathing experiments, we may observe changes in volunteers’ physiological parameters within a couple of seconds and this averaging can give us incorrect information about the subject’s state and inaccurate experimental data. In addition, this can present safety risks to the volunteers [18]. In this study, the ‘response’ was set to the minimal option available, so it was different for each device (listed also in Table 1): for Datex-Ohmeda S/5 it was set to beat-to-beat, for CareScape B650 to minimum 3 s. In Masimo Radical-7, the values are recorded every 2 s and the response time can be set to minimum 2 to 4 s. The other two devices, Edan M3B and Nonin PalmSAT 2500, do not offer the option of adjustable response time. The difference of the response times among the devices may have affected the simultaneously displayed SpO2 values [28].
The effect of the SpO2 averaging time on detection of desaturation events and their duration has already been investigated [29,30]. In the study by McClure and colleagues [30], the change in averaging time from 2 s to 16 s caused significant smoothing of the SpO2 curves during desaturation periods. The evidence suggests that in experiments with expected rapid changes of SpO2, devices with minimal response time are preferable to reduce inaccuracy in data acquisition.
Although pulse oximetry is a widely used mean of monitoring, with upgraded algorithms [31], it has well-known limitations [32] and its use outside hospital environment is challenging [2]. The peripheral low perfusion state, typically associated with cold conditions, can alter the pulse oximetry readings. However, during all breathing experiments a maximum effort was made to prevent this effect: the subjects had their hand placed in a warmed glove and the perfusion of the fingers was monitored with use of perfusion index [24]. As there was no significant decrease in the perfusion index observed throughout the breathing experiments [33], the authors speculate that the low perfusion state was not a crucial limiting factor for performance of the pulse oximeters and hence an important source of the incongruity in the displayed SpO2 values.
Additionally, for a standard in-hospital use, the software is programmed in order to minimize false alarms. This means that rapid brief changes in oxygen saturation are suppressed, as in the hospital settings they are usually caused by motion artifacts, bad connections or poor contact [34,35]. However, these rapid changes in SpO2 are typical for outdoor breathing experiments in the simulated avalanche snow [8,9,10,11,12,13,14,15] as well as in breath-hold divers [7].
There have been conducted several studies comparing different types of pulse oximeters manufactured by various companies [19,36,37,38,39]. The performance of different pulse oximeters in intensive care setting [36] and in an experiment during severe hypoxemia [19] was compared with arterial blood saturation (SaO2) as a gold standard. The mean error in SaO2 measured by pulse oximeters is 3–4% for adults. During hypoxemia with SaO2 levels below 80% or 90%, the mean error is even more pronounced [40]. It has been hypothesized by Van de Louw et al. [39] that the software algorithm adopted by the particular manufacturer may affect the accuracy of the SpO2 readings. In addition, for cases of profound hypoxemia, it is challenging to obtain reliable human calibration data [41].
There is contradicting evidence in terms of underreporting or overreporting of SpO2 by different devices. The tendency of underestimation was found in the interval of SpO2 82–93% [36], or even below 75% [19] which was expected by Trivedi and colleagues [19] to be a safety measure, intentionally adopted by the manufacturers. Other studies have revealed an opposite tendency of displaying higher values, for instance due to specifics of the calibration curve used by the software [42]. The difference between SpO2 and SaO2 in pediatric data reached the greatest bias in the range of SpO2 81–85% (mean 6.6%) [43], exceeding the guaranteed accuracy of the two types of examined devices, in neonates the median size of the bias climbed to 5% in SpO2 75–93% [44]. However, to date, there has not been a study examining the bias in adult subjects during outdoor breathing experiments, so the tendency of the pulse oximeters in this scenario is unknown. Moreover, Figure 5 suggests there is no systematic shift in SpO2 readings in any of the devices, although this analysis may be affected by the performance of one of the pulse oximeters.
During outdoor breathing experiments, the volunteers are standardly monitored by vital sign monitors and additionally they are continuously assessed by an experienced physician. The physician and supervising investigator make decisions regarding the conduction of the experiment based on the physiological parameters presented to them on the screens of vital sign monitors. For this reason, in this study, all analyzed data were obtained from simultaneous video recordings of the pulse oximeters’ screens; purely values that are accessible to the user of the monitor. Raw data recorded directly from the monitors were not used during this analysis.
Although we acquired data for this study during breathing trial with simulated avalanche snow and snow model, our findings are relevant to other clinical situations, where rapid changes in oxygen saturation may occur, e.g., in difficult airway management in anesthesia. In these cases, the physicians also rely on only one physiological parameter, standardly displayed by a single device. Delay in displaying low SpO2 values may result in a belated appropriate physician’s reaction. On the other hand, repetitive presentation of low values long time after the acute situation ceased—as was exhibited by Edan M3B monitor in 41% of the recorded experiments—can lead to unfitting decisions and improper procedures.
This study examined a specific situation of short rapidly developing periods of desaturation associated with hypercapnia in outdoor environment. The intention was not to analyze the particular pulse oximetry devices and find the most suitable one, but rather to document their behavior during short-term rapid desaturation and resaturation. Additionally, as a standard, the accuracy of pulse oximeters is formally tested during desaturation experiments where subjects experience gradual plateaus of hypoxemia with maximum duration of 10 min [28]—a protocol different from this study. In studies with stepwise protocol, despite periods of desaturation up to SpO2 of 50% lasting several minutes, the cerebral oxygenation is not critically altered [28,45]. In a recent study by Strapazzon et al. [10], it was shown that whilst breathing into artificial air pockets in avalanche snow, the peripheral pulse oximetry does not correspond to regional cerebral oximetry, measured by near infrared spectrometry. The authors of [43] hypothesize that the cerebral oxygenation may not be impaired despite significantly reduced oxygen supply.
The limitations of our study include mainly the lack of randomization of finger probe placement, or alternatively a simultaneous placement of the same saturation probes on different locations. The pulse oximetry probes were placed on fingers in a standardized manner, the possible differences among fingers could have affected the displayed values, although the variability between fingers is small [1]. An important limitation of this study is also the lack of a gold standard reference for pulse oximeters as SaO2 repetitively measured in arterial blood samples during a steady state of hypoxemia [28]. However, the nature of this experiment prevents this type of assessment.
Additionally, a restricted number of tested devices and the use of only peripherally placed pulse oximetry probes, which are known to have delayed detection of desaturation compared to centrally placed probes (earlobe, forehead), limited the study. The difference in the response time between the ear probe and the finger probe can be up to 20 s [19]. Another limitation was the different response time of each of the devices, although it was set to the minimal available value. Finally, the number of study subjects was only thirteen, which could be considered a small trial. Although some studies of pulse oximetry accuracy under hypoxic conditions had ten or fewer subjects [19,46,47]. Furthermore, only male subjects were included, even though there is a known difference in SpO2 values between men and women [48].
Further studies comparing devices currently in use in the clinical practice in hospitals and during outdoor experiments are needed. With the fast development of these monitoring means, testing of the devices in in-hospital and out-of-hospital settings can change the perceived reliability in non-standard situations. Additionally, this study documents that monitoring during short-term changes of peripheral saturation with oxygen has several limitations and clinical assessment by a skillful physician is irreplaceable. Moreover, relying on a single parameter as a study endpoint or a safety limit could not be recommended.
5. Conclusions
This study documents that even though standard monitoring equipment is used during outdoor breathing trials, it has notable limitations. The results suggest that SpO2 might not be a reliable parameter as a study endpoint, or more importantly as a safety limit in outdoor experiments. The irreplaceable role of clinical assessment by a skillful physician should be considered. In the design of future studies, more parameters and continuous clinical assessment should be included.
Supplementary Materials
The following supporting information can be downloaded at: https://www.mdpi.com/article/10.3390/s22114236/s1, Figure S1: The mean heart rate in all subjects during all breathing experiments, error bars show standard deviation. Figure S2: The mean respiratory rate in all subjects during all breathing experiments, error bars show standard deviation. Figure S3: The mean peripheral saturation of blood with oxygen (SpO2) measured by five different pulse oximeters in all subjects during all breathing experiments, error bars show standard deviation.
Author Contributions
Conceptualization, L.H. and K.R.; Data curation, L.H. and K.R.; Formal analysis, L.H. and K.R.; Funding acquisition, K.R.; Investigation, L.H. and K.R.; Methodology, L.H. and K.R.; Validation, L.H. and K.R.; Visualization, L.H. and K.R.; Writing—original draft, L.H. and K.R.; Writing—review and editing, L.H. and K.R. All authors have read and agreed to the published version of the manuscript.
Funding
This research was funded by Czech Technical University in Prague, grant number SGS20/202/OHK4/3T/17.
Institutional Review Board Statement
The study was conducted according to the guidelines of the Declaration of Helsinki and approved by the Institutional Ethical and Review Board of the Faculty of Biomedical Engineering, Czech Technical University in Prague, (No. A001/018, issued on 22 January 2018).
Informed Consent Statement
Informed consent was obtained from all subjects involved in the study.
Data Availability Statement
The datasets generated and analyzed during the current study are available in the repository at https://ventilation.fbmi.cvut.cz/data/ (accessed on 31 May 2022).
Acknowledgments
The authors would like to thank Karel Sykora, Military Department, Faculty of Physical Education and Sport, Charles University in Prague, Ladislav Sieger, Department of Physics, Faculty of Electrical Engineering, Czech Technical University in Prague, Vaclav Ort, Department of Biomedical Technology, Faculty of Biomedical Engineering, Czech Technical University in Prague, and Simon Walzel, Department of Biomedical Technology, Faculty of Biomedical Engineering, Czech Technical University in Prague for help in data acquisition for this study. Additionally, the authors would like to thank Thomas Edward Bachman, California USA, for valuable comments to the manuscript.
Conflicts of Interest
The authors declare no conflict of interest.
References
- Jensen, L.A.; Onyskiw, J.E.; Prasad, N. Meta-analysis of arterial oxygen saturation monitoring by pulse oximetry in adults. Heart Lung 1998, 27, 387–408. [Google Scholar] [CrossRef]
- Dünnwald, T.; Kienast, R.; Niederseer, D.; Burtscher, M. The Use of Pulse Oximetry in the Assessment of Acclimatization to High Altitude. Sensors 2021, 21, 1263. [Google Scholar] [CrossRef] [PubMed]
- Griesdale, D.E.; Bosma, T.L.; Kurth, T.; Isac, G.; Chittock, D.R. Complications of endotracheal intubation in the critically ill. Intensive Care Med. 2008, 34, 1835–1842. [Google Scholar] [CrossRef] [PubMed]
- Ehrenfeld, J.M.; Funk, L.M.; Van Schalkwyk, J.; Merry, A.F.; Sandberg, W.S.; Gawande, A. The incidence of hypoxemia during surgery: Evidence from two institutions. Can. J. Anesth. 2010, 57, 888–897. [Google Scholar] [CrossRef] [Green Version]
- De Jong, A.; Rolle, A.; Molinari, N.; Paugam-Burtz, C.; Constantin, J.-M.; Lefrant, J.-Y.; Asehnoune, K.; Jung, B.; Futier, E.; Chanques, G. Cardiac arrest and mortality related to intubation procedure in critically ill adult patients: A multicenter cohort study. Crit. Care Med. 2018, 46, 532–539. [Google Scholar] [CrossRef]
- Baillard, C.; Boubaya, M.; Statescu, E.; Collet, M.; Solis, A.; Guezennec, J.; Levy, V.; Langeron, O. Incidence and risk factors of hypoxaemia after preoxygenation at induction of anaesthesia. Br. J. Anaesth. 2019, 122, 388–394. [Google Scholar] [CrossRef] [Green Version]
- Hansel, J.; Solleder, I.; Gfroerer, W.; Muth, C.M.; Paulat, K.; Simon, P.; Heitkamp, H.-C.; Niess, A.; Tetzlaff, K. Hypoxia and cardiac arrhythmias in breath-hold divers during voluntary immersed breath-holds. Eur. J. Appl. Physiol. 2009, 105, 673–678. [Google Scholar] [CrossRef]
- Brugger, H.; Sumann, G.; Meister, R.; Adler-Kastner, L.; Mair, P.; Gunga, H.; Schobersberger, W.; Falk, M. Hypoxia and hypercapnia during respiration into an artificial air pocket in snow: Implications for avalanche survival. Resuscitation 2003, 58, 81–88. [Google Scholar] [CrossRef]
- Strapazzon, G.; Paal, P.; Schweizer, J.; Falk, M.; Reuter, B.; Schenk, K.; Gatterer, H.; Grasegger, K.; Dal Cappello, T.; Malacrida, S. Effects of snow properties on humans breathing into an artificial air pocket–an experimental field study. Sci. Rep. 2017, 7, 17675. [Google Scholar] [CrossRef] [Green Version]
- Strapazzon, G.; Gatterer, H.; Falla, M.; Dal Cappello, T.; Malacrida, S.; Turner, R.; Schenk, K.; Paal, P.; Falk, M.; Schweizer, J.; et al. Hypoxia and hypercapnia effects on cerebral oxygen saturation in avalanche burial: A pilot human experimental study. Resuscitation 2021, 158, 175–182. [Google Scholar] [CrossRef]
- Grissom, C.K.; Radwin, M.I.; Harmston, C.H.; Hirshberg, E.L.; Crowley, T.J. Respiration during snow burial using an artificial air pocket. JAMA 2000, 283, 2266–2271. [Google Scholar] [CrossRef] [PubMed] [Green Version]
- Radwin, M.I.; Grissom, C.K.; Scholand, M.B.; Harmston, C.H. Normal oxygenation and ventilation during snow burial by the exclusion of exhaled carbon dioxide. Wilderness Environ. Med. 2001, 12, 256–262. [Google Scholar] [CrossRef]
- McIntosh, S.E.; Little, C.E.; Seibert, T.D.; Polukoff, N.E.; Grissom, C.K. Avalanche airbag post-burial active deflation—The ability to create an air pocket to delay asphyxiation and prolong survival. Resuscitation 2020, 146, 155–160. [Google Scholar] [CrossRef] [PubMed]
- Roubik, K.; Sieger, L.; Sykora, K. Work of breathing into snow in the presence versus absence of an artificial air pocket affects hypoxia and hypercapnia of a victim covered with avalanche snow: A randomized double blind crossover study. PLoS ONE 2015, 10, e0144332. [Google Scholar] [CrossRef] [Green Version]
- Wik, L.; Brattebø, G.; Østerås, Ø.; Assmus, J.; Irusta, U.; Aramendi, E.; Mydske, S.; Skaalhegg, T.; Skaiaa, S.C.; Thomassen, Ø. Physiological effects of providing supplemental air for avalanche victims. A randomised trial. Resuscitation 2022, 172, 38–46. [Google Scholar] [CrossRef]
- Roubik, K.; Filip, J. Reliability and source of errors in end-tidal gas concentration evaluation algorithms during avalanche snow and rebreathing experiments. Lek. A Tech. Clin. Technol. 2017, 47, 73–80. [Google Scholar]
- Horakova, L.; Roubik, K. Performance of Different Pulse Oximeters Can Affect the Duration of Field Breathing Experiments. In Proceedings of the 2019 E-Health and Bioengineering Conference, EHB, Iasi, Romania, 21–23 November 2019; pp. 1–4. [Google Scholar]
- Horakova, L.; Sykora, K.; Sieger, L.; Roubik, K. Breathing Experiments into the Simulated Avalanche Snow: Medical and Technical Issues of the Outdoor Breathing Trials. In Proceedings of the World Congress on Medical Physics and Biomedical Engineering 2018, IFMBE Proceedings, Prague, Czech Republic, 3–8 June 2018; Lhotska, L., Sukupova, L., Lacković, I., Ibbott, G., Eds.; Springer: Singapore, 2019; Volume 68/1, pp. 711–717. [Google Scholar]
- Trivedi, N.S.; Ghouri, A.F.; Shah, N.K.; Lai, E.; Barker, S.J. Pulse oximeter performance during desaturation and resaturation: A comparison of seven models. J. Clin. Anesth. 1997, 9, 184–188. [Google Scholar] [CrossRef]
- Roubik, K.; Sykora, K.; Sieger, L.; Ort, V.; Horakova, L.; Walzel, S. Perlite is a suitable model material for experiments investigating breathing in high density snow. Sci. Rep. 2022, 12, 2070. [Google Scholar] [CrossRef]
- General Electric Company. Datex Ohmeda S/5 Compact Anesthesia Monitor. In Technical Reference Manual; General Electric Company: Madison, MI, USA, 2006. [Google Scholar]
- GE Healthcare. Carescape Monitors B850 and B650 User’s Manual; GE Healthcare: Milwaukee, WI, USA, 2013. [Google Scholar]
- Edan USA. M3B Vital Signs Monitor User Manual, Version 1.6; EDAN Instruments: San Diego, CA, USA, 2012. [Google Scholar]
- Masimo. Radical-7 Operator’s Manual; Masimo: Irvine, CA, USA, 2012. [Google Scholar]
- Nonin. Model 2500 PalmSAT. In Operator’s Manual; Nonin Medical Inc.: Plymouth, MN, USA, 2014. [Google Scholar]
- Roubik, K.; Walzel, S.; Horakova, L.; Refalo, A.; Sykora, K.; Ort, V.; Sieger, L. Materials suitable to simulate snow during breathing experiments for avalanche survival research. Lek. A Tech. Clin. Technol. 2020, 50, 32–39. [Google Scholar] [CrossRef]
- Nitzan, M.; Romem, A.; Koppel, R. Pulse oximetry: Fundamentals and technology update. Med. Devices 2014, 7, 231–239. [Google Scholar] [CrossRef]
- International Organization for Standardization. Medical Electrical Equipment—Part 2-61: Particular Requirements for Basic Safety and Essential Performance of Pulse Oximeter Equipment ISO 80601-2-61:2017; CEN-CENELEC Management Centre: Brussels, Belgium, 2019. [Google Scholar]
- Vagedes, J.; Bialkowski, A.; Wiechers, C.; Poets, C.F.; Dietz, K. A conversion formula for comparing pulse oximeter desaturation rates obtained with different averaging times. PLoS ONE 2014, 9, e87280. [Google Scholar]
- McClure, C.; Jang, S.Y.; Fairchild, K. Alarms, oxygen saturations, and SpO2 averaging time in the NICU. J. Neonatal. Perinat. Med. 2016, 9, 357–362. [Google Scholar] [CrossRef] [PubMed] [Green Version]
- Goldman, J.M.; Petterson, M.T.; Kopotic, R.J.; Barker, S.J. Masimo signal extraction pulse oximetry. J. Clin. Monit. Comput. 2000, 16, 475–483. [Google Scholar] [CrossRef] [PubMed]
- Jubran, A. Pulse oximetry. Crit. Care 2015, 19, 272. [Google Scholar] [CrossRef] [PubMed] [Green Version]
- Horakova, L.; Kudrna, P.; Roubik, K. Dynamic changes of perfusion index during hypoxemia and hypercapnia in outdoor experiments. In 2021 International Conference on e-Health and Bioengineering (EHB); IEEE: Piscataway, NJ, USA, 2021; pp. 1–6. [Google Scholar]
- Lawless, S.T. Crying wolf: False alarms in a pediatric intensive care unit. Crit. Care Med. 1994, 22, 981–985. [Google Scholar] [CrossRef] [PubMed]
- Chambrin, M.-C.; Ravaux, P.; Calvelo-Aros, D.; Jaborska, A.; Chopin, C.; Boniface, B. Multicentric study of monitoring alarms in the adult intensive care unit (ICU): A descriptive analysis. Intensive Care Med. 1999, 25, 1360–1366. [Google Scholar] [CrossRef]
- Taylor, M.; Whitwam, J. The accuracy of pulse oximeters: A comparative clinical evaluation of five pulse oximeters. Anaesthesia 1988, 43, 229–232. [Google Scholar] [CrossRef]
- Barker, S.J. “Motion-resistant” pulse oximetry: A comparison of new and old models. Anesth. Analg. 2002, 95, 967–972. [Google Scholar]
- Robertson, F.A.; Hoffman, G.M. Clinical evaluation of the effects of signal integrity and saturation on data availability and accuracy of Masimo SET® and Nellcor N-395 oximeters in children. Anesth. Analg. 2004, 98, 617–622. [Google Scholar] [CrossRef]
- Van de Louw, A.; Cracco, C.; Cerf, C.; Harf, A.; Duvaldestin, P.; Lemaire, F.; Brochard, L. Accuracy of pulse oximetry in the intensive care unit. Intensive Care Med. 2001, 27, 1606–1613. [Google Scholar] [CrossRef]
- Nitzan, M.; Nitzan, I.; Arieli, Y. The Various Oximetric Techniques Used for the Evaluation of Blood Oxygenation. Sensors 2020, 20, 4844. [Google Scholar] [CrossRef] [PubMed]
- Jubran, A. Pulse oximetry. In Principles and Practice of Intensive Care Monitoring; Tobin, M.J., Ed.; McGraw-Hill: New York, NY, USA, 1998; pp. 261–289. [Google Scholar]
- Johnston, E.D.; Boyle, B.; Juszczak, E.; King, A.; Brocklehurst, P.; Stenson, B.J. Oxygen targeting in preterm infants using the Masimo SET Radical pulse oximeter. Arch. Dis. Child. Fetal Neonatal Ed. 2011, 96, F429–F433. [Google Scholar] [CrossRef] [PubMed] [Green Version]
- Ross, P.A.; Newth, C.J.; Khemani, R.G. Accuracy of pulse oximetry in children. Pediatrics 2014, 133, 22–29. [Google Scholar] [CrossRef] [PubMed] [Green Version]
- Bachman, T.E.; Newth, C.J.; Ross, P.A.; Iyer, N.P.; Khemani, R.G. Characterization of the bias between oxygen saturation measured by pulse oximetry and calculated by an arterial blood gas analyzer in critically ill neonates. Lek. A Tech. Clin. Technol. 2017, 47, 130–134. [Google Scholar]
- Ikeda, K.; MacLeod, D.B.; Grocott, H.P.; Moretti, E.W.; Ames, W.; Vacchiano, C. The accuracy of a near-infrared spectroscopy cerebral oximetry device and its potential value for estimating jugular venous oxygen saturation. Anesth. Analg. 2014, 119, 1381–1392. [Google Scholar] [CrossRef] [Green Version]
- Gehring, H.; Hornberger, C.; Hornberger, H.; Schmucker, P. The effects of motion artifact and low perfusion on the performance of a new generation of pulse oximeters in volunteers undergoing hypoxemia. Respir. Care 2002, 47, 48–60. [Google Scholar]
- Yamaya, Y.; Bogaard, H.J.; Wagner, P.D.; Niizeki, K.; Hopkins, S.R. Validity of pulse oximetry during maximal exercise in normoxia, hypoxia, and hyperoxia. J. Appl. Physiol. 2002, 92, 162–168. [Google Scholar] [CrossRef] [Green Version]
- Ricart, A.; Pages, T.; Viscor, G.; Leal, C.; Ventura, J.L. Sex-linked differences in pulse oxymetry. Br. J. Sports Med. 2008, 42, 620–621. [Google Scholar] [CrossRef]
Figure 1.
Phases of breathing experiments.
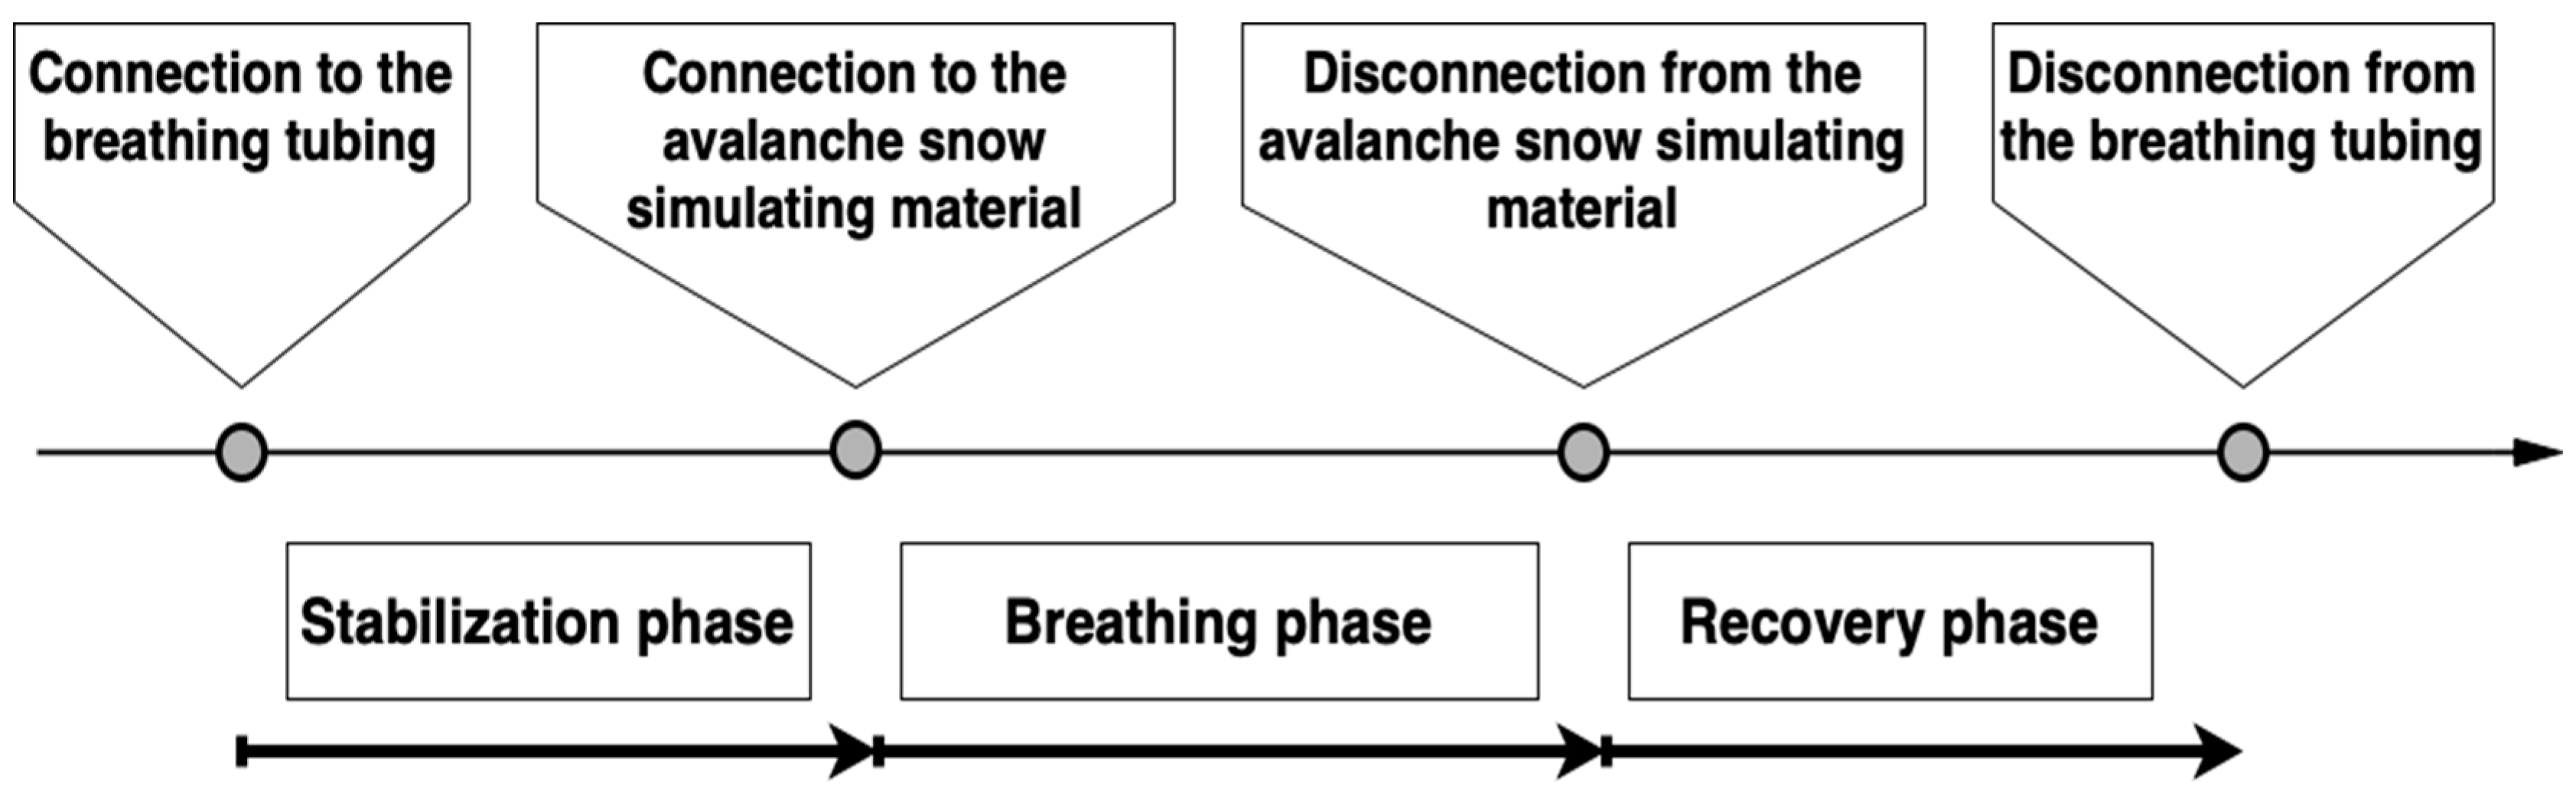
Figure 2.
A photo from the stabilization phase of the experiment. Subject is in a prone position, lying on an insulated mat, breathing through a mouthpiece connected to a monitor. The specially designed tubing is ready to be connected to the cone-shaped container filled with material simulating avalanche snow. The subject is monitored closely by the attending physician.
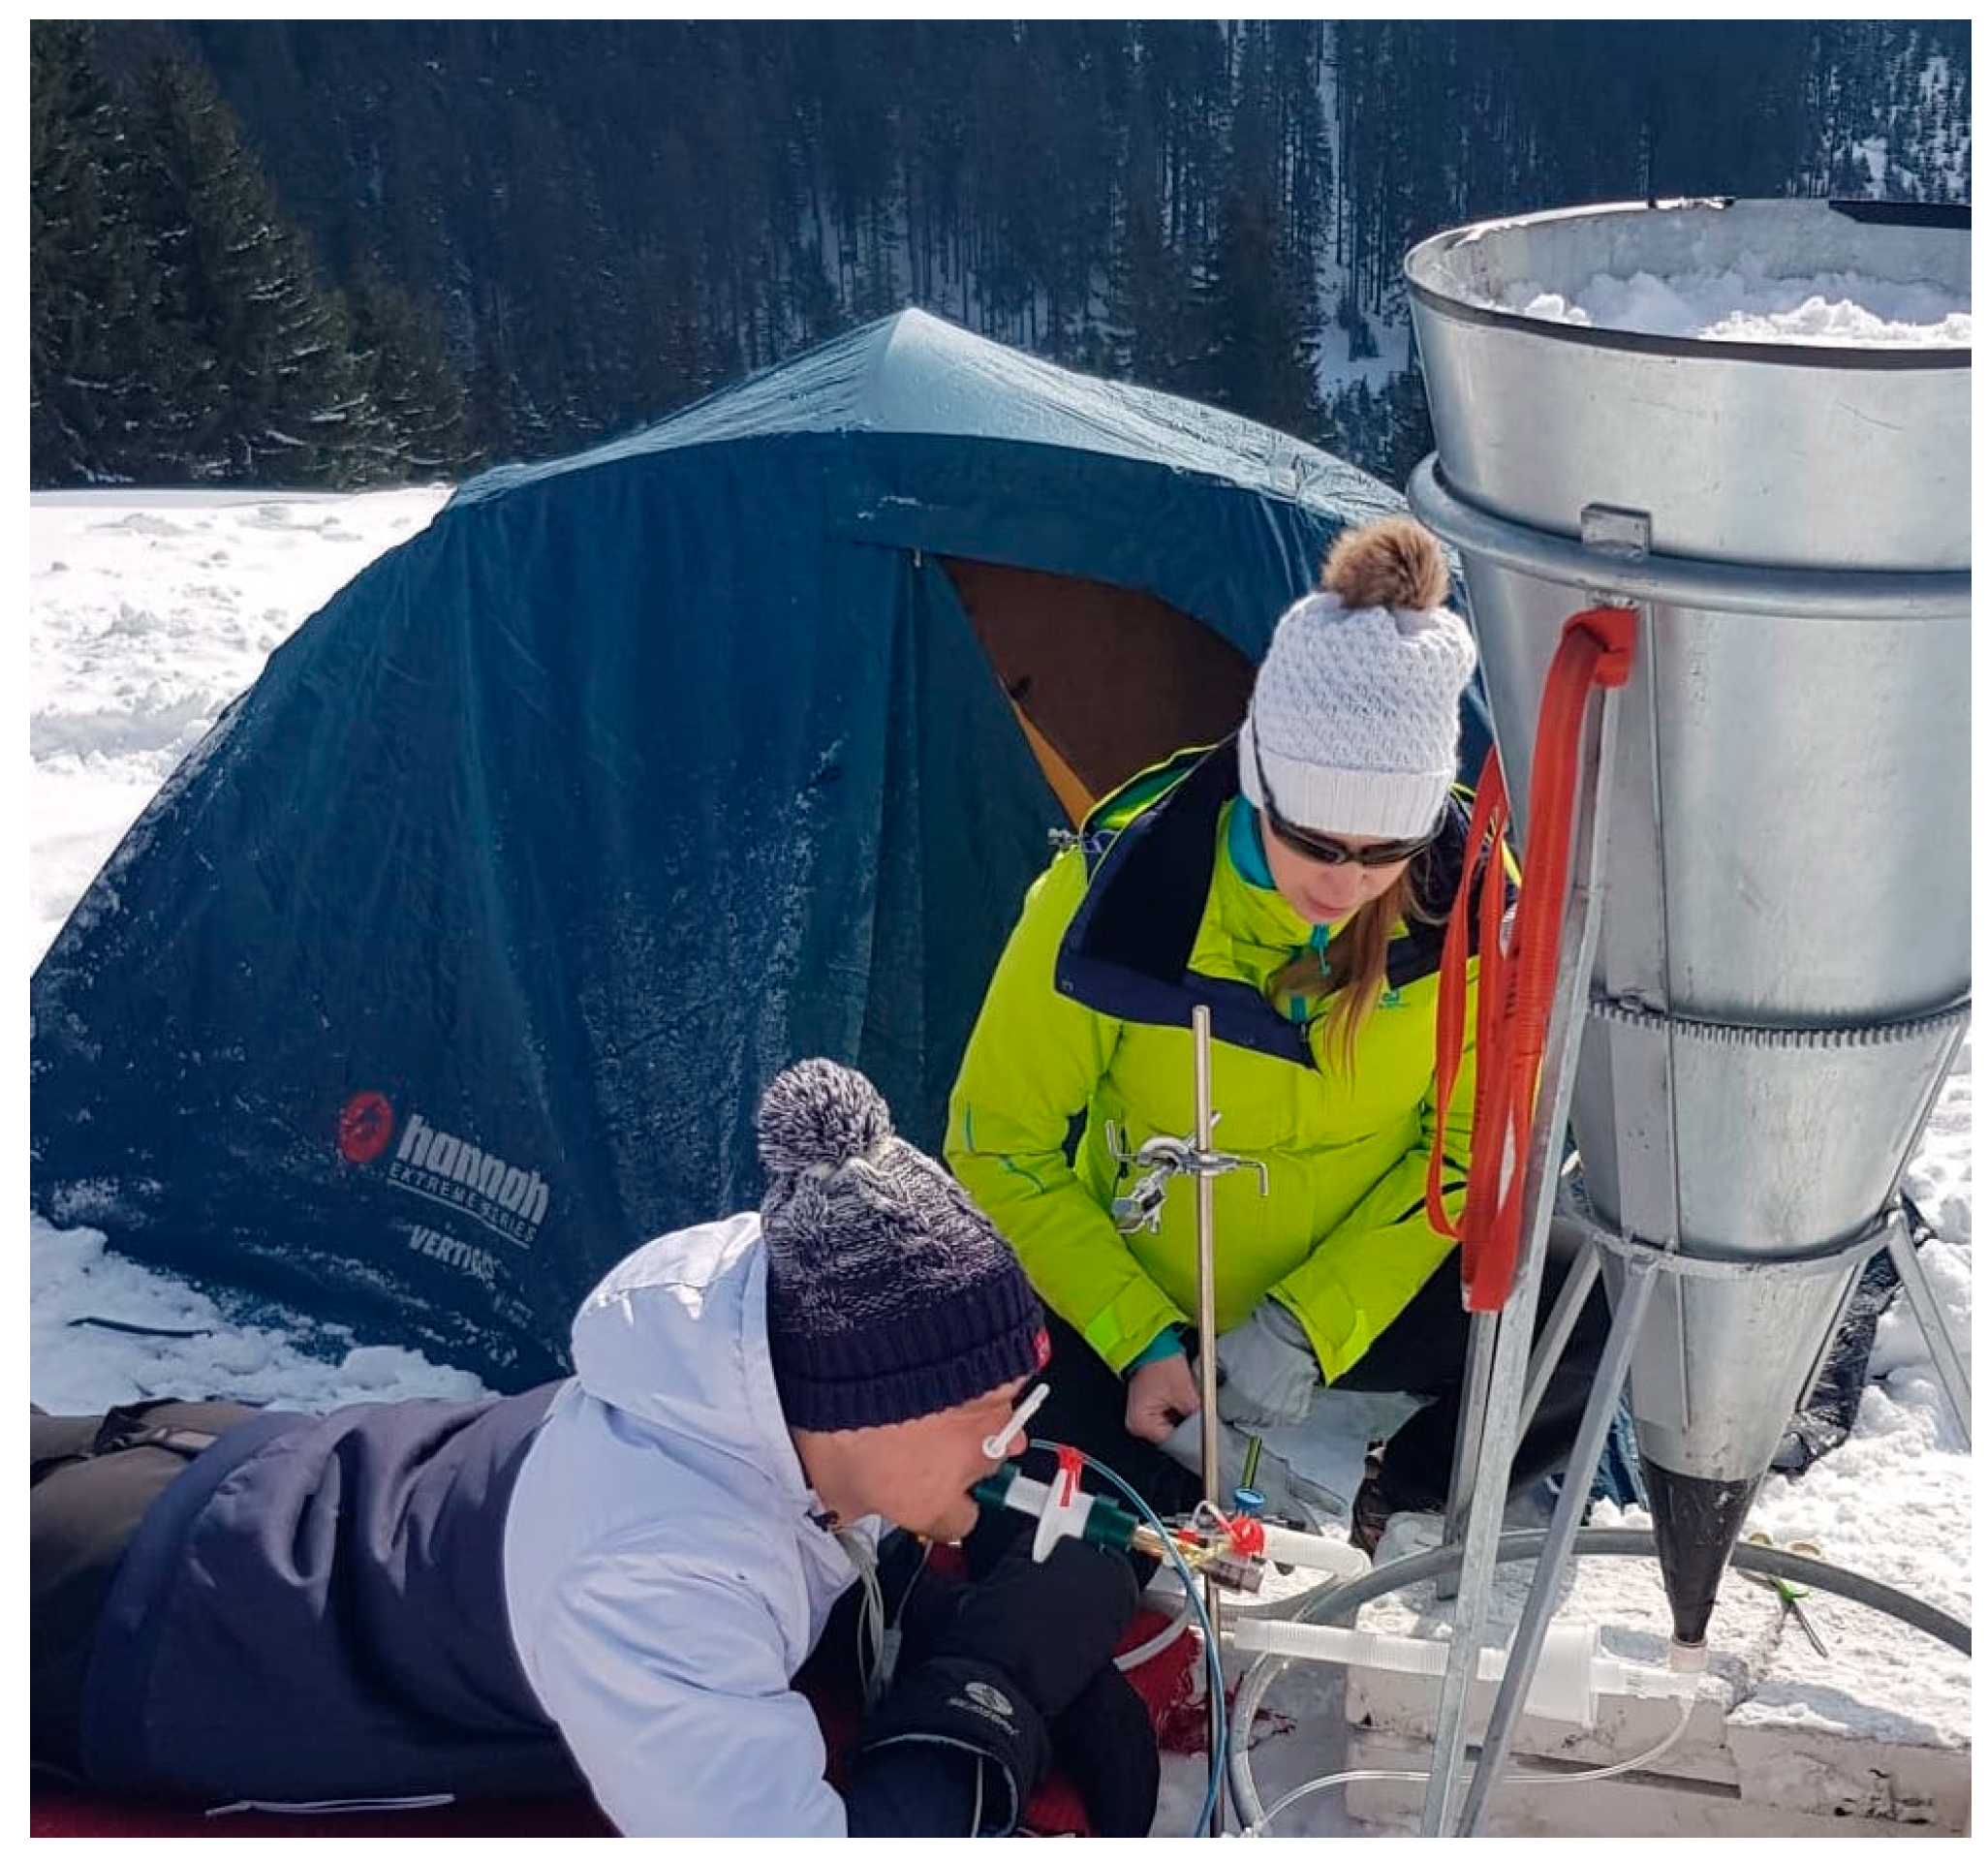
Figure 3.
An example of SpO2 waveforms simultaneously presented by five different pulse oximeters. The time difference between the point when the first and the last pulse oximeter showed the typical study endpoints SpO2 85% and 75% is depicted as the black horizontal line. The pulse oximeter Edan M3B showed a stereotypical value of 43% for 70 s after the end of the breathing phase even though other devices presented values within the physiological range already.
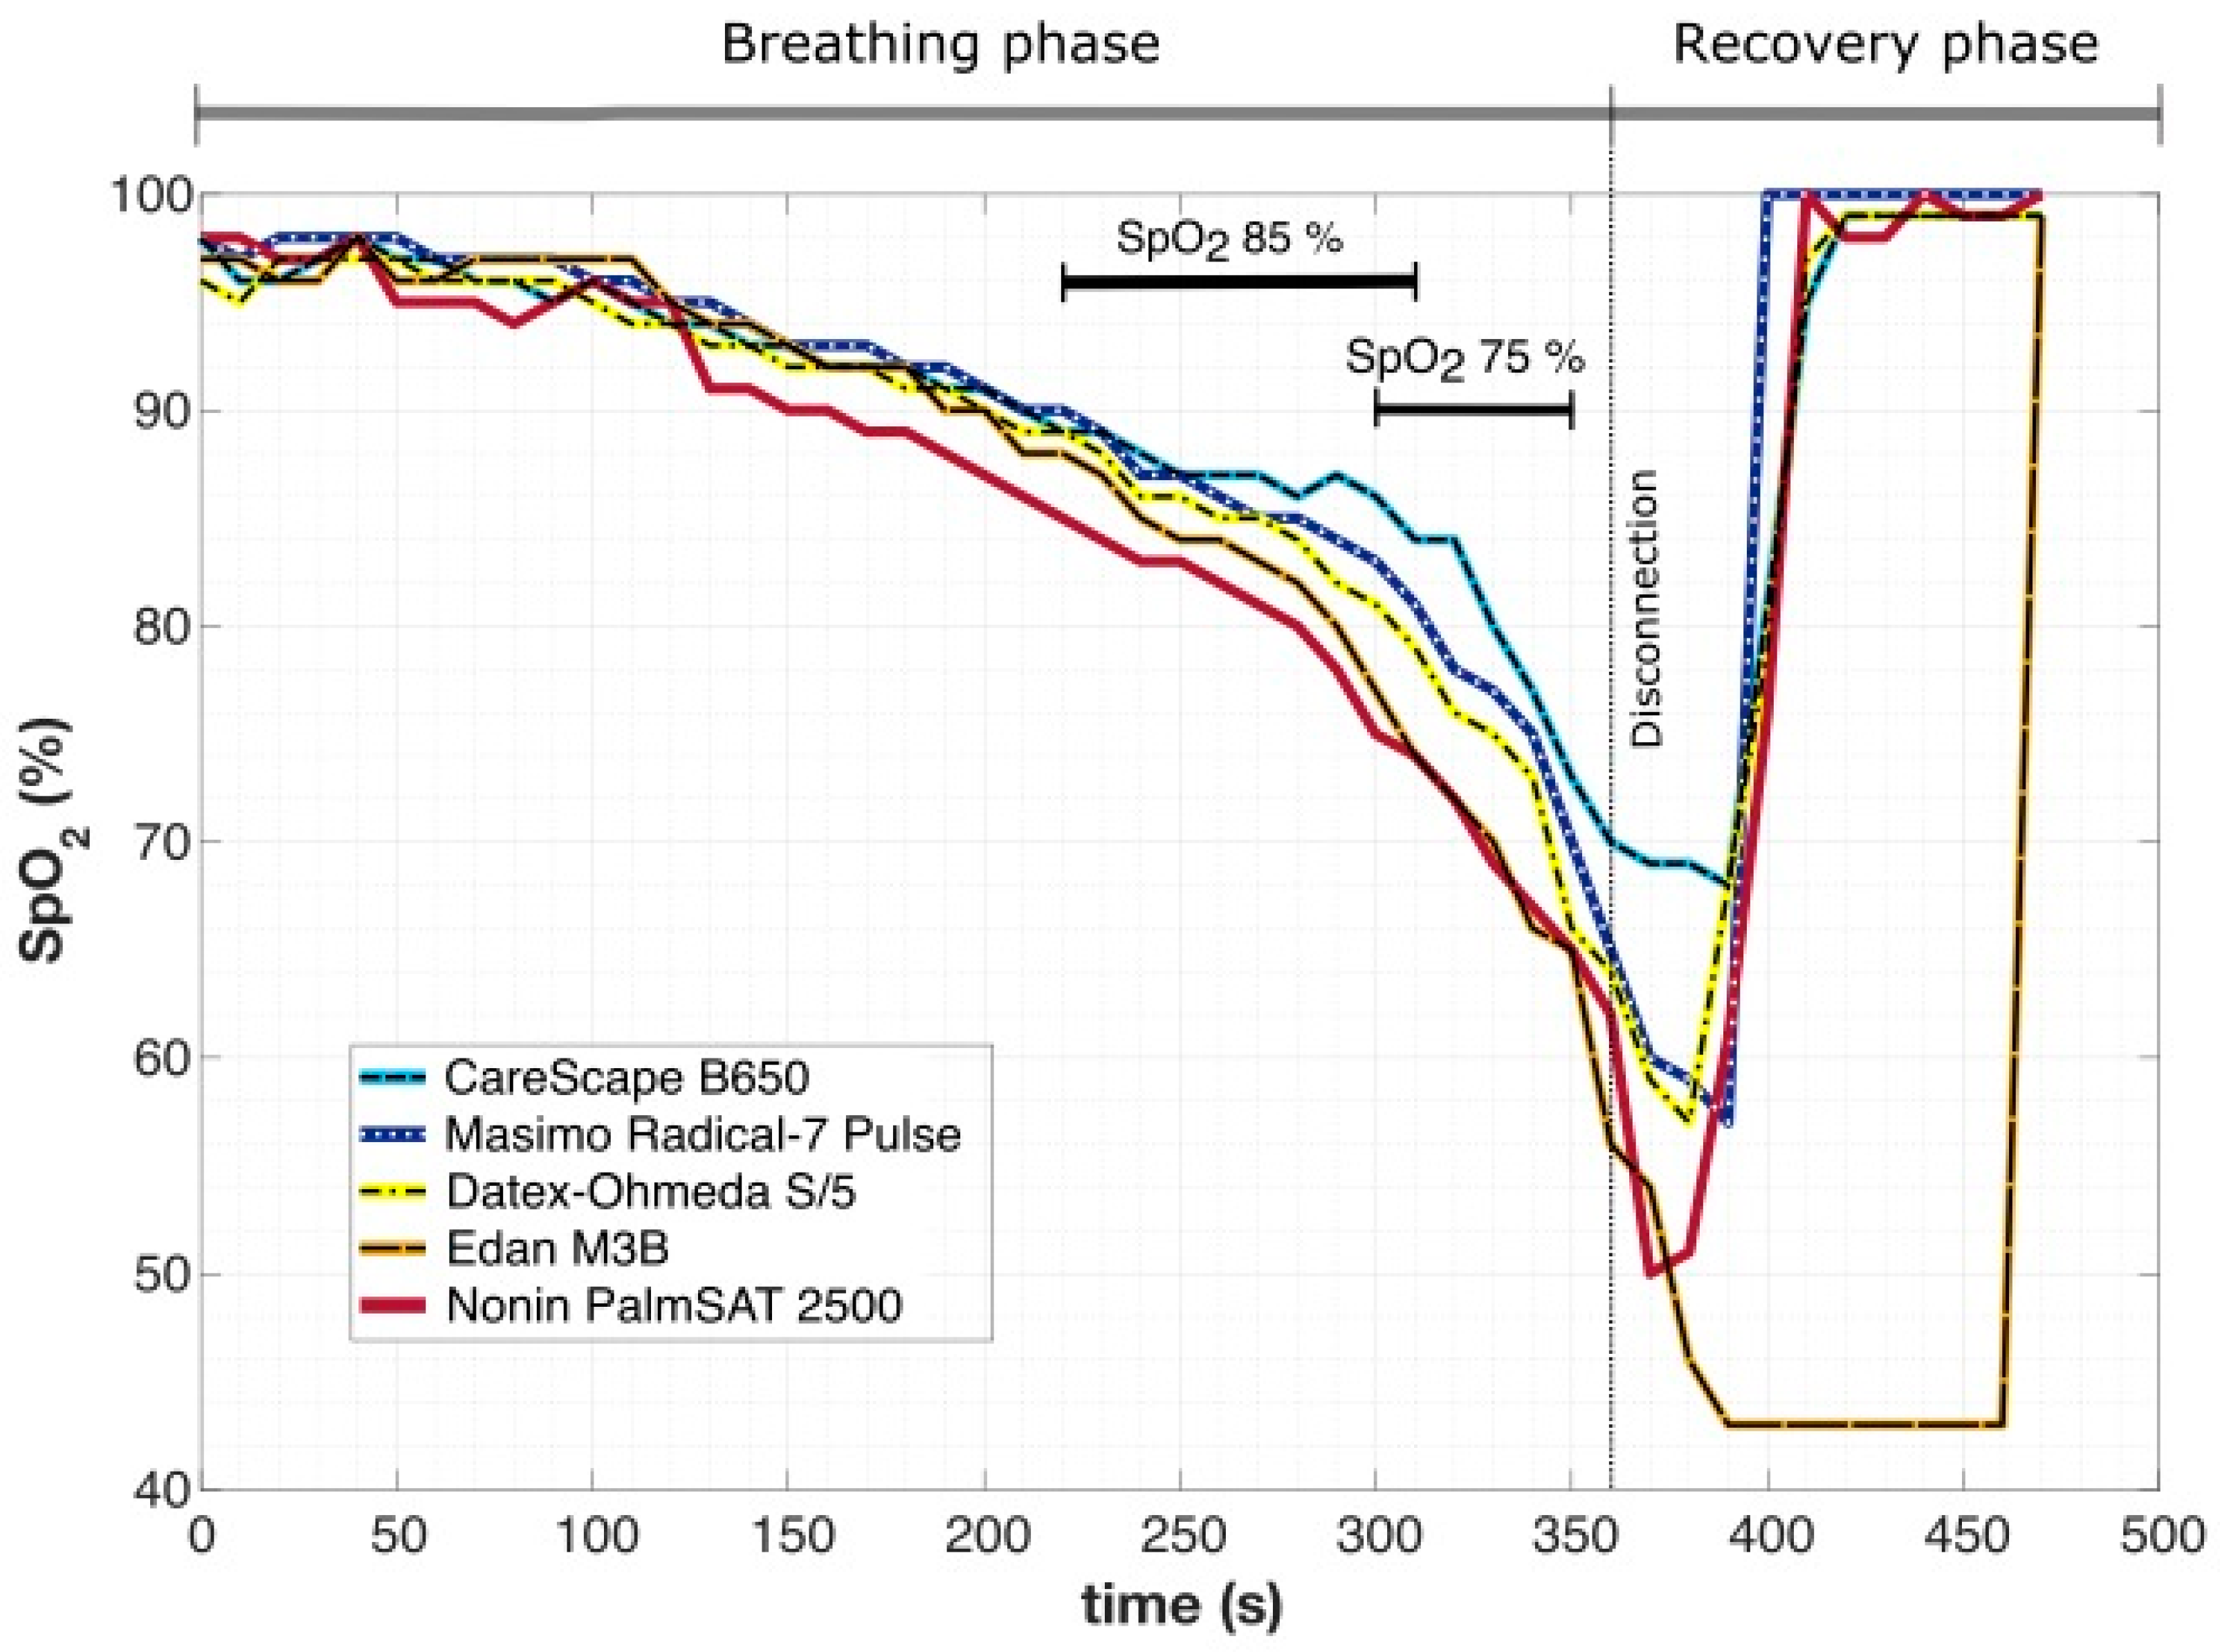
Figure 4.
Examples of three individual breathing experiments underwent by three different subjects. The SpO2 values measured by five different pulse oximeters are presented by color lines. A gray stripe around each line represents the accuracy range of the respective oximeter guaranteed by the manufacturer. Green thick lines represent periods when all five gray stripes overlap, that means all five pulse oximeters showed a value consistent with the others when respecting the accuracies guaranteed by the manufacturer. (a) Very short congruent periods; (b) long congruent periods lasting 74.4% of experimental time; (c) ostensibly long congruent periods were proved to be congruent only in 50% of time; moreover, the congruent segments were present outside the period of rapid changes of SpO2.

Figure 5.
The difference of average SpO2 value displayed by individual pulse oximetry devices and the average value of all pulse oximeters which represents ‘0’ on the y-axis. The difference is displayed at the beginning of the breathing phase (0 s), and at 60, 120, 180, 240 and 300 s. The error bars depict the standard deviation (SD). For example, at 300 s the Nonin PalmSAT on average read 14% higher than the average pulse oximeter reading with a SD 15%.


Table 1.
A list of used pulse oximetry devices, their standardized placement on subjects’ right-hand fingers, the manufacturer guaranteed accuracy in the defined measurement intervals of peripheral saturation (SpO2) and the minimal response time set [21,22,23,24,25].
| Pulse Oximeter | Finger | Interval of SpO2 Measurement | Accuracy in Adults (No Motion) | Response Time (Minimal) |
|---|---|---|---|---|
| Datex-Ohmeda S/5 anesthesia monitor | V. | 40–100% | 80–100% ± 2% 50–80% ± 3% | beat-to-beat |
| Masimo Radical-7 Pulse CO-Oximeter | IV. | 0–100% | 70–100% ± 2% | 3 s |
| CareScape B650 | III. | 40–100% | 80–100% ± 2% 50–80% ± 3% | 2 to 4 s |
| Edan M3B | II. | 0–100% | 70–100% ± 2% | not adjustable |
| Nonin PalmSAT 2500 | I. | 0–100% | 70–100% ± 2% | not adjustable |
Table 2.
The characteristics of the group of volunteers included in the data analysis.
| Parameter | Volunteers (n = 13) |
|---|---|
| Age (years) | 22.8 ± 4.1 (20–35) |
| Weight (kg) | 80.8 ± 8.8 (66–103) |
| Height (cm) | 179.5 ± 5.0 (172–187) |
| BMI (kg·m−2) | 25.1 ± 2.6 (22.3–33.3) |
| FEV1 (L) | 4.6 ± 0.6 (3.3–5.4) |
| FVC (L) | 5.0 ± 0.8 (3.3–6.0) |
| FEV1/FVC | 0.93 ± 0.05 (0.84–0.96) |
The values are presented as mean ± standard deviation and range (minimum–maximum). Abbreviations: BMI—Body Mass Index; FEV1—Forced Expiratory Volume in 1 s; FVC—Forced Vital Capacity.
Publisher’s Note: MDPI stays neutral with regard to jurisdictional claims in published maps and institutional affiliations. |
© 2022 by the authors. Licensee MDPI, Basel, Switzerland. This article is an open access article distributed under the terms and conditions of the Creative Commons Attribution (CC BY) license (https://creativecommons.org/licenses/by/4.0/).
Share and Cite
MDPI and ACS Style
Horakova, L.; Roubik, K. Pulse Oximeter Performance during Rapid Desaturation. Sensors 2022, 22, 4236. https://doi.org/10.3390/s22114236
AMA Style
Horakova L, Roubik K. Pulse Oximeter Performance during Rapid Desaturation. Sensors. 2022; 22(11):4236. https://doi.org/10.3390/s22114236
Chicago/Turabian StyleHorakova, Lenka, and Karel Roubik. 2022. "Pulse Oximeter Performance during Rapid Desaturation" Sensors 22, no. 11: 4236. https://doi.org/10.3390/s22114236
Note that from the first issue of 2016, this journal uses article numbers instead of page numbers. See further details here.