
Respiratory Inductance Plethysmography to Assess Fatigability during Repetitive Work

 ,
,  ,
,  , , ,
, , ,  ,
, 

Abstract
:1. Introduction
2. Materials and Methods
2.1. Participants
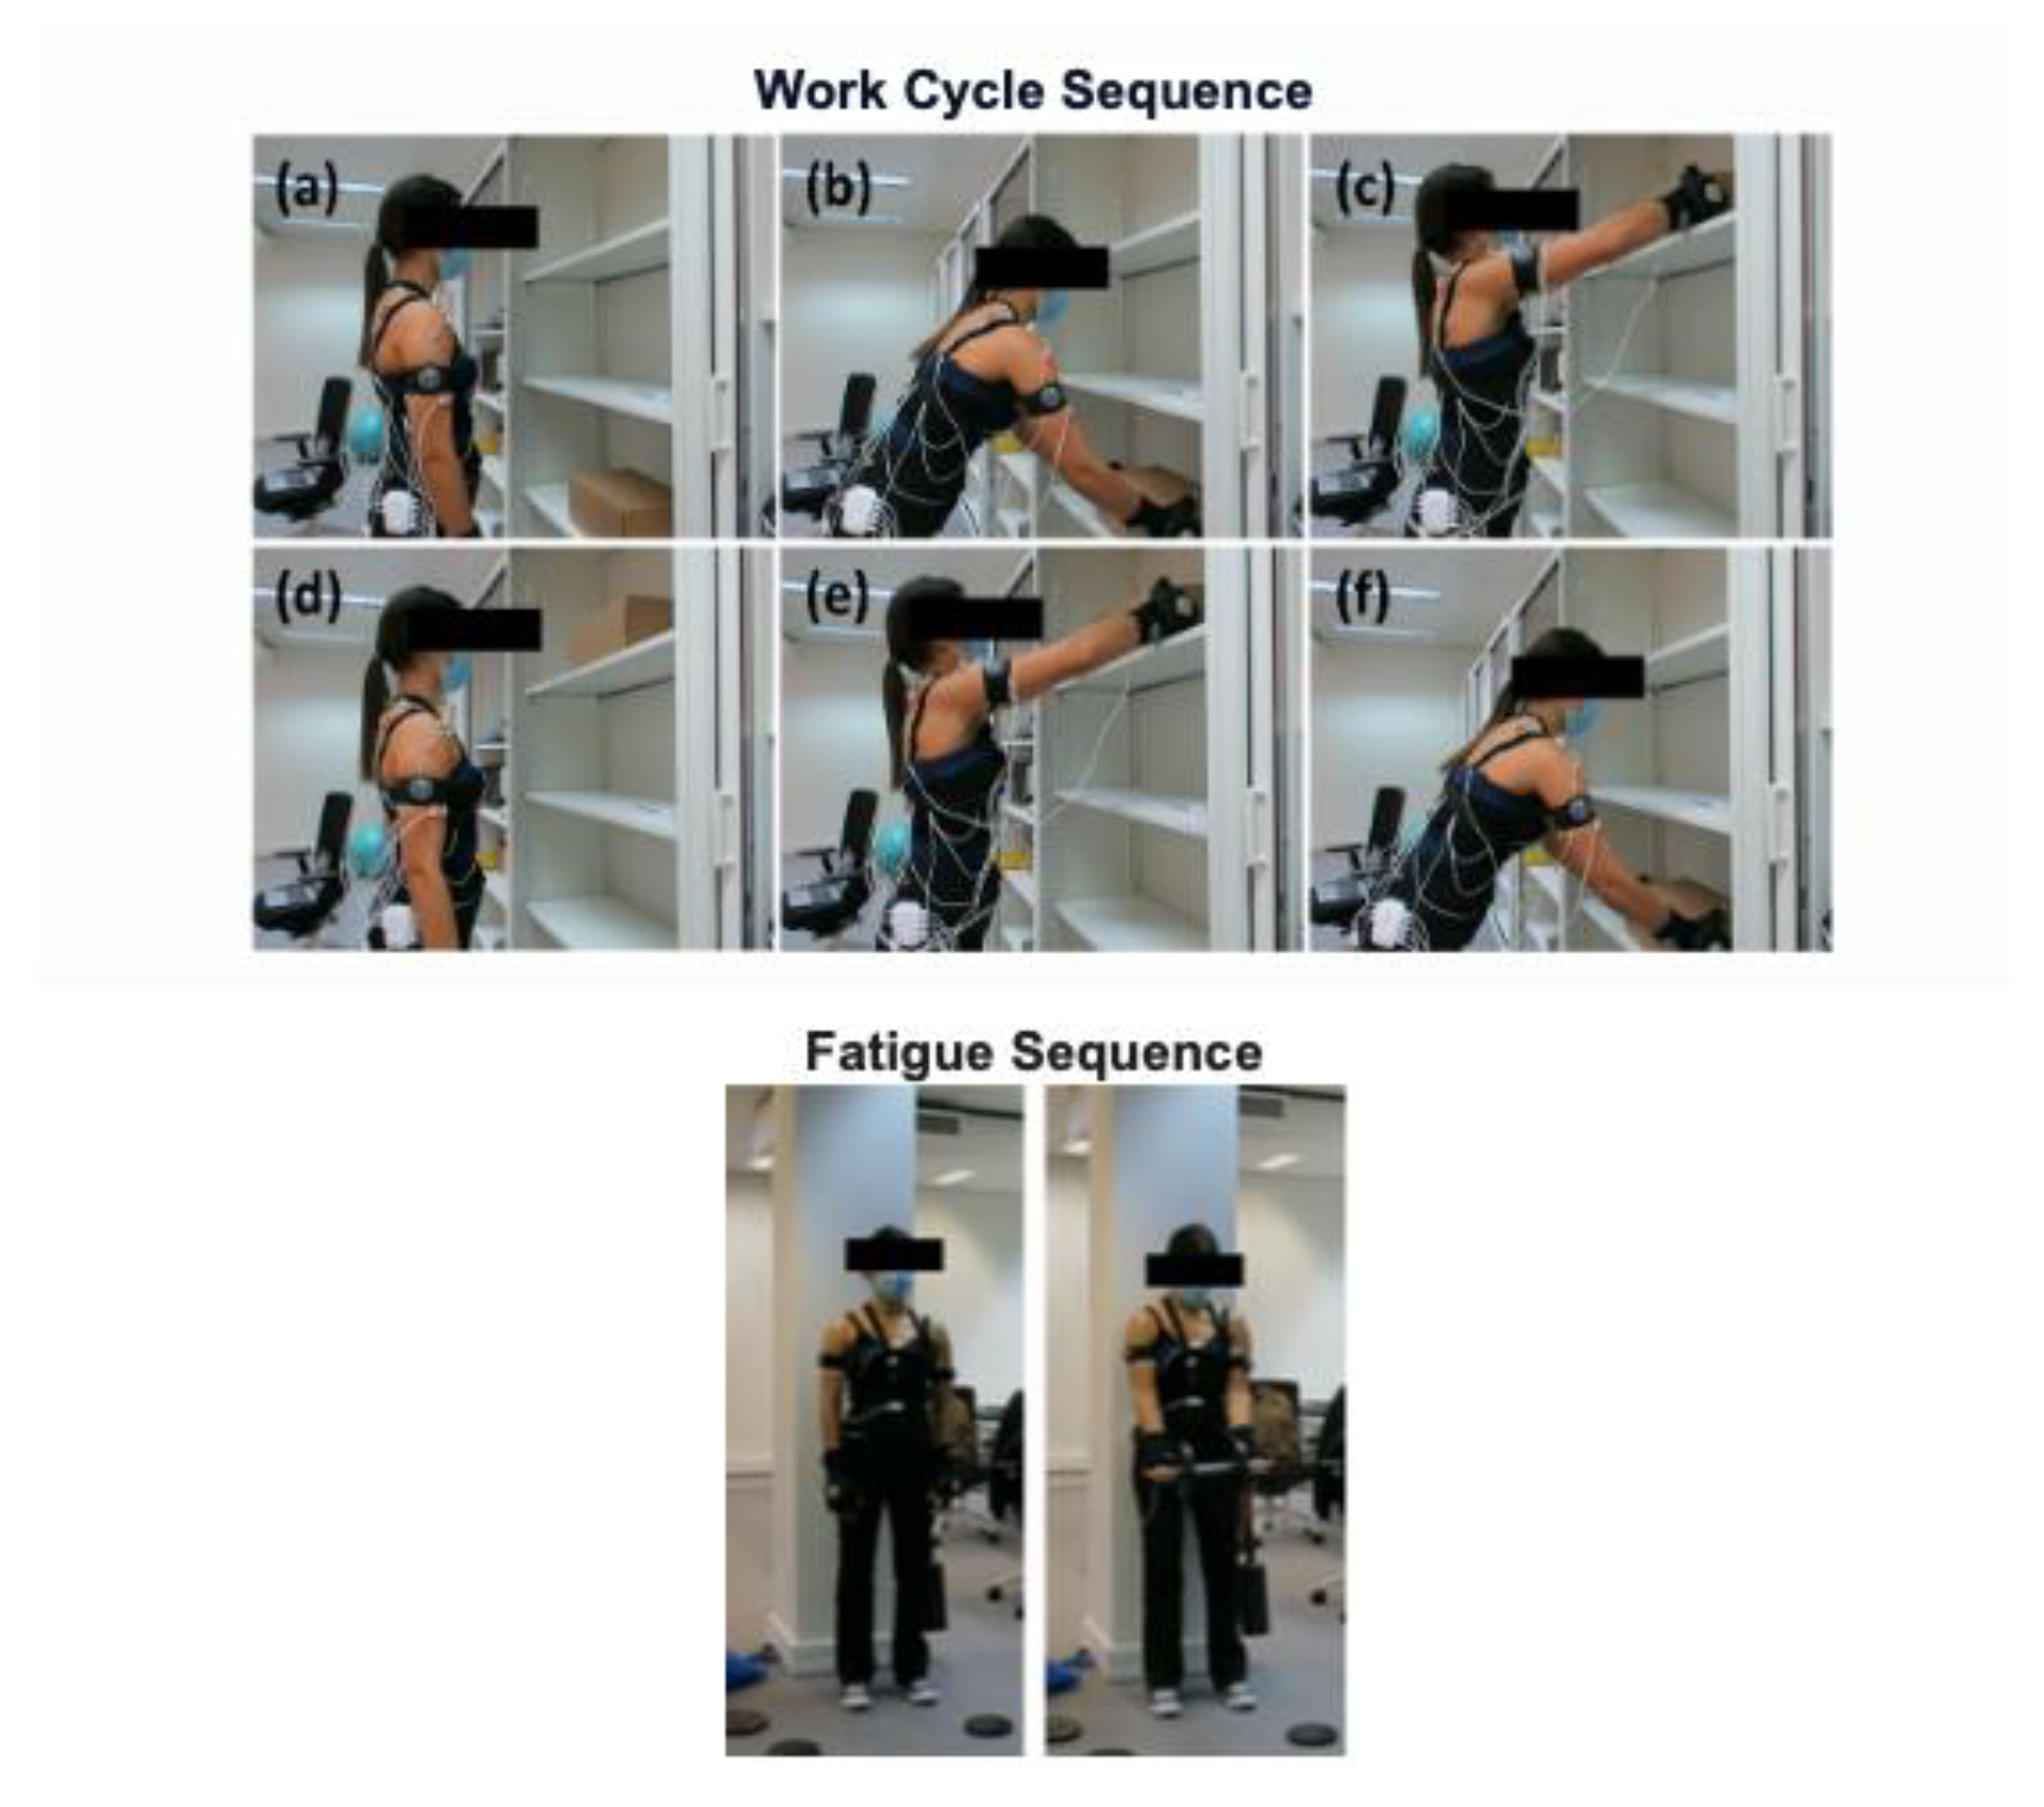
2.2. Task
2.3. Respiratory Inductance Plethysmography
2.4. EMG
2.5. Accelerometer
2.6. Statistical Analysis
3. Results
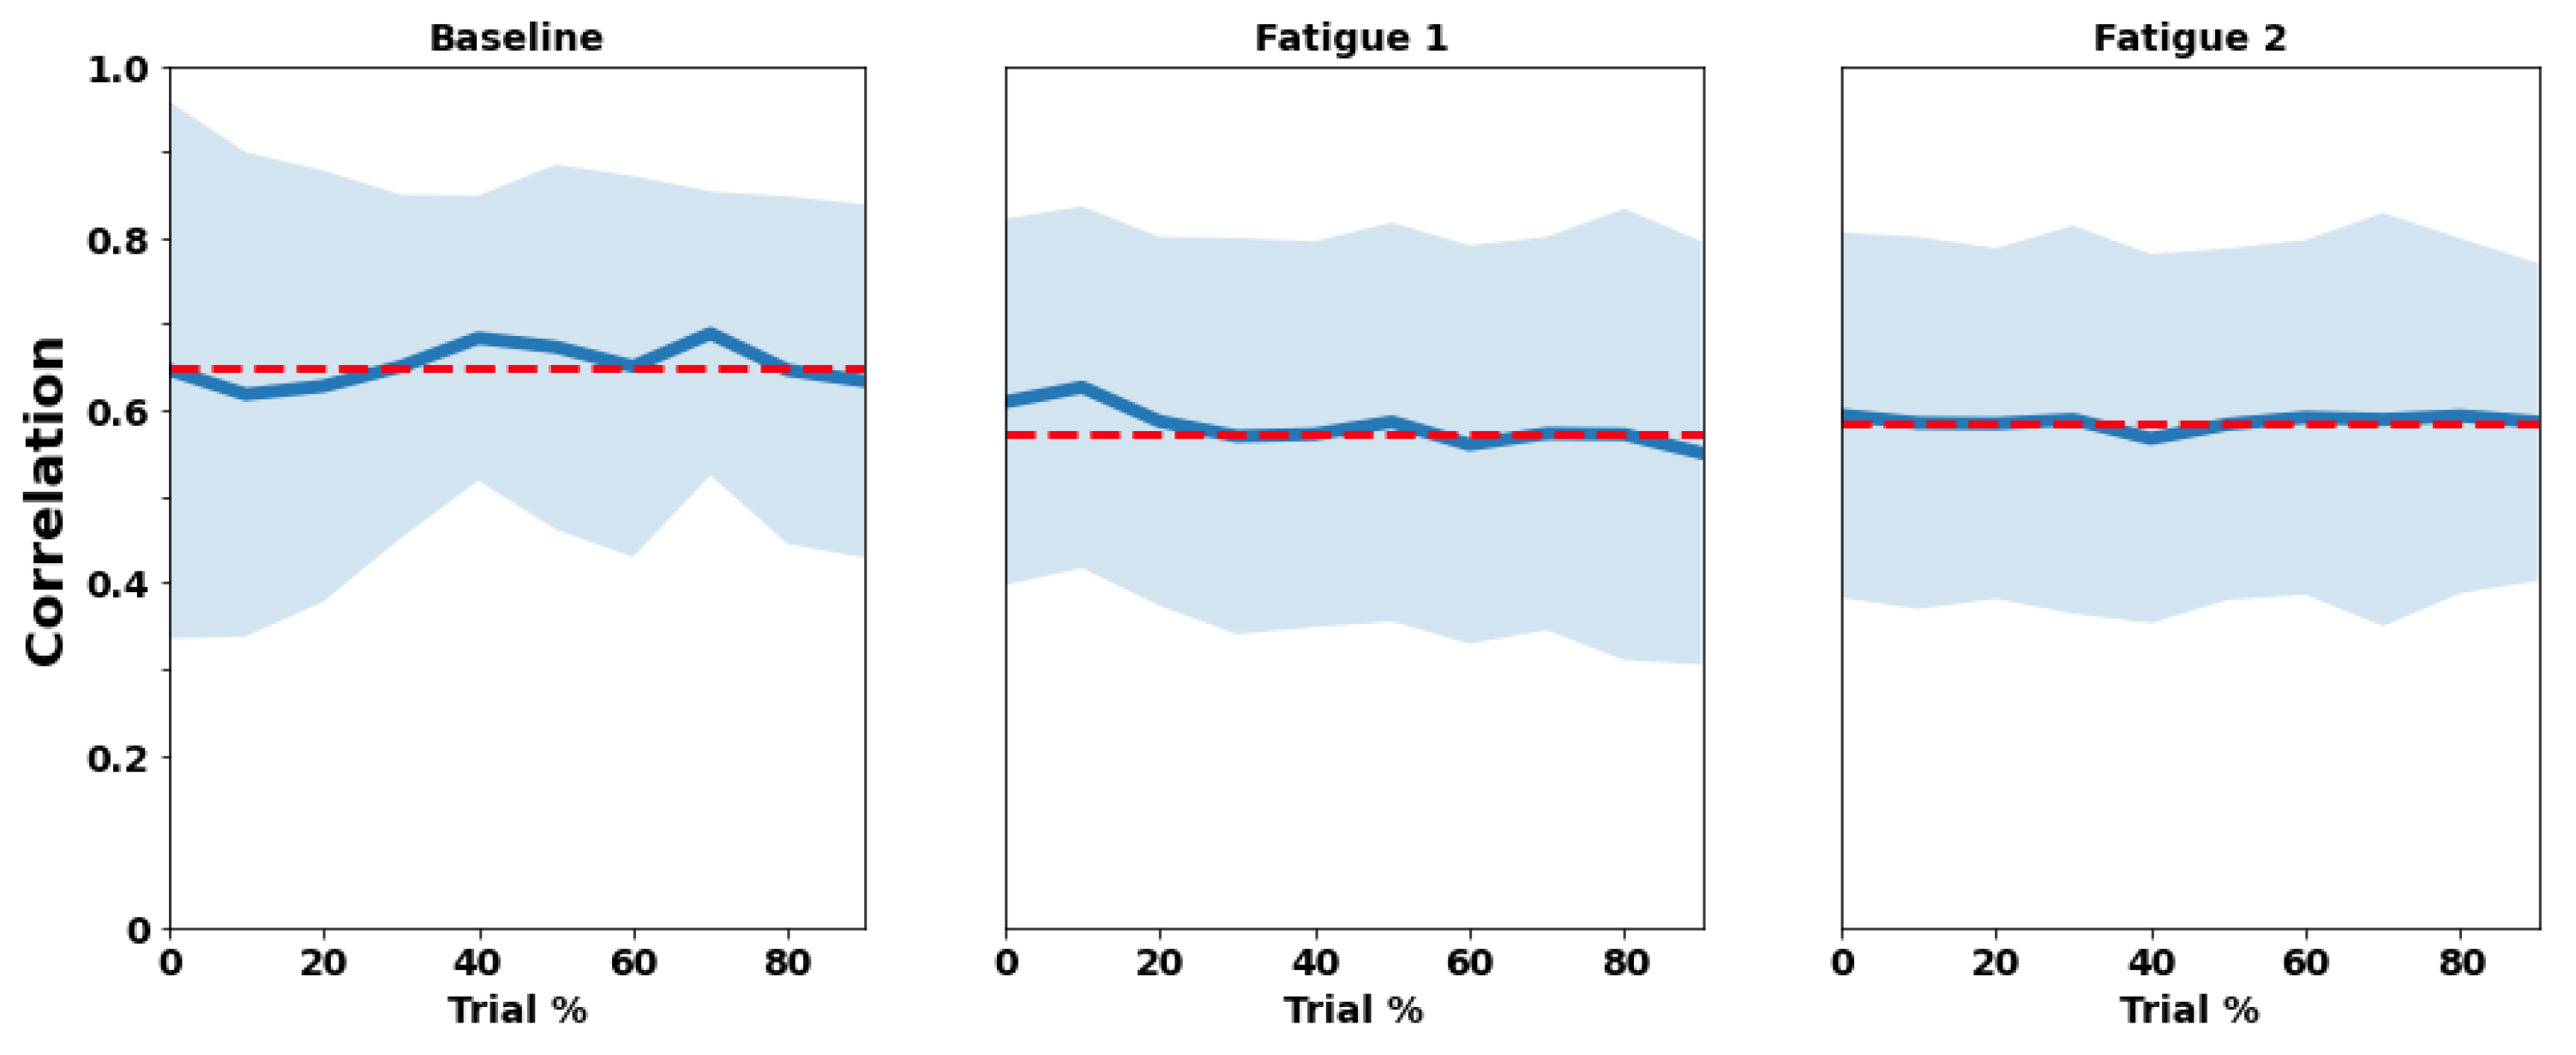
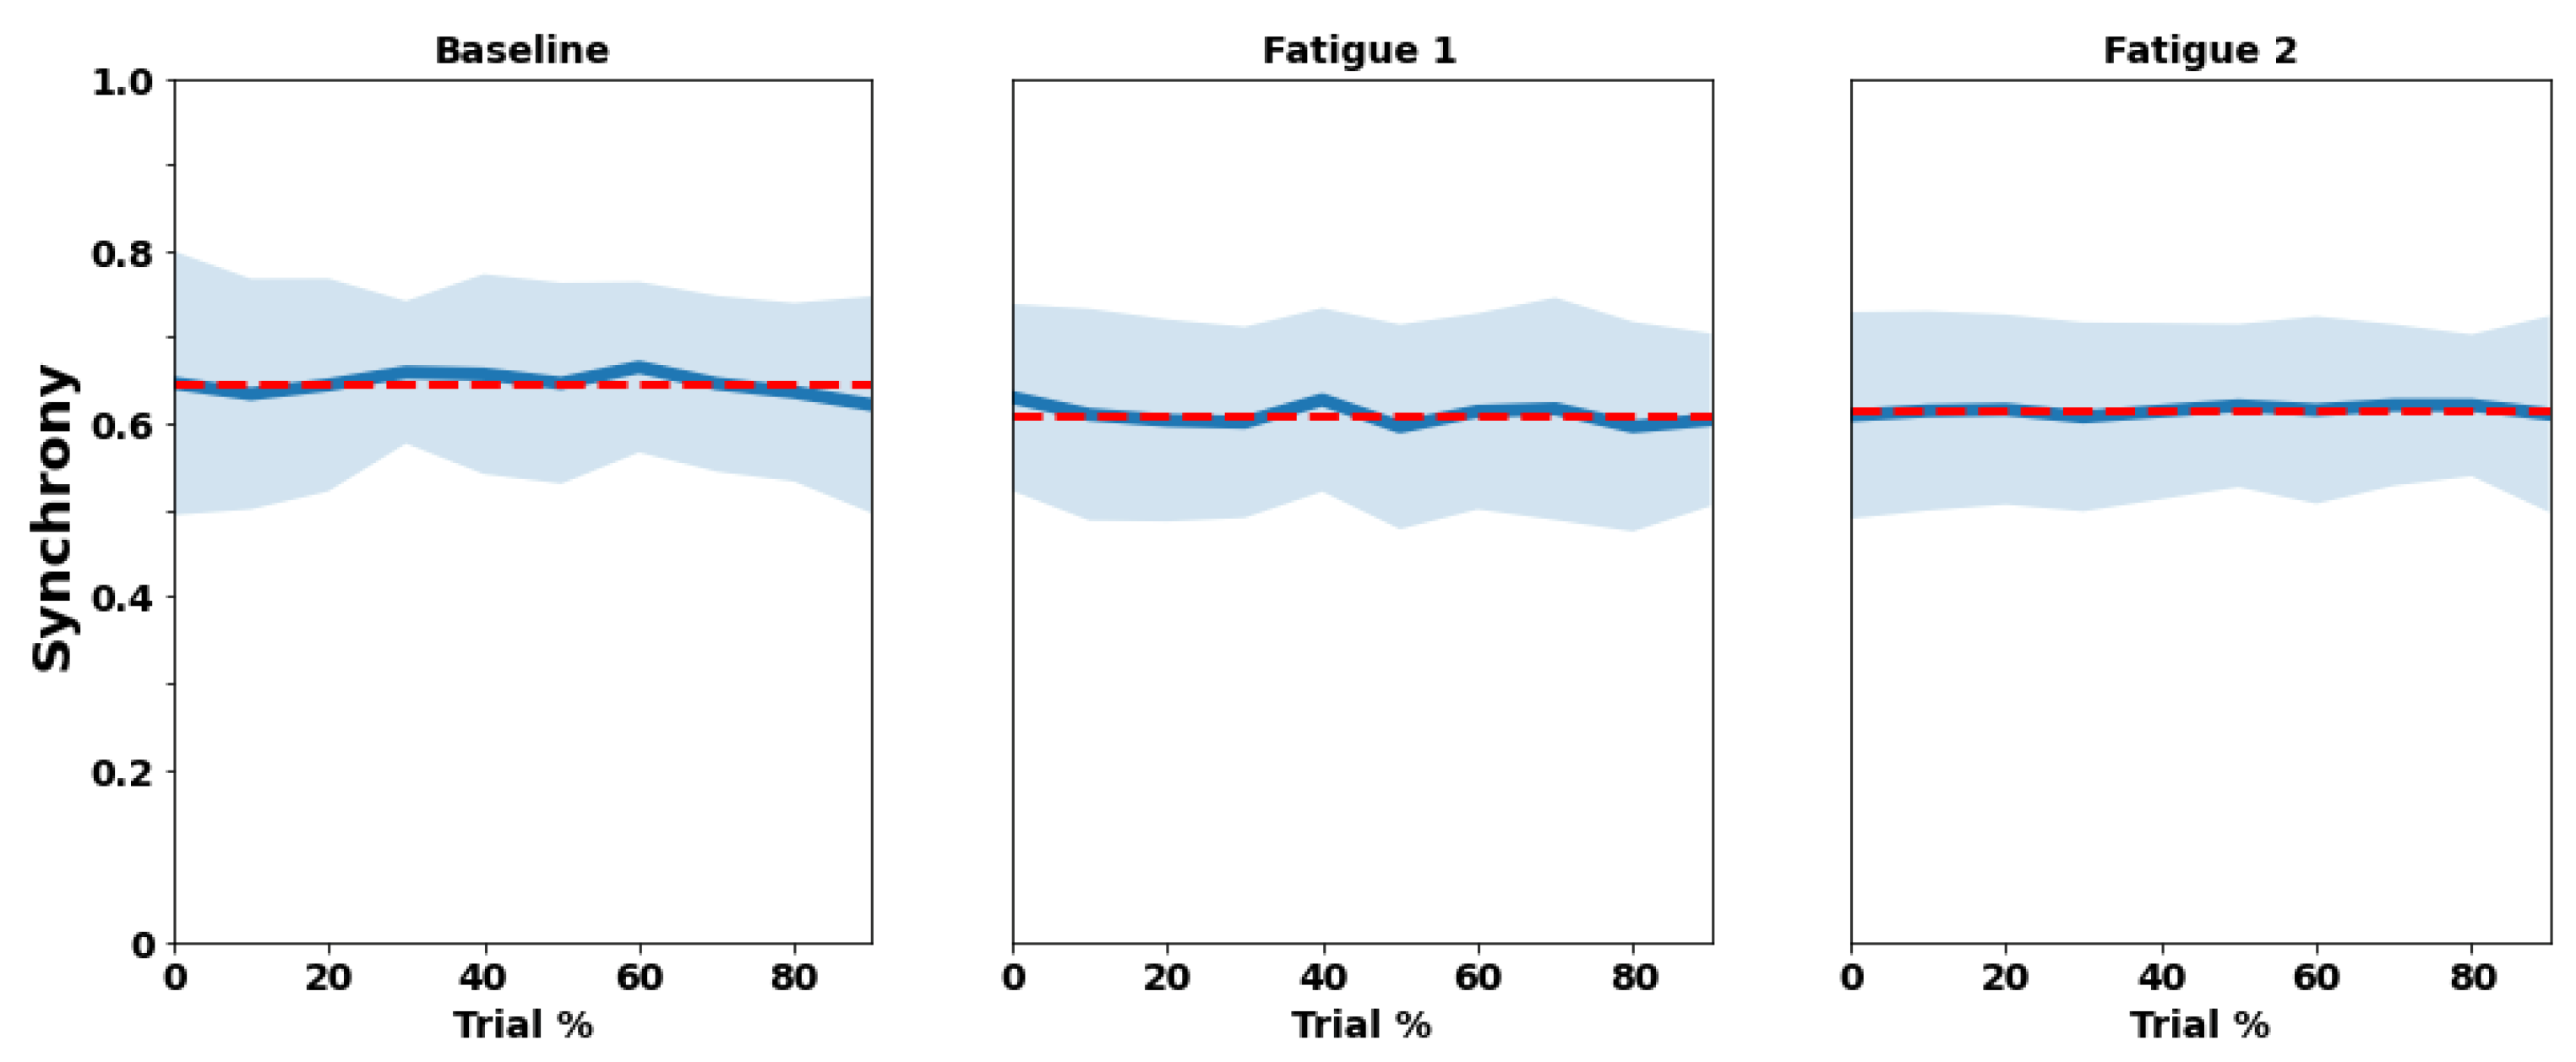
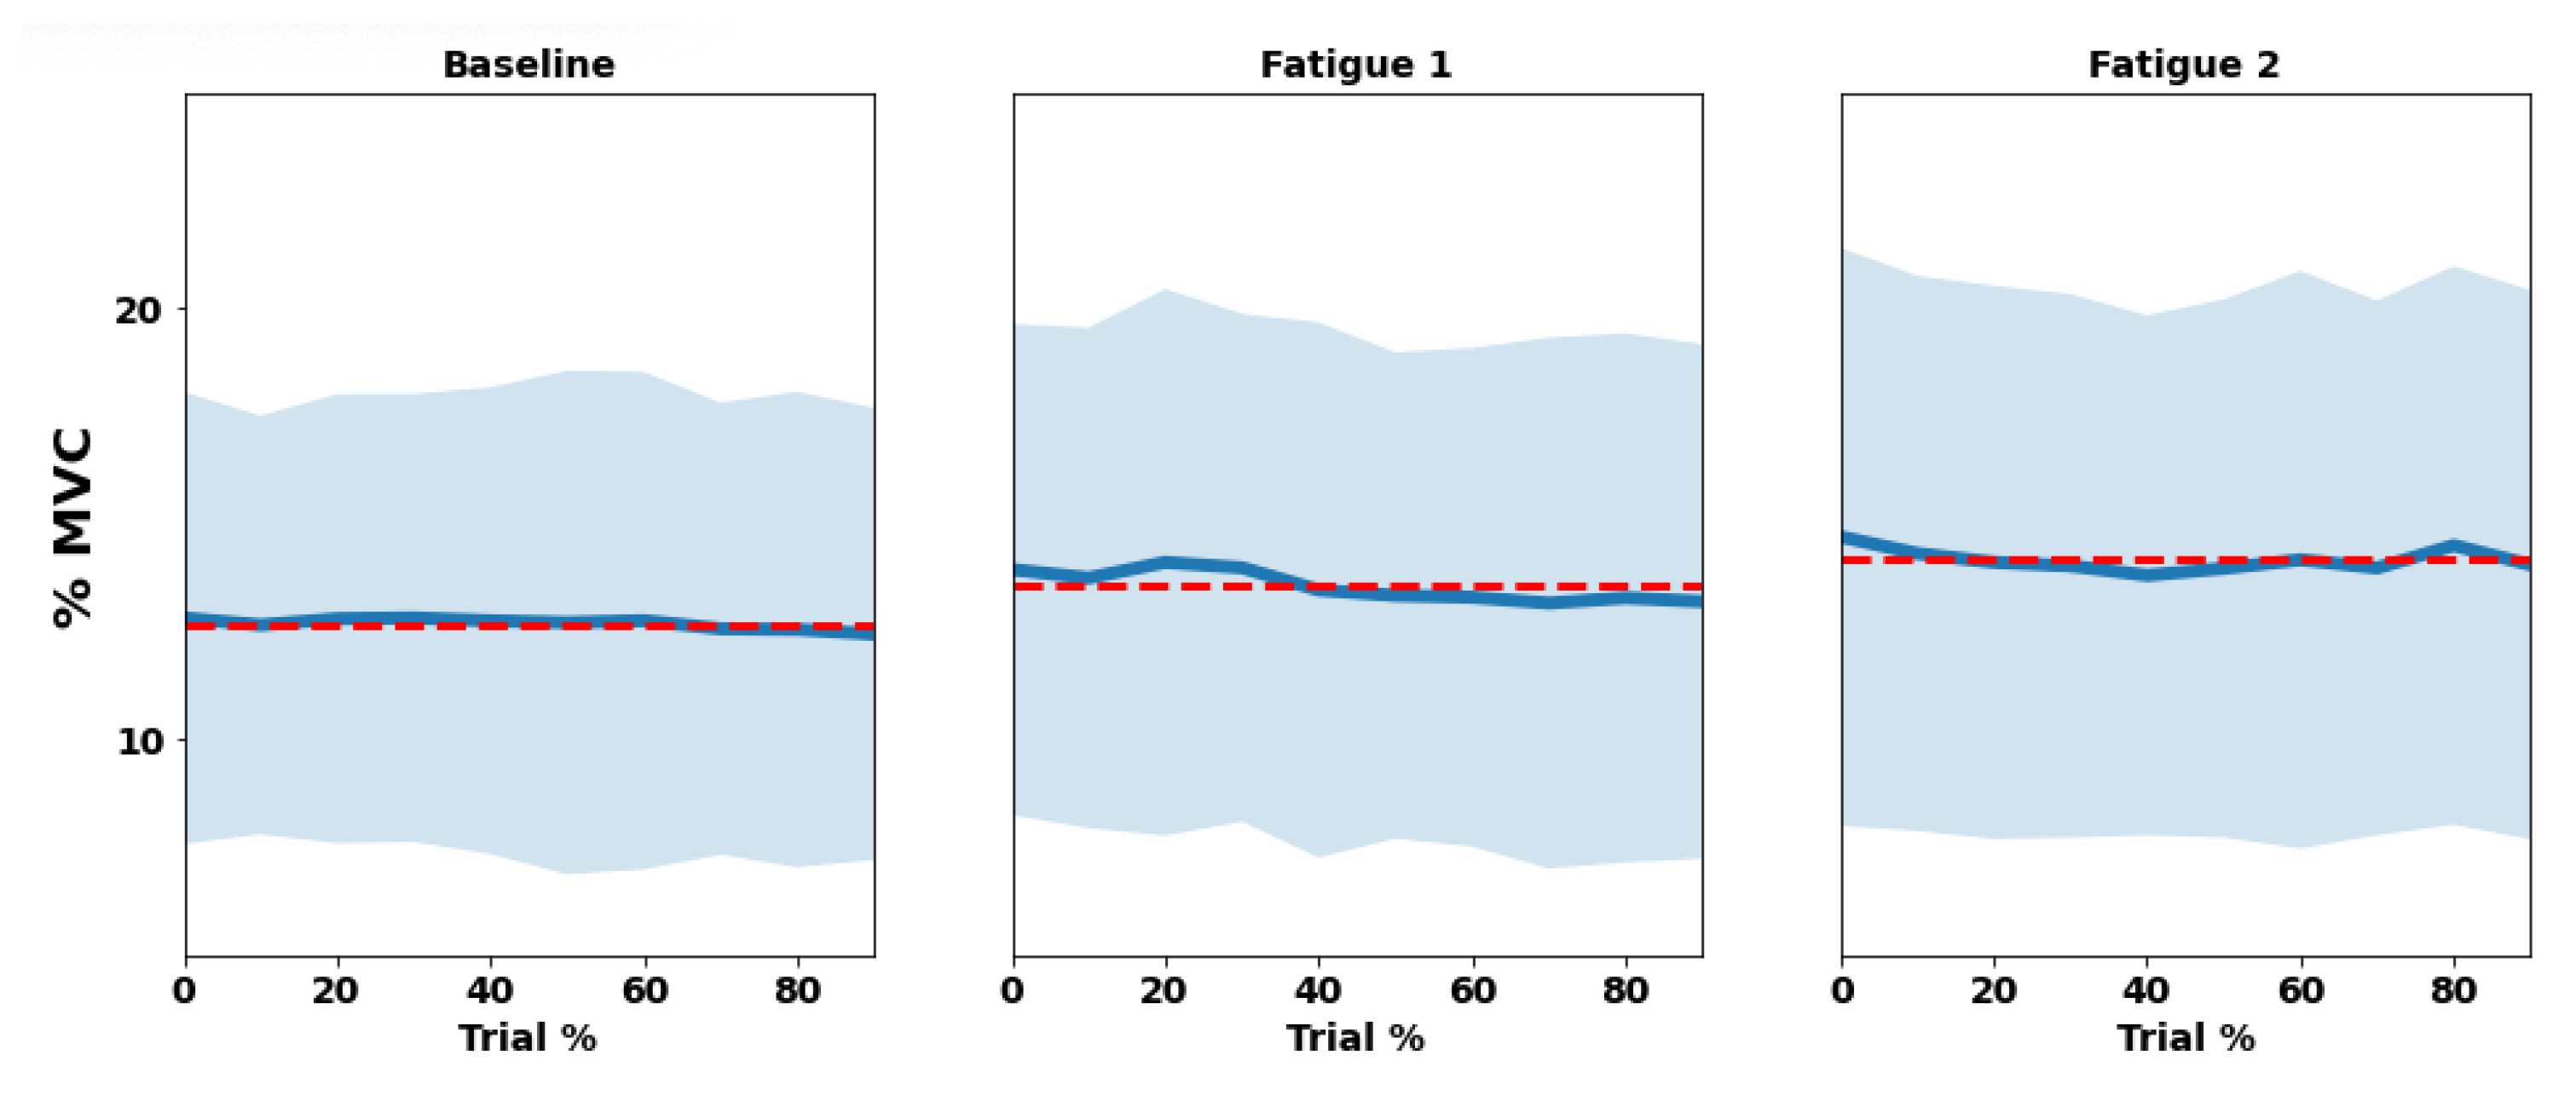
3.1. RIP
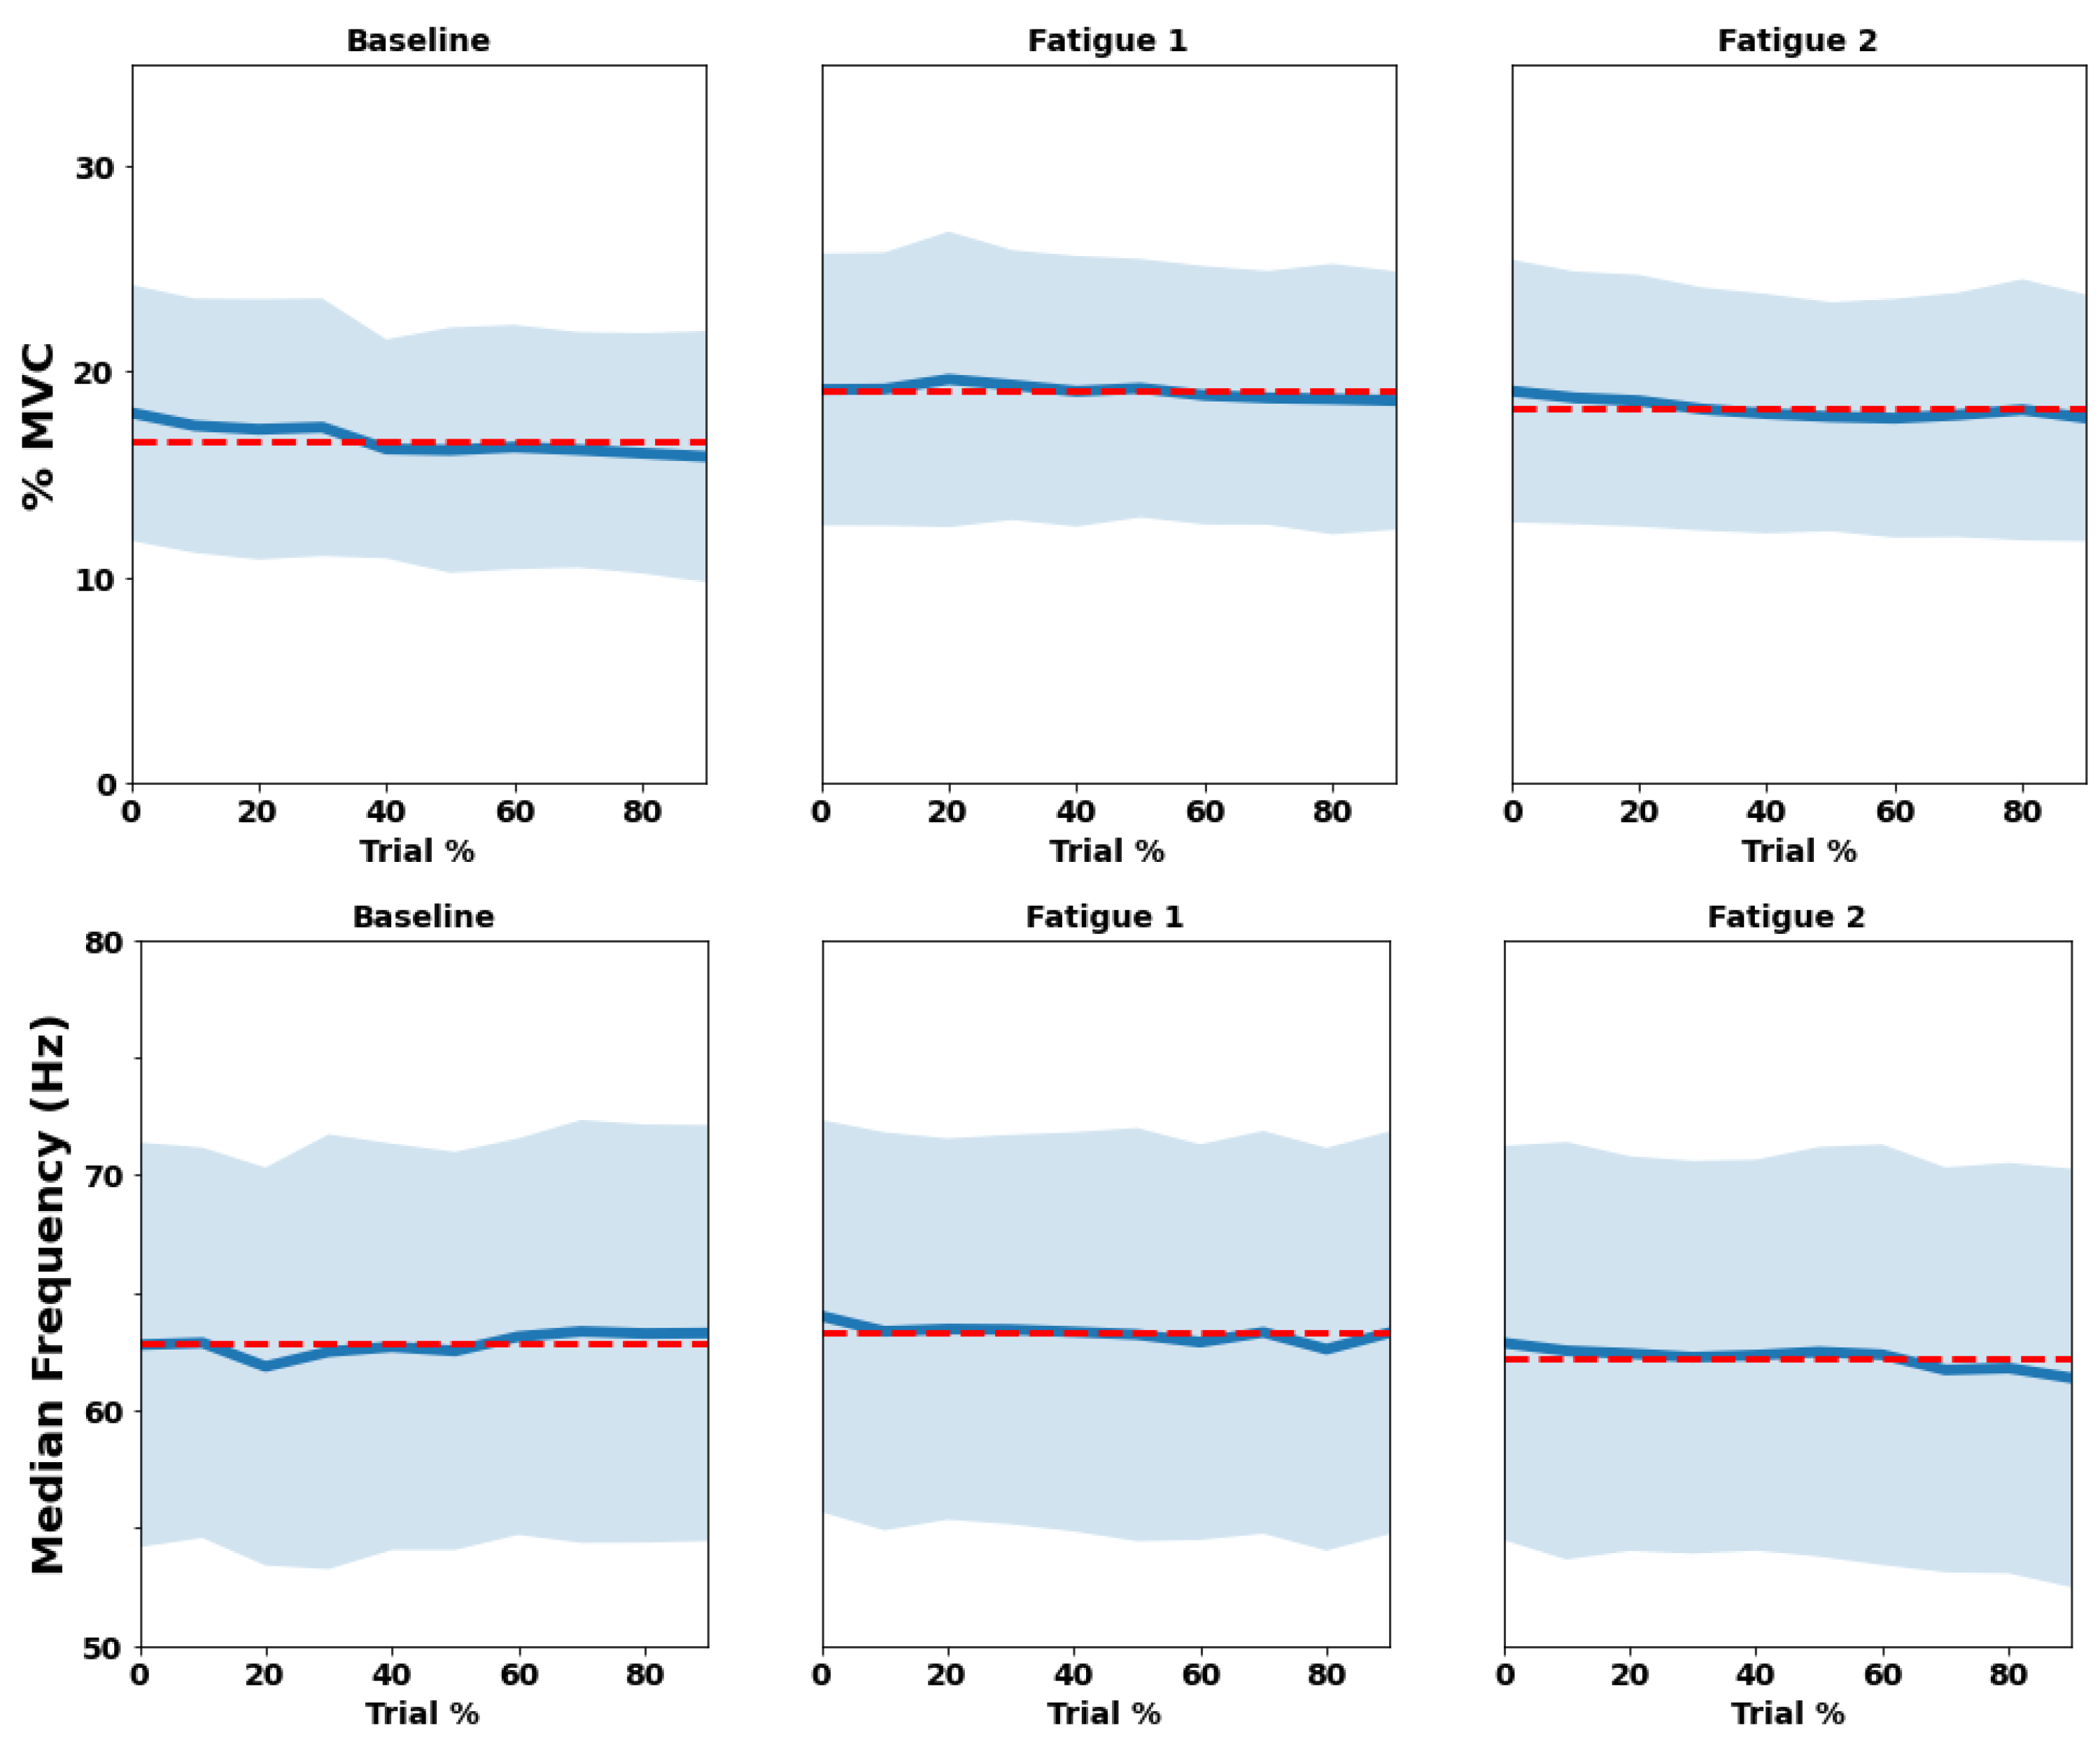
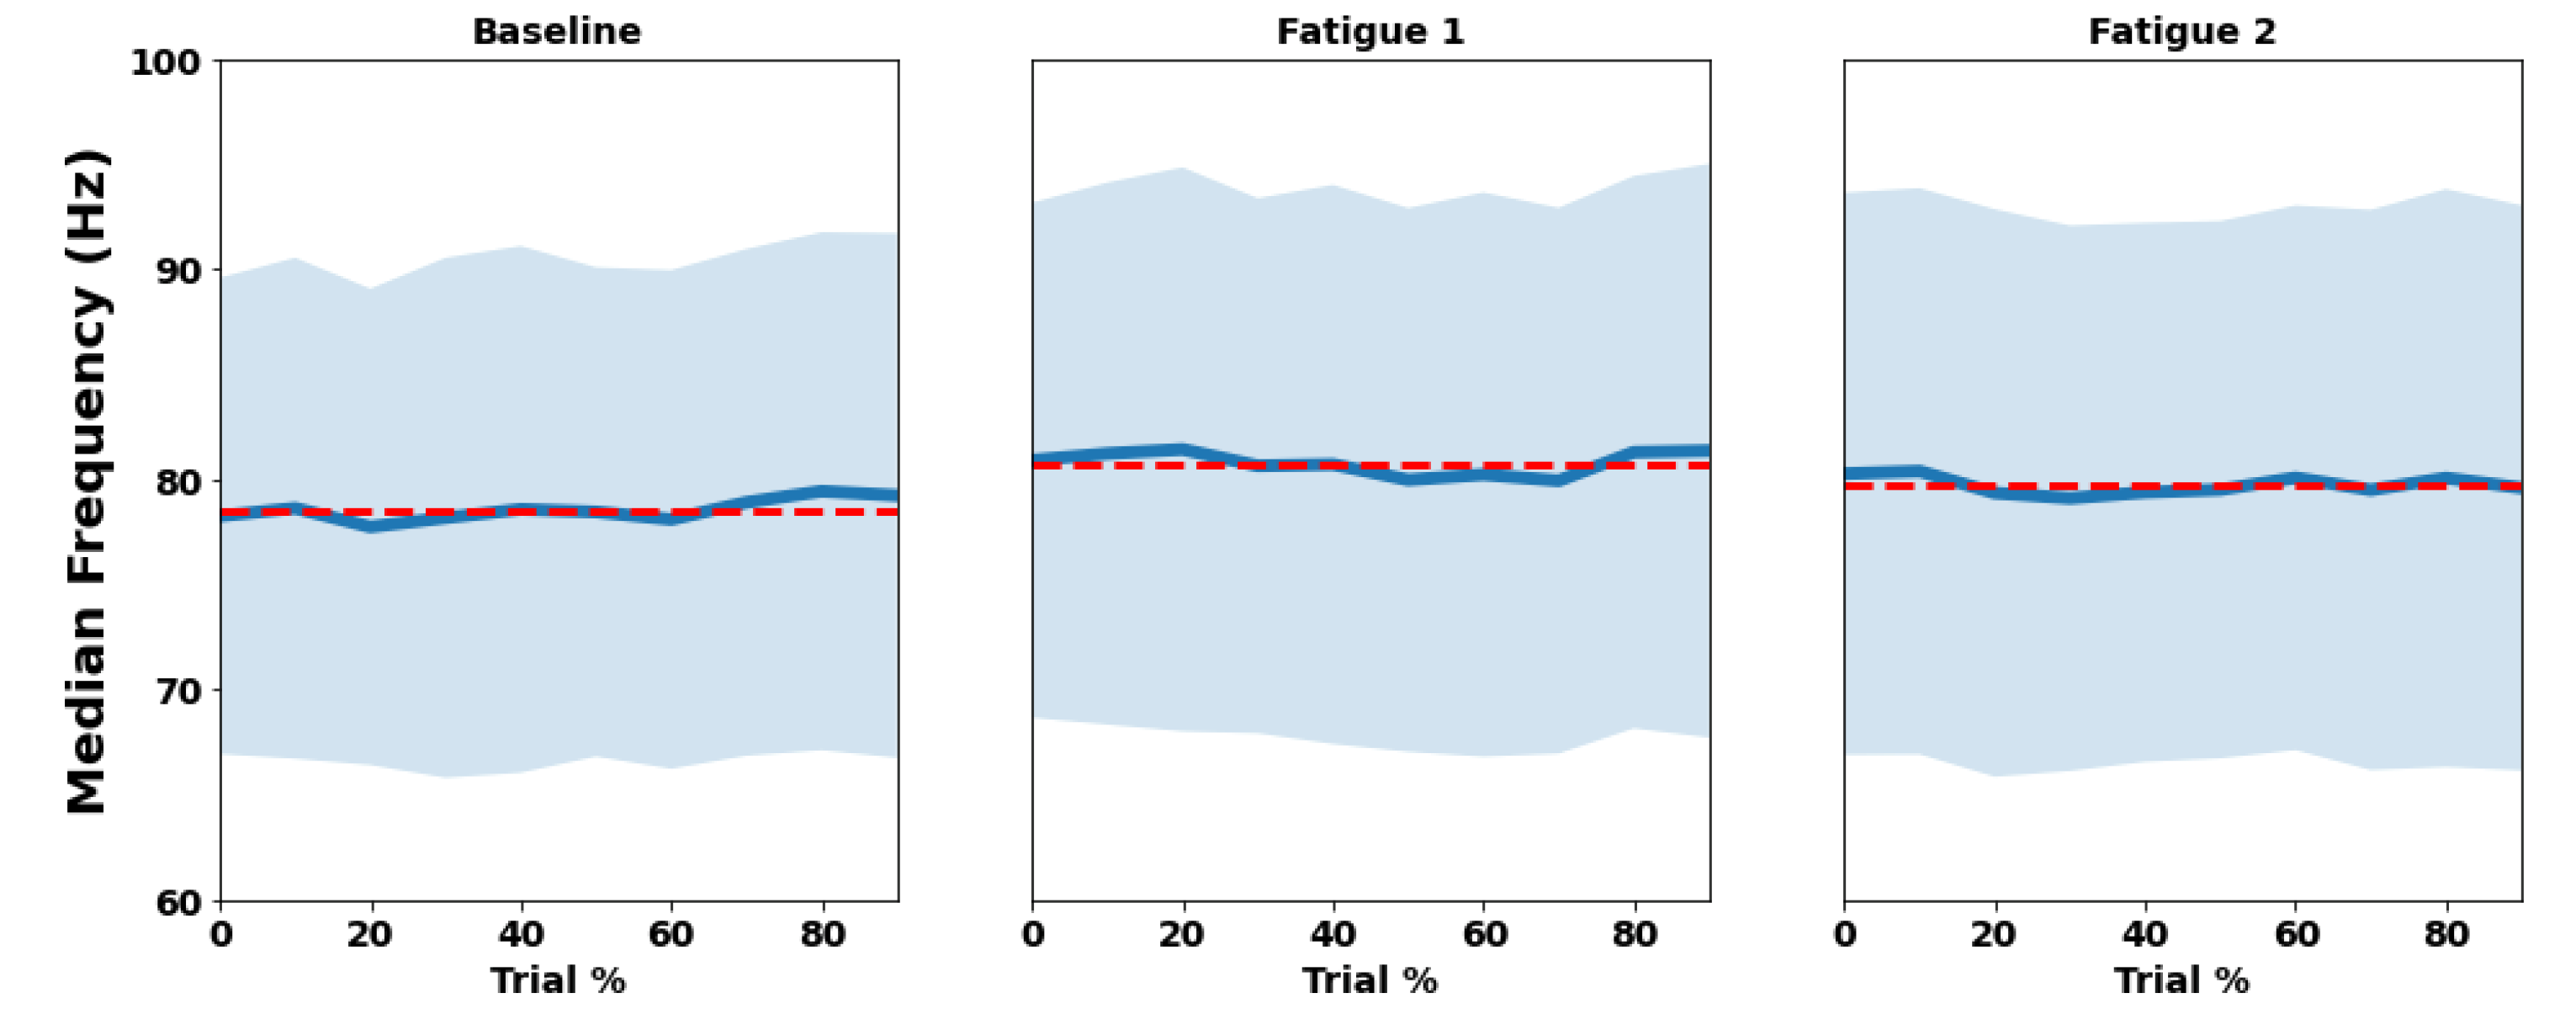
3.2. EMG
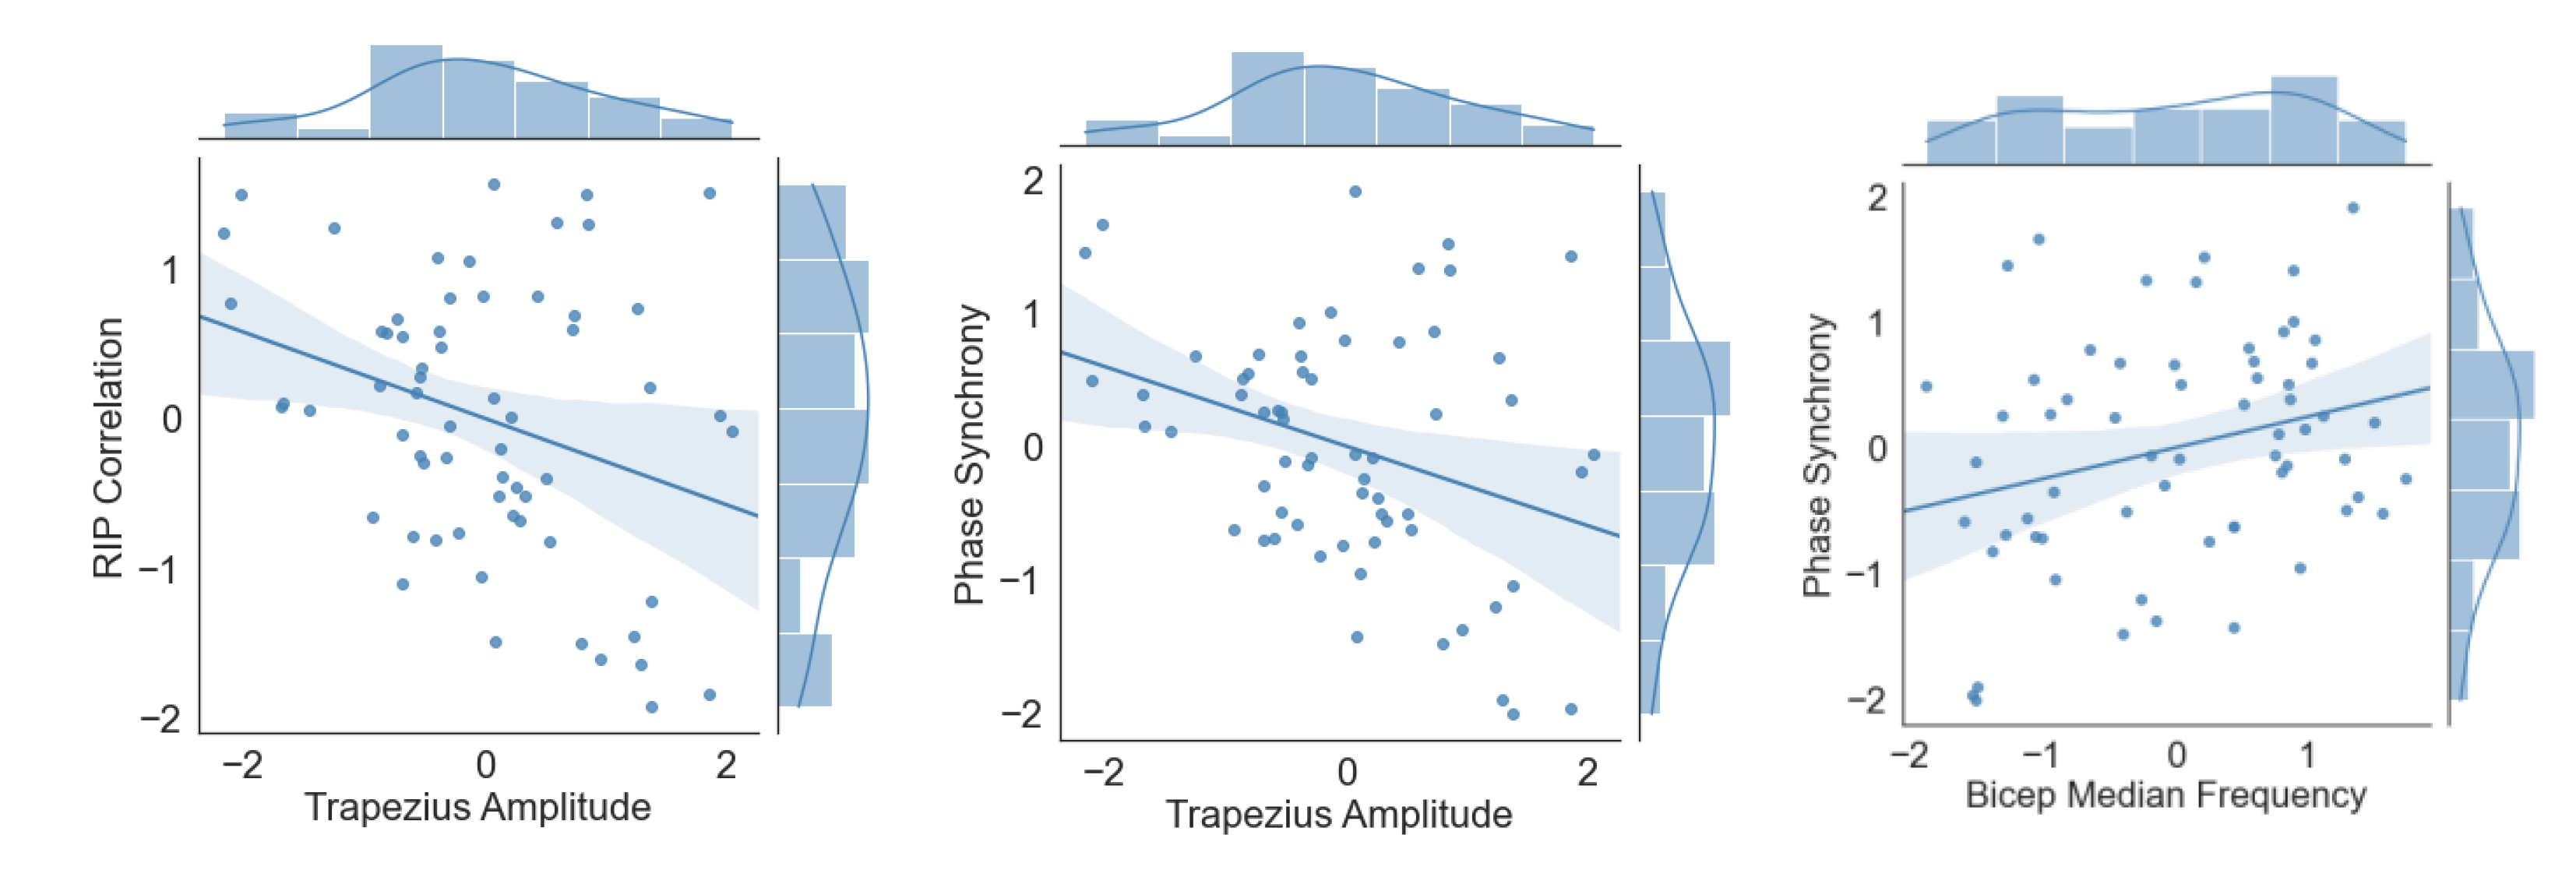
3.3. RIP vs. EMG
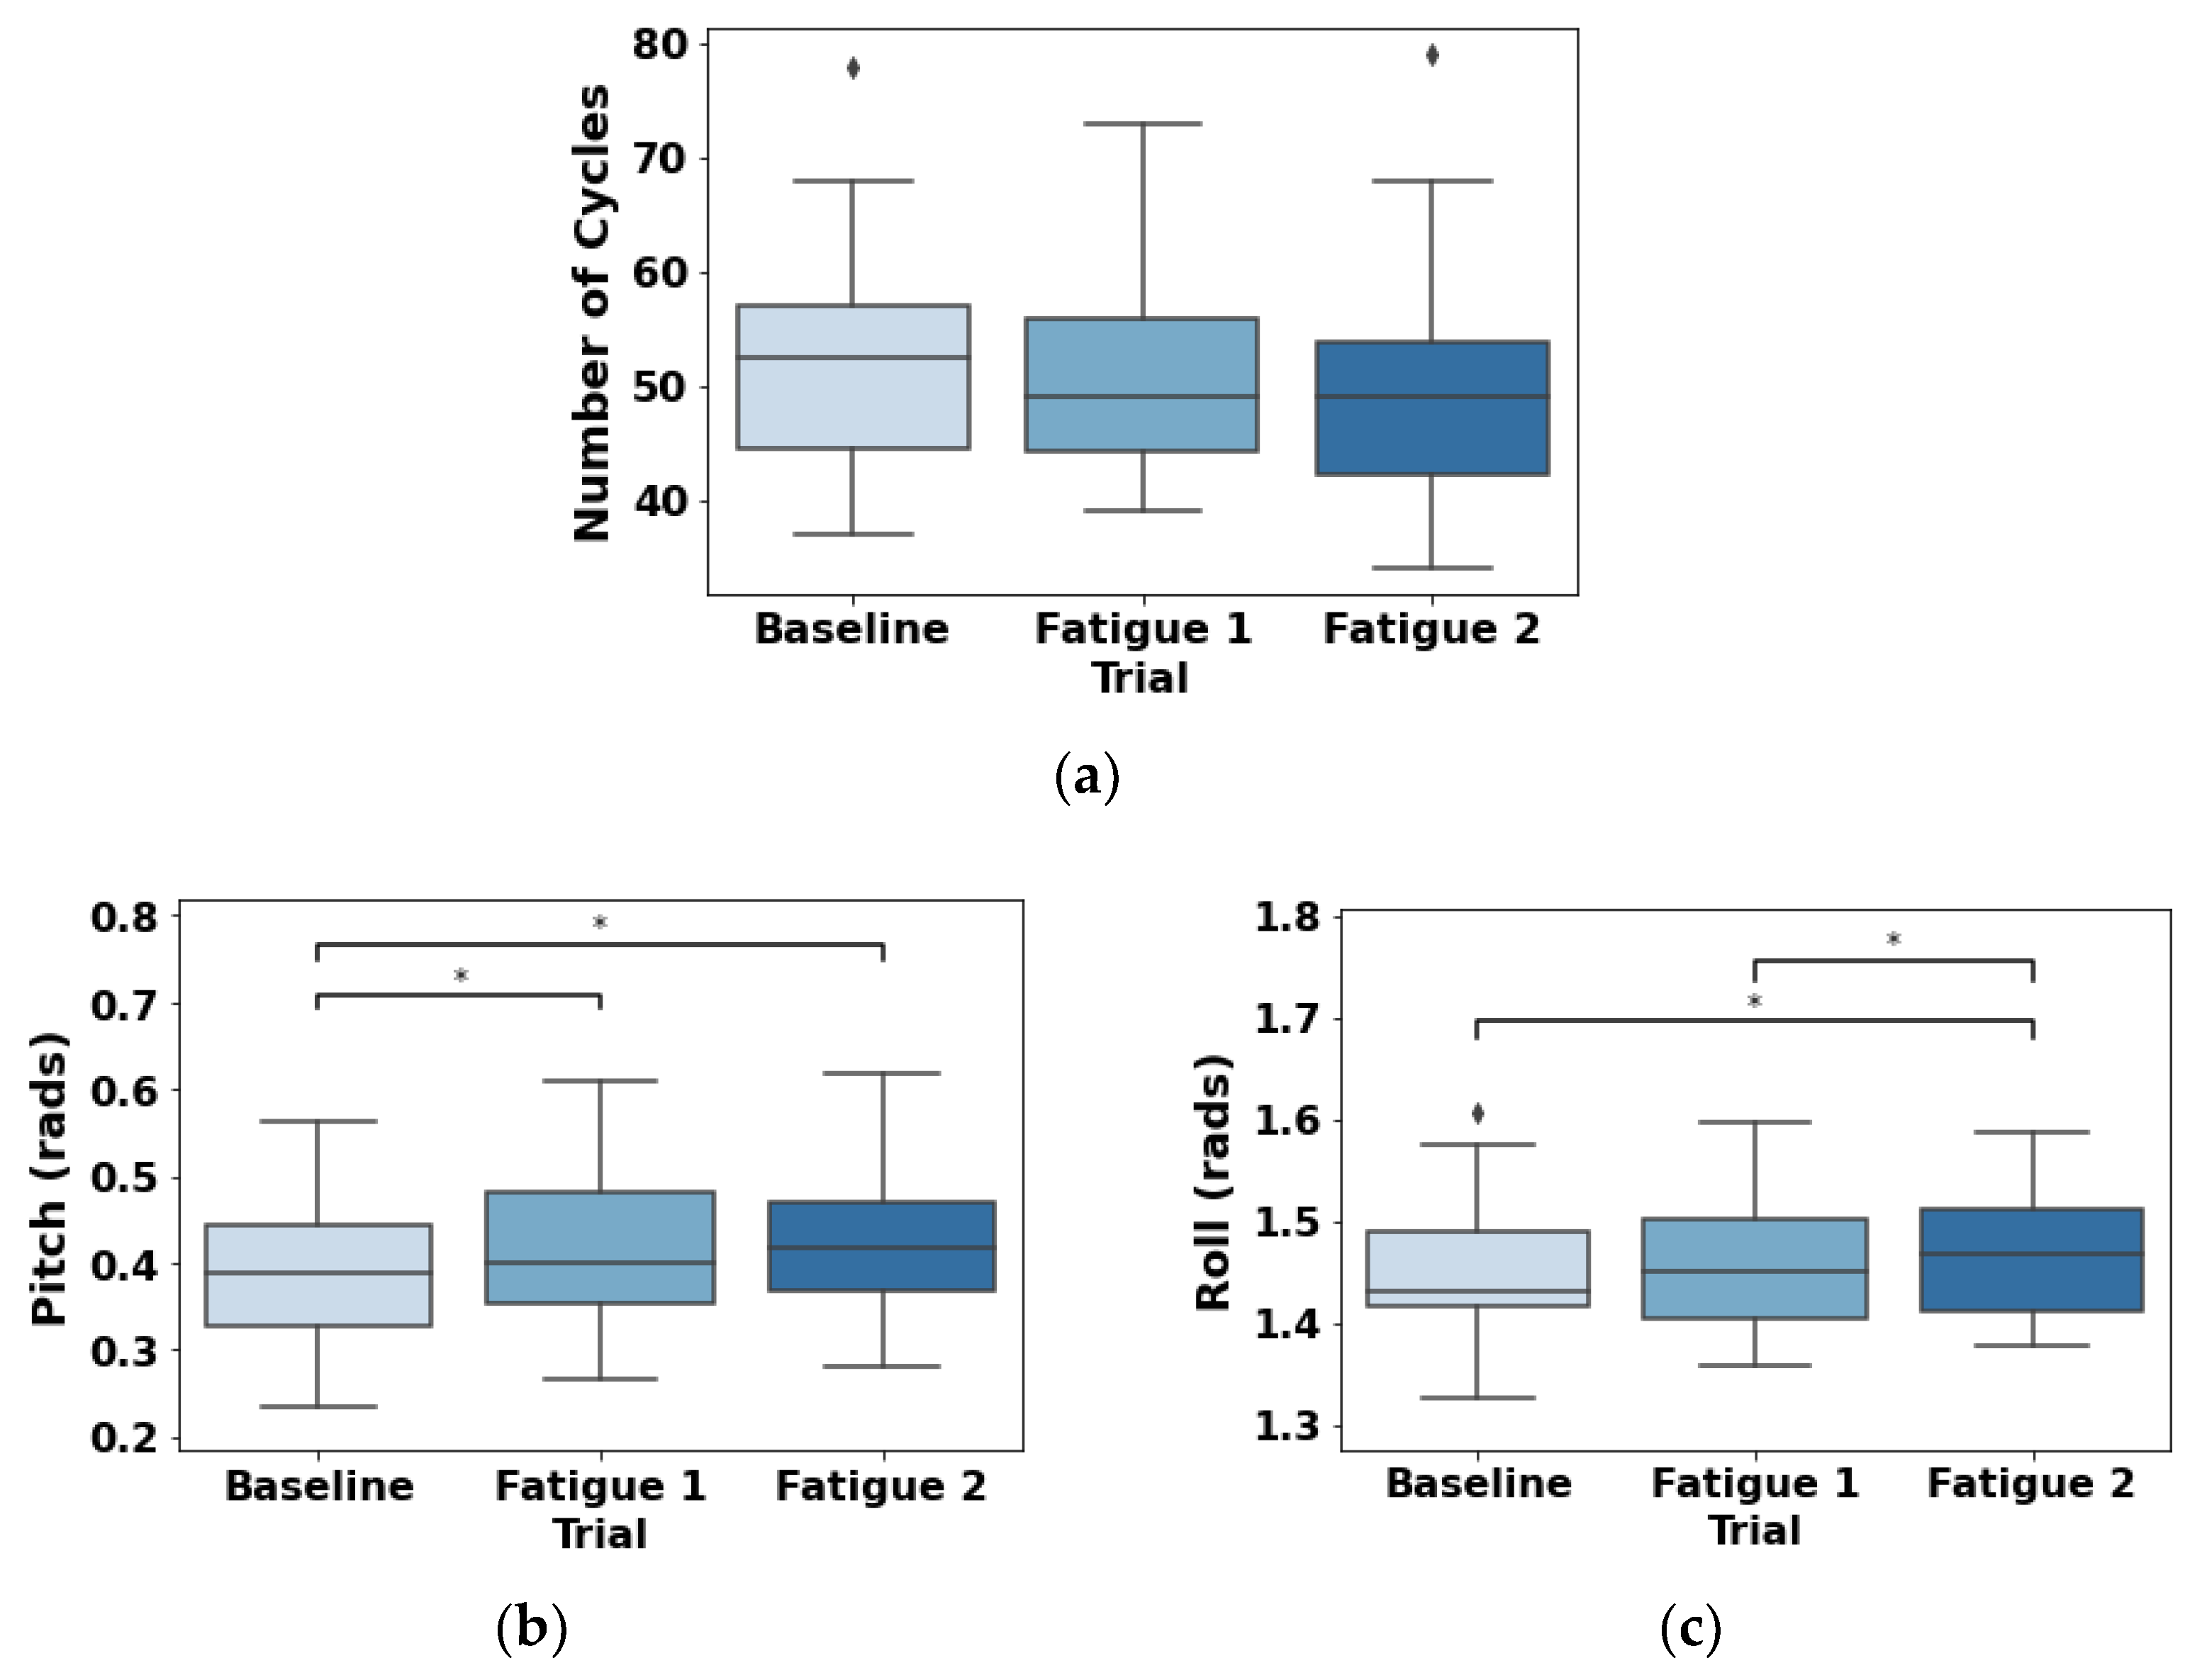
3.4. Accelerometer
4. Discussion
4.1. RIP
4.2. RIP vs. Muscle Activity
4.3. Limitations
4.4. Future Work
5. Conclusions
Author Contributions
Funding
Institutional Review Board Statement
Informed Consent Statement
Acknowledgments
Conflicts of Interest
Abbreviations
| Acronymous | Designation |
| EMG | Electromyography |
| HR | Heart rate |
| MAWT | Maximum acceptable work time |
| MVC | Maximal voluntary contraction |
| RIP | Respiratory inductance plethysmography |
| xyz axes acceleration |
References
- Mulla, D.M.; McDonald, A.C.; Keir, P.J. Joint moment trade-offs across the upper extremity and trunk during repetitive work. Appl. Ergon. 2020, 88, 103142. [Google Scholar] [CrossRef] [PubMed]
- McDonald, A.C.; Keir, P.J. The Response of the Shoulder Complex to Repetitive Work: Implications for Workplace Design. Crit. Rev. Biomed. Eng. 2015, 43, 21–32. [Google Scholar] [CrossRef] [PubMed]
- Santos, J.; Baptista, J.S.; Monteiro, P.R.R.; Miguel, A.S.; Santos, R.; Vaz, M.A. The influence of task design on upper limb muscles fatigue during low-load repetitive work: A systematic review. Int. J. Ind. Ergon. 2016, 52, 78–91. [Google Scholar] [CrossRef] [Green Version]
- Tomei, G.; Cinti, M.E.; Cerratti, D.; Fioravanti, M. Attention, repetitive works, fatigue and stress. Ann. Ig. Med. Prev. Comunita 2006, 18, 417–429. [Google Scholar]
- Bepko, J.; Mansalis, K. Common occupational disorders: Asthma, COPD, dermatitis, and musculoskeletal disorders. Am. Fam. Physician. 2016, 93, 1000–1006. [Google Scholar]
- ILO (International Labour Organization). ILO List of Occupational Diseases. 2010. Available online: https://www.ilo.org/safework/info/publications/WCMS_125137/lang--en/index.htm (accessed on 24 January 2022).
- Eurostat 2020. Available online: https://ec.europa.eu/eurostat/statistics-explained/index.php?title=Hours_of_work_-_annual_statistics#In_2020_more_people_worked_fewer_hours_than_usual (accessed on 8 January 2022).
- Statista 2022. Available online: https://www.statista.com/statistics/215643/average-weekly-working-hours-of-all-employees-in-the-us-by-month/ (accessed on 15 April 2022).
- Messenger, J. Working Time and the Future of Work; ILO Future of Work Research Paper Series; International Labour Organization: Geneva, Switzerland, 2018; pp. 1–35. [Google Scholar]
- Leitão, J.; Pereira, D.; Gonçalves, A. Quality of work life and contribution to productivity: Assessing the moderator effects of burnout syndrome. Int. J. Environ. Res. Public Health 2021, 18, 2425. [Google Scholar] [CrossRef]
- Björklund, M.; Crenshaw, A.G.; Djupsjöbacka, M.; Johansson, H. Position sense acuity is diminished following repetitive low-intensity work to fatigue in a simulated occupational setting. Eur. J. Appl. Physiol. 2000, 81, 361–367. [Google Scholar] [CrossRef]
- Schaub, K.; Caragnano, G.; Britzke, B.; Bruder, R. The European assembly worksheet. Theor. Issues Ergon. Sci. 2013, 14, 616–639. [Google Scholar] [CrossRef]
- Hignett, S.; McAtamney, L. Rapid Entire Body Assessment (REBA). Appl. Ergon. 2000, 31, 201–205. [Google Scholar] [CrossRef]
- Joshi, M.; Deshpande, V. Investigative study and sensitivity analysis of Rapid Entire Body Assessment (REBA). Int. J. Ind. Ergon. 2020, 79, 103004. [Google Scholar] [CrossRef]
- Koshy, K.; Syed, H.; Luckiewicz, A.; Alsoof, D.; Koshy, G.; Harry, L. Interventions to improve ergonomics in the operating theatre: A systematic review of ergonomics training and intra-operative microbreaks. Ann. Med. Surg. 2020, 55, 135–142. [Google Scholar] [CrossRef]
- Radwan, A.; Barnes, L.; DeResh, R.; Englund, C.; Gribanoff, S. Effects of active microbreaks on the physical and mental well-being of office workers: A systematic review. Cogent Eng. 2022, 9, 2026206. [Google Scholar] [CrossRef]
- Ren, X.; Yu, B.; Lu, Y.; Zhang, B.; Hu, J.; Brombacher, A. LightSit: An unobtrusive health-promoting system for relaxation and fitness microbreaks at work. Sensors 2019, 19, 2162. [Google Scholar] [CrossRef] [PubMed] [Green Version]
- Romero, D.; Stahre, J.; Taisch, M. The Operator 4.0: Towards socially sustainable factories of the future. Comput. Ind. Eng. 2020, 139, 106128. [Google Scholar] [CrossRef]
- El ahrache, K.; Imbeau, D.; Farbos, B. Percentile values for determining maximum endurance times for static muscular work. Int. J. Ind. Ergon. 2006, 36, 99–108. [Google Scholar] [CrossRef]
- Aryal, A.; Ghahramani, A.; Becerik-Gerber, B. Monitoring fatigue in construction workers using physiological measurements. Autom. Constr. 2017, 82, 154–165. [Google Scholar] [CrossRef]
- Sadat-Mohammadi, M.; Shakerian, S.; Liu, Y.; Asadi, S.; Jebelli, H. Non-invasive physical demand assessment using wearable respiration sensor and random forest classifier. J. Build. Eng. 2021, 44, 103279. [Google Scholar] [CrossRef]
- Sun, S.; Zheng, X.; Gong, B.; Garcia Paredes, J.; Ordieres-Meré, J. Healthy operator 4.0: A human cyber–physical system architecture for smart workplaces. Sensors 2020, 20, 2011. [Google Scholar] [CrossRef] [Green Version]
- Romero, D.; Stahre, J.; Wuest, T.; Noran, O.; Bernus, P.; Fast-Berglund, Å.; Gorecky, D. Towards an operator 4.0 typology: A human-centric perspective on the fourth industrial revolution technologies. In Proceedings of the International Conference on Computers and Industrial Engineering, Tianjin, China, 29–31 October 2016. [Google Scholar]
- Looze, M.D.; Bosch, T.; Dieën, J.V. Manifestations of shoulder fatigue in prolonged activities involving low-force contractions. Ergonomics 2009, 52, 428–437. [Google Scholar] [CrossRef]
- Henning, R.A.; Sauter, S.L.; Krieg, E.F. Work rhythm and physiological rhythms in repetitive computer work: Effects of synchronization on well-being. Int. J. Hum.-Comput. Interact. 1992, 4, 233–243. [Google Scholar] [CrossRef]
- Schleifer, L.M.; Ley, R.; Spalding, T.W. A hyperventilation theory of job stress and musculoskeletal disorders. Am. J. Ind. Med. 2002, 41, 420–432. [Google Scholar] [CrossRef] [PubMed]
- Toledo-Pérez, D.C.; Rodríguez-Reséndiz, J.; Gómez-Loenzo, R.A.; Jauregui-Correa, J.C. A study of computing zero-crossing methods and an improved proposal for EMG signals. Appl. Sci. 2019, 9, 4402. [Google Scholar] [CrossRef] [Green Version]
- Dennerlein, J.T.; Ciriello, V.M.; Kerin, K.J.; Johnson, P.W. Fatigue in the forearm resulting from low-level repetitive ulnar deviation. AIHA J. 2003, 64, 799–805. [Google Scholar] [CrossRef]
- Dahlqvist, C.; Enquist, H.; Löfqvist, L.; Nordander, C. The effect of two types of maximal voluntary contraction and two electrode positions in field recordings of forearm extensor muscle activity during hotel room cleaning. Int. J. Occup. Saf. 2020, 26, 595–602. [Google Scholar] [CrossRef]
- Bosch, T.; De Looze, M.P.; Kingma, I.; Visser, B.; Van Dieen, J.H. Electromyographical manifestations of muscle fatigue during different levels of simulated light manual assembly work. J. Electromyogr. Kinesiol. 2009, 19, e246–e256. [Google Scholar] [CrossRef]
- Hagberg, M. The amplitude distribution of surface EMG in static and intermittent static muscular performance. Eur. J. Appl. Physiol. Occup. Physiol. 1979, 40, 265–272. [Google Scholar] [CrossRef]
- Carnide, F.; Veloso, A.; Gamboa, H.; Caldeira, S.; Fragoso, I. Interaction of biomechanical and morphological factors on shoulder workload in industrial paint work. Clin. Biomech. 2006, 21, S33–S38. [Google Scholar] [CrossRef]
- Village, J.; Trask, C. Ergonomic analysis of postural and muscular loads to diagnostic sonographers. Int. J. Ind. Ergon. 2007, 37, 781–789. [Google Scholar] [CrossRef]
- Sundelin, G. Patterns of electromyographic shoulder muscle fatigue during MTM-paced repetitive arm work with and without pauses. Int. Arch. Occup. Environ. Health 1993, 64, 485–493. [Google Scholar] [CrossRef]
- Yu, N.; Hong, L.; Guo, J. Analysis of upper-limb muscle fatigue in the process of rotary handling. Int. J. Ind. Ergon. 2021, 83, 103109. [Google Scholar] [CrossRef]
- Tuček, D.; Dombeková, B. Local Muscular Load Measurement with the Help of a Datalogger. Acta Polytech. Hung. 2017, 14, 215–234. [Google Scholar]
- Lee, S.J.; Moon, M.K.; Choi, W.J.; Jang, T.W. Exercise and cardiovascular load in workers with high occupational physical activity. Arch. Environ. Occup. Health 2020, 75, 339–345. [Google Scholar] [CrossRef] [PubMed]
- Preisser, A.M.; Zhou, L.; Garrido, M.V.; Harth, V. Measured by the oxygen uptake in the field, the work of refuse collectors is particularly hard work: Are the limit values for physical endurance workload too low? Int. Arch. Occup. Environ. Health 2016, 89, 211–220. [Google Scholar] [CrossRef] [PubMed] [Green Version]
- Hjelm, E.W.; Winkel, J.; Nygård, C.H.; Wiktorin, C.; Karlqvist, L. Can cardiovascular load in ergonomic epidemiology be estimated by self-report? Stockholm MUSIC 1 Study Group. J. Occup. Environ. Med. 1995, 37, 1210–1217. [Google Scholar] [CrossRef]
- Lunde, L.K.; Koch, M.; Veiersted, K.B.; Moen, G.H.; Wærsted, M.; Knardahl, S. Heavy physical work: Cardiovascular load in male construction workers. Int. J. Environ. Res. Public Health 2016, 13, 356. [Google Scholar] [CrossRef] [Green Version]
- Wu, H.C.; Wang, M.J.J. Relationship between maximum acceptable work time and physical workload. Ergonomics 2002, 45, 280–289. [Google Scholar] [CrossRef]
- Hammer, J.; Newth, C.J.L. Assessment of thoraco-abdominal asynchrony. Paediatr. Respir. Rev. 2009, 10, 75–80. [Google Scholar] [CrossRef]
- Epstein, S.K. An overview of respiratory muscle function. Clin. Chest Med. 1994, 15, 619–639. [Google Scholar] [CrossRef]
- Wixted, F.; O’Riordan, C.; O’Sullivan, L. Inhibiting the physiological stress effects of a sustained attention task on shoulder muscle activity. Int. J. Environ. Res. Public Health 2018, 15, 115. [Google Scholar] [CrossRef] [Green Version]
- Strang, A.; Ryan, L.; Rahman, T.; Balasubramanian, S.; Hossain, J.; Heinle, R.; Shaffer, T.H. Measures of respiratory inductance plethysmography (RIP) in children with neuromuscular disease. Pediatr. Pulmonol. 2018, 53, 1260–1268. [Google Scholar] [CrossRef]
- Mehta, R.K.; Peres, S.C.; Kannan, P.; Rhee, J.; Shortz, A.E.; Mannan, M.S. Comparison of objective and subjective operator fatigue assessment methods in offshore shiftwork. J. Loss Prev. Process Ind. 2017, 48, 376–381. [Google Scholar] [CrossRef]
- Atkins, J.H.; Mandel, J.E.; Weinstein, G.S.; Mirza, N. A pilot study of respiratory inductance plethysmography as a safe, noninvasive detector of jet ventilation under general anesthesia. Anesth. Analg. 2010, 111, 1168–1175. [Google Scholar] [CrossRef] [PubMed]
- Mannée, D.; Van Helvoort, H.; De Jongh, F. The feasibility of measuring lung hyperinflation with a smart shirt: An in vitro study. IEEE Sens. J. 2020, 20, 15154–15162. [Google Scholar] [CrossRef]
- Chen, Y.C.; Hsiao, T.C. Instantaneous phase difference analysis between thoracic and abdominal movement signals based on complementary ensemble empirical mode decomposition. Biomed. Eng. Online 2016, 15, 1–21. [Google Scholar] [CrossRef] [PubMed] [Green Version]
- Deering, R.; Kaiser, J.F. The use of a masking signal to improve empirical mode decomposition. In Proceedings of the IEEE International Conference on Acoustics, Speech, and Signal Processing, Philadelphia, PA, USA, 23 March 2005. [Google Scholar]
- Tsai, F.F.; Fan, S.Z.; Lin, Y.S.; Huang, N.E.; Yeh, J.R. Investigating power density and the degree of nonlinearity in intrinsic components of anesthesia EEG by the Hilbert-Huang transform: An example using ketamine and alfentanil. PLoS ONE 2016, 11, e0168108. [Google Scholar]
- Fabus, M.S.; Quinn, A.J.; Warnaby, C.E.; Woolrich, M.W. Automatic decomposition of electrophysiological data into distinct nonsinusoidal oscillatory modes. J. Neurophysiol. 2021, 126, 1670–1684. [Google Scholar] [CrossRef]
- Kak, S.C. The discrete Hilbert transform. Proc. IEEE 1970, 58, 585–586. [Google Scholar] [CrossRef]
- Hermens, H.J.; Freriks, B.; Disselhorst-Klug, C.; Rau, G. Development of recommendations for SEMG sensors and sensor placement procedures. J. Electromyogr. Kinesiol. 2000, 10, 361–374. [Google Scholar] [CrossRef]
- Seabold, S.; Perktold, J. Statsmodels: Econometric and statistical modeling with python. In Proceedings of the 9th Python in Science Conference, Austin, TX, USA, 28 June–3 July 2010. [Google Scholar]
- Yeo, I.-K.; Johnson, R.A. A New Family of Power Transformations to Improve Normality or Symmetry. Biometrika 2000, 87, 954–959. [Google Scholar] [CrossRef]
- Vallat, R. Pingouin: Statistics in Python. J. Open Source Softw. 2018, 3, 1026. [Google Scholar] [CrossRef]
- Weiner, P.; Suo, J.; Fernandez, E.; Cherniack, R.M. Efficiency of the Respiratory Muscles in Healthy Individuals. Am. Rev. Respir. Dis. 1989, 140, 2–396. [Google Scholar] [CrossRef] [PubMed]
- Roussos, C.; Koutsoukou, A. Respiratory failure. Eur. Respir. J. 2003, 22, 3s–14s. [Google Scholar] [CrossRef] [PubMed] [Green Version]
- Depiazzi, J.; Everard, M.L. Dysfunctional breathing and reaching one’s physiological limit as causes of exercise-induced dyspnoea. Breathe 2016, 12, 120–129. [Google Scholar] [CrossRef] [PubMed] [Green Version]
- Ratnagiri, M.V.; Zhu, Y.; Rahman, T.; Theroux, M.; Tomatsu, S.; Shaffer, T.H. Automated Assessment of Thoracic-Abdominal Asynchrony in Patients with Morquio Syndrome. Diagnostics 2021, 11, 880. [Google Scholar] [CrossRef] [PubMed]
- Ryan, L.; Rahman, T.; Strang, A.; Heinle, R.; Shaffer, T.H. Diagnostic differences in respiratory breathing patterns and work of breathing indices in children with Duchenne muscular dystrophy. PLoS ONE 2020, 15, e0226980. [Google Scholar] [CrossRef] [PubMed] [Green Version]
- Mccool, F.D.; Hilbert, J.; Wolfe, L.F.; Benditt, J.O. The respiratory system and neuromuscular diseases. In Murray and Nadel’s Textbook of Respiratory Medicine; Elsevier: Philadelphia, PA, USA, 2022; pp. 1812–1828.e5. [Google Scholar]
- Praud, J.P.; Redding, G.J. Chest wall and respiratory muscle disorders. In Kendig’s Disorders of the Respiratory Tract in Children; Elsevier: Amsterdam, The Netherlands, 2019; pp. 1044–1061.e2. [Google Scholar] [CrossRef]
- Roussos, C.; Zakynthinos, S. Fatigue of the respiratory muscles. Intensive Care Med. 1996, 22, 134–155. [Google Scholar] [CrossRef]
- Fregonezi, G.; Sarmento, A.; Pinto, J.; LoMauro, A.; Resqueti, V.; Aliverti, A. Thoracoabdominal asynchrony contributes to exercise limitation in mild asthmatic subjects. Front. Physiol. 2018, 9, 719. [Google Scholar] [CrossRef]
- Carroll, T.J.; Taylor, J.L.; Gandevia, S.C. Recovery of central and peripheral neuromuscular fatigue after exercise. J. Appl. Physiol. 2017, 122, 1068–1076. [Google Scholar] [CrossRef] [Green Version]
- Davis, J.M. Central and peripheral factors in fatigue. J. Sports Sci. 1995, 13, S49–S53. [Google Scholar] [CrossRef]
- Meeusen, R.; Watson, P.; Hasegawa, H.; Roelands, B.; Piacentini, M.F. Central fatigue. Sports Med. 2006, 36, 881–909. [Google Scholar] [CrossRef]
- Finsterer, J. Biomarkers of peripheral muscle fatigue during exercise. BMC Musculoskelet. Disord. 2021, 13, 1–13. [Google Scholar] [CrossRef] [PubMed] [Green Version]
- Lowery, M.M.; Vaughan, C.L.; Nolan, P.J.; O’Malley, M.J. Spectral compression of the electromyographic signal due to decreasing muscle fiber conduction velocity. IEEE Trans. Neural Syst. Rehabil. Eng. 2000, 8, 353–361. [Google Scholar] [CrossRef] [PubMed]
- De Luca, C.J. The use of surface electromyography in biomechanics. J. Appl. Biomech. 1997, 13, 135–163. [Google Scholar] [CrossRef] [Green Version]
- Christensen, H. Muscle activity and fatigue in the shoulder muscles during repetitive work. Eur. J. Appl. Physiol. 1986, 54, 596–601. [Google Scholar] [CrossRef]
- McDonald, A.C.; Calvin, T.F.; Keir, P.J. Adaptations to isolated shoulder fatigue during simulated repetitive work. Part II: Recovery. J. Electromyogr. Kinesiol. 2016, 29, 42–49. [Google Scholar] [CrossRef]
- Bonato, P.; Ebenbichler, G.R.; Roy, S.H.; Lehr, S.; Posch, M.; Kollmitzer, J.; Della Croce, U. Muscle fatigue and fatigue-related biomechanical changes during a cyclic lifting task. Spine 2003, 28, 1810–1820. [Google Scholar] [CrossRef]
- Calvin, T.F.; McDonald, A.C.; Keir, P.J. Adaptations to isolated shoulder fatigue during simulated repetitive work. Part I: Fatigue. J. Electromyogr. Kinesiol. 2016, 29, 34–41. [Google Scholar] [CrossRef]
- Goethel, M.F.; Gonçalves, M.; Brietzke, C.; Cardozo, A.C.; Vilas-Boas, J.P.; Ervilha, U.F. A global view on how local muscular fatigue affects human performance. Proc. Natl. Acad. Sci. USA 2020, 117, 19866–19872. [Google Scholar] [CrossRef]
- Celli, B.; Criner, G.; Rassulo, J. Ventilatory muscle recruitment during unsupported arm exercise in normal subjects. J. Appl. Physiol. 1988, 64, 1936–1941. [Google Scholar] [CrossRef]
- McDonald, J.; Potyk, D.; Fischer, D.; Parmenter, B.; Lillis, T.; Tompkins, L.; Belenky, G. Napping on the night shift: A study of sleep, performance, and learning in physicians-in-training. J. Grad. Med. Educ. 2013, 5, 634–638. [Google Scholar] [CrossRef] [Green Version]
- Minelli, A.; Di Palma, M.; Rocchi, M.B.L.; Ponzio, E.; Barbadoro, P.; Bracci, M.; Prospero, E. Cortisol, chronotype, and coping styles as determinants of tolerance of nursing staff to rotating shift work. Chronobiol. Int. 2021, 38, 666–680. [Google Scholar] [CrossRef] [PubMed]


| RIP Correlation | RIP Synchrony | ||||||
|---|---|---|---|---|---|---|---|
| Z | p | Z | p | ||||
| Intercept | 0.373 | 1.928 | 0.054 | 0.275 | 1.414 | 0.157 | |
| Trial | Fatigue 1 | −0.364 | −6.153 | <0.001 | −0.324 | −5.490 | <0.001 |
| Fatigue 2 | −0.348 | −5.881 | <0.001 | −0.290 | −4.904 | <0.001 | |
| Division | 2 | −0.095 | −0.878 | 0.380 | −0.082 | −0.758 | 0.449 |
| 3 | −0.169 | −1.563 | 0.118 | −0.041 | −0.380 | 0.704 | |
| 4 | −0.130 | −1.207 | 0.228 | −0.068 | −0.635 | 0.525 | |
| 5 | −0.138 | −1.278 | 0.201 | 0.018 | 0.163 | 0.870 | |
| 6 | −0.095 | −0.882 | 0.378 | −0.128 | −1.183 | 0.237 | |
| 7 | −0.207 | −1.910 | 0.056 | −0.041 | −0.376 | 0.707 | |
| 8 | −0.120 | −1.112 | 0.266 | −0.049 | −0.453 | 0.650 | |
| 9 | −0.153 | −1.418 | 0.156 | −0.133 | −1.233 | 0.217 | |
| 10 | −0.241 | −2.23 | 0.026 | −0.179 | −1.658 | 0.097 | |
| Subject | Variation | 0.637 | 0.647 | ||||
| Amplitude | Frequency | ||||||||||||
|---|---|---|---|---|---|---|---|---|---|---|---|---|---|
| Biceps Brachii | Trapezius | Biceps Brachii | Trapezius | ||||||||||
| Z | p | Z | p | Z | p | Z | p | ||||||
| Intercept | −0.096 | −0.467 | 0.641 | −0.066 | −0.304 | 0.761 | 0.076 | 0.352 | 0.725 | −0.061 | −0.278 | 0.781 | |
| Trial | Fatigue 1 | 0.433 | 10.207 | <0.001 | 0.141 | 5.727 | <0.001 | 0.050 | 1.423 | 0.155 | 0.169 | 6.966 | <0.001 |
| Fatigue 2 | 0.294 | 6.93 | <0.001 | 0.245 | 9.985 | <0.001 | −0.094 | −2.697 | 0.007 | 0.071 | 2.913 | 0.004 | |
| Division | 2 | −0.058 | −0.753 | 0.451 | −0.039 | −0.879 | 0.379 | −0.046 | −0.72 | 0.472 | 0.017 | 0.378 | 0.705 |
| 3 | −0.060 | −0.776 | 0.438 | −0.030 | −0.671 | 0.502 | −0.091 | −1.427 | 0.154 | −0.035 | −0.785 | 0.432 | |
| 4 | −0.089 | −1.15 | 0.250 | −0.036 | −0.798 | 0.425 | −0.061 | −0.965 | 0.335 | −0.052 | −1.182 | 0.237 | |
| 5 | −0.189 | −2.434 | 0.015 | −0.078 | −1.745 | 0.081 | −0.068 | −1.075 | 0.282 | −0.03 | −0.669 | 0.503 | |
| 6 | −0.195 | −2.515 | 0.012 | −0.086 | −1.912 | 0.056 | −0.062 | −0.968 | 0.333 | −0.042 | −0.947 | 0.343 | |
| 7 | −0.200 | −2.576 | 0.010 | −0.078 | −1.735 | 0.083 | −0.058 | −0.912 | 0.362 | −0.032 | −0.71 | 0.478 | |
| 8 | −0.195 | −2.517 | 0.012 | −0.094 | −2.102 | 0.036 | −0.059 | −0.922 | 0.356 | −0.033 | −0.747 | 0.455 | |
| 9 | −0.226 | −2.913 | 0.004 | −0.073 | −1.624 | 0.104 | −0.092 | −1.44 | 0.150 | 0.020 | 0.448 | 0.654 | |
| 10 | −0.251 | −3.247 | 0.001 | −0.109 | −2.428 | 0.015 | −0.071 | −1.118 | 0.263 | −0.005 | −0.108 | 0.914 | |
| Subject | Variation | 0.814 | 0.973 | 0.914 | 0.980 | ||||||||
| Amplitude | Frequency | ||||||||||||
|---|---|---|---|---|---|---|---|---|---|---|---|---|---|
| RIP Correlation | RIP Synchronization | RIP Correlation | RIP Synchronization | ||||||||||
| Z | p | Z | p | Z | p | Z | p | ||||||
| Intercept | 0.342 | 1.818 | 0.069 | 0.245 | 1.304 | 0.192 | 0.355 | 1.825 | 0.068 | 0.249 | 1.288 | 0.198 | |
| Trial | Fatigue 1 | −0.283 | −4.503 | <0.001 | −0.238 | −3.79 | <0.001 | −0.345 | −5.649 | <0.001 | −0.304 | −5.004 | <0.001 |
| Fatigue 2 | −0.241 | −3.863 | <0.001 | −0.185 | −2.974 | 0.003 | −0.327 | −5.438 | <0.001 | −0.259 | −4.328 | <0.001 | |
| Division | 2 | −0.113 | −1.061 | 0.289 | −0.100 | −0.937 | 0.349 | −0.087 | −0.808 | 0.419 | −0.07 | −0.651 | 0.515 |
| 3 | −0.184 | −1.728 | 0.084 | −0.056 | −0.528 | 0.598 | −0.164 | −1.516 | 0.130 | −0.03 | −0.275 | 0.783 | |
| 4 | −0.15 | −1.404 | 0.16 | −0.088 | −0.831 | 0.406 | −0.131 | −1.215 | 0.225 | −0.066 | −0.614 | 0.539 | |
| 5 | −0.18 | −1.679 | 0.093 | −0.025 | −0.235 | 0.814 | −0.135 | −1.248 | 0.212 | 0.026 | 0.238 | 0.812 | |
| 6 | −0.14 | −1.306 | 0.192 | −0.173 | −1.622 | 0.105 | −0.095 | −0.875 | 0.381 | −0.123 | −1.146 | 0.252 | |
| 7 | −0.249 | −2.323 | 0.020 | −0.084 | −0.789 | 0.43 | −0.205 | −1.894 | 0.058 | −0.035 | −0.326 | 0.745 | |
| 8 | −0.168 | −1.567 | 0.117 | −0.097 | −0.909 | 0.363 | −0.119 | −1.098 | 0.272 | −0.043 | −0.404 | 0.686 | |
| 9 | −0.196 | −1.826 | 0.068 | −0.178 | −1.663 | 0.096 | −0.14 | −1.294 | 0.196 | −0.112 | −1.039 | 0.299 | |
| 10 | −0.298 | −2.774 | 0.006 | −0.237 | −2.213 | 0.027 | −0.234 | −2.163 | 0.031 | −0.166 | −1.544 | 0.122 | |
| Muscle | Biceps | −0.076 | −1.283 | 0.199 | −0.101 | −1.707 | 0.088 | 0.112 | 1.576 | 0.115 | 0.194 | 2.739 | 0.006 |
| Trapezius | −0.346 | −3.709 | <0.001 | −0.304 | −3.278 | 0.001 | −0.147 | −1.530 | 0.126 | −0.178 | −1.856 | 0.063 | |
| Subject | Variation | 0.601 | 0.599 | 0.647 | 0.640 | ||||||||
Publisher’s Note: MDPI stays neutral with regard to jurisdictional claims in published maps and institutional affiliations. |
© 2022 by the authors. Licensee MDPI, Basel, Switzerland. This article is an open access article distributed under the terms and conditions of the Creative Commons Attribution (CC BY) license (https://creativecommons.org/licenses/by/4.0/).
Share and Cite
Silva, L.; Dias, M.; Folgado, D.; Nunes, M.; Namburi, P.; Anthony, B.; Carvalho, D.; Carvalho, M.; Edelman, E.; Gamboa, H. Respiratory Inductance Plethysmography to Assess Fatigability during Repetitive Work. Sensors 2022, 22, 4247. https://doi.org/10.3390/s22114247
Silva L, Dias M, Folgado D, Nunes M, Namburi P, Anthony B, Carvalho D, Carvalho M, Edelman E, Gamboa H. Respiratory Inductance Plethysmography to Assess Fatigability during Repetitive Work. Sensors. 2022; 22(11):4247. https://doi.org/10.3390/s22114247
Chicago/Turabian StyleSilva, Luís, Mariana Dias, Duarte Folgado, Maria Nunes, Praneeth Namburi, Brian Anthony, Diogo Carvalho, Miguel Carvalho, Elazer Edelman, and Hugo Gamboa. 2022. "Respiratory Inductance Plethysmography to Assess Fatigability during Repetitive Work" Sensors 22, no. 11: 4247. https://doi.org/10.3390/s22114247