Model-Free High-Order Sliding Mode Controller for Station-Keeping of an Autonomous Underwater Vehicle in Manipulation Task: Simulations and Experimental Validation
Abstract
:1. Introduction
2. Materials and Methods
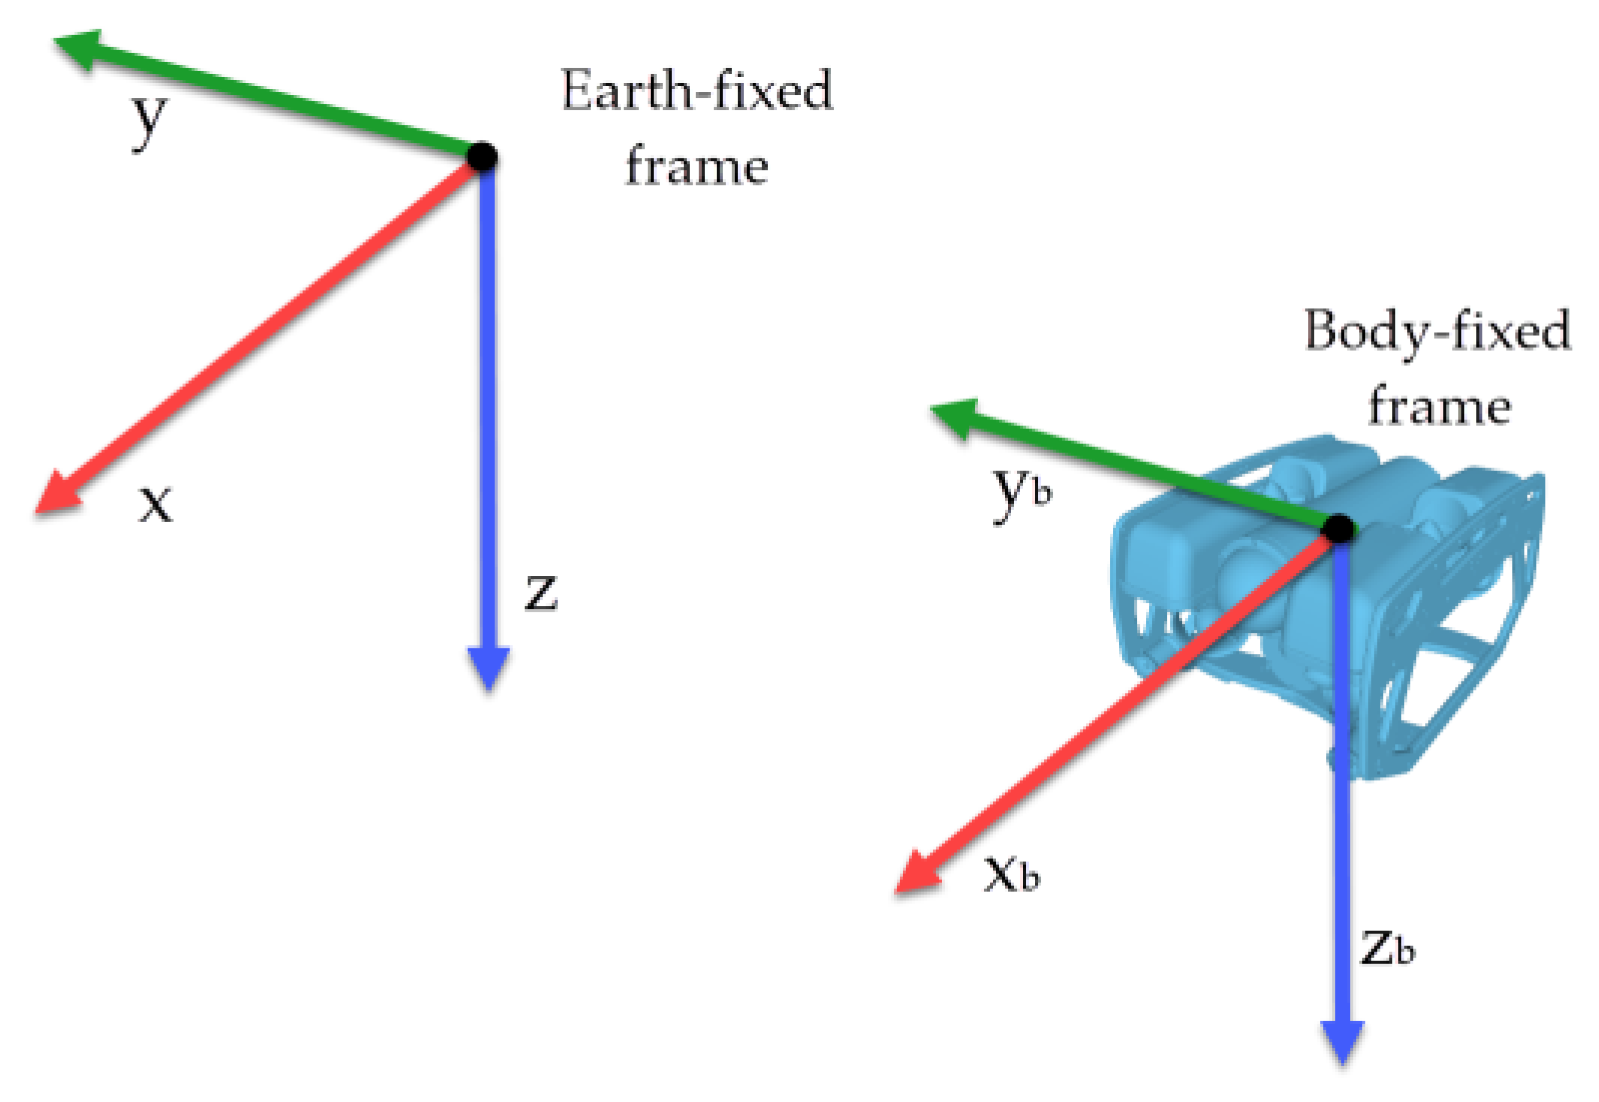
2.1. Underwater Vehicles Kinematics and Hydrodynamics
- The inertia matrixsatisfies the following:withanddenoting the minimum and maximum eigenvalue of, respectively.
- The Coriolis and centripetal matrixsatisfies the following:
- The damping matrixsatisfies the following:
- The vector of restoring forcessatisfies the following:
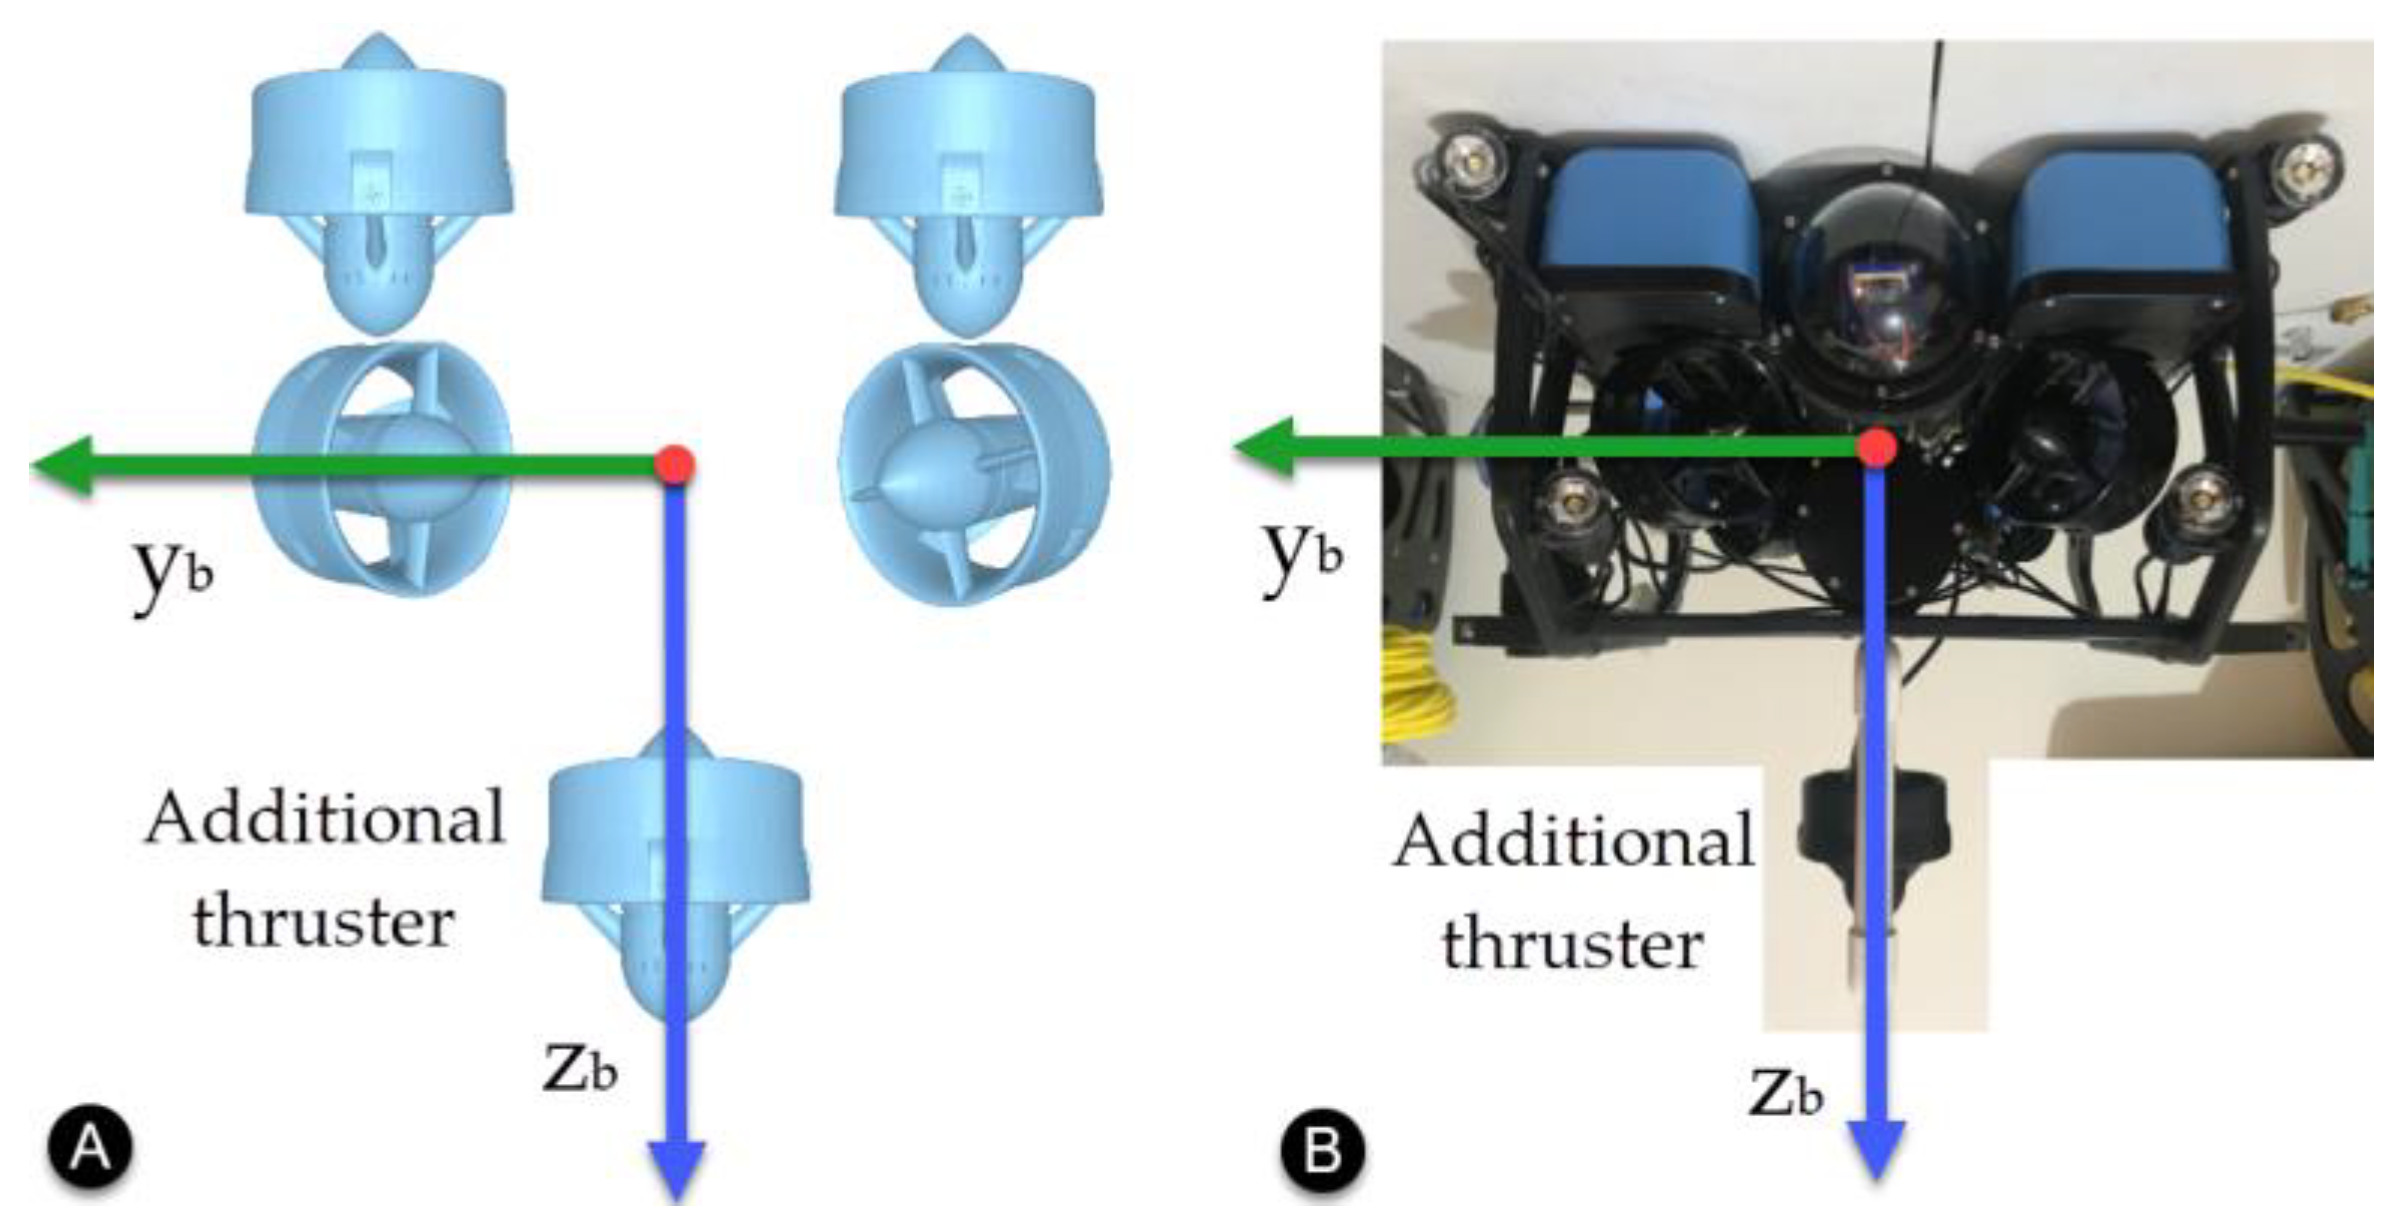
2.2. BlueROV2
2.3. BlueROV2 Simulator
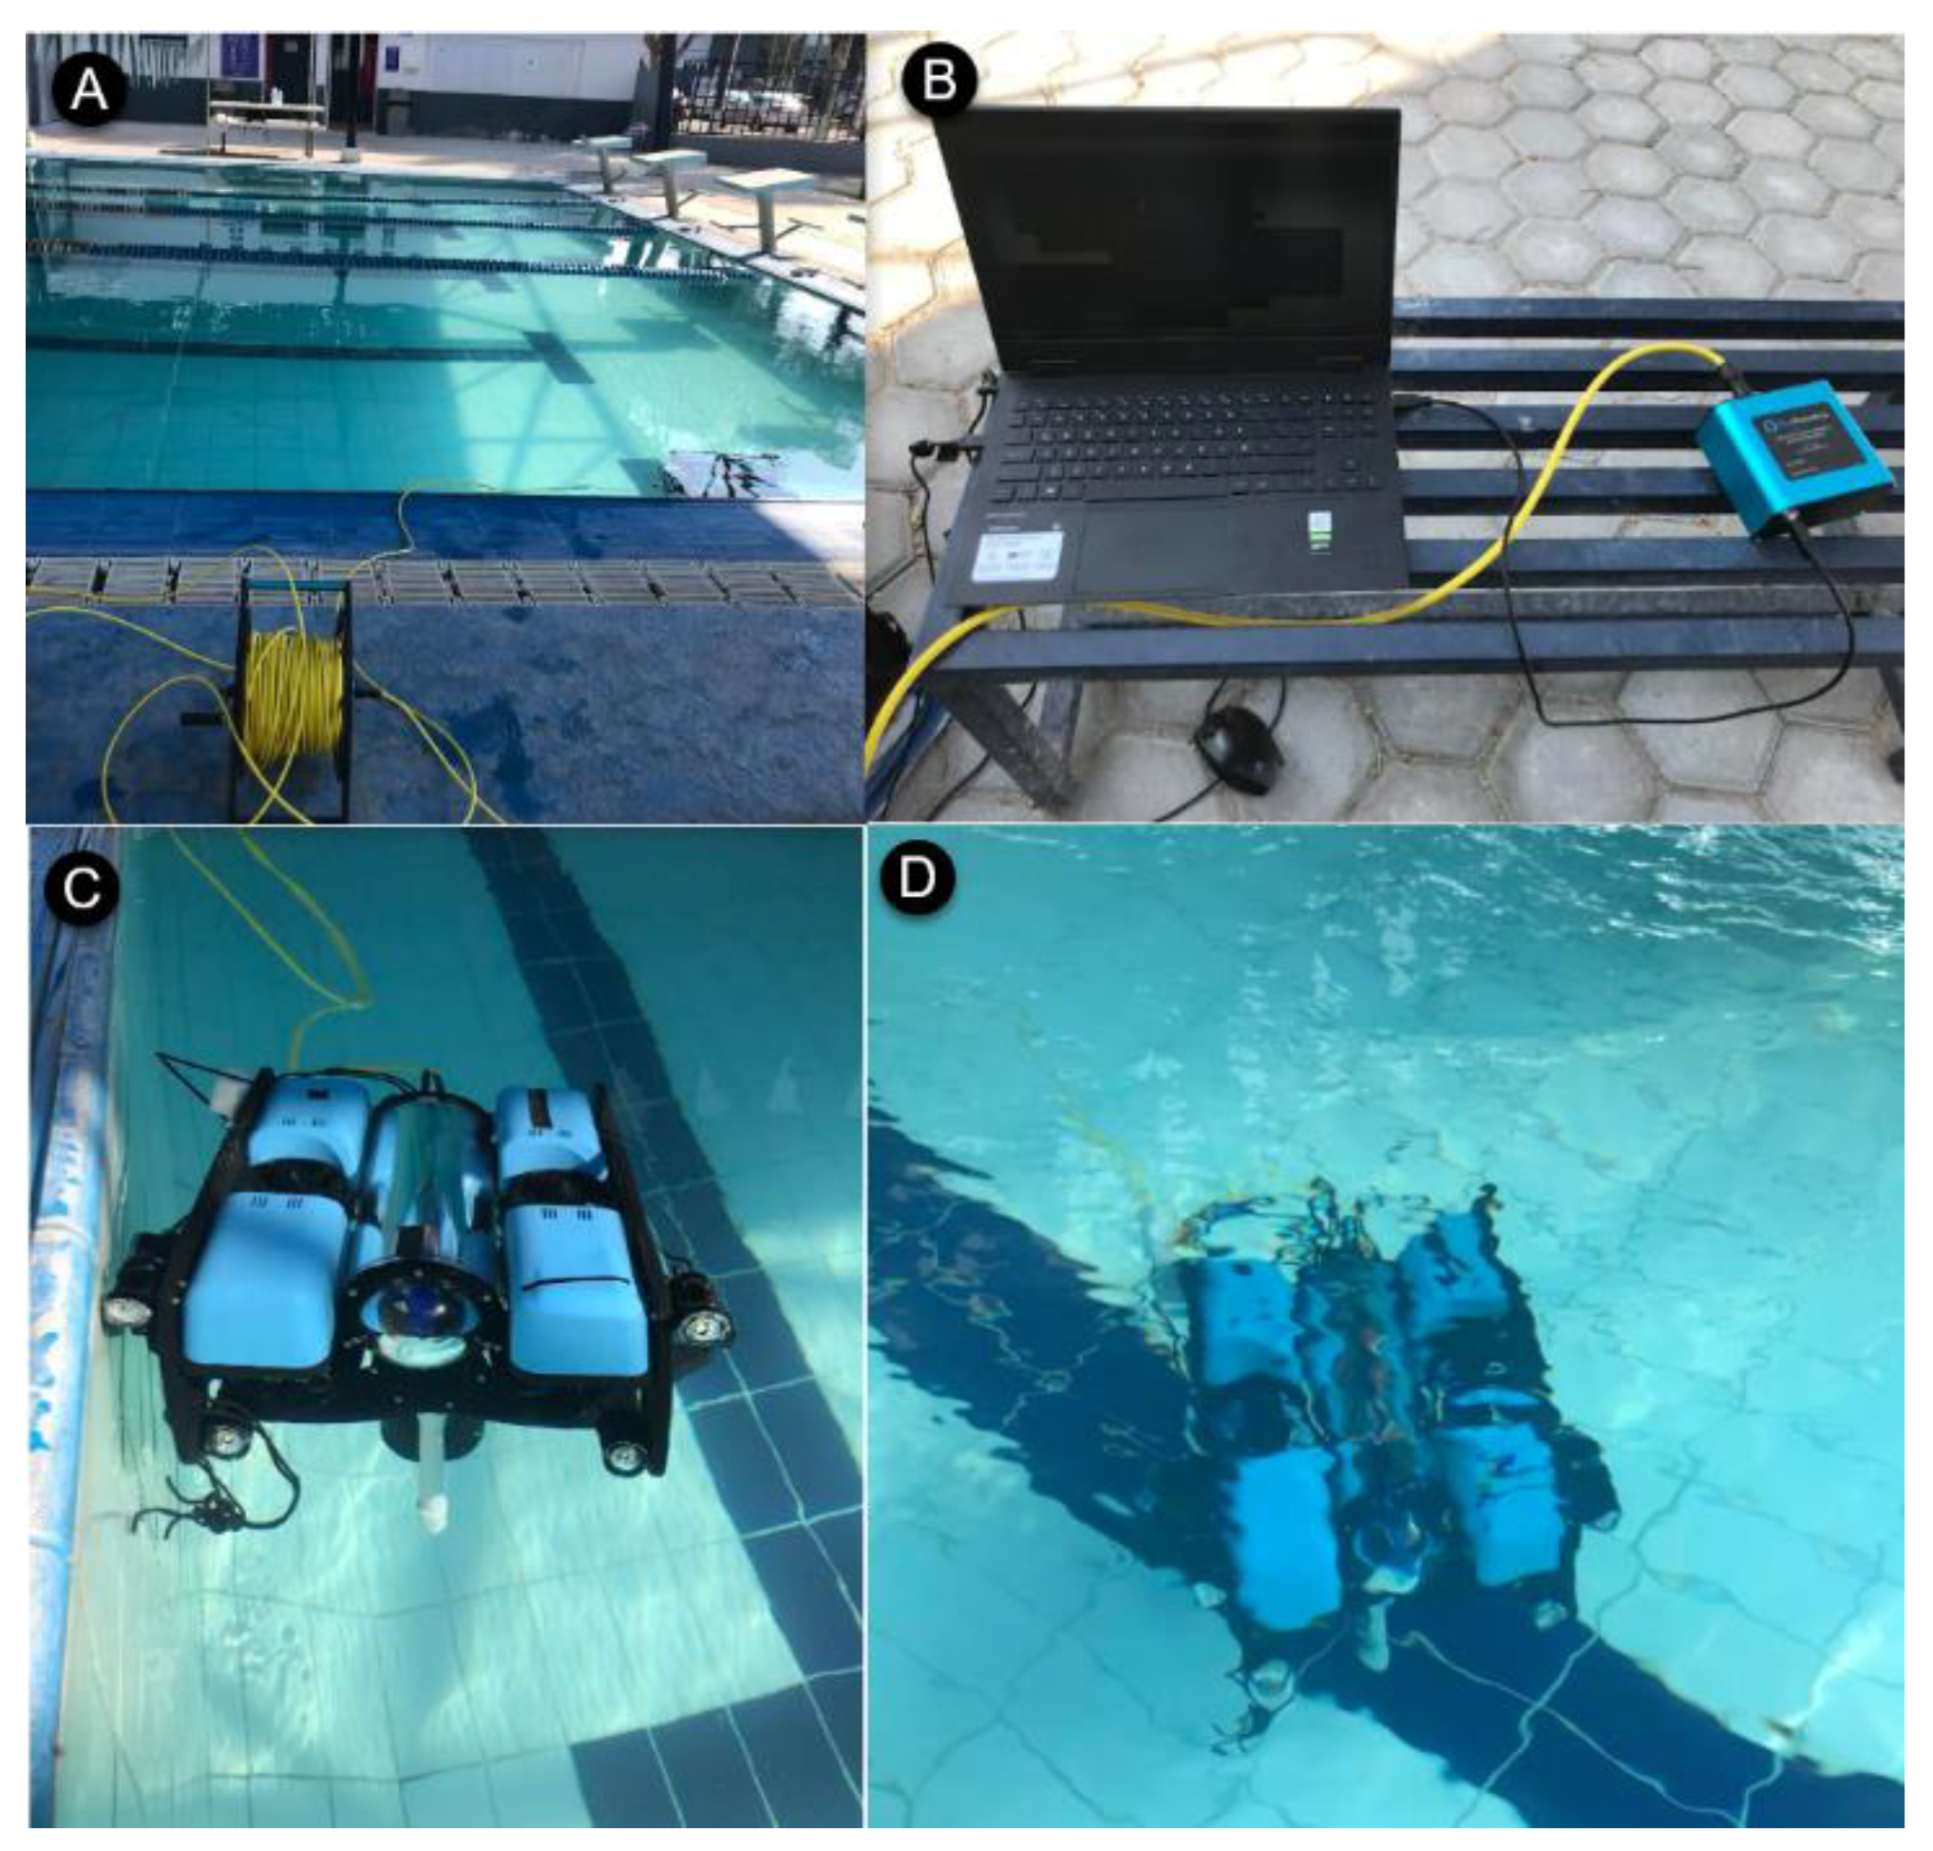
2.4. Experimentatal Setup
2.4.1. Hardware
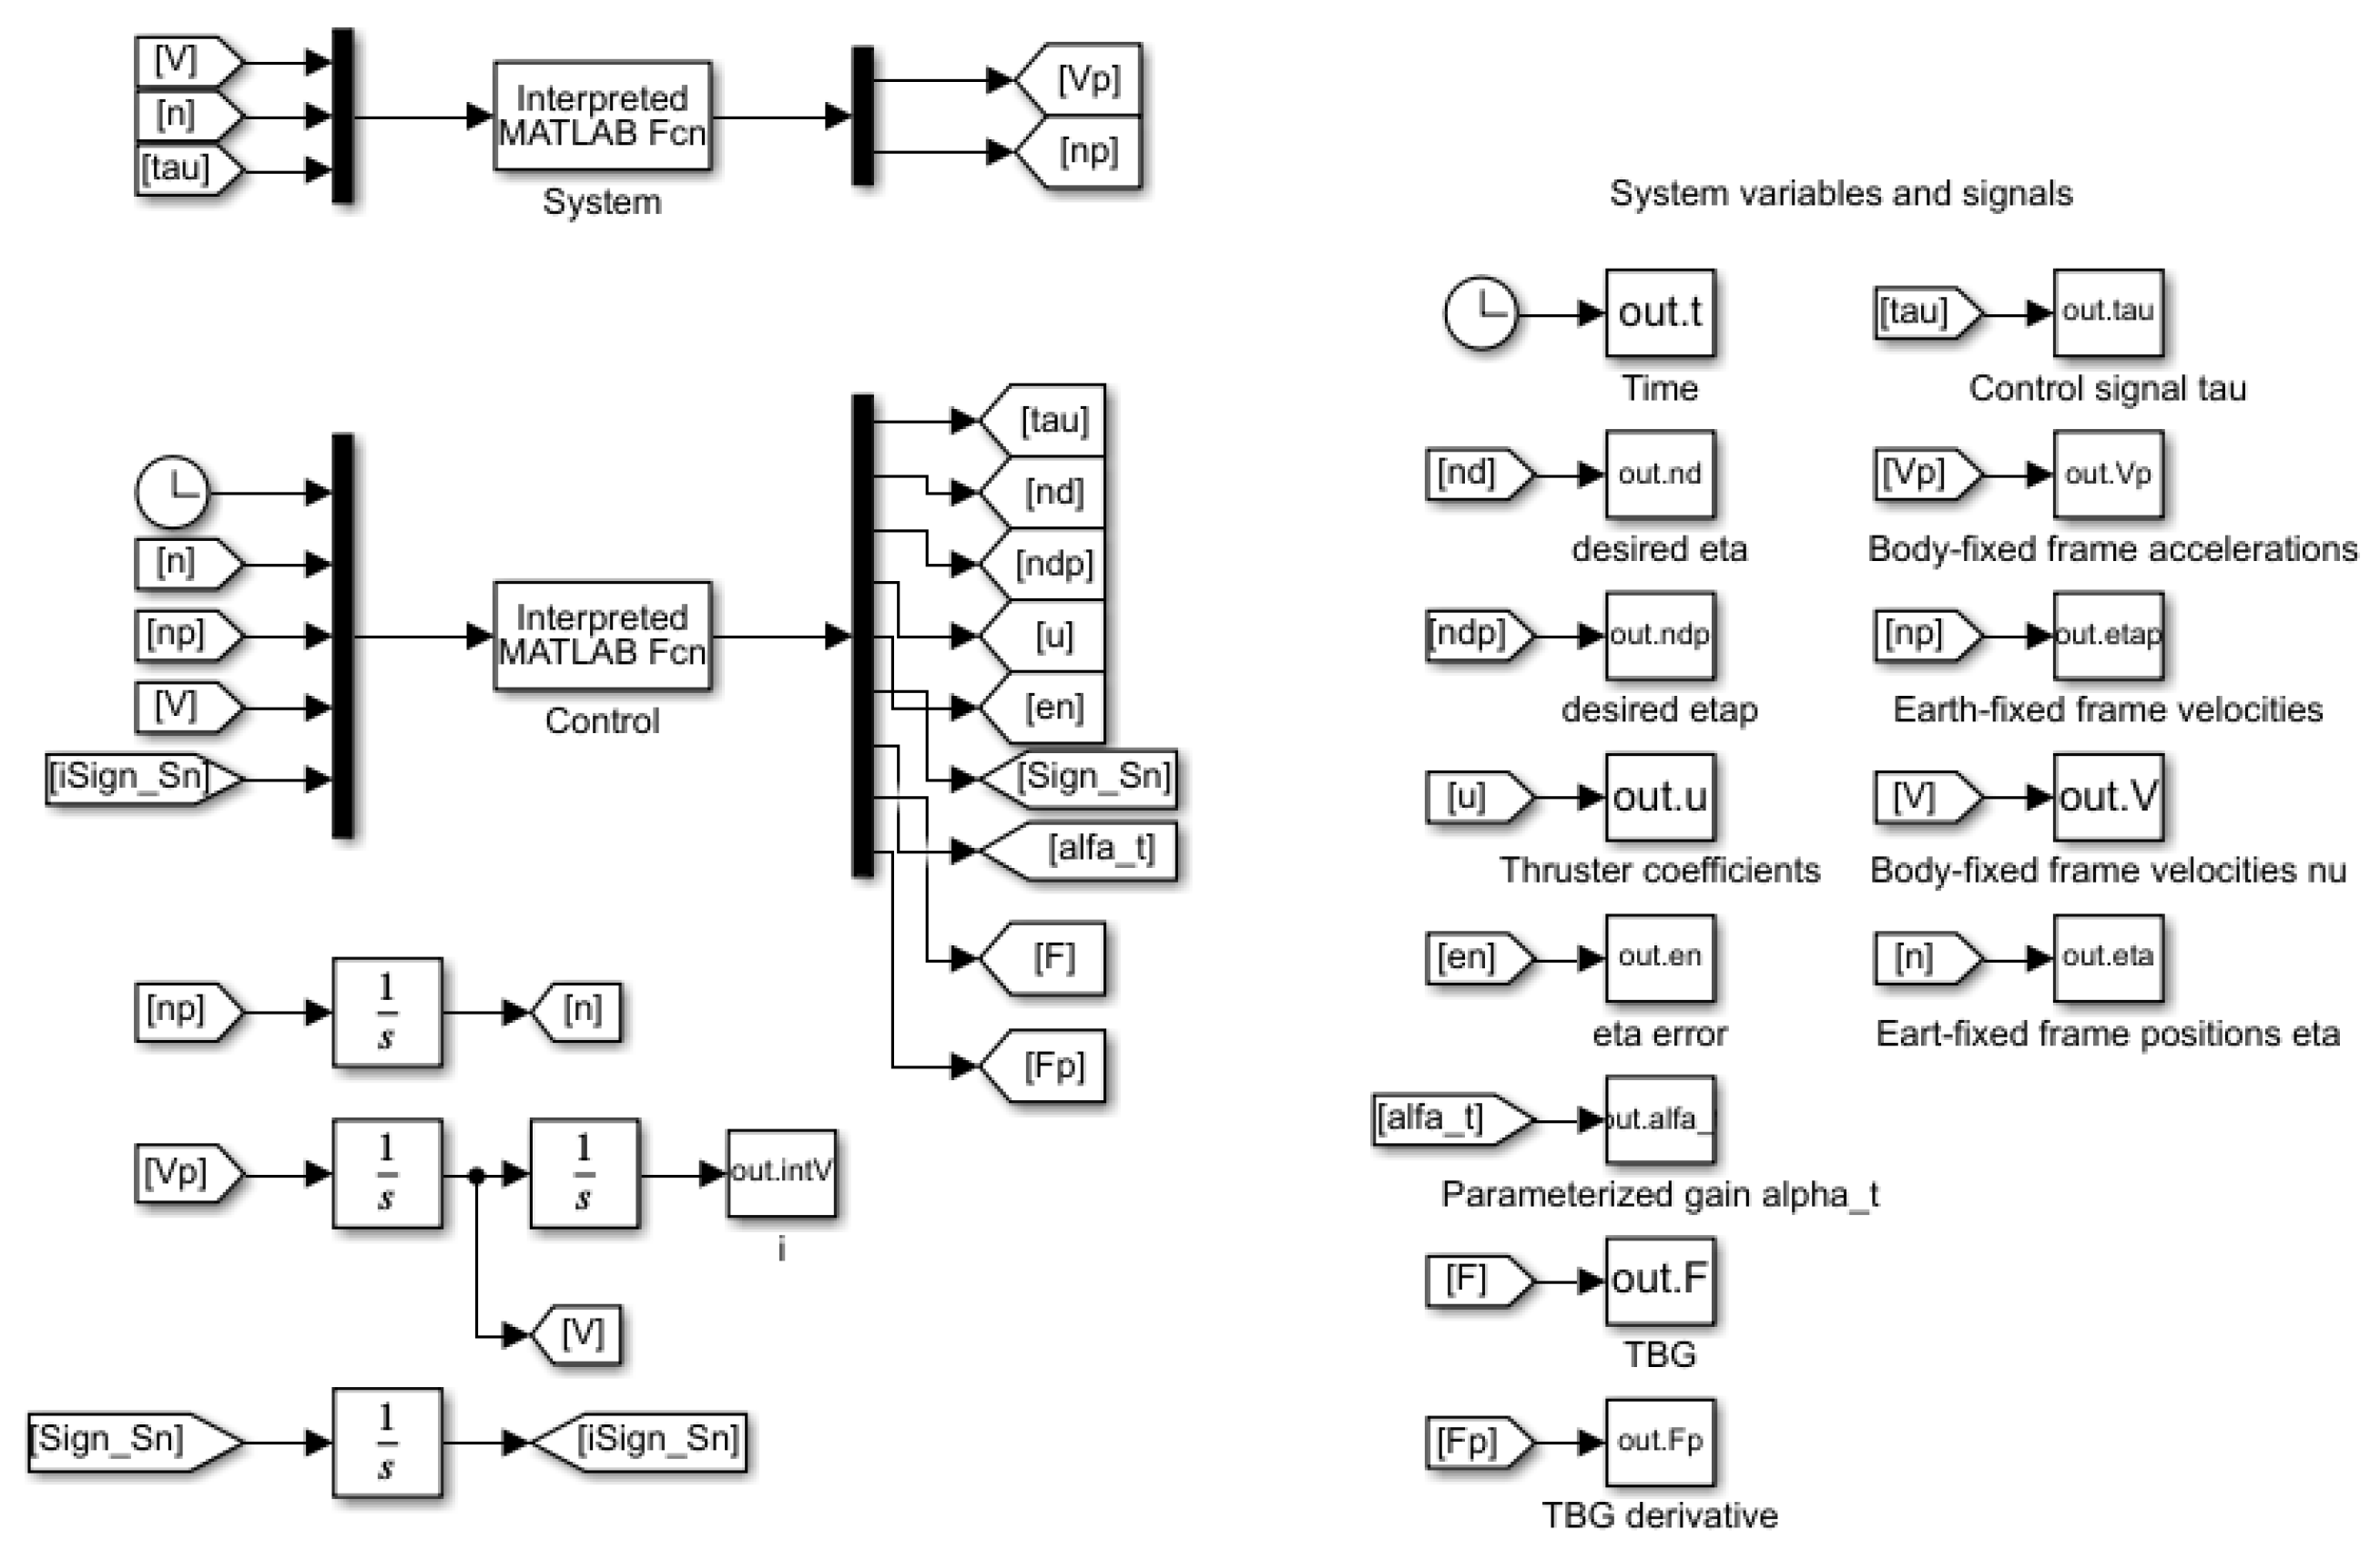
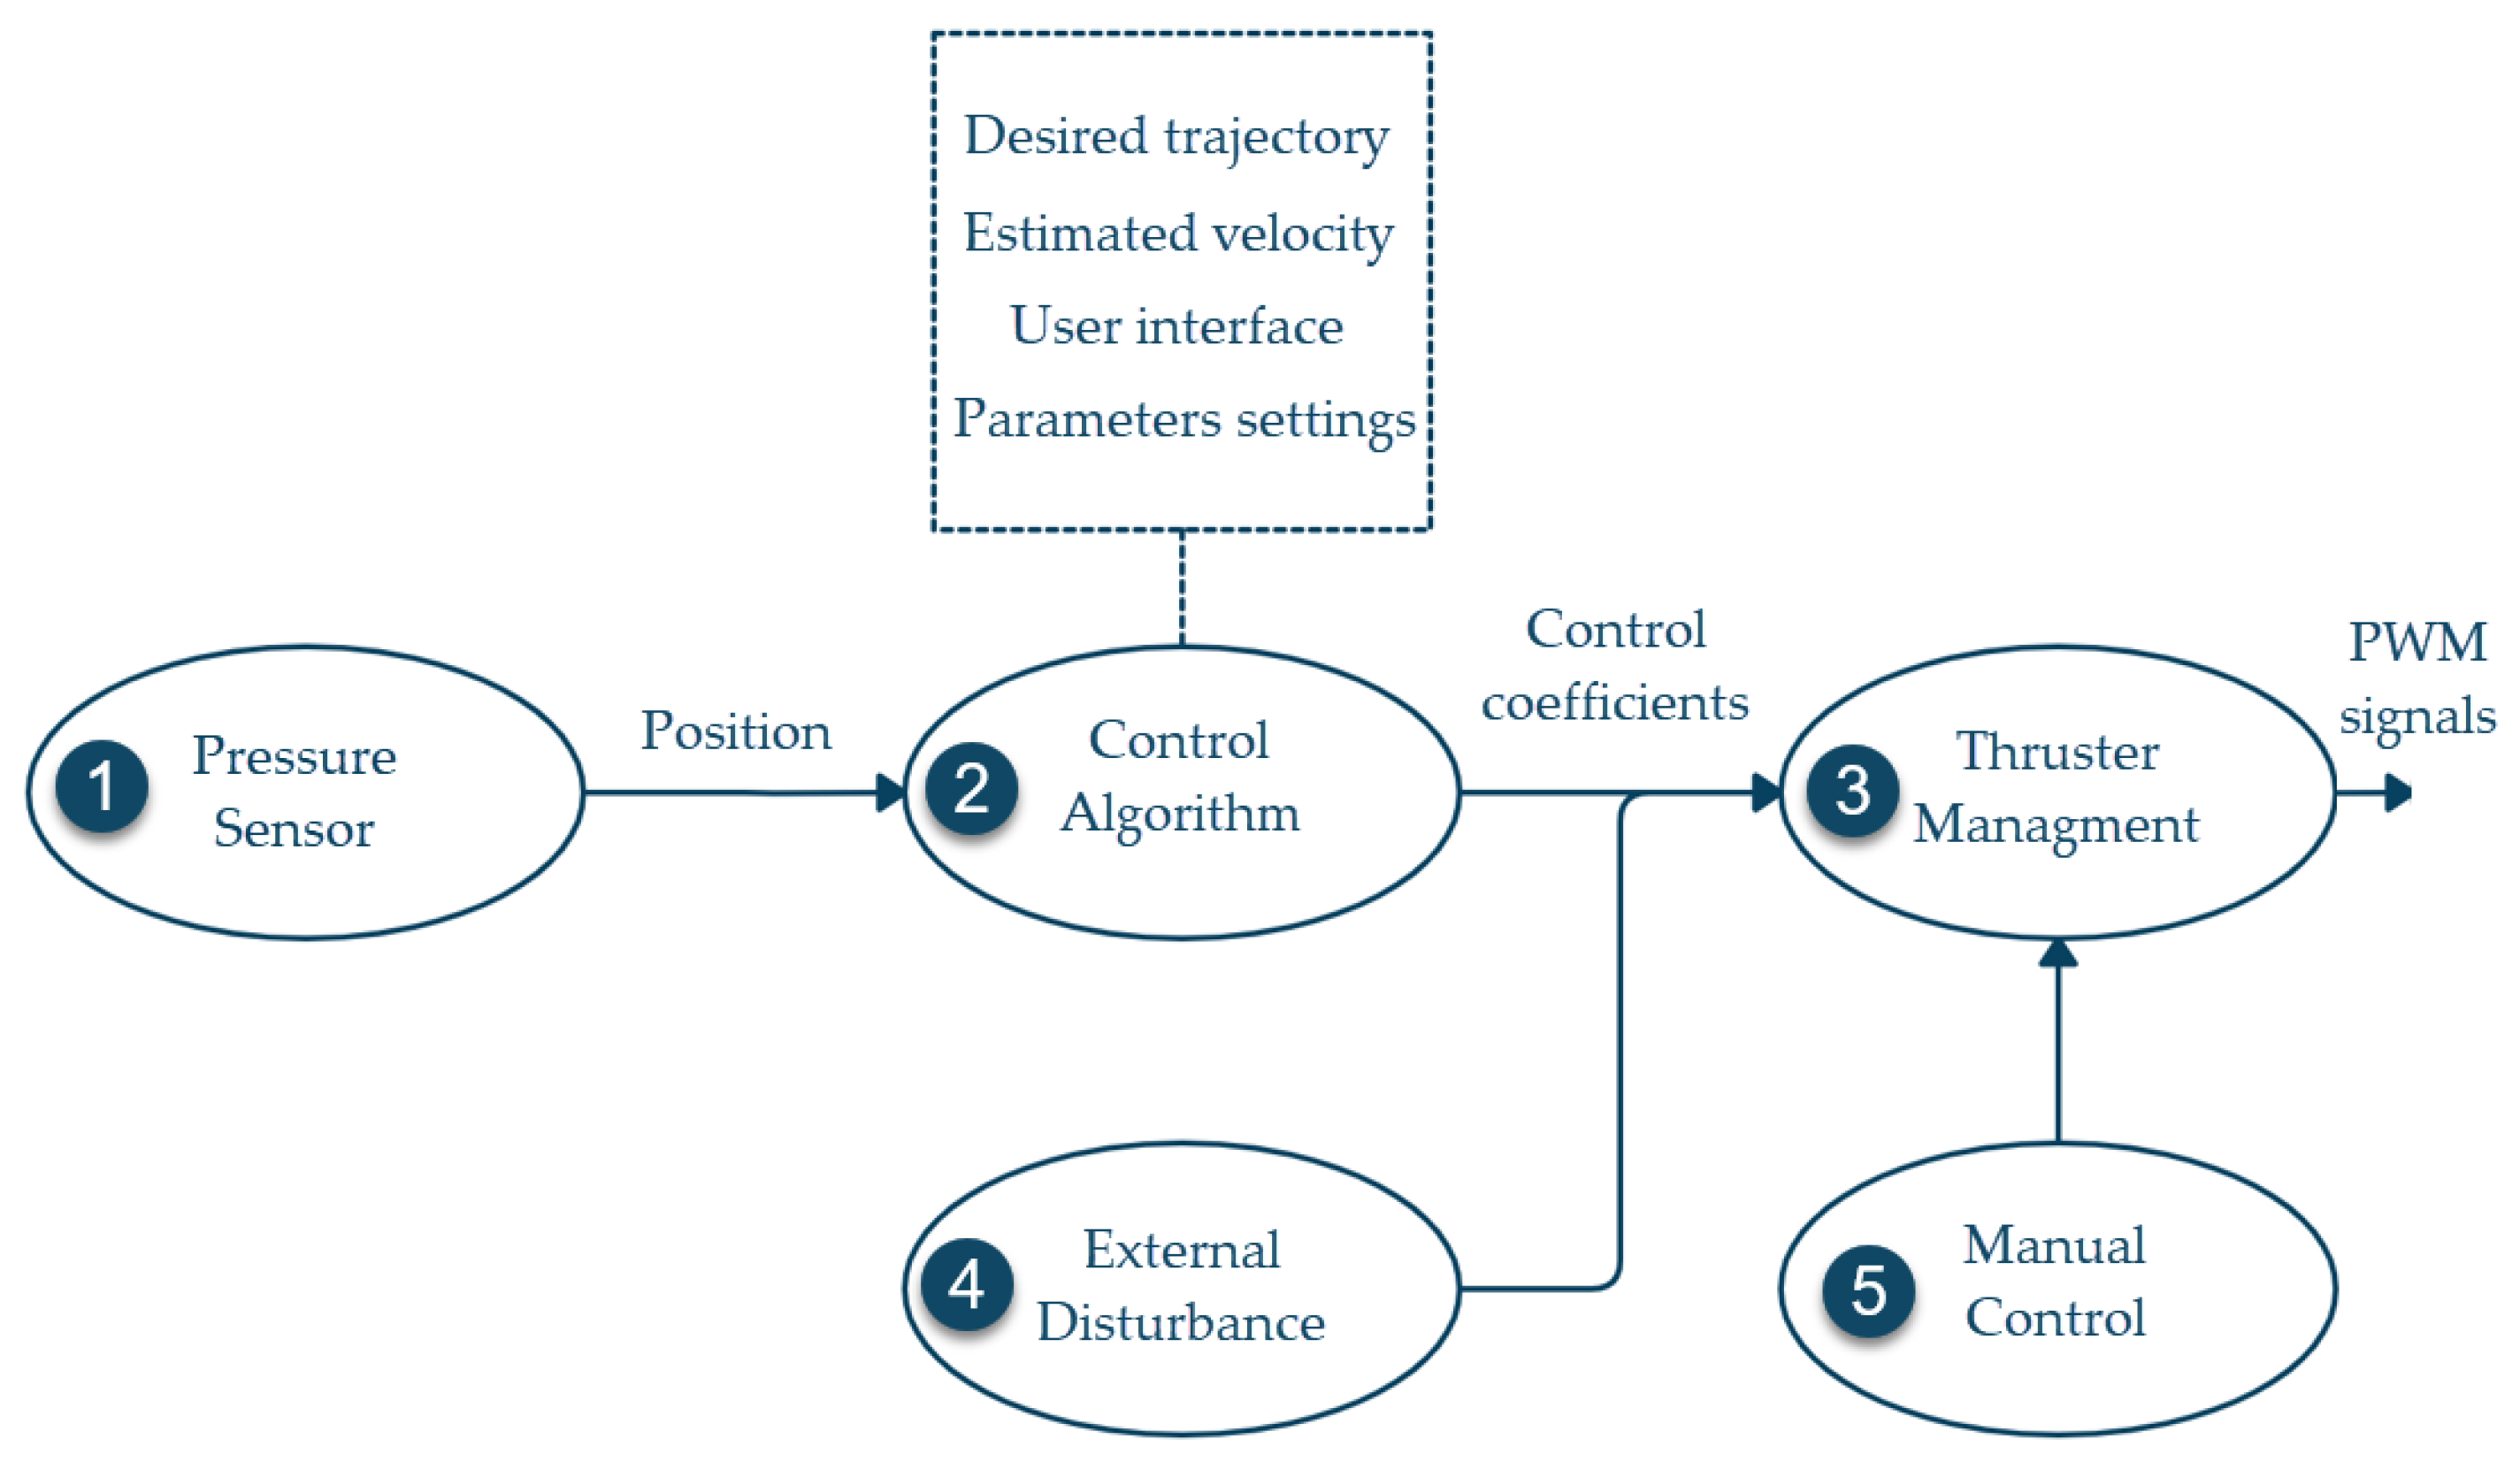
2.4.2. Software
3. Controller Design
3.1. Model-Free High Order Sliding Mode Controller
3.2. Time Parametrization of Gain
3.3. Stability Analysis
3.4. Further Considerations
3.4.1. Reference Frame Transformation
3.4.2. Exact Differentiator
4. Results and Discussion
4.1. Numerical Simulations
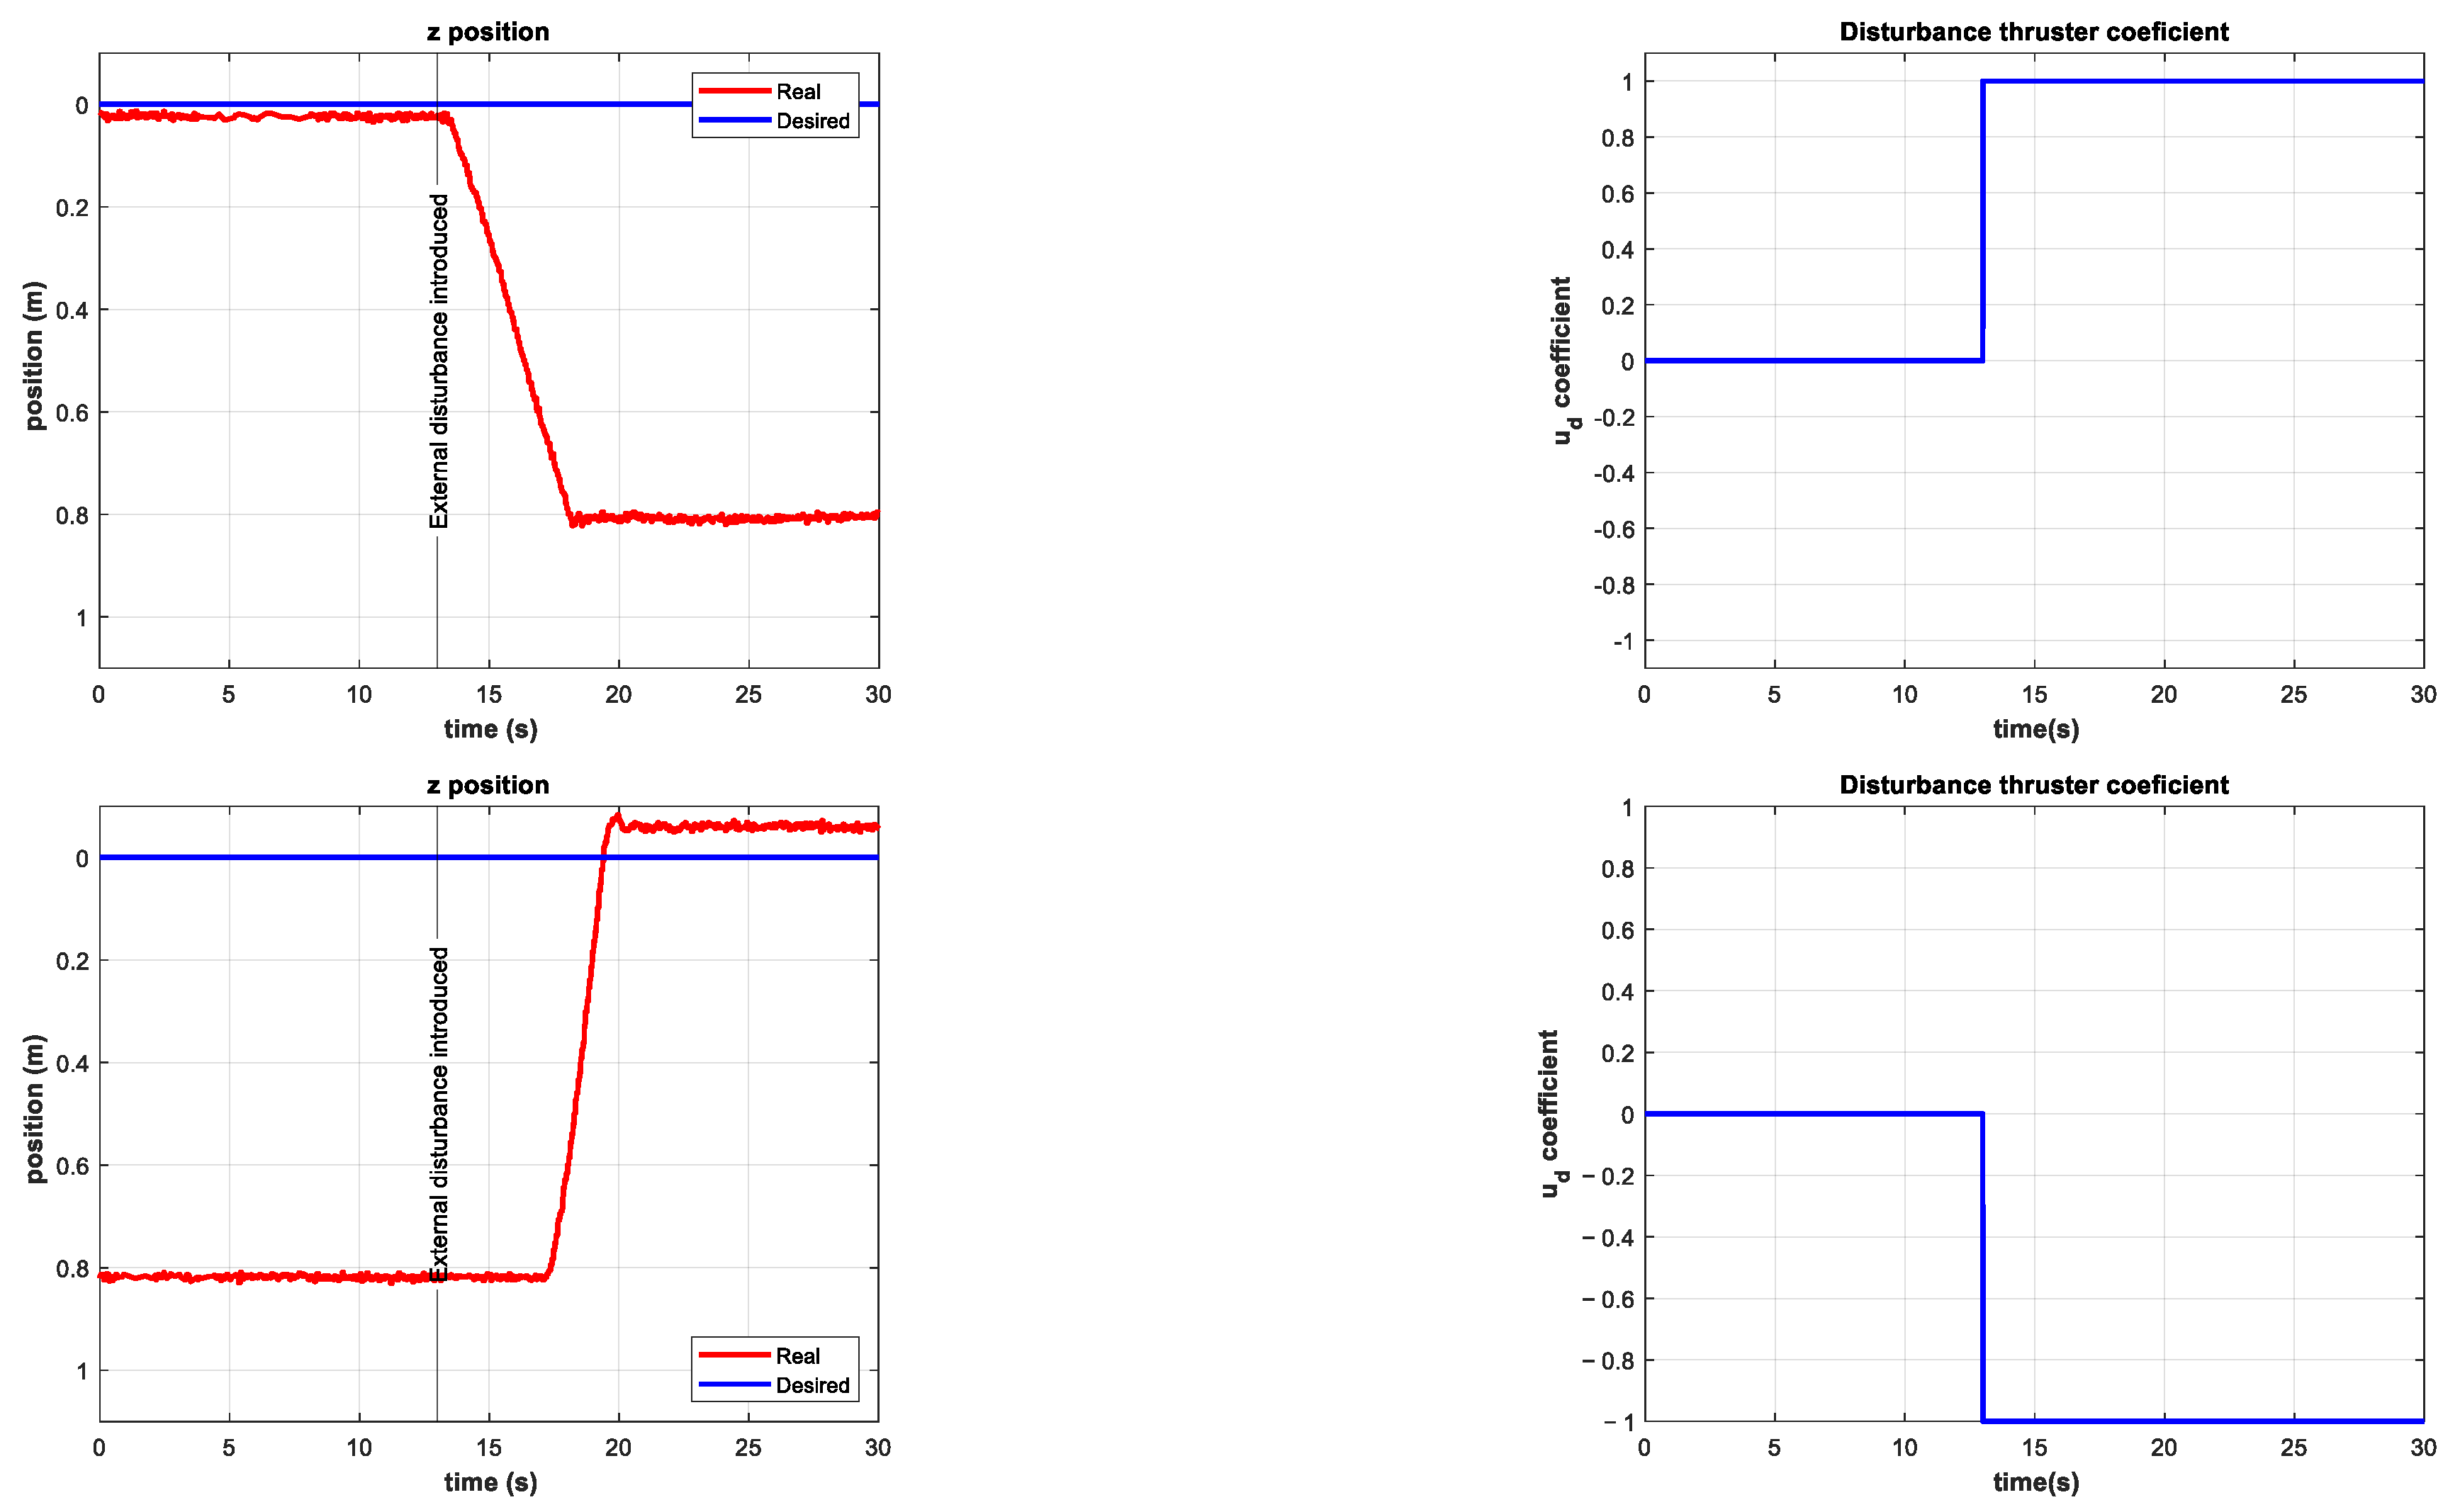
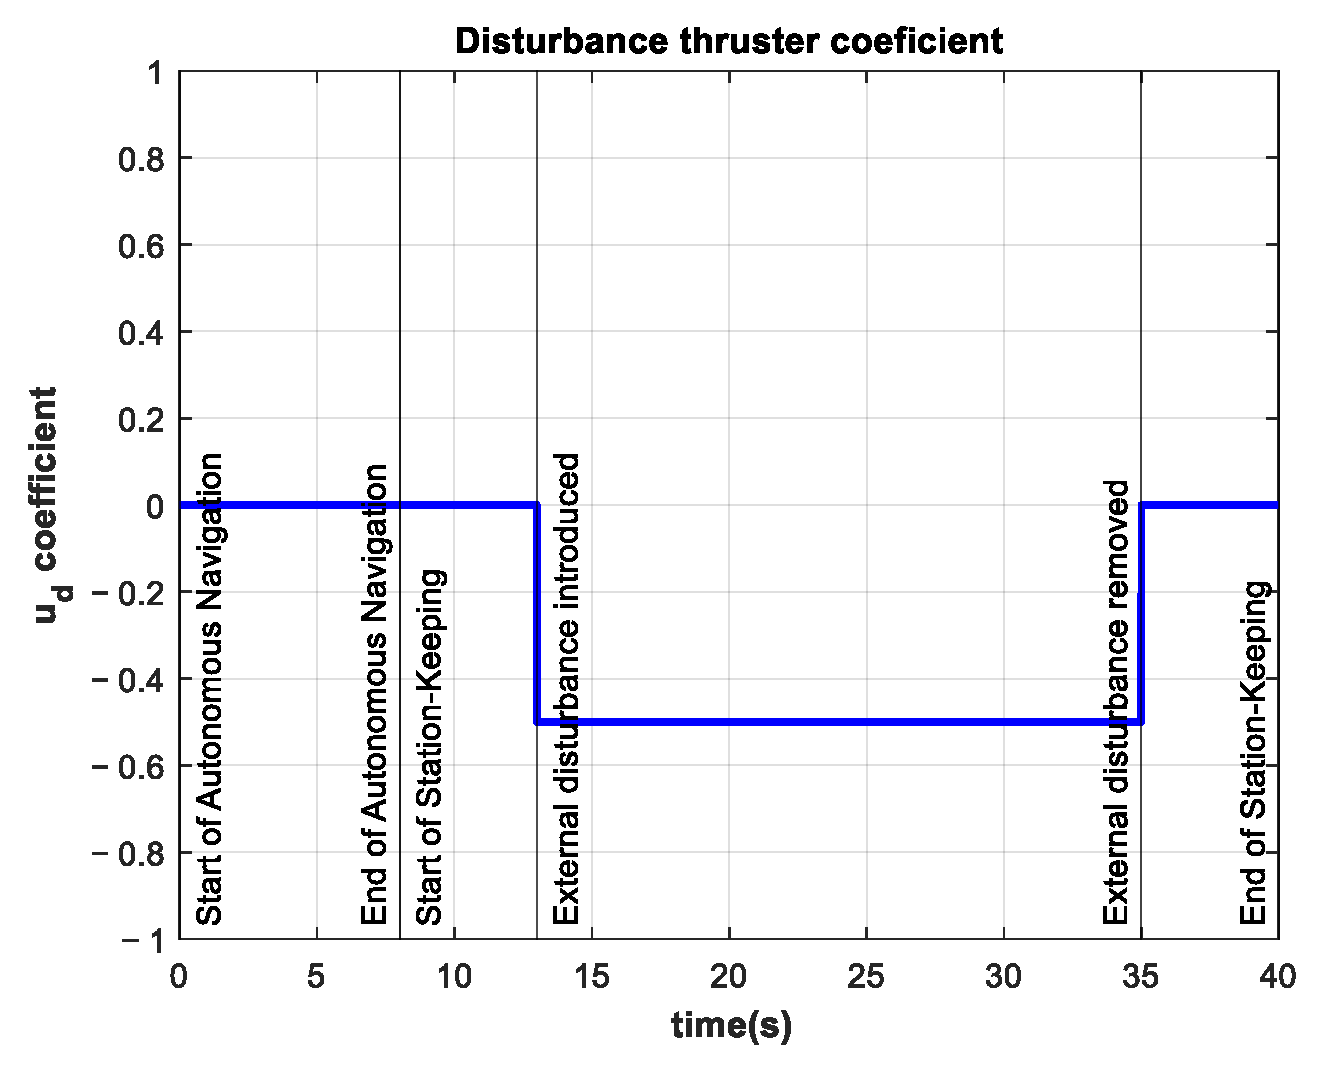
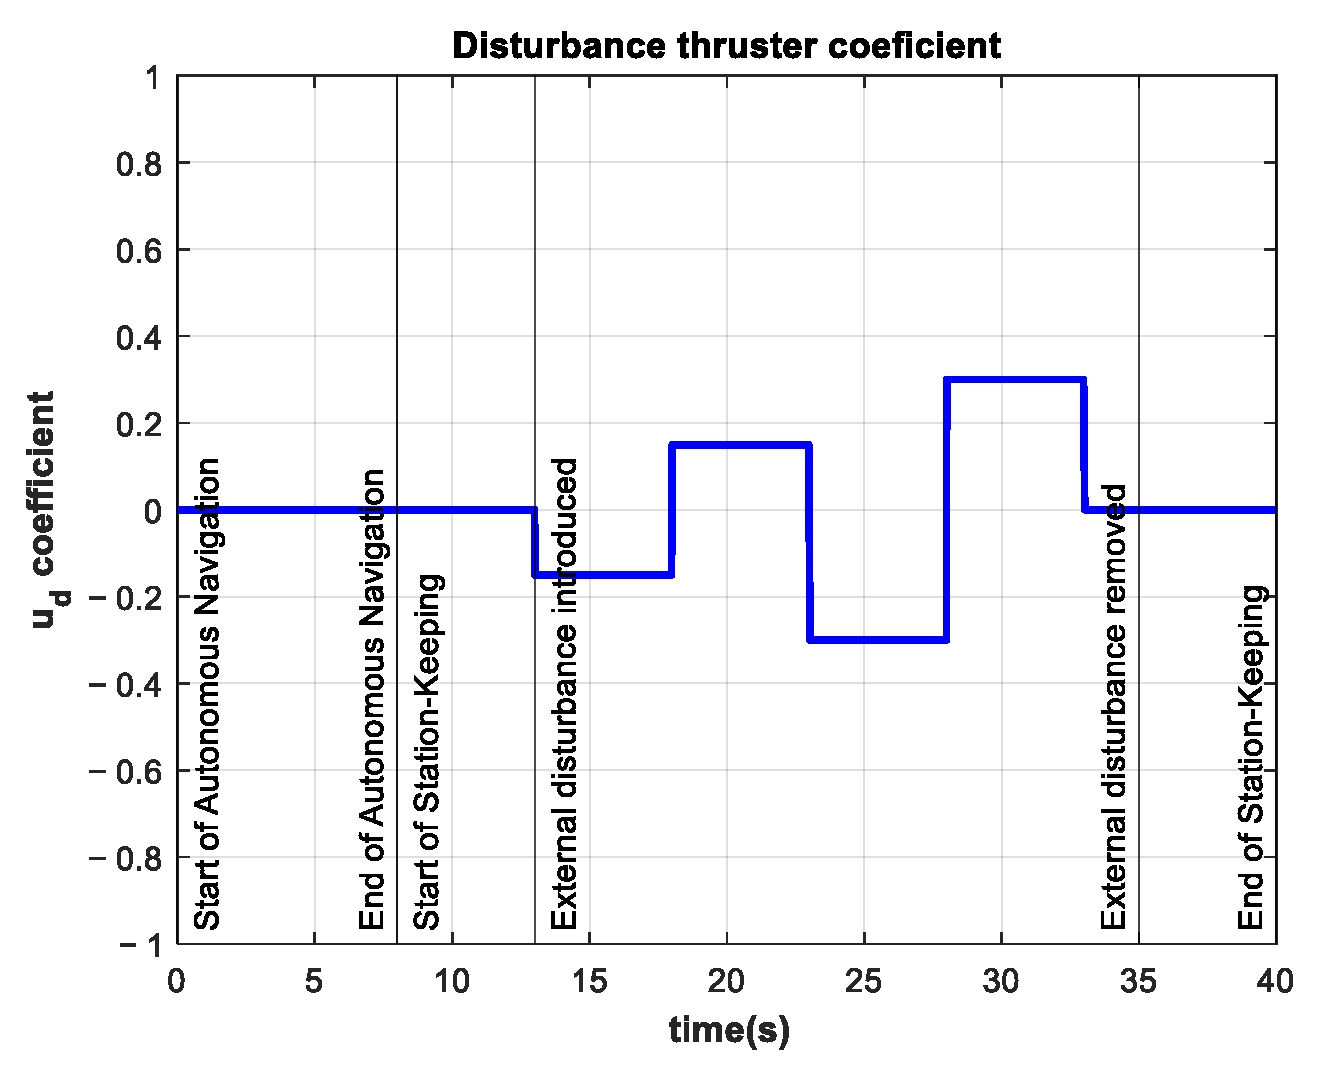
4.2. Experimentation
5. Conclusions
Author Contributions
Funding
Institutional Review Board Statement
Informed Consent Statement
Data Availability Statement
Acknowledgments
Conflicts of Interest
Abbreviations
| AUV | Autonomous Underwater Vehicle |
| ESC | Electronic Speed Controllers |
| PWM | Pulse Width Modulation |
| RMSE | Root Mean Square Error |
| RPi | Raspberry Pi |
| ROS | Robot Operating System |
| ROV | Remotely Operated Vehicle |
| SMC | Sliding Mode Control |
| SNAME | Society of Naval Architects and Marine Engineers |
| TBG | Time Base Generator |
References
- Gorma, W.; Post, M.A.; White, J.; Gardner, J.; Luo, Y.; Kim, J.; Mitchell, P.D.; Morozs, N.; Wright, M.; Xiao, Q. Development of Modular Bio-Inspired Autonomous Underwater Vehicle for Close Subsea Asset Inspection. Appl. Sci. 2021, 11, 5401. [Google Scholar] [CrossRef]
- Dawson, H.A.; Allison, M. Requirements for Autonomous Underwater Vehicles (AUVs) for Scientific Data Collection in the Laurentian Great Lakes: A Questionnaire Survey. J. Great Lakes Res. 2021, 47, 259–265. [Google Scholar] [CrossRef]
- Zhang, H.; Zhang, S.; Wang, Y.; Liu, Y.; Yang, Y.; Zhou, T.; Bian, H. Subsea Pipeline Leak Inspection by Autonomous Underwater Vehicle. Appl. Ocean Res. 2021, 107, 102321. [Google Scholar] [CrossRef]
- Evans, J.; Redmond, P.; Plakas, C.; Hamilton, K.; Lane, D. Autonomous Docking for Intervention-AUVs Using Sonar and Video-Based Real-Time 3D Pose Estimation. In Proceedings of the MTS/IEEE Oceans 2003, San Diego, CA, USA, 22–26 September 2003; Volume 4, pp. 2201–2210. [Google Scholar] [CrossRef]
- Cieslak, P.; Ridao, P. Adaptive Admittance Control in Task-Priority Framework for Contact Force Control in Autonomous Underwater Floating Manipulation. In Proceedings of the 2018 IEEE/RSJ International Conference on Intelligent Robots and Systems (IROS), Madrid, Spain, 1–5 October 2018; pp. 6646–6651. [Google Scholar] [CrossRef] [Green Version]
- Simetti, E.; Wanderlingh, F.; Torelli, S.; Bibuli, M.; Odetti, A.; Bruzzone, G.; Rizzini, D.L.; Aleotti, J.; Palli, G.; Moriello, L.; et al. Autonomous Underwater Intervention: Experimental Results of the MARIS Project. IEEE J. Ocean. Eng. 2018, 43, 620–639. [Google Scholar] [CrossRef]
- Ribas, D.; Ridao, P.; Turetta, A.; Melchiorri, C.; Palli, G.; Fernandez, J.J.; Sanz, P.J. I-AUV Mechatronics Integration for the TRIDENT FP7 Project. IEEE/ASME Trans. Mechatron. 2015, 20, 2583–2592. [Google Scholar] [CrossRef]
- Casalino, G.; Simetti, E.; Manerikar, N.; Sperinde, A.; Torelli, S.; Wanderlingh, F. Cooperative Underwater Manipulation Systems: Control Developments within the MARIS Project. IFAC-PapersOnLine 2015, 28, 1–7. [Google Scholar] [CrossRef]
- Manerikar, N.; Casalino, G.; Simetti, E.; Torelli, S.; Sperindé, A. On Autonomous Cooperative Underwater Floating Manipulation Systems. In Proceedings of the 2015 IEEE International Conference on Robotics and Automation (ICRA), Seattle, WA, USA, 26–30 May 2015; pp. 523–528. [Google Scholar] [CrossRef]
- Simetti, E.; Casalino, G. Manipulation and Transportation with Cooperative Underwater Vehicle Manipulator Systems. IEEE J. Ocean. Eng. 2017, 42, 782–799. [Google Scholar] [CrossRef]
- Simetti, E.; Casalino, G.; Wanderlingh, F.; Aicardi, M. A Task Priority Approach to Cooperative Mobile Manipulation: Theory and Experiments. Rob. Auton. Syst. 2019, 122, 103287. [Google Scholar] [CrossRef]
- Pi, R.; Cielak, P.; Ridao, P.; Sanz, P.J. TWINBOT: Autonomous Underwater Cooperative Transportation. IEEE Access 2021, 9, 37668–37684. [Google Scholar] [CrossRef]
- González-García, J.; Gómez-Espinosa, A.; Cuan-Urquizo, E.; García-Valdovinos, L.G.; Salgado-Jiménez, T.; Escobedo Cabello, J.A. Autonomous Underwater Vehicles: Localization, Navigation, and Communication for Collaborative Missions. Appl. Sci. 2020, 10, 1256. [Google Scholar] [CrossRef] [Green Version]
- Borlaug, I.L.G.; Pettersen, K.Y.; Gravdahl, J.T. Comparison of Two Second-Order Sliding Mode Control Algorithms for an Articulated Intervention AUV: Theory and Experimental Results. Ocean Eng. 2021, 222, 108480. [Google Scholar] [CrossRef]
- González-García, J.; Narcizo-Nuci, N.A.; García-Valdovinos, L.G.; Salgado-Jiménez, T.; Gómez-Espinosa, A.; Cuan-Urquizo, E.; Cabello, J.A.E. Model-Free High Order Sliding Mode Control with Finite-Time Tracking for Unmanned Underwater Vehicles. Appl. Sci. 2021, 11, 1836. [Google Scholar] [CrossRef]
- Sun, Y.; Chai, P.; Zhang, G.; Zhou, T.; Zheng, H. Sliding Mode Motion Control for AUV with Dual-Observer Considering Thruster Uncertainty. J. Mar. Sci. Eng. 2022, 10, 349. [Google Scholar] [CrossRef]
- Wang, Z.; Liu, Y.; Guan, Z.; Zhang, Y. An Adaptive Sliding Mode Motion Control Method of Remote Operated Vehicle. IEEE Access 2021, 9, 22447–22454. [Google Scholar] [CrossRef]
- Cho, G.R.; Li, J.H.; Park, D.; Jung, J.H. Robust Trajectory Tracking of Autonomous Underwater Vehicles Using Back-Stepping Control and Time Delay Estimation. Ocean Eng. 2020, 201, 107131. [Google Scholar] [CrossRef]
- García-Valdovinos, L.G.; Fonseca-Navarro, F.; Aizpuru-Zinkunegi, J.; Salgado-Jiménez, T.; Gómez-Espinosa, A.; Cruz-Ledesma, J.A. Neuro-Sliding Control for Underwater ROV’s Subject to Unknown Disturbances. Sensors 2019, 19, 2943. [Google Scholar] [CrossRef] [Green Version]
- Ding, N.; Tang, Y.; Jiang, Z.; Bai, Y.; Liang, S. Station-Keeping Control of Autonomous and Remotely-Operated Vehicles for Free Floating Manipulation. J. Mar. Sci. Eng. 2021, 9, 1305. [Google Scholar] [CrossRef]
- Sakiyama, J.; Motoi, N. Position and Attitude Control Method Using Disturbance Observer for Station Keeping in Underwater Vehicle. In Proceedings of the 44th Annual Conference of the IEEE Industrial Electronics Society, Washington, DC, USA, 21–23 October 2018; Volume 1, pp. 5469–5474. [Google Scholar] [CrossRef]
- Vu, M.T.; Le Thanh, H.N.N.; Huynh, T.T.; Thang, Q.; Duc, T.; Hoang, Q.D.; Le, T.H. Station-Keeping Control of a Hovering Over-Actuated Autonomous Underwater Vehicle under Ocean Current Effects and Model Uncertainties in Horizontal Plane. IEEE Access 2021, 9, 6855–6867. [Google Scholar] [CrossRef]
- González-García, J.; Gómez-Espinosa, A.; García-Valdovinos, L.G.; Salgado-Jiménez, T.; Cuan-Urquizo, E.; Cabello, J.A.E. Experimental Validation of a Model-Free High-Order Sliding Mode Controller with Finite-Time Convergence for Trajectory Tracking of Autonomous Underwater Vehicles. Sensors 2022, 22, 488. [Google Scholar] [CrossRef]
- Fossen, T.I. Handbook of Marine Craft Hydrodynamics and Motion Control; John Wiley & Sons, Ltd.: Chichester, UK, 2011; ISBN 9781119994138. [Google Scholar]
- Qiao, L.; Zhang, W. Double-Loop Integral Terminal Sliding Mode Tracking Control for UUVs with Adaptive Dynamic Compensation of Uncertainties and Disturbances. IEEE J. Ocean. Eng. 2019, 44, 29–53. [Google Scholar] [CrossRef]
- BlueRobotics Affordable and Capable Underwater Robot. Available online: https://bluerobotics.com/store/rov/bluerov2/ (accessed on 3 April 2022).
- García-Valdovinos, L.G.; Salgado-Jiménez, T.; Bandala-Sánchez, M.; Nava-Balanzar, L.; Hernández-Alvarado, R.; Cruz-Ledesma, J.A. Modelling, Design and Robust Control of a Remotely Operated Underwater Vehicle. Int. J. Adv. Robot. Syst. 2014, 11. [Google Scholar] [CrossRef] [Green Version]
- Parra-Vega, V. Second Order Sliding Mode Control for Robot Arms with Time Base Generators for Finite-Time Tracking. Dyn. Control 2001, 11, 175–186. [Google Scholar] [CrossRef]
- Parra-Vega, V.; Arimoto, S.; Liu, Y.H.; Hirzinger, G.; Akella, P. Dynamic Sliding PID Control for Tracking of Robot Manipulators: Theory and Experiments. IEEE Trans. Robot. Autom. 2003, 19, 967–976. [Google Scholar] [CrossRef]
- Levant, A. Higher-Order Sliding Modes, Differentiation and Output-Feedback Control. Int. J. Control 2003, 76, 924–941. [Google Scholar] [CrossRef]








| Movement | Name | Position | Velocity | Force/Moment |
|---|---|---|---|---|
| X translation | Surge | |||
| Y translation | Sway | |||
| Z translation | Heave | |||
| X rotation | Roll | |||
| Y rotation | Pitch | |||
| Z rotation | Yaw |
| Parameter | Value | Parameter | Value |
|---|---|---|---|
| 0 | 0.001 | ||
| 8 | 5 | ||
| 1.01 | |||
| 20 |
| Parameter | Value | Parameter | Value |
|---|---|---|---|
| 0 | 0.001 | ||
| 8 | 5 | ||
| 1.005 | 0.05 | ||
| 10 | 100 |
| Experiment | Depth RMSE (m) | Disturbance Thruster Coefficient | Thrusters’ Saturation | |
|---|---|---|---|---|
| Control (C-T) | 0.1275 | 0.011 | 0.00 | No |
| 1 | 0.1609 | 0.011 | 0.15 | No |
| 2 | 0.1720 | 0.013 | 0.25 | No |
| 3 | 0.1674 | 0.012 | 0.35 | No |
| 4 | 0.3546 | 0.024 | 0.50 | No |
| 5 | 0.5877 | 0.043 | 0.75 | Yes |
| 6 | 0.5810 | 0.040 | 1.00 | Yes |
| 7 | 0.1591 | 0.010 | −0.15 | No |
| 8 | 0.1627 | 0.013 | −0.25 | No |
| 9 | 0.2397 | 0.027 | −0.35 | No |
| 10 | 0.2249 | 0.020 | −0.50 | No |
| 11 | 0.2518 | 0.017 | −0.75 | No |
| 12 | 0.3106 | 0.021 | −1.00 | No |
| 13 | 0.1453 | 0.009 | 0.15 to 0.25 | No |
| 14 | 0.1275 | 0.009 | 0.15 to 0.25 | No |
| 15 | 0.1698 | 0.012 | −0.15 to −0.25 | No |
| 16 | 0.2081 | 0.018 | −0.15 to −0.25 | No |
| 17 | 0.2683 | 0.020 | −0.35 to + 0.35 | No |
| 18 | 0.2312 | 0.017 | −0.35 to + 0.35 | No |
| Experiment | % vs. C-T | Disturbance Thruster Coefficient | Thrusters’ Saturation | |
|---|---|---|---|---|
| Control (C-T) | 5.88 | - | 0.00 | No |
| 1 | 8.95 | 152% | 0.15 | No |
| 2 | 10.97 | 187% | 0.25 | No |
| 3 | 11.63 | 198% | 0.35 | No |
| 4 | 28.36 | 482% | 0.50 | No |
| 5 | 49.57 | 843% | 0.75 | Yes |
| 6 | 50.18 | 853% | 1.00 | Yes |
| 7 | 7.98 | 136% | −0.15 | No |
| 8 | 9.79 | 166% | −0.25 | No |
| 9 | 16.03 | 273% | −0.35 | No |
| 10 | 14.95 | 254% | −0.50 | No |
| 11 | 20.14 | 342% | −0.75 | No |
| 12 | 25.12 | 427% | −1.00 | No |
| 13 | 10.39 | 177% | 0.15 to 0.25 | No |
| 14 | 8.81 | 150% | 0.15 to 0.25 | No |
| 15 | 10.43 | 177% | −0.15 to −0.25 | No |
| 16 | 13.64 | 232% | −0.15 to −0.25 | No |
| 17 | 21.46 | 365% | −0.35 to +0.35 | No |
| 18 | 18.50 | 314% | −0.35 to +0.35 | No |
Publisher’s Note: MDPI stays neutral with regard to jurisdictional claims in published maps and institutional affiliations. |
© 2022 by the authors. Licensee MDPI, Basel, Switzerland. This article is an open access article distributed under the terms and conditions of the Creative Commons Attribution (CC BY) license (https://creativecommons.org/licenses/by/4.0/).
Share and Cite
González-García, J.; Gómez-Espinosa, A.; García-Valdovinos, L.G.; Salgado-Jiménez, T.; Cuan-Urquizo, E.; Cabello, J.A.E. Model-Free High-Order Sliding Mode Controller for Station-Keeping of an Autonomous Underwater Vehicle in Manipulation Task: Simulations and Experimental Validation. Sensors 2022, 22, 4347. https://doi.org/10.3390/s22124347
González-García J, Gómez-Espinosa A, García-Valdovinos LG, Salgado-Jiménez T, Cuan-Urquizo E, Cabello JAE. Model-Free High-Order Sliding Mode Controller for Station-Keeping of an Autonomous Underwater Vehicle in Manipulation Task: Simulations and Experimental Validation. Sensors. 2022; 22(12):4347. https://doi.org/10.3390/s22124347
Chicago/Turabian StyleGonzález-García, Josué, Alfonso Gómez-Espinosa, Luis Govinda García-Valdovinos, Tomás Salgado-Jiménez, Enrique Cuan-Urquizo, and Jesús Arturo Escobedo Cabello. 2022. "Model-Free High-Order Sliding Mode Controller for Station-Keeping of an Autonomous Underwater Vehicle in Manipulation Task: Simulations and Experimental Validation" Sensors 22, no. 12: 4347. https://doi.org/10.3390/s22124347
APA StyleGonzález-García, J., Gómez-Espinosa, A., García-Valdovinos, L. G., Salgado-Jiménez, T., Cuan-Urquizo, E., & Cabello, J. A. E. (2022). Model-Free High-Order Sliding Mode Controller for Station-Keeping of an Autonomous Underwater Vehicle in Manipulation Task: Simulations and Experimental Validation. Sensors, 22(12), 4347. https://doi.org/10.3390/s22124347


