
Comparative Study on Recognition Models of Black-Odorous Water in Hangzhou Based on GF-2 Satellite Data

Abstract
:1. Introduction
2. Study Area and Data
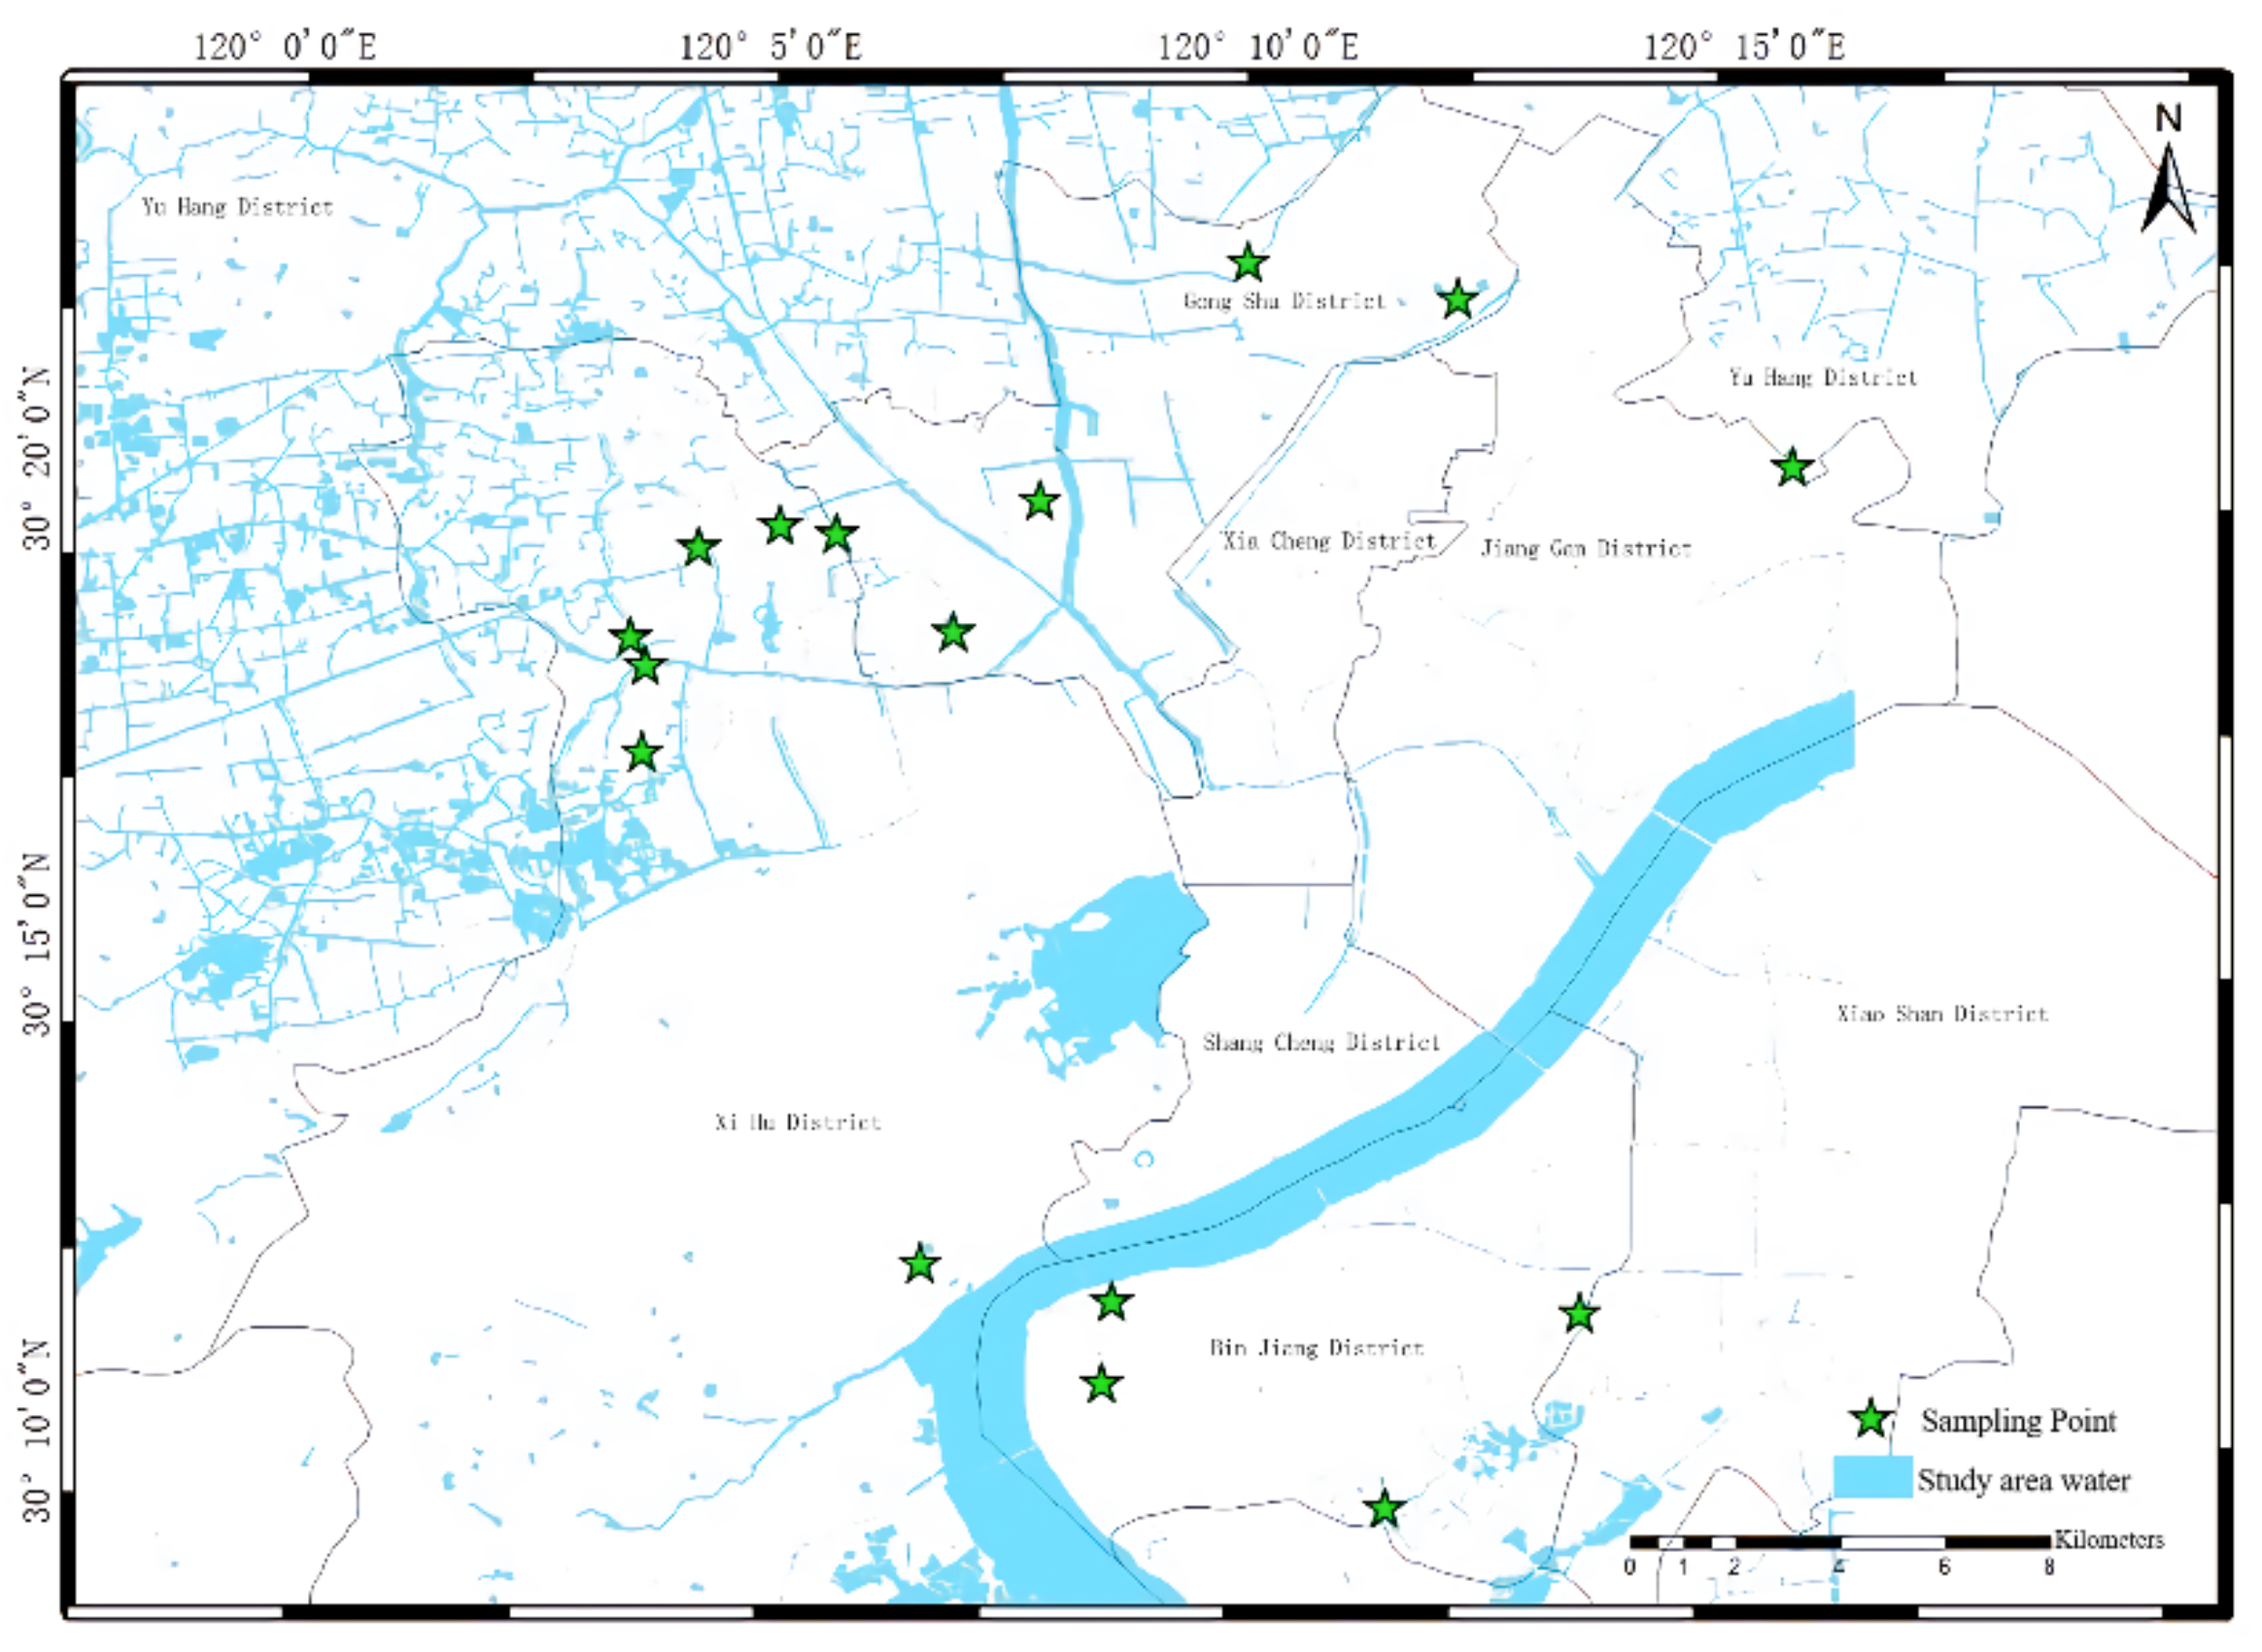
2.1. Study Area
2.2. Field Data
2.3. High-Resolution Image Data
2.4. Model Introduction
2.4.1. Single-Band Threshold Method
2.4.2. NDBWI
2.4.3. BOI
2.4.4. CIE
3. Results and Discussion
3.1. Analysis of the Typical Spectral Characteristics of Black-Odorous Water Body
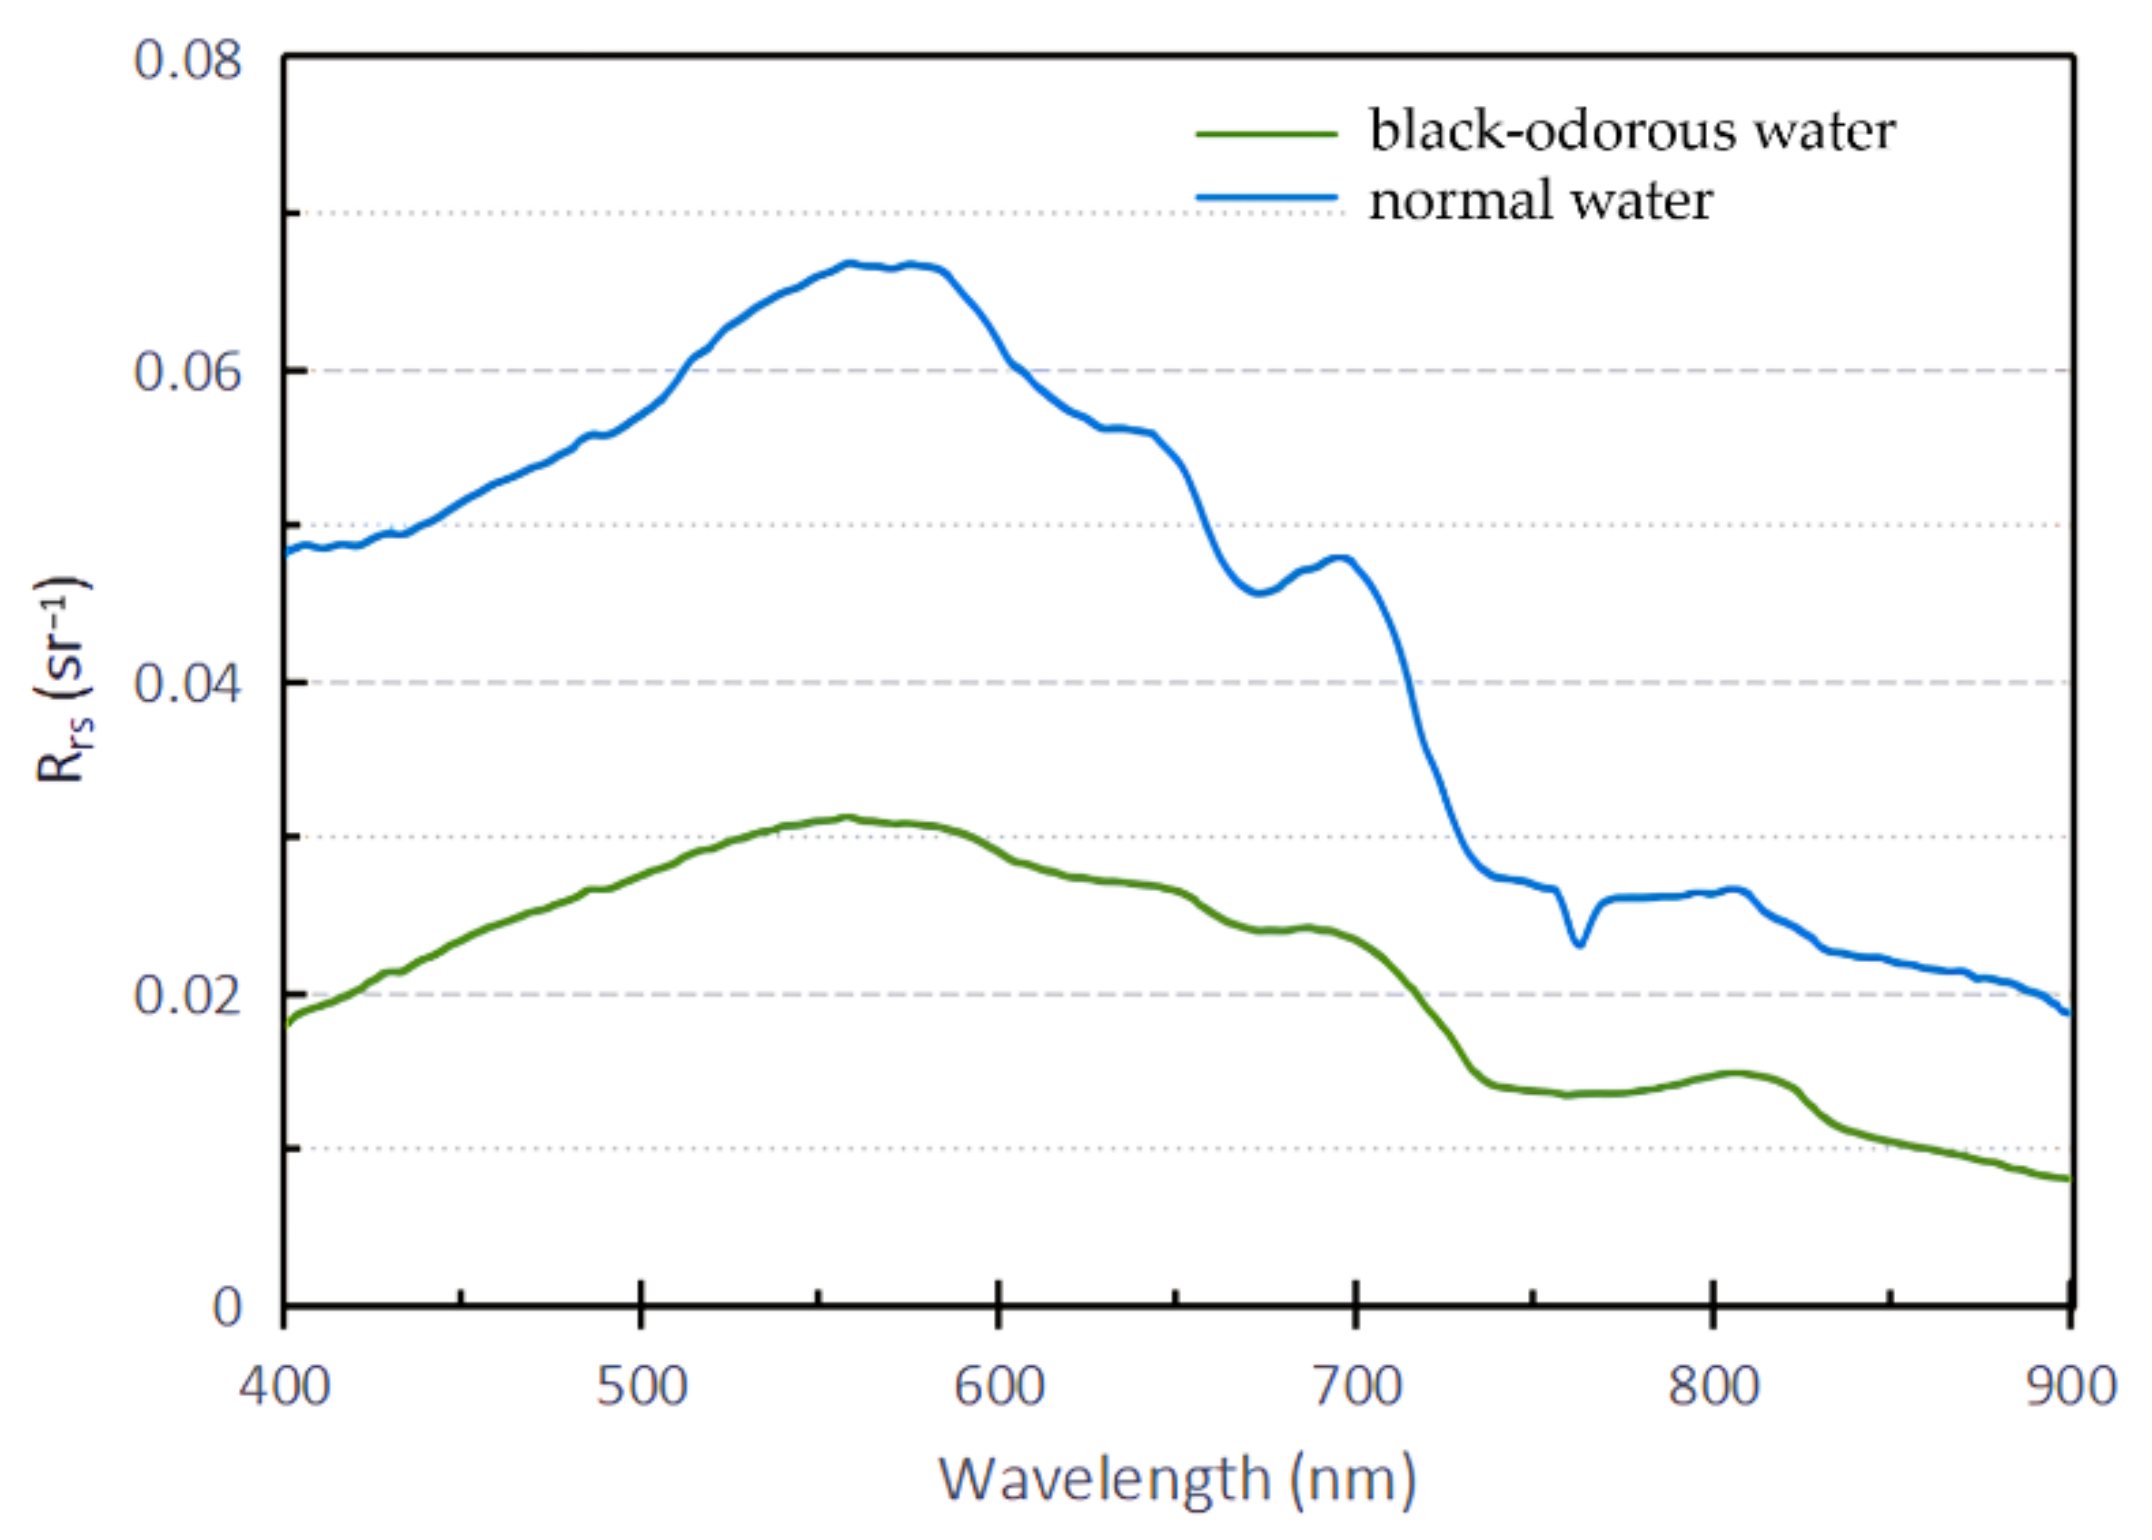
3.1.1. Analysis of Reflectance Spectral Characteristics
3.1.2. Spectral Differential Analysis
3.1.3. Cause Analysis
3.2. Black-Odorous Water Identification Model
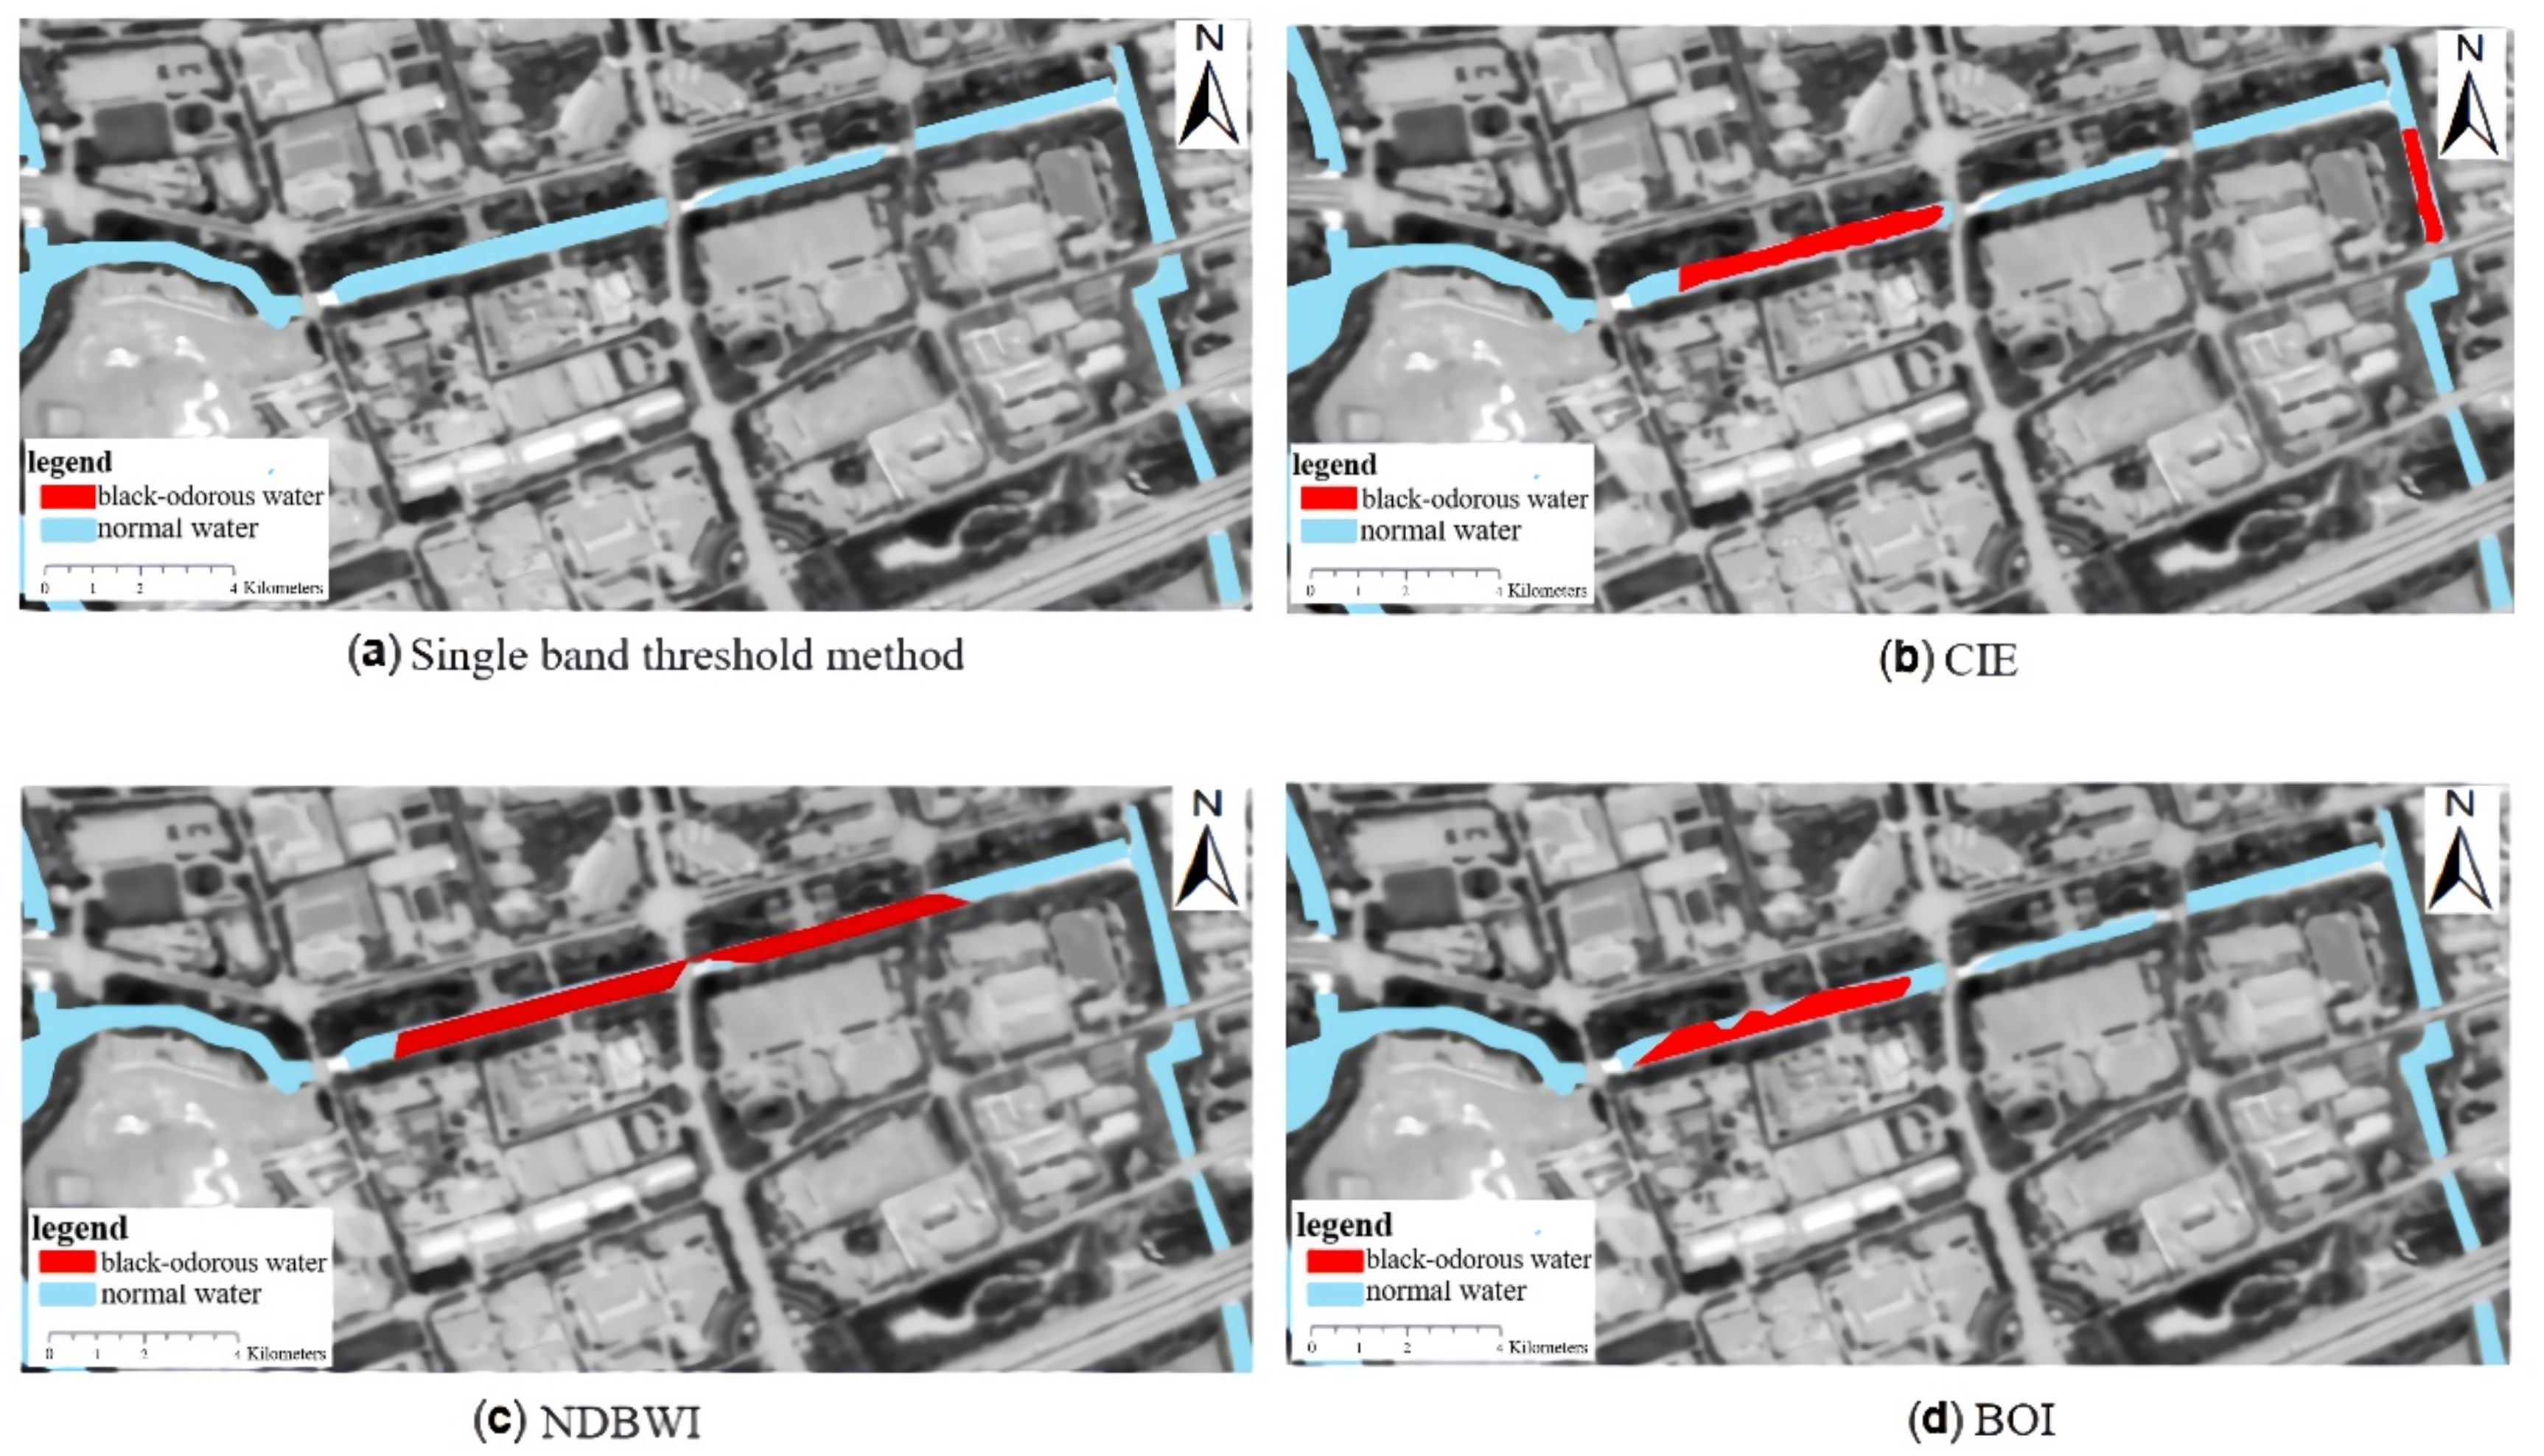
3.2.1. Recognition Model
- (1)
- Single-band threshold method
- (2)
- NDBWI
- (3)
- BOI
- (4)
- CIE
3.2.2. Precision Analysis
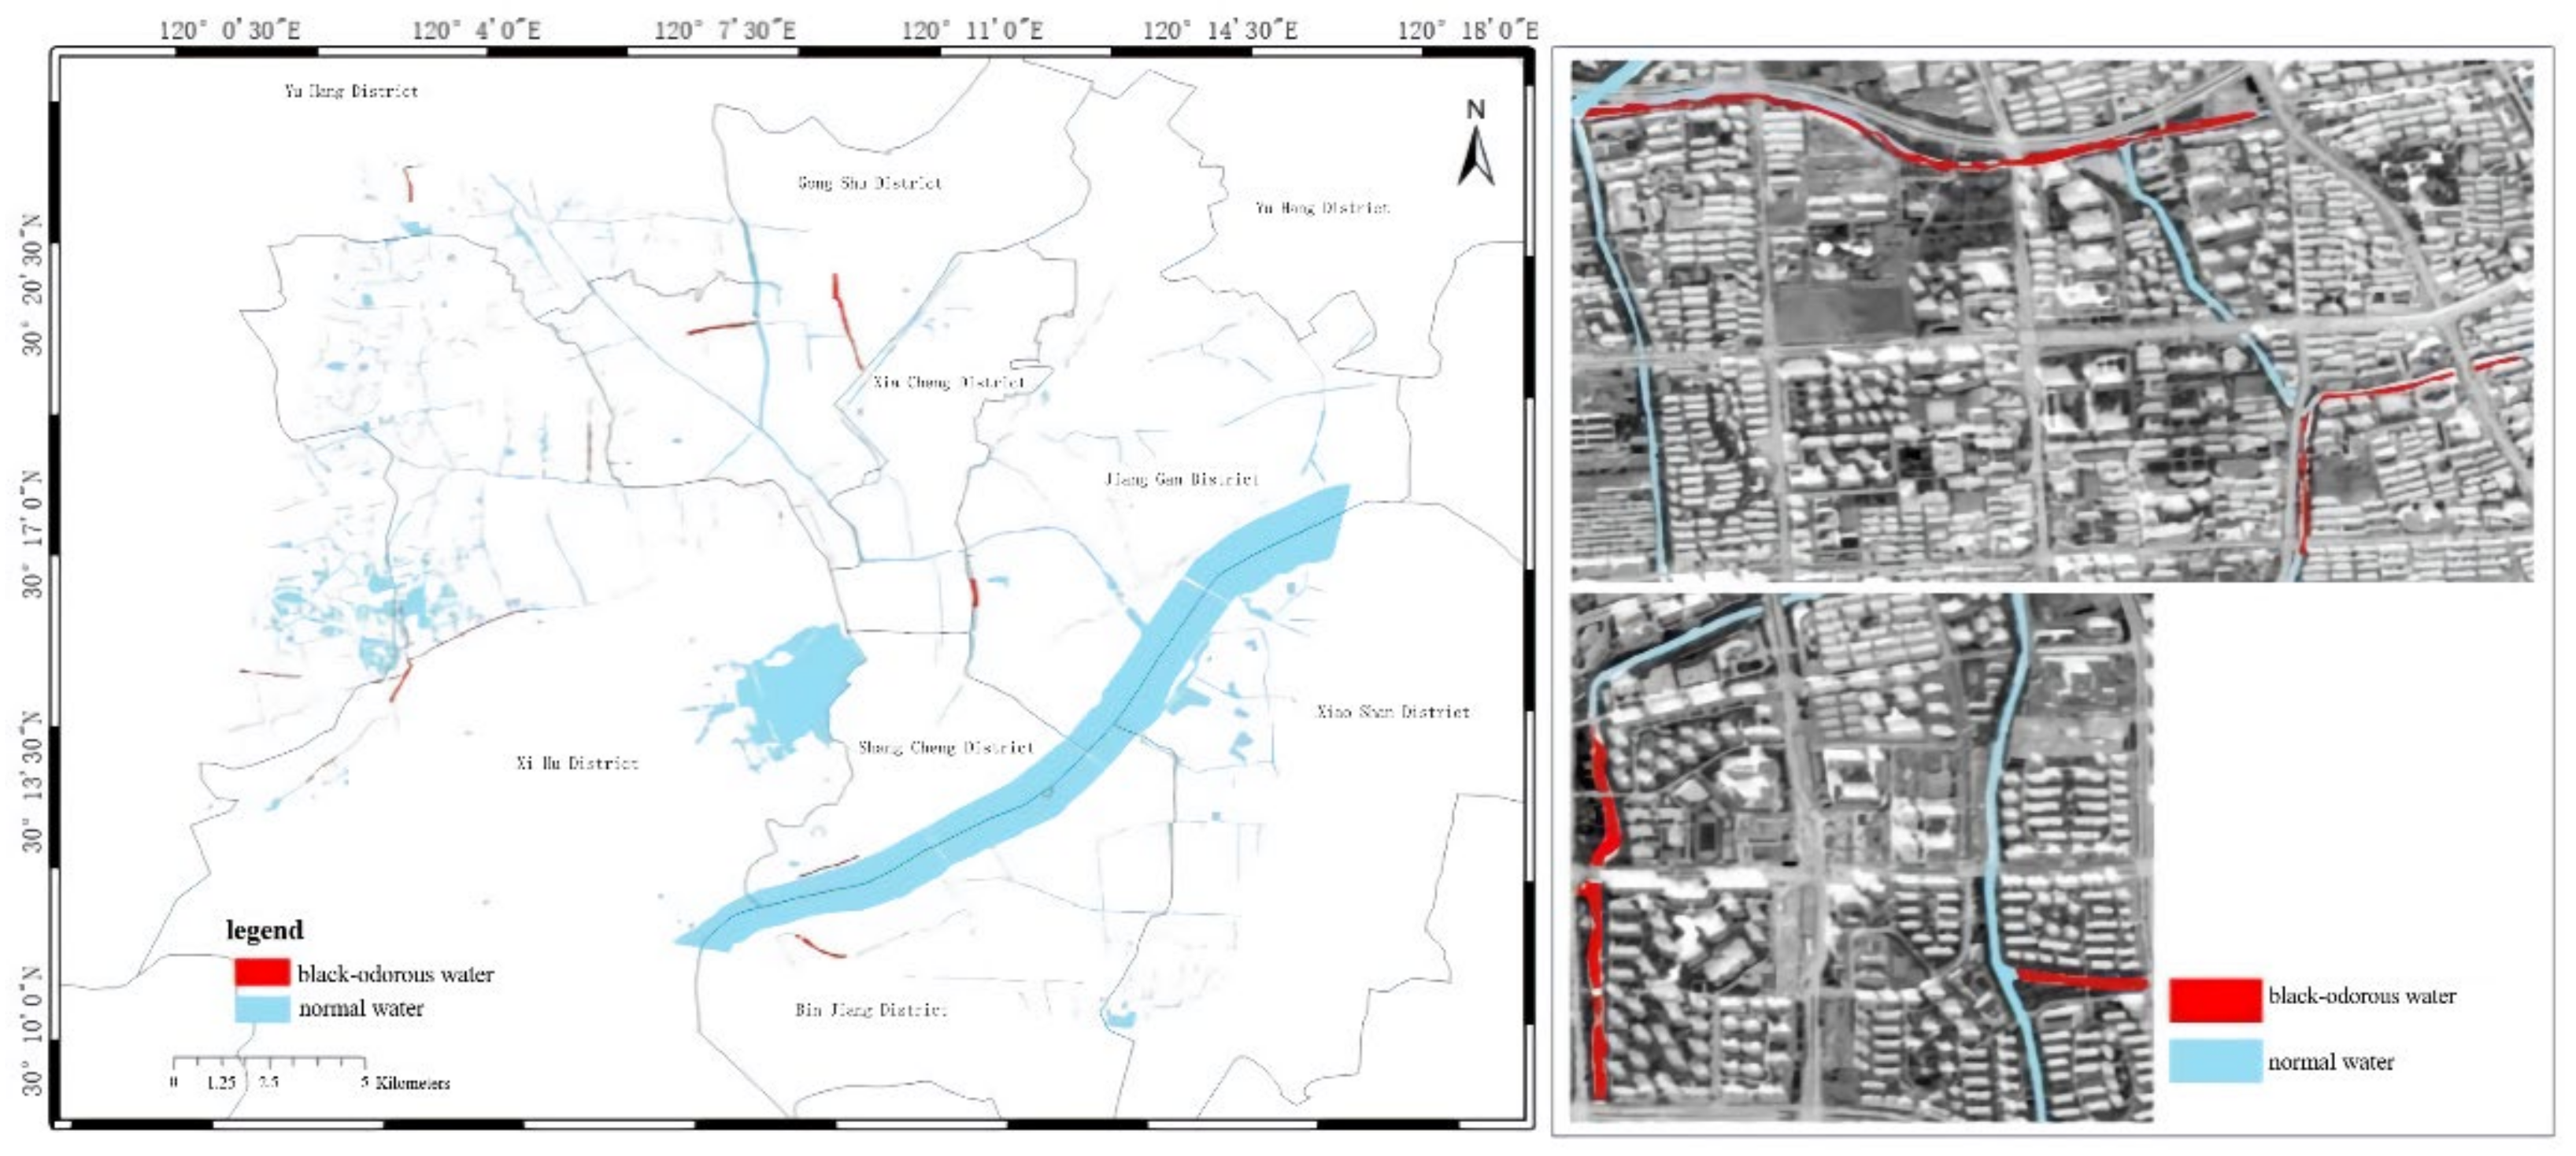
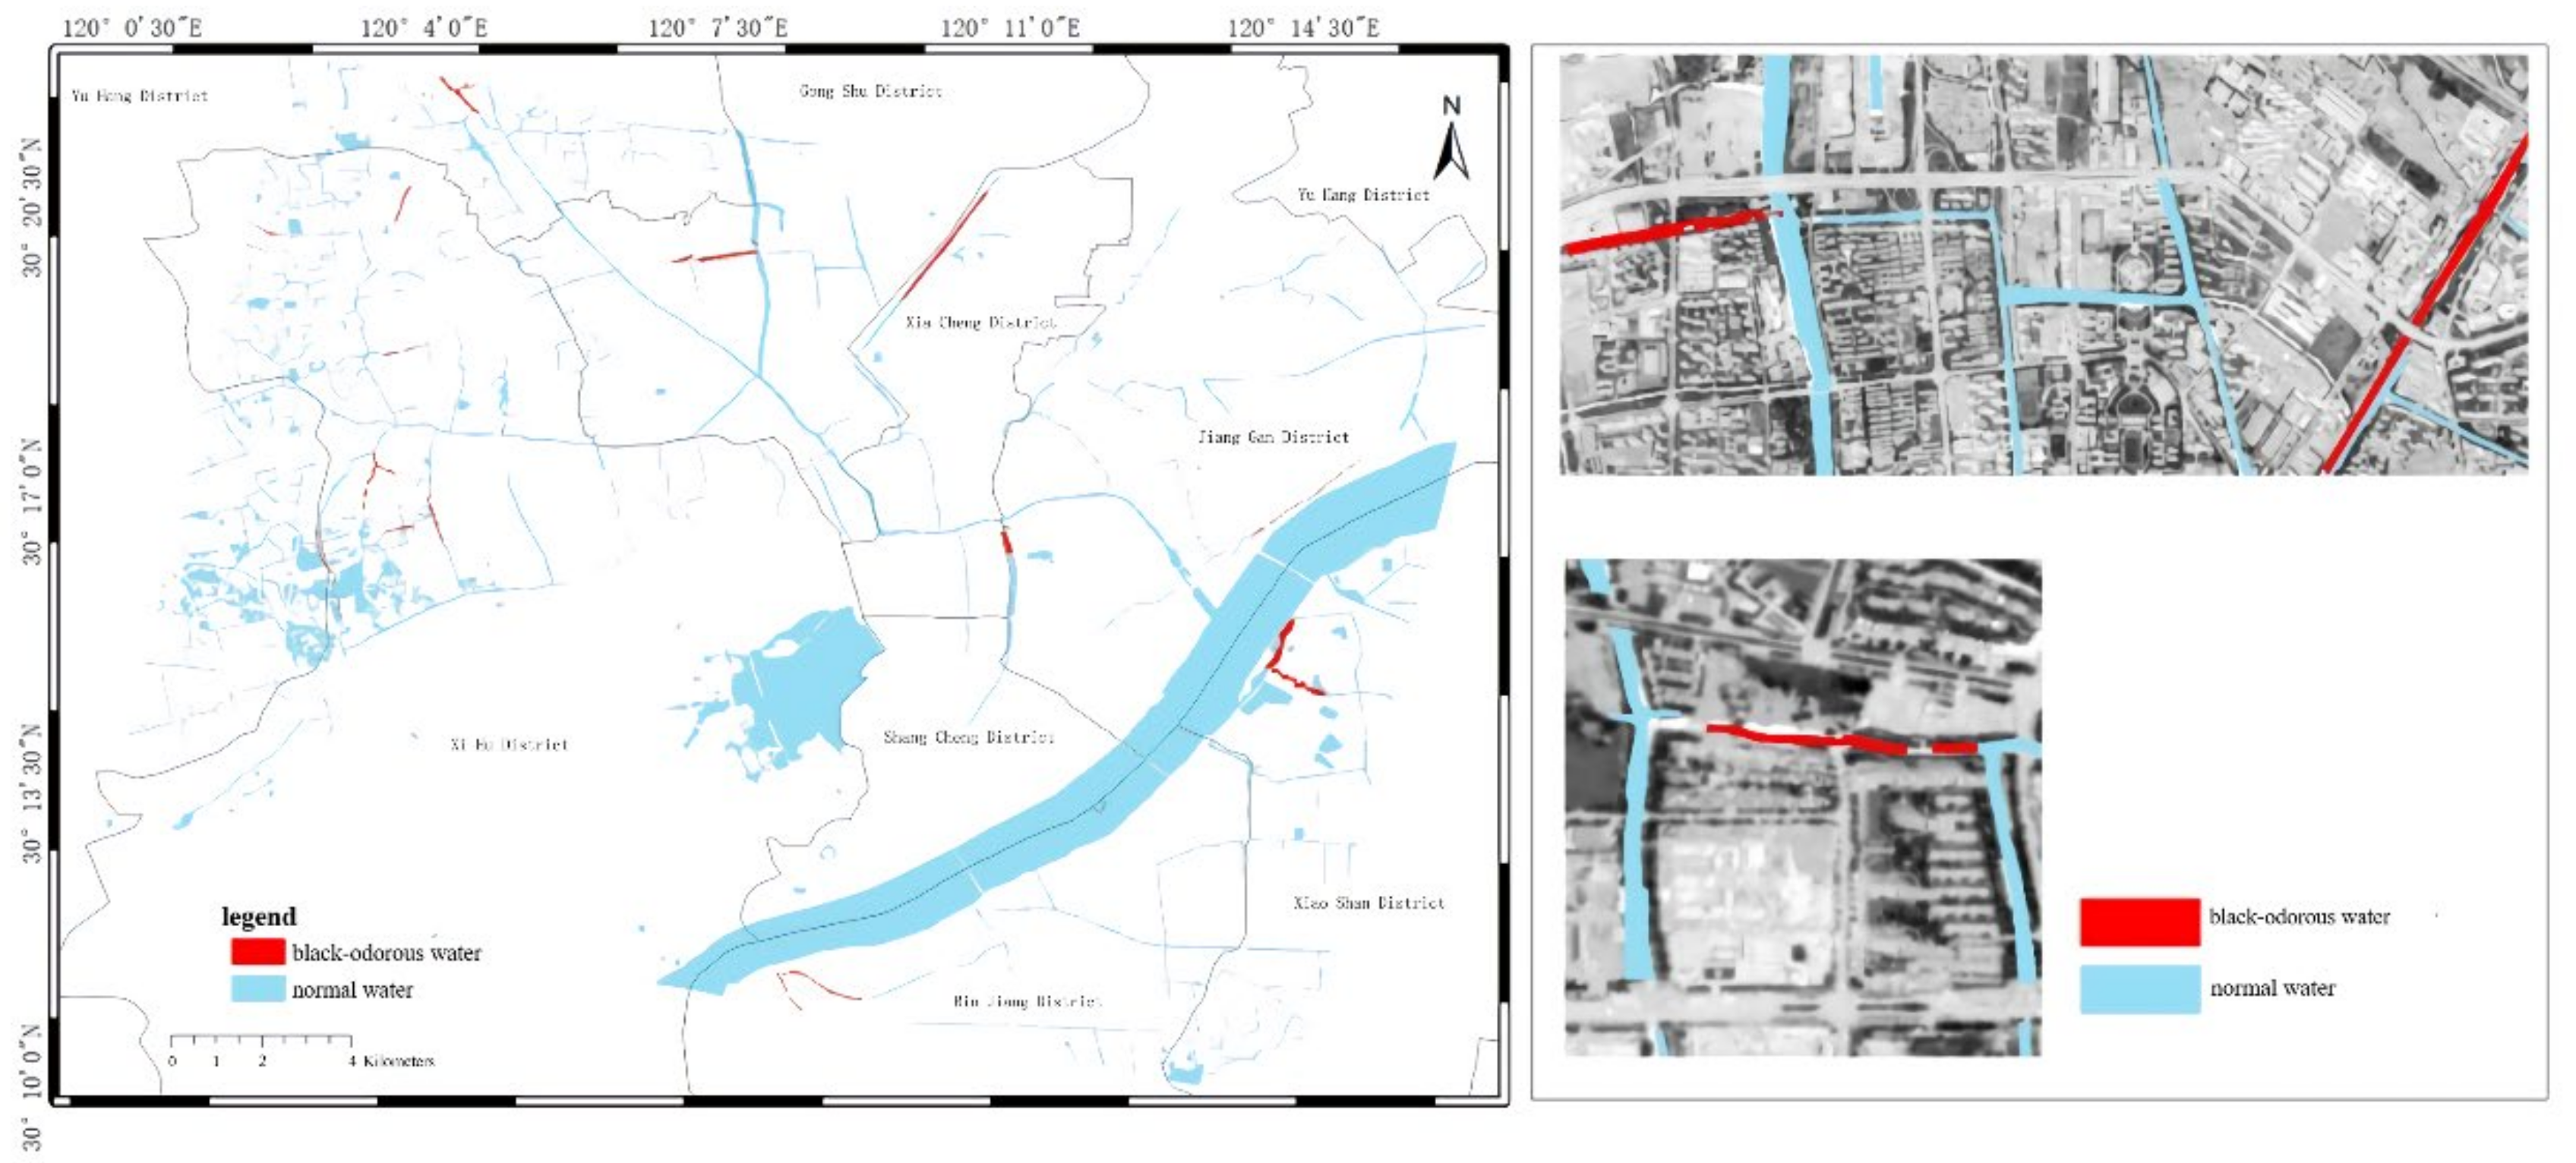
3.2.3. Model Application
4. Conclusions
- (1)
- The remote sensing reflectance of black-odorous water was found to be lower than that of ordinary water (<0.04 sr−1), and the variation range of its remote sensing reflectance was narrower than that of ordinary water. In other words, the slope was low. In the visible and near-infrared band ranges, the peaks of the reflectance curve of black-odorous water showed a “red shift” phenomenon.”
- (2)
- The single-band threshold method, CIE, NDBWI, and BOI were compared and analyzed. The NDBWI and BOI had the highest identification accuracy.
- (3)
- The number of black-odorous water bodies in Hangzhou showed a decreasing trend, and there were no black-odorous water bodies in the upper city in 2018. The distribution of black-odorous water was concentrated in relatively narrow rivers with dense population and residential areas, factories, and construction sites on both sides. Moreover, different sections of the same river showed different water quality.
- (4)
- The results of this study show that the area of the black-odorous water body in Hangzhou is decreasing year by year, which is consistent with the bulletin on the environmental condition of Hangzhou published by the Hangzhou Environmental Protection Bureau, proving that the water regulation action carried out in Hangzhou has achieved stable results. However, at the same time, the results also show that there is a “black” rebound in a few rivers, and the above results are consistent with the conclusions of Yu [32] et al.
- (5)
- At the field level, there are few measured data and sample points, and some of the data is invalid due to weather and operation reasons, so the accuracy of the established model and the selected threshold is not high, and there is a certain error. In addition, the study area of this paper is small and does not cover the entirety of the water bodies in Hangzhou, which cannot represent the situation of black-odorous water in Hangzhou. In the aspect of internal operation, there is a certain time interval between the imaging time and the measurement time, so there may be a change in the reflectivity of the water body in a short time, resulting in data errors.
- (6)
- Among all the models verified above, the NDBWI model and the BOI model are not only showing high accuracy, but are also convenient to use and fast in calculation. It is of great practical value for the rapid tracking and monitoring of urban black-odorous water for future work.
Author Contributions
Funding
Institutional Review Board Statement
Informed Consent Statement
Data Availability Statement
Conflicts of Interest
References
- State Council of the PRC. Action Plan for Prevention and Control of Water Pollution; State Council: Beijing, China, 2015. (In Chinese) [Google Scholar]
- Xiuyan, S. Black-odorous water bodies in 98.2 percent of cities at and above the prefecture-level have been eliminated, and we will target counties’ built-up areas in the 14th Five-Year Plan period. People’s Daily, 31 March 2021; p. 14. (In Chinese) [Google Scholar]
- Notice of Hangzhou Municipal People’s Government on printing and distributing Hangzhou Municipal Water Pollution Prevention and Control Action Plan. Hangzhou People’s Gov. Bull. 1 November 2016; pp. 14–29. (In Chinese)
- Jin, H.X.; Pan, J. Remote sensing monitoring of urban black-odorous water Based on GF-2 satellite fusion data. Sci. Technol. Manag. Land Resour. 2017, 34, 107–117. (In Chinese) [Google Scholar]
- Ministry of Housing and Urban-Rural Development of China. Guideline for Urban Black and Odorous Water Treatment; Ministry Housing Urban-Rural Development of the People’s Republic of China: Beijing, China, 2015. (In Chinese) [Google Scholar]
- Li, H.Q. Preliminary study on the Application of remote Sensing Technology in Water Environment Protection. Express Water Resour. Hydropower Inf. 2003, 24, 2. (In Chinese) [Google Scholar]
- Li, X.W.; Niu, Z.C.; Sheng, S.; Jin, Y. Satellite remote sensing monitoring of lake flooding in Tai Lake. Adm. Tech. Environ. Monit. 2012, 24, 12–17. (In Chinese) [Google Scholar]
- Zhu, L.; Li, Y.M.; Zhao, S.H.; Guo, Y.L. Water quality monitoring of Taihu Lake based on GF-1 SATELLITE WFV data. Remote Sens. Land Resour. 2015, 27, 113–120. (In Chinese) [Google Scholar]
- Wang, Y.F.; Li, Y.M.; Lv, H.; Wu, C.Q.; Jin, X. Suitability of inland water quality monitoring based on Environmental No.1 satellite hyperspectral remote sensing data: A case study of Chaohu Lake. J. Lake Sci. 2011, 23, 789–795. (In Chinese) [Google Scholar]
- Yao, Y.; Shen, Q.; Zhu, L.; Gao, H.J.; Cao, H.Y.; Han, H.; Sun, J.G.; Li, J.S. Remote sensing identification of Black-odorous water bodies in Shenyang by GF-2. J. Remote Sens. 2019, 23, 230–242. (In Chinese) [Google Scholar]
- Wen, S. Remote Sensing Recognition of Urban Black-Odorous Water Based on GF-2 Image—Take Nanjing as an Example. Master’s Thesis, Nanjing Normal University, Nanjing, China, 2018. (In Chinese). [Google Scholar]
- Wen, S. Remote sensing recognition of urban black and smelly water Based on high-resolution image: A case study of Nanjing. Acta Sci. Circumstantiae 2018, 39, 57–67. (In Chinese) [Google Scholar]
- Gi, G. Research and Application of Black Smelly Water Identification Method Based on Remote Sensing. Master’s Thesis, Lanzhou Jiaotong University, Lanzhou, China, 2017. (In Chinese). [Google Scholar]
- Shen, Q.; Yao, Y.; Li, J.; Zhang, F.; Wang, S.; Wu, Y.; Ye, H.; Zhang, B. A CIE Color Purity Algorithm to Detect Black and Odorous Water in Urban Rivers Using High-Resolution Multispectral Remote Sensing Images. IEEE Trans. Geosci. Remote Sens. China 2019, 57, 6577–6590. [Google Scholar] [CrossRef]
- Qi, K.K.; Shen, Q.; Luo, X.J.; Li, J.Y.; Yao, Y.; Yang, C. Classification and recognition of black-odorous water bodies in Shenyang based on GF-2 image by remote sensing. Remote Sens. Technol. Appl. 2020, 35, 424–434. (In Chinese) [Google Scholar]
- Qi, K.K. Remote Sensing Classification Recognition of Urban Black and Odorous Water Body Based on Multi-Source High-Resolution Images. Master’s Thesis, Southwest Jiaotong University, Sichuan, China, 2019. (In Chinese). [Google Scholar]
- Lu, Y.N. Remote Sensing Recognition and Classification of Urban Black Odourous Water Body Based on Planetscope Images: A Case Study in Qinzhou, Guangxi Province. Master’s Thesis, Guangxi University, Guangxi, China, 2019. (In Chinese). [Google Scholar]
- Lv, H.; Jiang, N.; Li, X.G. Remote sensing monitoring of water quality in inland lakes. Adv. Earth Sci. 2005, 2, 185–192. (In Chinese) [Google Scholar]
- Leif, G.; Olmanson, M.E.; Bauer, P.L.B. A 20-year Landsat water clarity census of Minnesota’s 10,000 lakes. Remote Sens. Environ. 2008, 2008, 4086–4097. [Google Scholar]
- Dekker, A.G.; Peters, S. The Use of the Thematic Mapper for the Analysis of Eutrophic Lakes: A Case Study in The Netherlands. Int. J. Remote Sens. 1993, 14, 799–822. [Google Scholar] [CrossRef]
- Kutser, T.; Paavel, B.; Verpoorter, C.; Ligi, M.; Soomets, T.; Toming, K.; Casal, G. Remote Sensing of Black Lakes and Using 810 nm Reflectance Peak for Retrieving Water Quality Parameters of Optically Complex Waters. Remote Sens. 2016, 39, 57–67. [Google Scholar] [CrossRef]
- Tassan, S. A numerical model for the detection of sediment concentration in stratified river plumes using Thematic Mapper data. Int. J. Remote Sens. 1997, 18, 2699–2705. [Google Scholar] [CrossRef]
- Malthus, T.J.; Dekker, A.G. First derivative indices for the remote sensing of inland water quality using high spectral resolution reflectance. Environ. Int. 1995, 21, 221–232. [Google Scholar] [CrossRef]
- Roeck, T.D.; Tim, V.; Canters, F. Full Hierarchic Versus Non-Hierarchic Classification Approaches for Mapping Sealed Surfaces at the Rural-Urban Fringe Using High-Resolution Satellite Data. Sensors 2009, 9, 22–45. [Google Scholar] [CrossRef]
- Xian, G. Satellite remotely-sensed land surface parameters and their climatic effects for three metropolitan regions. Adv. Space Res. 2008, 41, 1861–1869. [Google Scholar] [CrossRef]
- Tassan, S. An improved in-water algorithm for the determination of chlorophyll and suspended sediment concentration from Thematic Mapper data in coastal waters. Int. J. Remote Sens. 1993, 14, 1221–1229. [Google Scholar] [CrossRef]
- Wang, Z.; Du, J.; Wang, C.; Qiu, S.K.; Li, S.Q.; Ma, Y.F. Research progress report on urban water information extraction methods by using remote sensing way. J. Cent. China Norm. Univ. (Nat. Sci.) 2021, 55, 620–629. (In Chinese) [Google Scholar]
- Yu, J.L.; Yu, X.Y.; Dai, H.Y. Long-term management problems and countermeasures of black and odorous River governance in HangzhouP. Mod. Agric. Sci. Technol. 2017, 20, 161–163. (In Chinese) [Google Scholar]
- Tang, W.J.; Tian, G.L.; Wang, X.Y.; Wang, X.M.; Song, Q.J. Water spectral measurement and analysis I: Measurement method above water surface. J. Remote Sens. 2004, 1, 37–44. (In Chinese) [Google Scholar]
- Wen, B.G. Study on Spectral Characteristic Analysis Technology of Ground Object. Master’s Thesis, Information Engineering University, Henan, China, 2009. (In Chinese). [Google Scholar]
- Gitelson, A.; Stark, R.; Dor, I. Quantitative near-surface remote sensing of wastewater quality in oxidation ponds and reservoirs: A case study of the Naan system. Water Environ. Res. 1997, 69, 1263–1271. [Google Scholar] [CrossRef]
- Yu, J.; Yu, X.; Dai, H. Problems and Countermeasures of long-term Management of Heidi River in Hangzhou. Mod. Agric. Sci. Technol. 2017, 20, 161–163. [Google Scholar]


| Parameter | Indicators | |
|---|---|---|
| Spectral range | Panchromatic | 450–900 nm |
| Multispectral | Band 1: 450–520 nm | |
| Band 2: 520–590 nm | ||
| Band 3: 630–690 nm | ||
| Band 4: 770–890 nm | ||
| Spatial resolution | Panchromatic | 1 m |
| Multispectral | 4 m | |
| Bandwidth | 45 km | |
| Imaging Time | Location of Image Center | Image Range |
|---|---|---|
| 2 August 2015 | lon: 120.136° E lat: 30.2498° N | 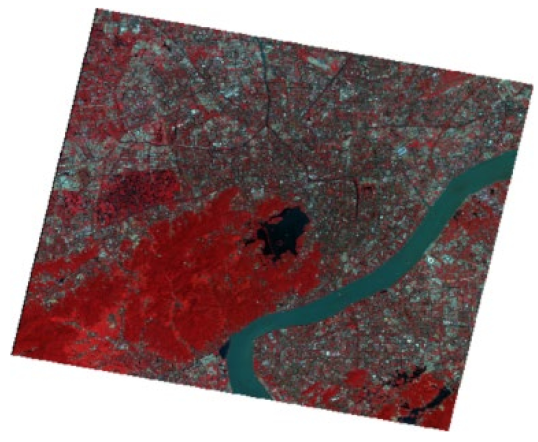 |
| 16 March 2016 | lon: 120.292° E lat: 30.2505° N |  |
| lon: 120.067° E lat: 30.2937° N |  | |
| 14 May 2018 | lon: 120.232° E lat: 30.2453° N |  |
| lon: 119.974° E lat: 30.298° N |  |
| Water Type | DO Content (mg/L) |
|---|---|
| Black-odorous water | 3.4028 |
| General water | 7.0950 |
| Sample Name | Single-Band Threshold Method | NDBWI | BOI | CIE | Actual Water Quality | ||||
|---|---|---|---|---|---|---|---|---|---|
| Calculation Results (sr−1) | Identification Results | Calculation Results | Identification Results | Calculation Results | Identification Results | Calculation Results (nm) | Identification Results | ||
| P1 | 0.0539 | normal | 0.1333 | normal | 0.087 | normal | 504 | normal | normal |
| P2 | 0.0187 | odorous | 0.1353 | normal | 0.096 | normal | 550 | normal | odorous |
| P3 | 0.0168 | odorous | 0.2036 | odorous | 0.144 | odorous | 542 | normal | odorous |
| P4 | 0.0362 | odorous | 0.1681 | odorous | 0.109 | odorous | 502 | normal | odorous |
| P5 | 0.0409 | normal | 0.1615 | odorous | 0.125 | odorous | 537 | odorous | odorous |
| P6 | 0.0346 | odorous | 0.1240 | normal | 0.096 | normal | 499 | normal | normal |
| P7 | 0.0667 | normal | 0.1383 | normal | 0.090 | normal | 500 | normal | normal |
| P8 | 0.0152 | odorous | 0.2303 | odorous | 0.183 | odorous | 558 | normal | odorous |
Publisher’s Note: MDPI stays neutral with regard to jurisdictional claims in published maps and institutional affiliations. |
© 2022 by the authors. Licensee MDPI, Basel, Switzerland. This article is an open access article distributed under the terms and conditions of the Creative Commons Attribution (CC BY) license (https://creativecommons.org/licenses/by/4.0/).
Share and Cite
Yu, Z.; Huang, Q.; Peng, X.; Liu, H.; Ai, Q.; Zhou, B.; Yuan, X.; Fang, M.; Wang, B. Comparative Study on Recognition Models of Black-Odorous Water in Hangzhou Based on GF-2 Satellite Data. Sensors 2022, 22, 4593. https://doi.org/10.3390/s22124593
Yu Z, Huang Q, Peng X, Liu H, Ai Q, Zhou B, Yuan X, Fang M, Wang B. Comparative Study on Recognition Models of Black-Odorous Water in Hangzhou Based on GF-2 Satellite Data. Sensors. 2022; 22(12):4593. https://doi.org/10.3390/s22124593
Chicago/Turabian StyleYu, Zhifeng, Qiyu Huang, Xiaoxue Peng, Haijian Liu, Qin Ai, Bin Zhou, Xiaohong Yuan, Meihong Fang, and Ben Wang. 2022. "Comparative Study on Recognition Models of Black-Odorous Water in Hangzhou Based on GF-2 Satellite Data" Sensors 22, no. 12: 4593. https://doi.org/10.3390/s22124593