
Low-Cost Wireless Structural Health Monitoring of Bridges

 ,
,  , and
, and
Abstract
:1. Introduction
- (1)
- Piezoelectricity: This is one of the most popular types of accelerometers in the industry for measuring [24], based on specific materials’ piezoelectric effect. For measuring the dynamic changes in mechanical variables, the piezoelectric effect of particular materials is used [25]. The main advantage of these devices is that they can operate on a wide range of frequencies (up to 12 kHz) [26];
- (2)
- Piezoresistivity: The second most popular vibration acquisition sensors are piezoresistive (strain gauge) accelerometers. This kind of accelerometer measures the change in electrical resistance of a particular piezoresistive element when vibrations are induced [23];
- (3)
- Differential capacitive measurement: These accelerometers identify vibrations by measuring the capacitance changes of a seismic mass [23];
- (4)
- Micro-Electro-Mechanical Systems (MEMS) are silicon-based microsensors built from any principles mentioned above [23].
- Grimmelsman et al. [43] studied a low-cost accelerometer (ADXL335). In their work, this low-cost accelerometer’s performance and capability were compared with conventional instrument-grade accelerometers (PCB 393A03 and 3741E122G);
- For providing the structural modal analysis from several synchronized low-cost accelerometers (LIS344ALH) distributed along with a structure, a system was proposed by Girolami et al. [44];
- The research of Ozdagli et al. [45] used the accelerometer MPU6050 for a real-time, Low-cost, Efficient Wireless Intelligent Sensor (LEWIS). In the performed experiments, LEWIS was placed on a breadboard for signal acquisition. Moreover, its measurements were compared with a Linear Variable Differential Transformer (LDVT) sensor and a commercial accelerometer (PCB 3711B1110G);
- An updated version of LEWIS is proposed by Aguero et al. [46]. This work describes LEWIS 2, which solved three main drawbacks of the first LEWIS. It is mentioned in the introduction that LEWIS 2 has data storage, is battery-powered, and is more accurate than LEWIS. The measurements were compared to those of a LDVT sensor;
- Meng et al. [47] propose a low-cost acquisition system composed of a LSM9DS1 accelerometer and a Raspberry Pi 4. This system was evaluated with a commercial accelerometer (PCB 356B18);
- Recently a Cost Hyper Efficient Arduino Product (CHEAP) was introduced by Komarizadehasl et al. [23]. Different laboratory tests were performed to validate CHEAP’s performance, and the results of CHEAP were compared with those of two commercial seismic accelerometers (PCB 393A03 and PCB 356B18).

| No. | Accelerometer | Acceleration Range (g) | Sampling Frequency (Hz) | Spectral Noise (µg/√Hz) | NTP | Internet Access |
|---|---|---|---|---|---|---|
| 1 [43,48] | ADXL335 | ±3 g | 100 | 300 | No | No |
| 2 [44,49] | LIS344ALH | ±2 g | 100 | 50 | No | Yes |
| 3 [45,50] | MPU6050 | ±2 g | 100 | 400 | No | No |
| 4 [46,51] | MPU9250 | ±2 g | 500 | 300 | No | No |
| 5 [47,52] | LSM9DS1 | ±2 g | 952 | No data | Yes | Yes |
| 6 [23] | CHEAP | ±2 g | 85 | No data | No | No |
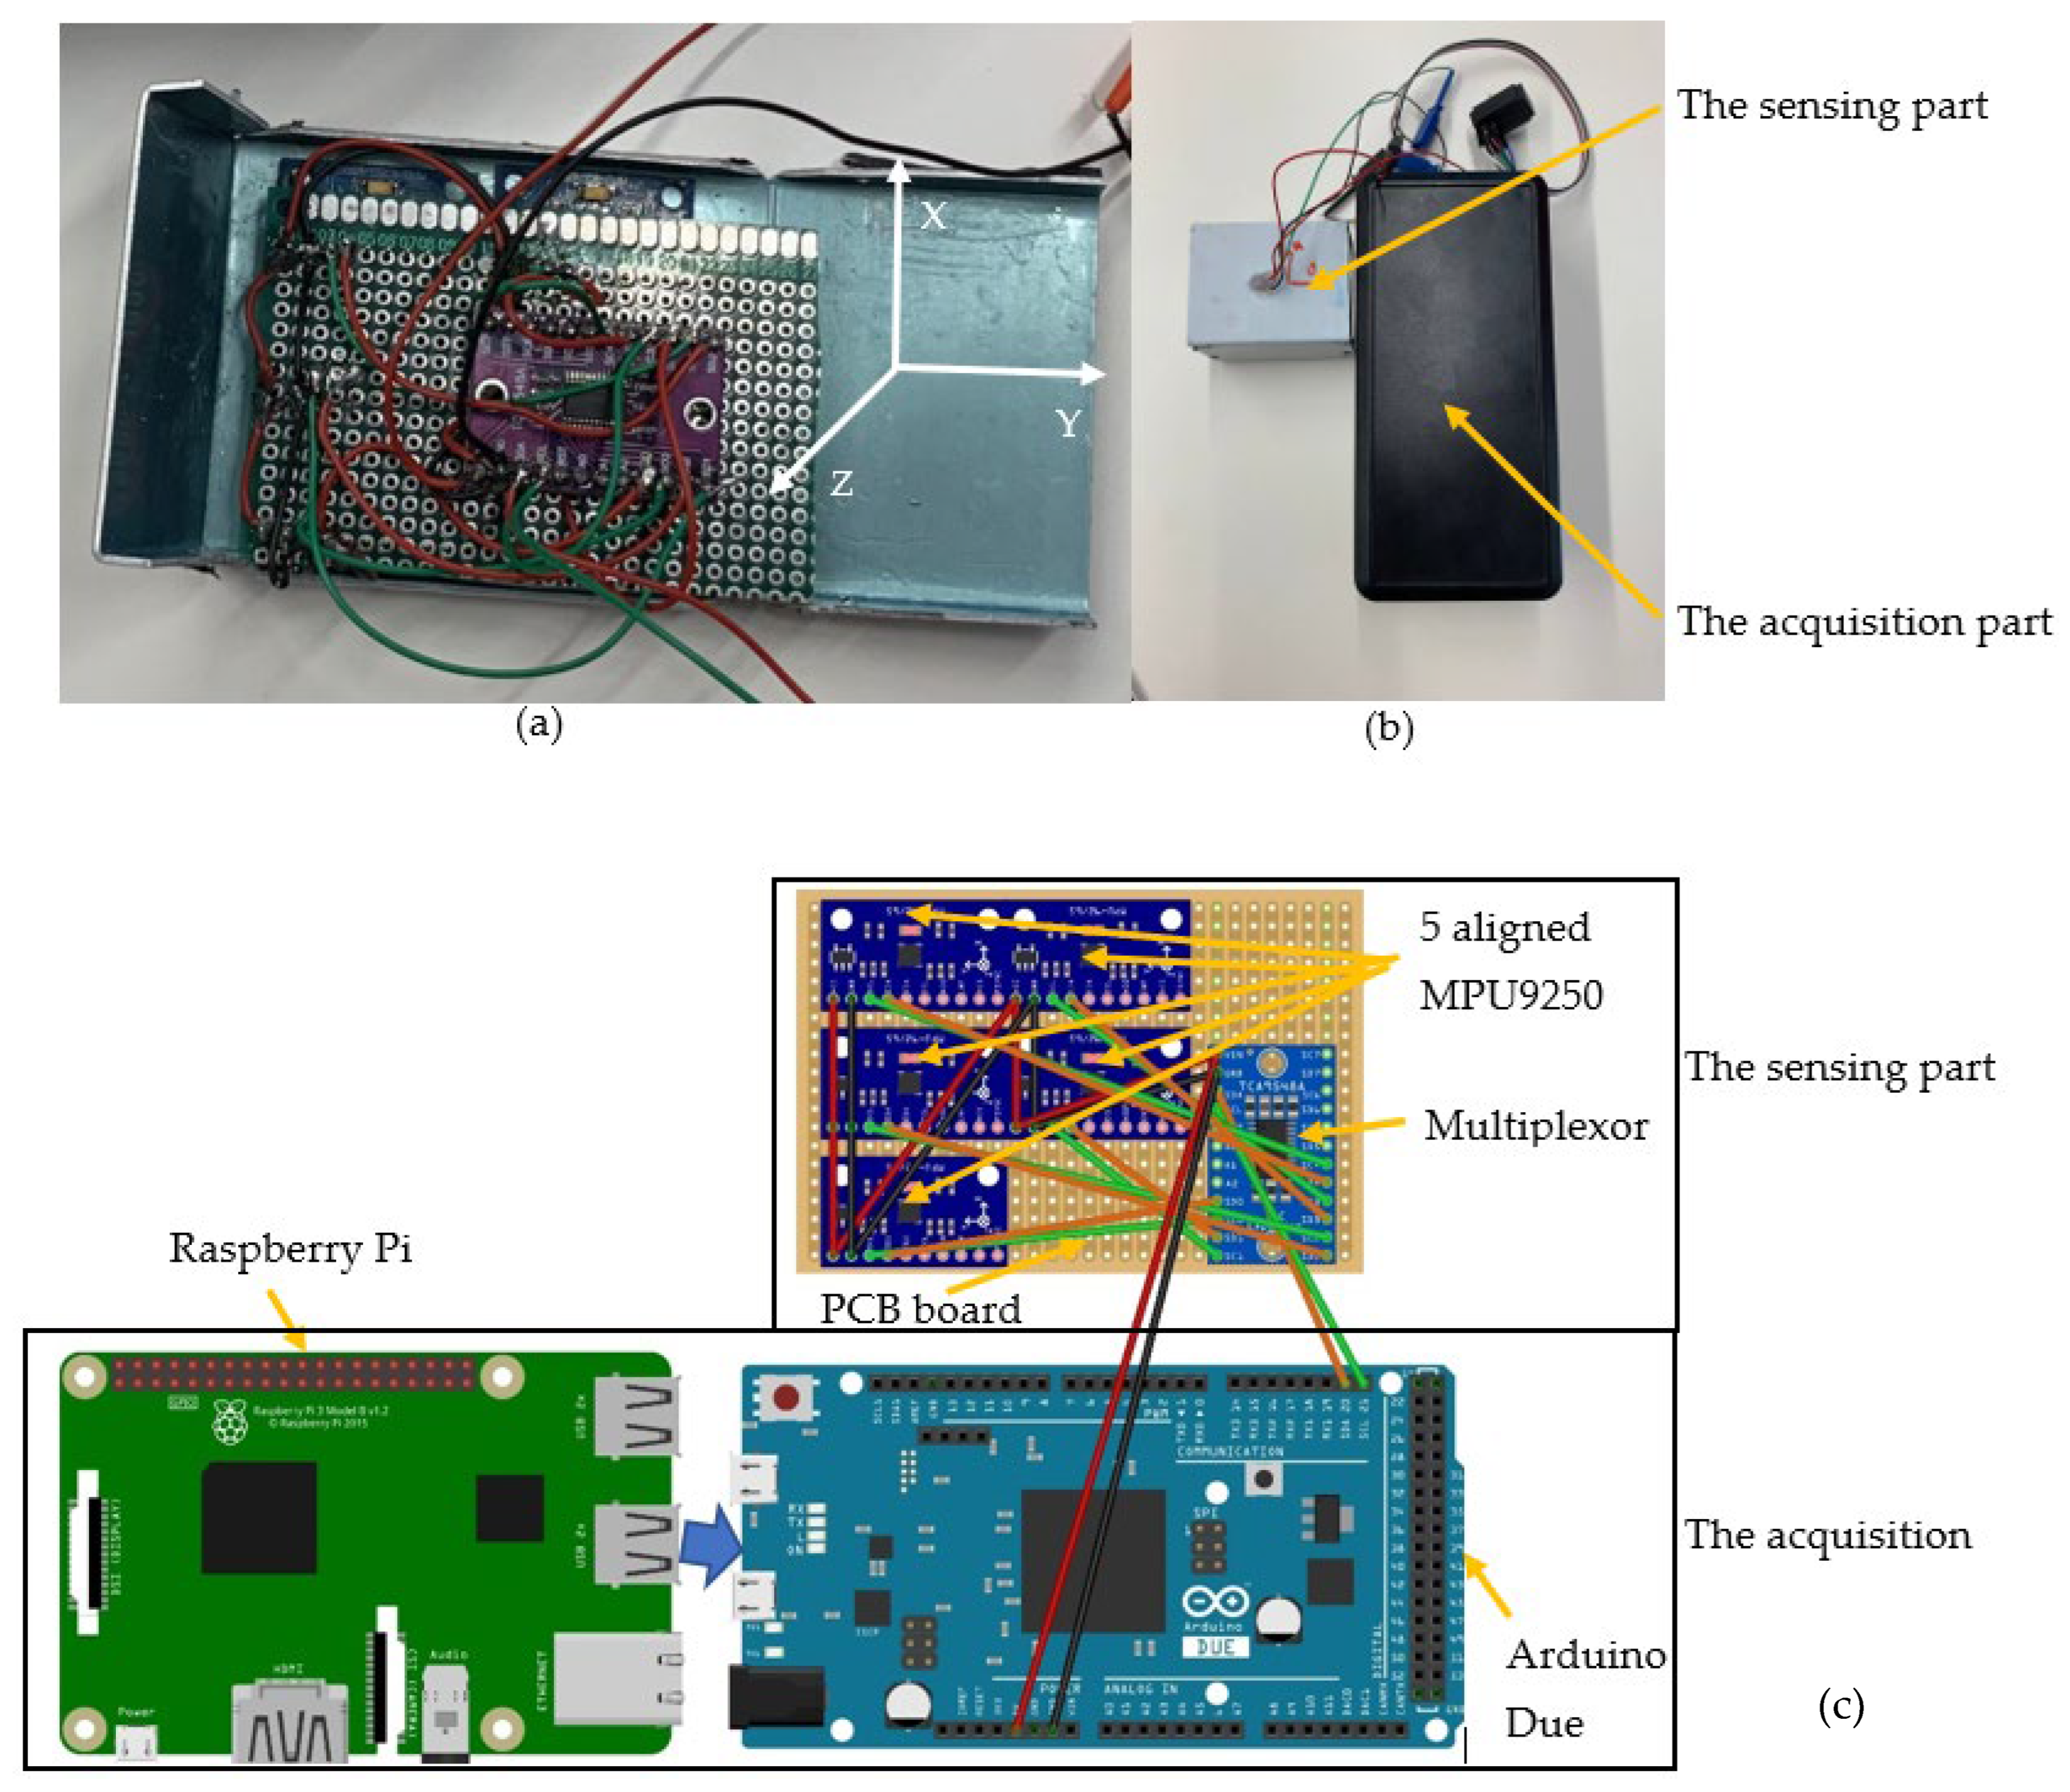
2. Triaxle Wireless Low-Cost Adaptable Reliable Accelerometer (LARA) with Post-Synchronization Capability
- (1)
- Increasing sampling frequency: frequency sampling of LARA is increased by rewriting the old library code and using a faster communication clock along with the main code;
- (2)
- No coding error: increasing the frequency sampling of a system can result in error reporting, interruptions, data loss, or fluctuation in the frequency sampling speed. In an experiment, LARA worked for an entire week and saved data with no errors or interruptions or data loss;
- (3)
- Schedule data acquisition: a code has been prepared on python to schedule and end vibration acquisition. This scheduling has two benefits. Firstly, it makes wireless sensor synchronization possible with free software. Secondly, it can be used for OMA applications. It should be noticed that when a structure is heavily excited by ambient causes, the accelerometers can extract more valuable data. Therefore, an accelerometer with schedule capability can help acquire data only when the structure is under high traffic or extreme activity;
- (4)
- Internal sensor synchronization lag enhancement: the accelerometers inside each LARA are not 100% synchronized. In fact, the Arduino executes codes one line at a time. When the main code is executed, the Arduino opens the library code and uses the information to get the first sensor’s acceleration, and after the second one, and so on. This operation takes time. In the CHEAP, the lag between each sensor-print was about 2200 microseconds. By the hardware and software improvement, the corresponding lag of LARA is decreased to 210 microseconds, which is 10.47 less than the lag of CHEAP. In fact, a lower lag time contributes to a better sensitivity of LARA for acquiring higher frequencies;
- (5)
- Post-synchronization of several LARAs: to use LARA’s outputs in the OMA application, various accelerometers’ data must first be synchronized and have the same sampling frequency. Since LARA has access to the accurate time of the Internet, the acquired data can be stamped with the precise time of the Internet with microsecond resolution. This timestamp helps calculate the sampling frequency of each LARA precisely and, more importantly, the fluctuation of the vibration acquisition process. Even though the reported sampling frequency of each LARA is calculated by measuring the number of acquired data during the acquisition process, the fluctuation is calculated by measuring the needed time for saving 100 data. It is seen through laboratory experiments that when the input power is insufficient, the fluctuation is unsteady. This insufficient input power can be due to low speed of the used USB wire, the long length of the USB cable, the imperfection of the used power bank, or simply using a power source that cannot provide 2.5 A and 5 V [9].
3. Laboratory Tests and Results
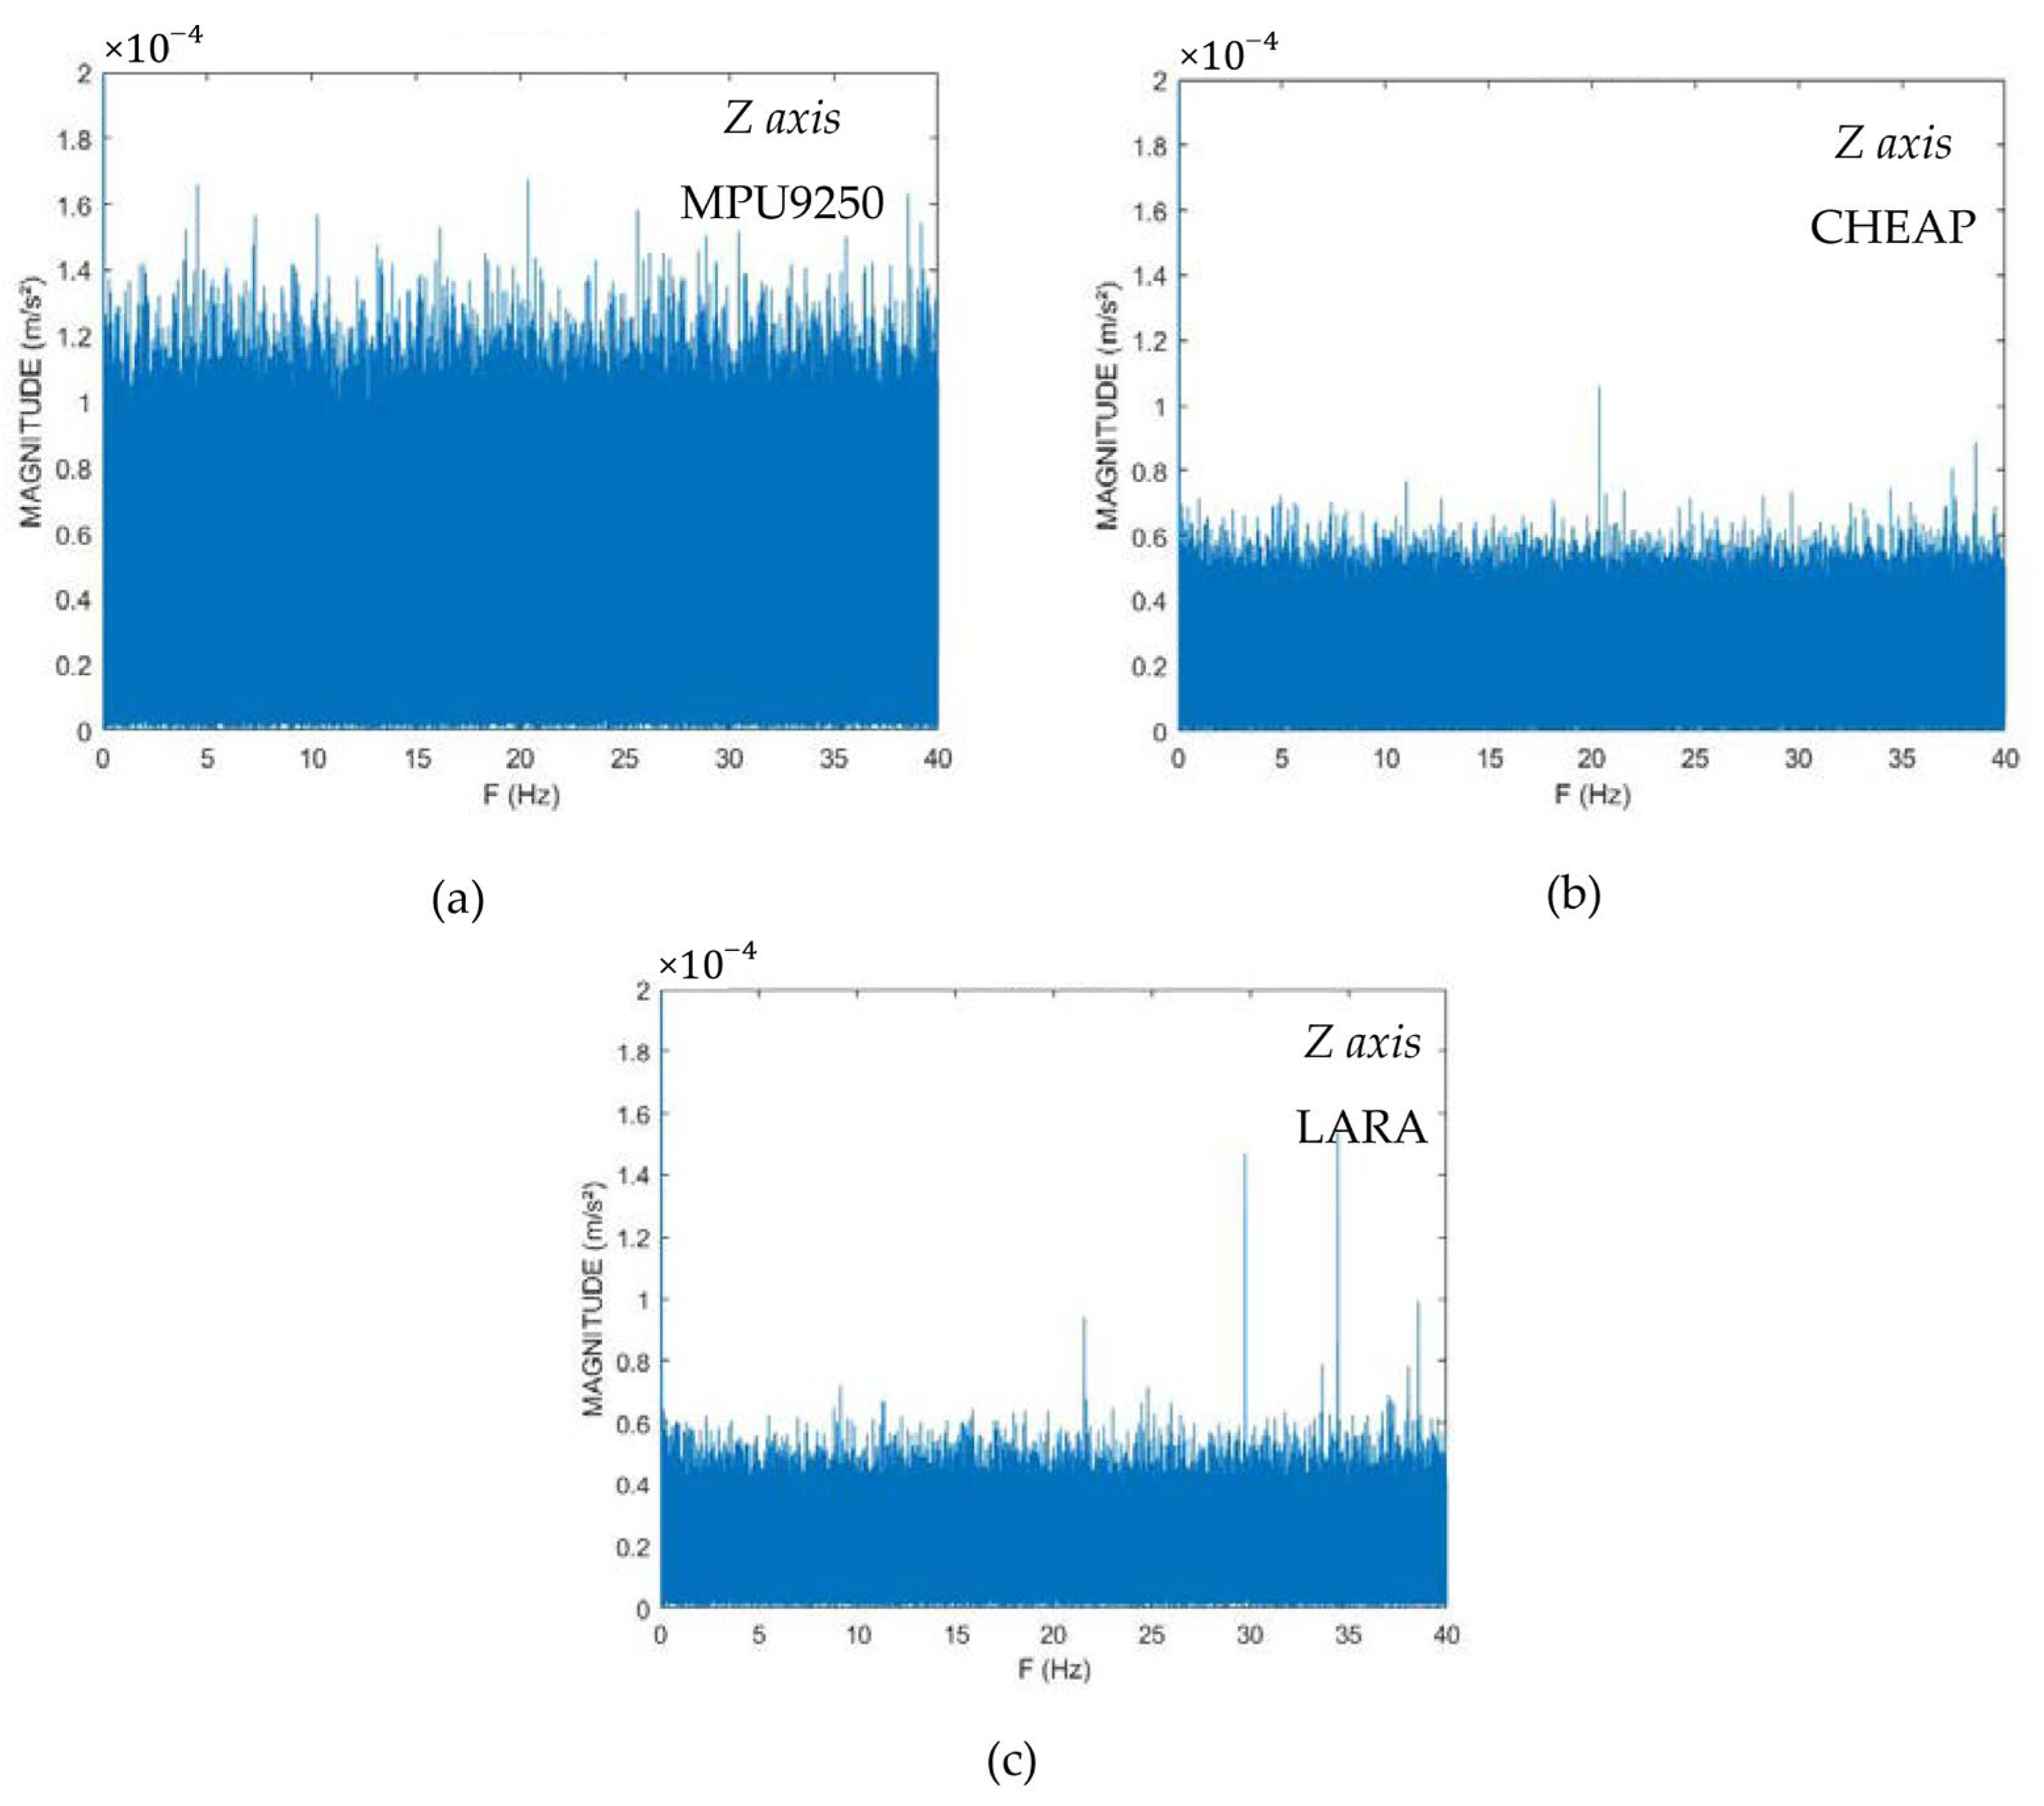
3.1. Sensitivity, ND, and Resolution Evaluation
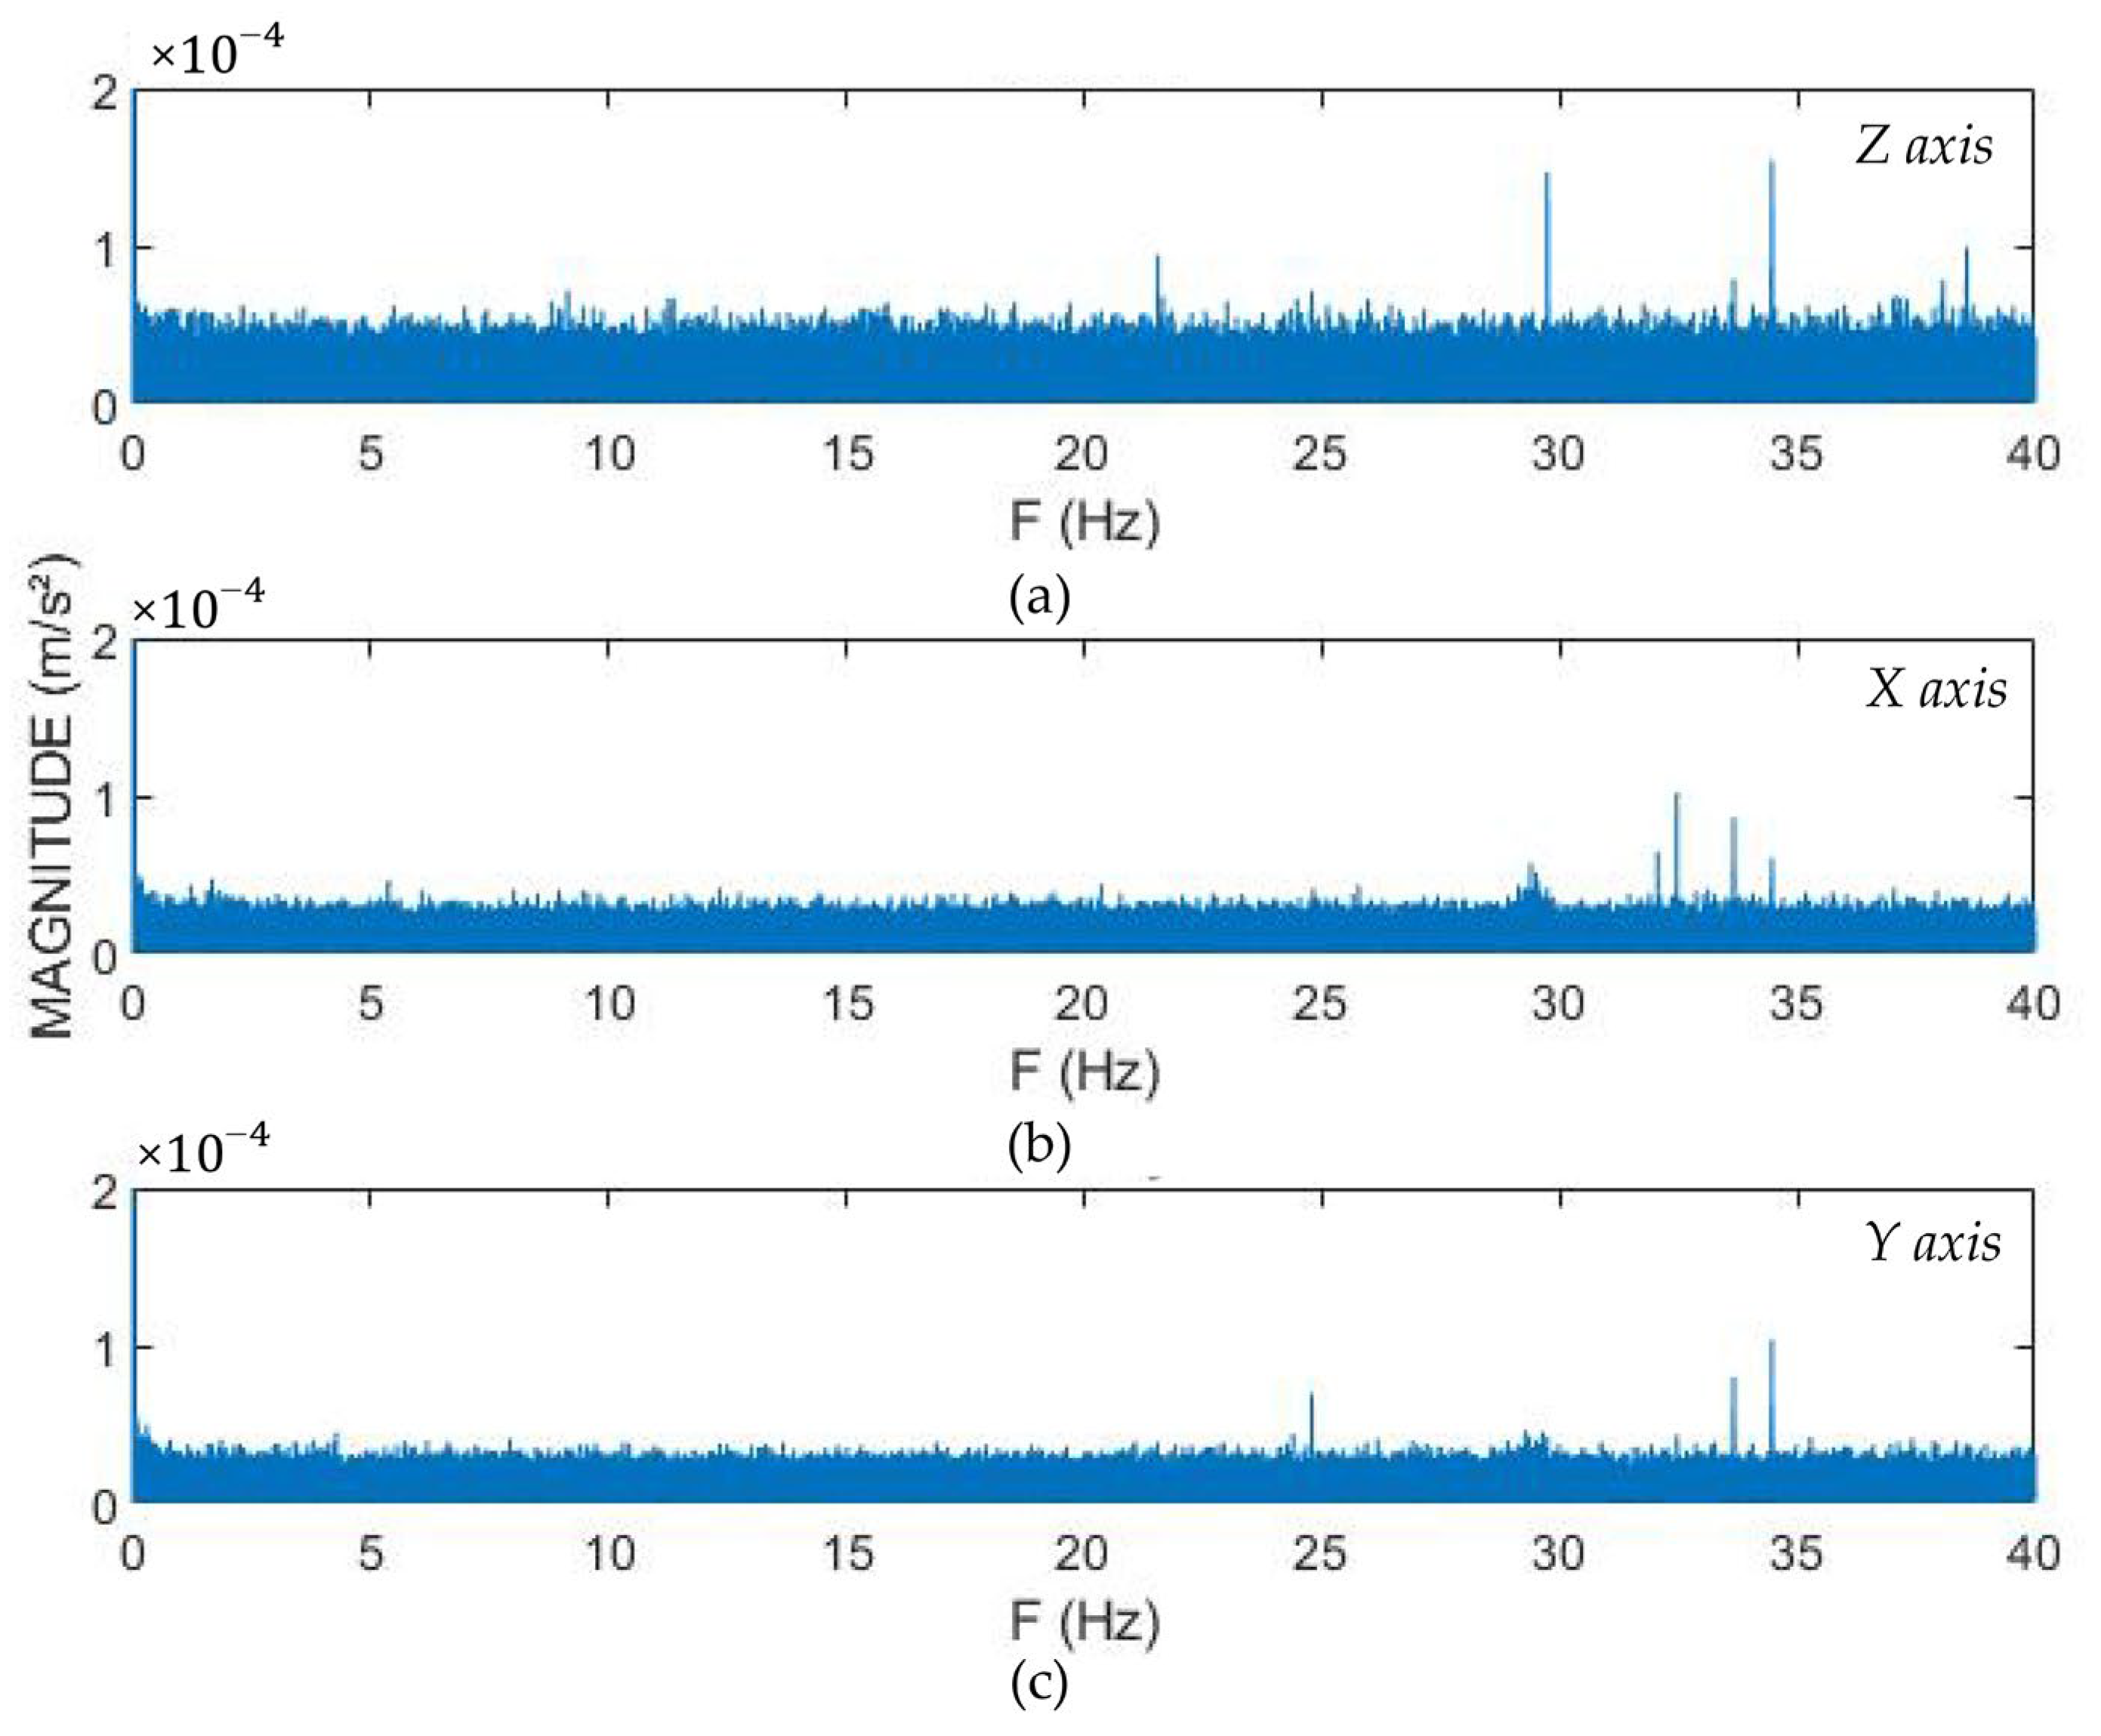
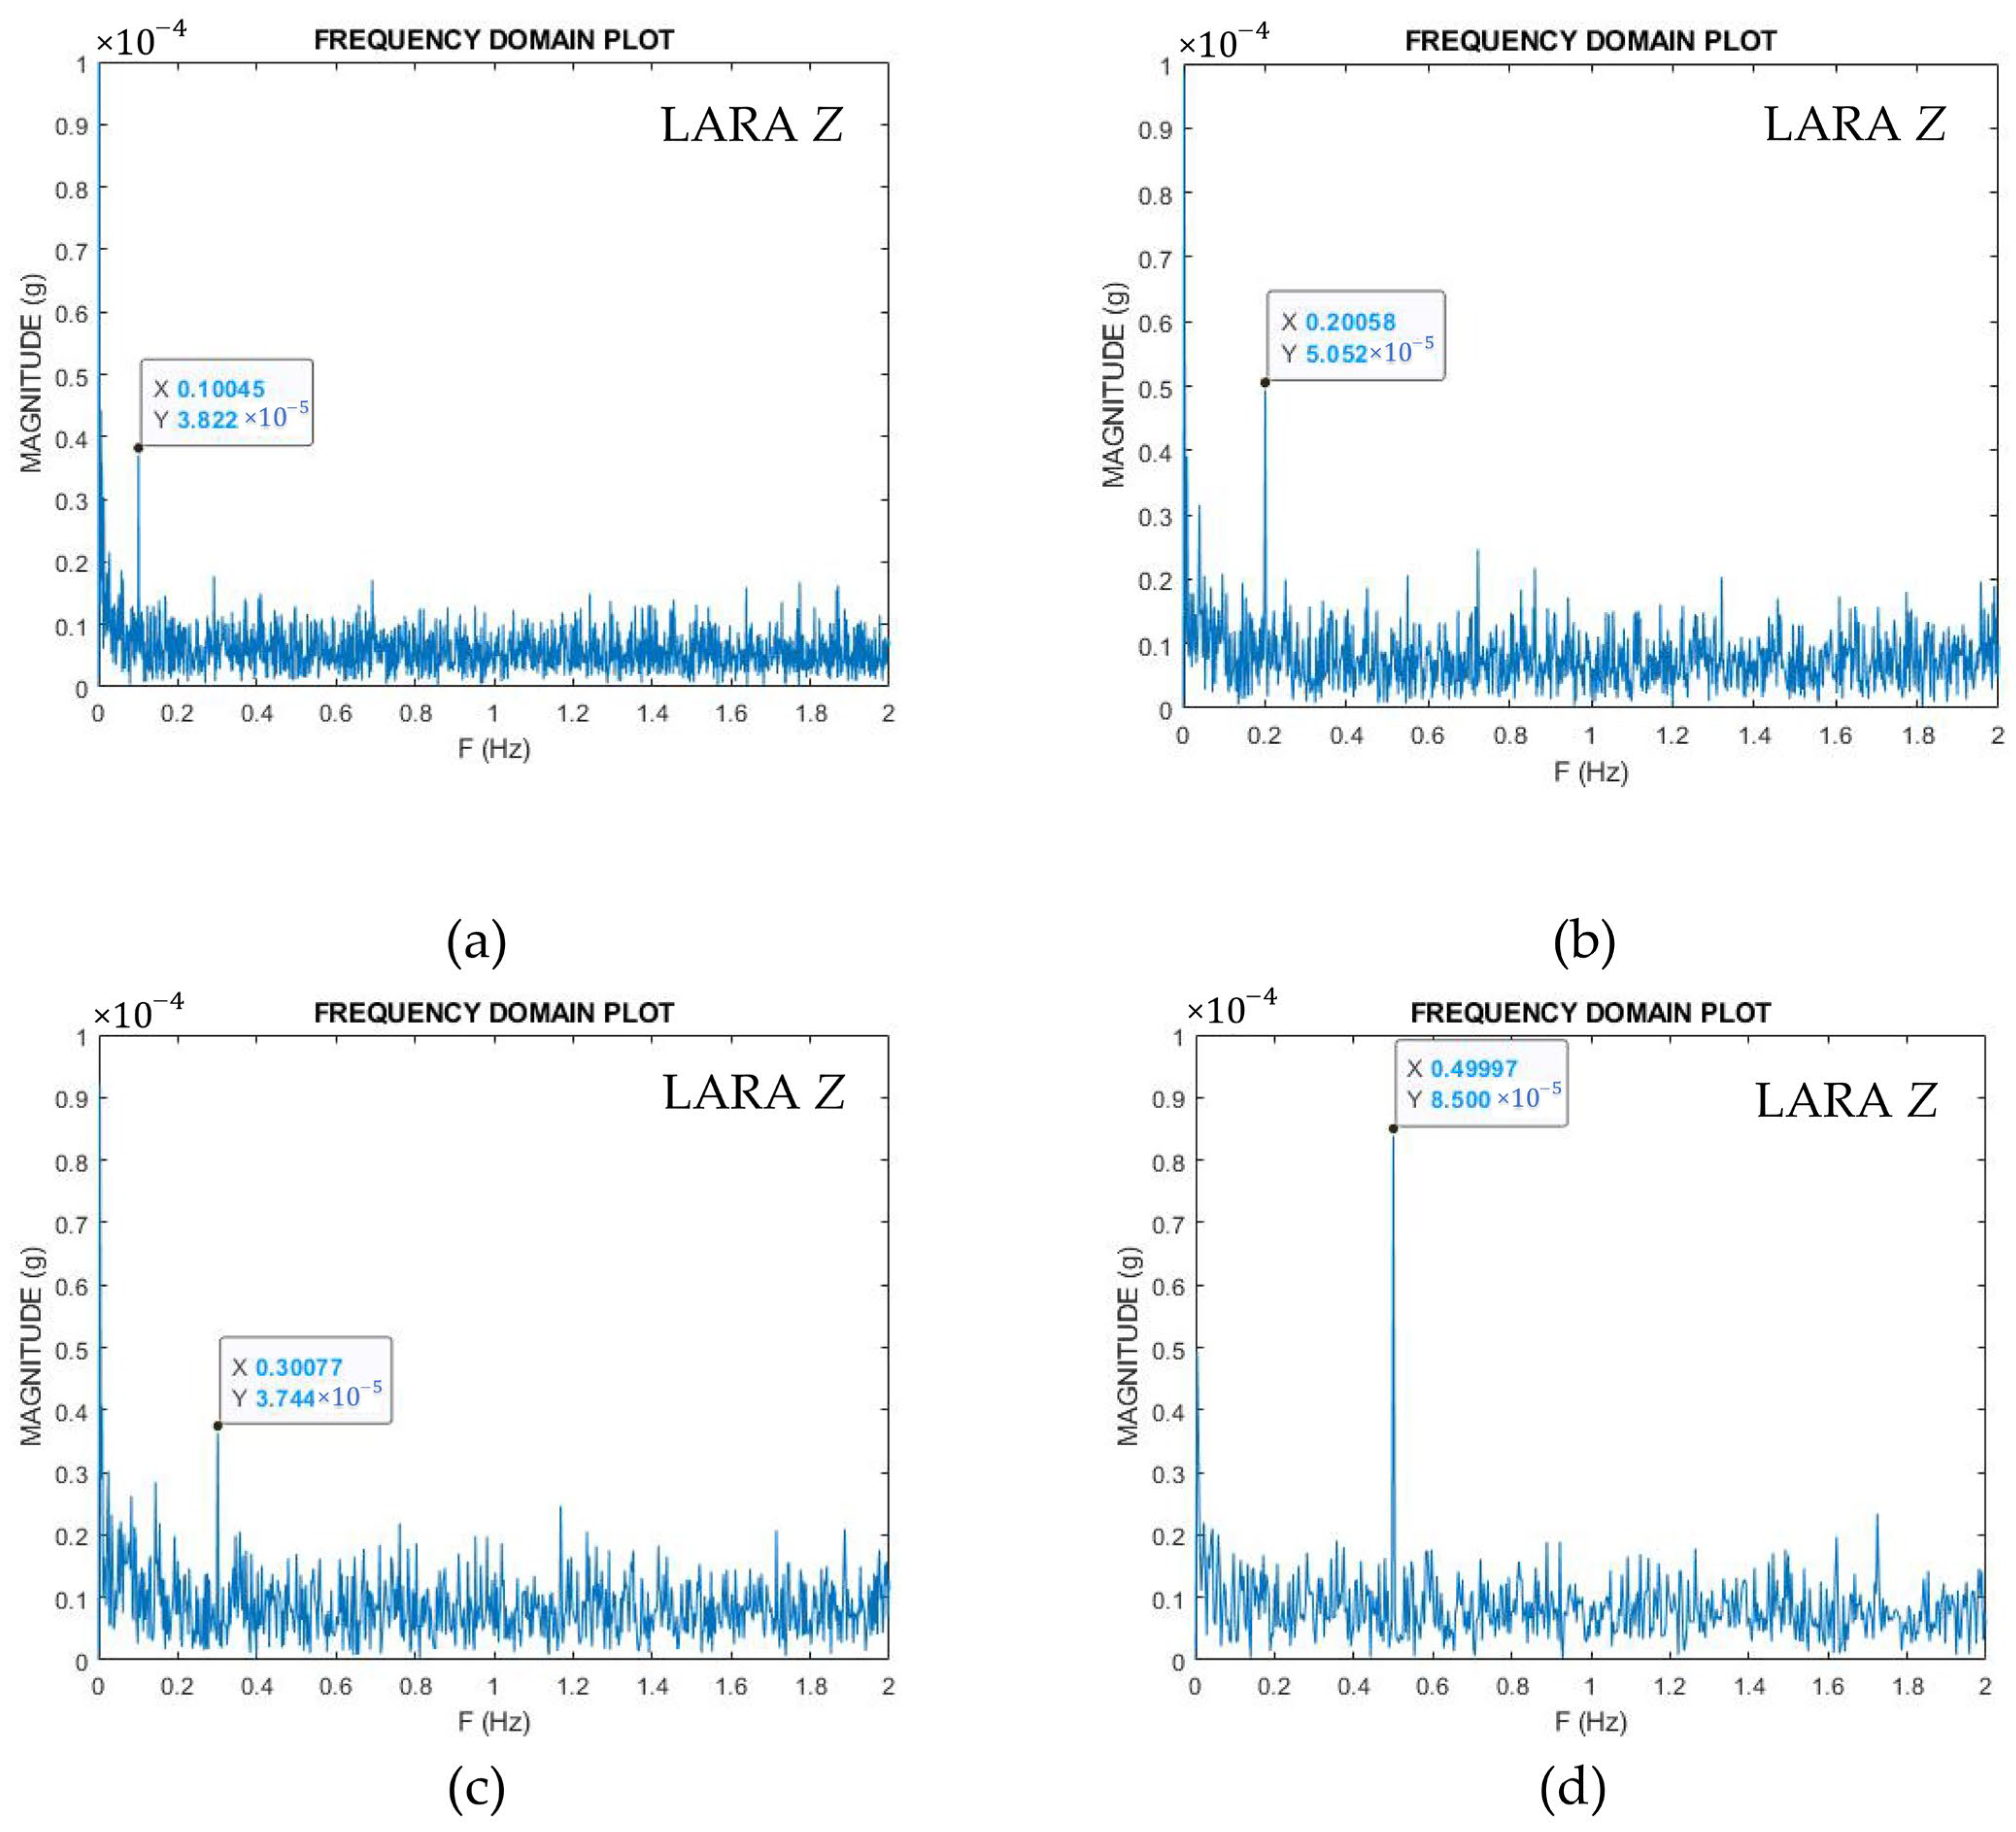
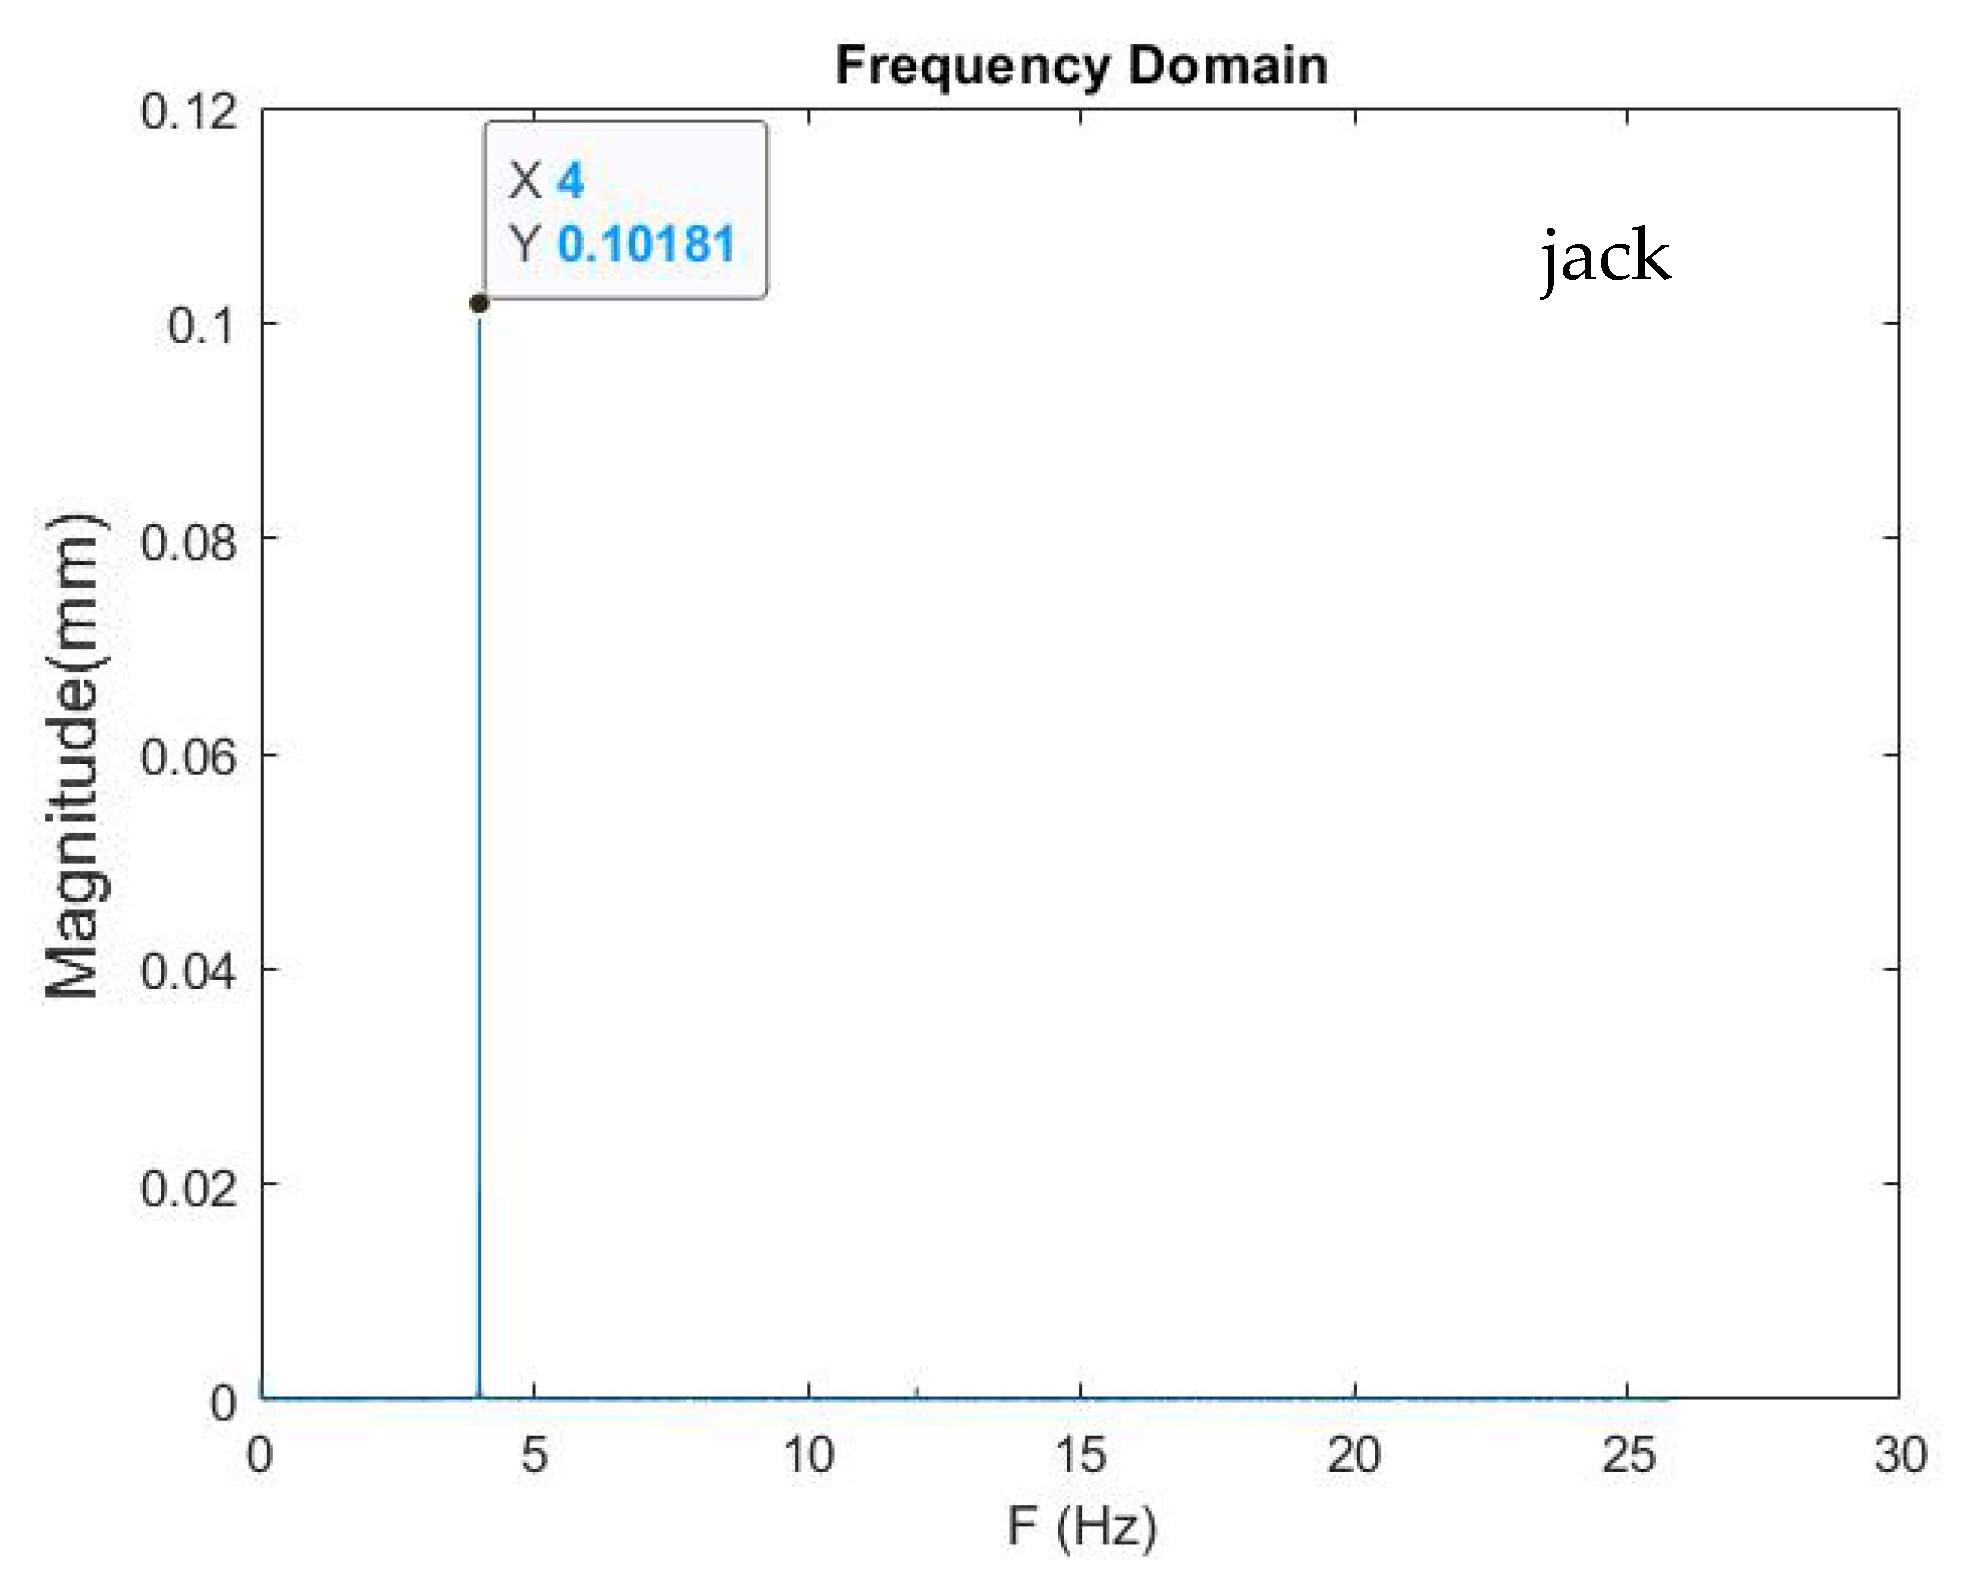
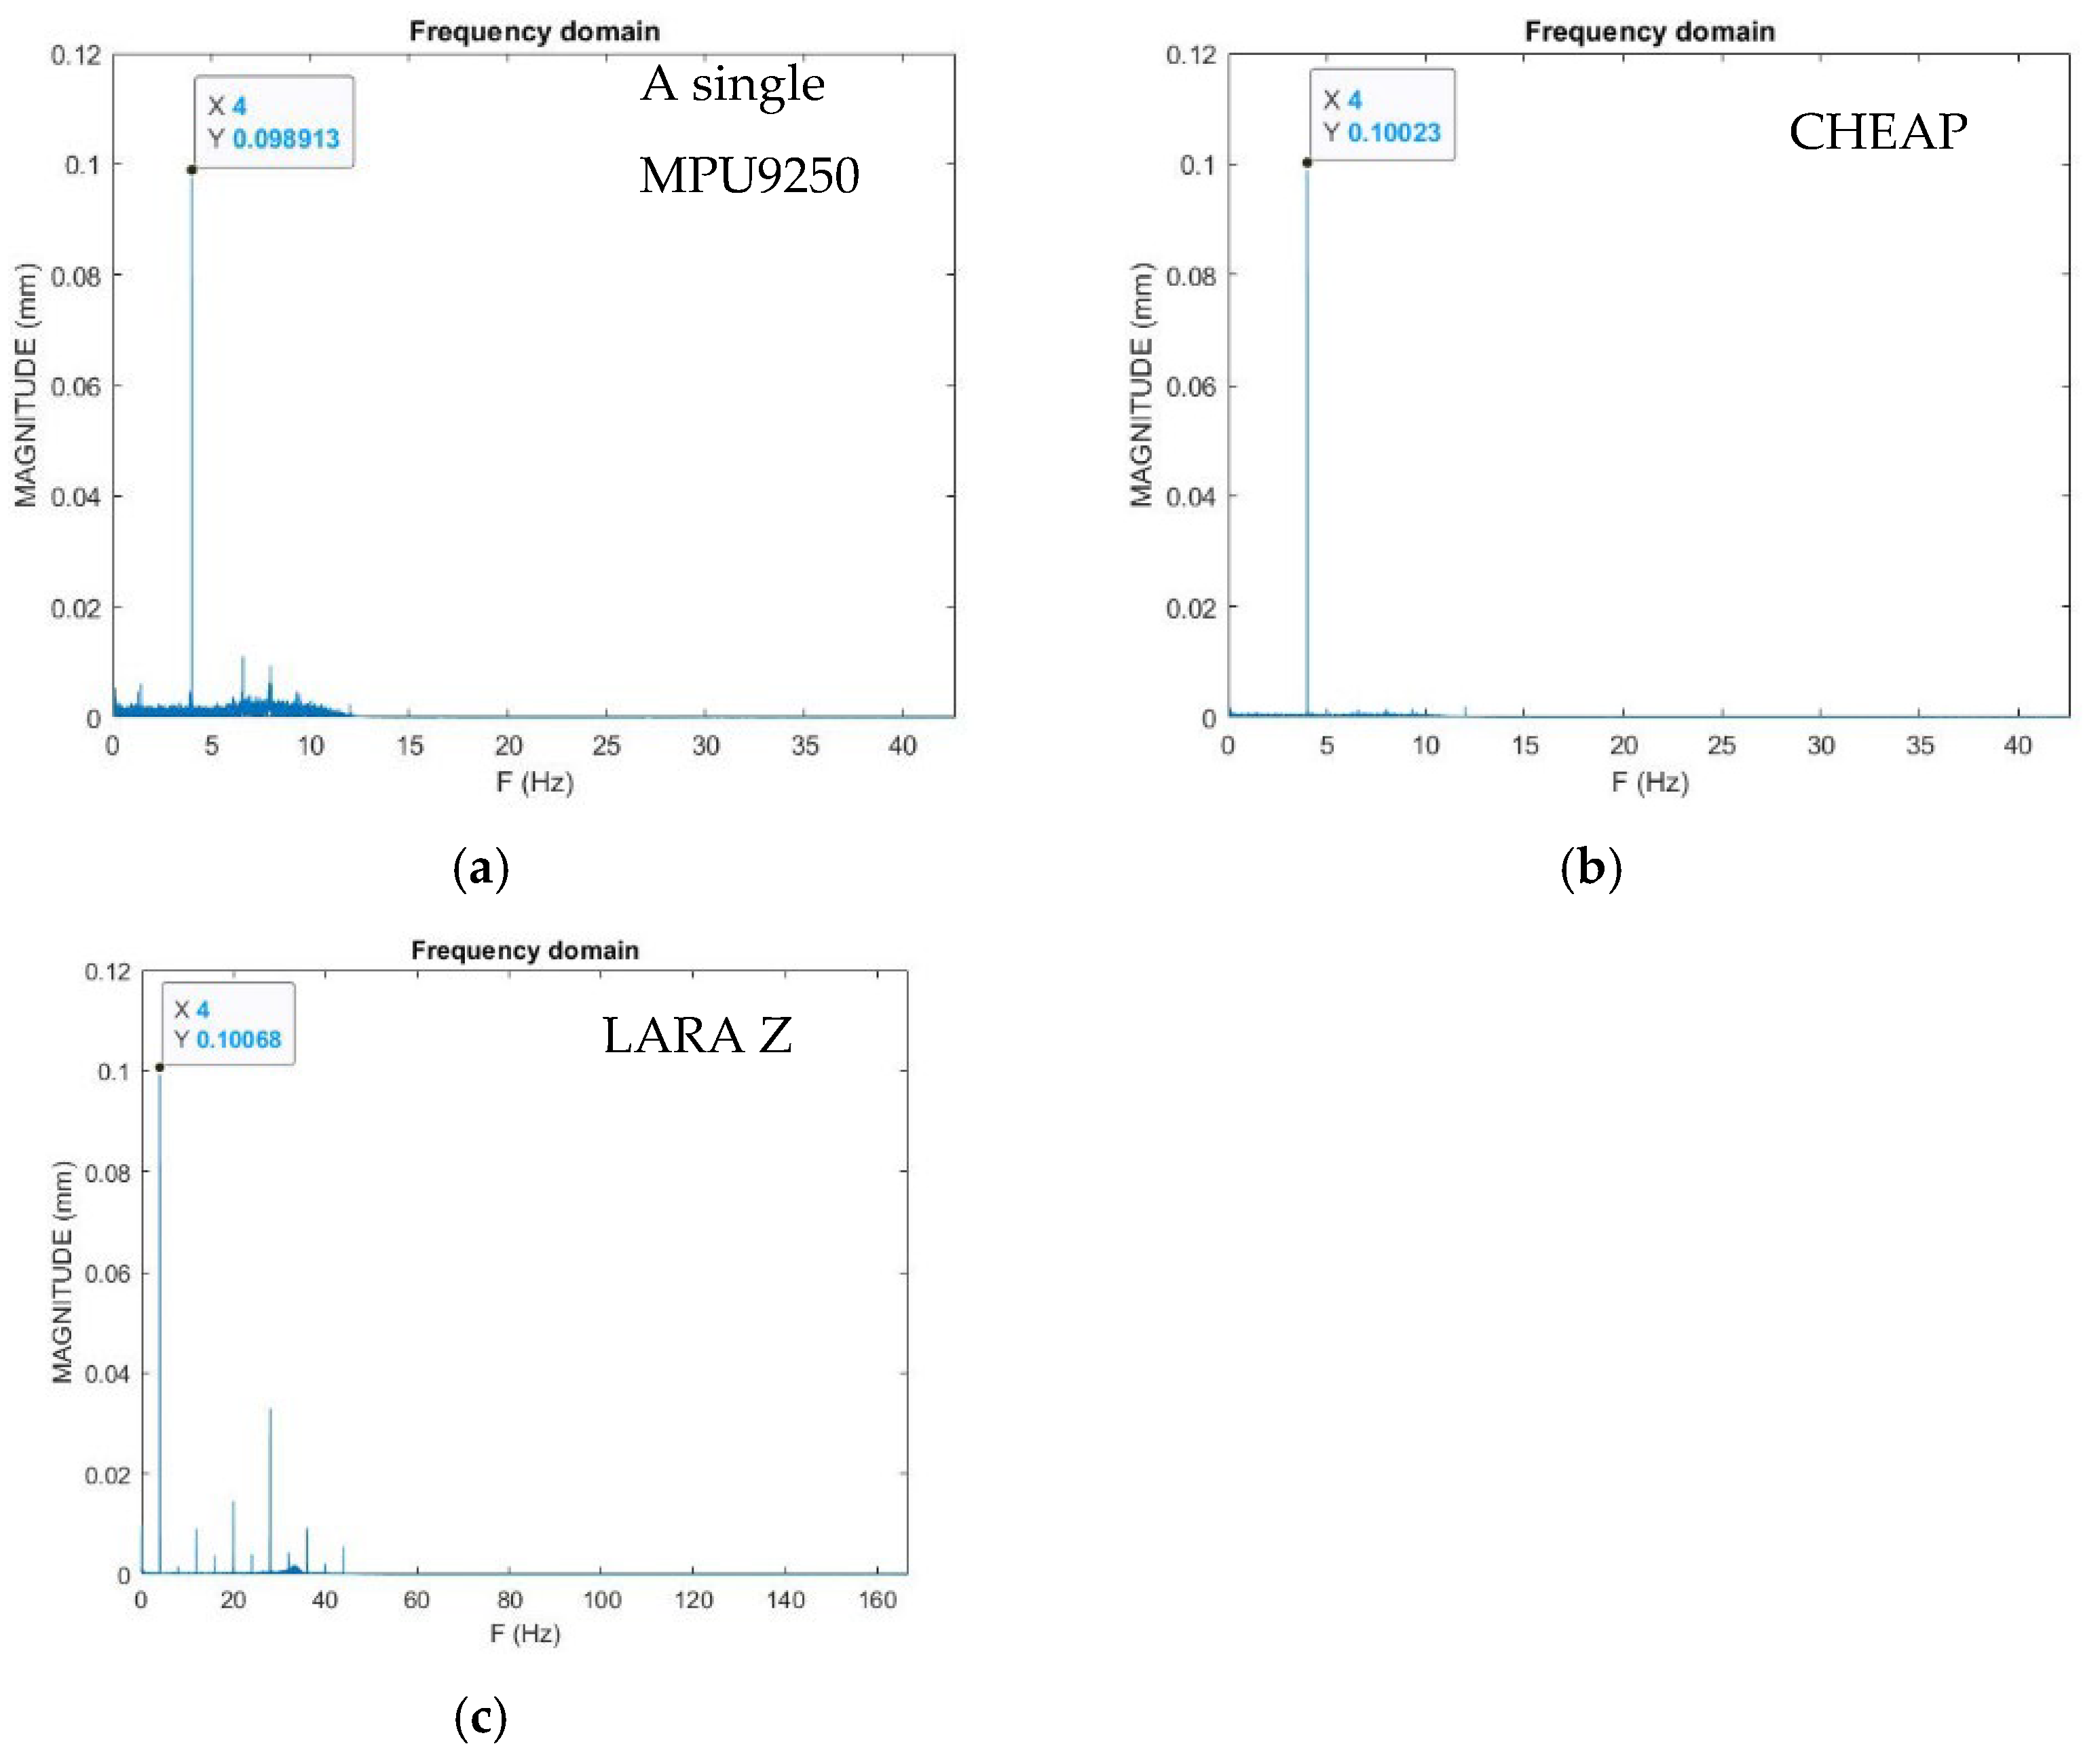
3.2. Frequency Validation
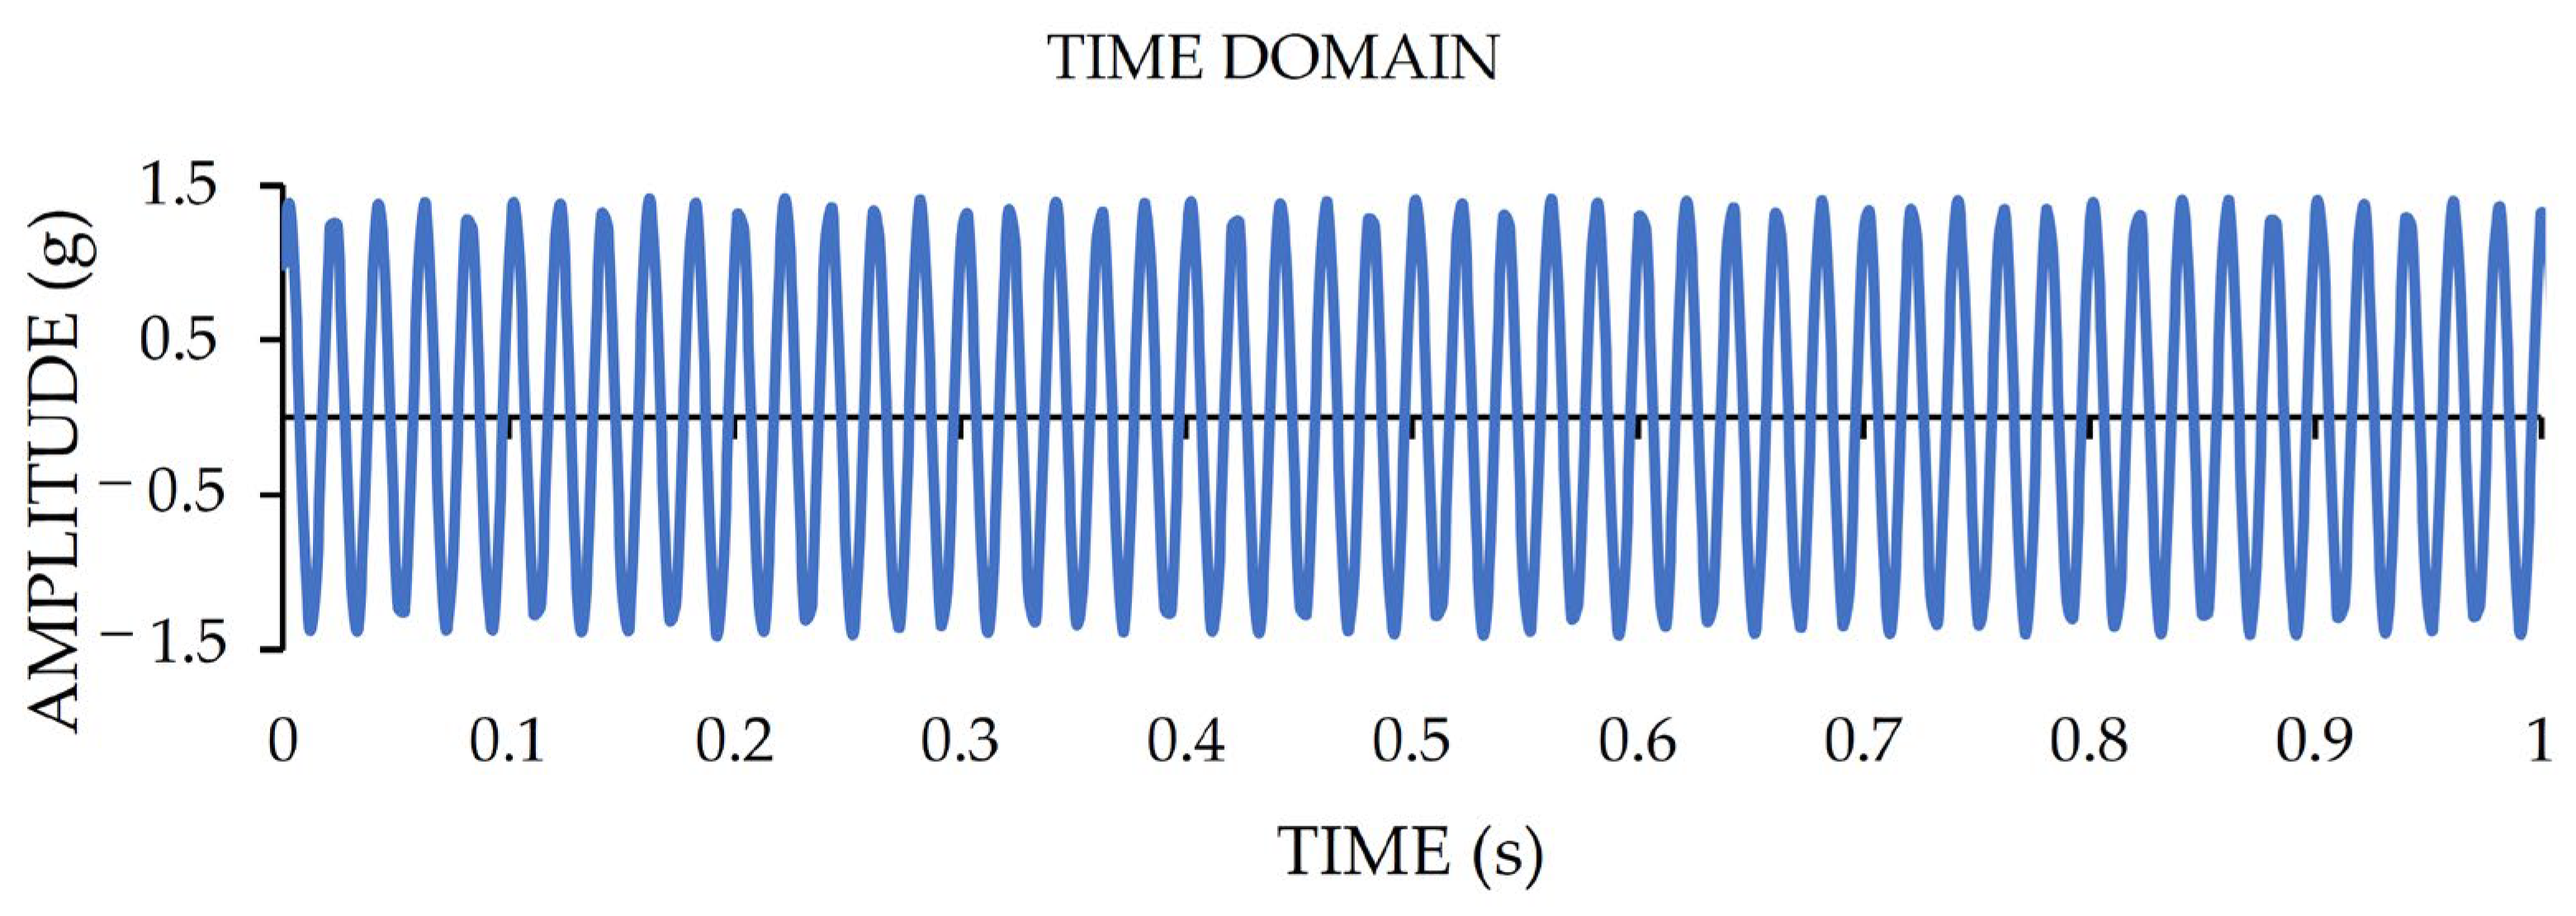
3.3. Acceleration Amplitude Validation
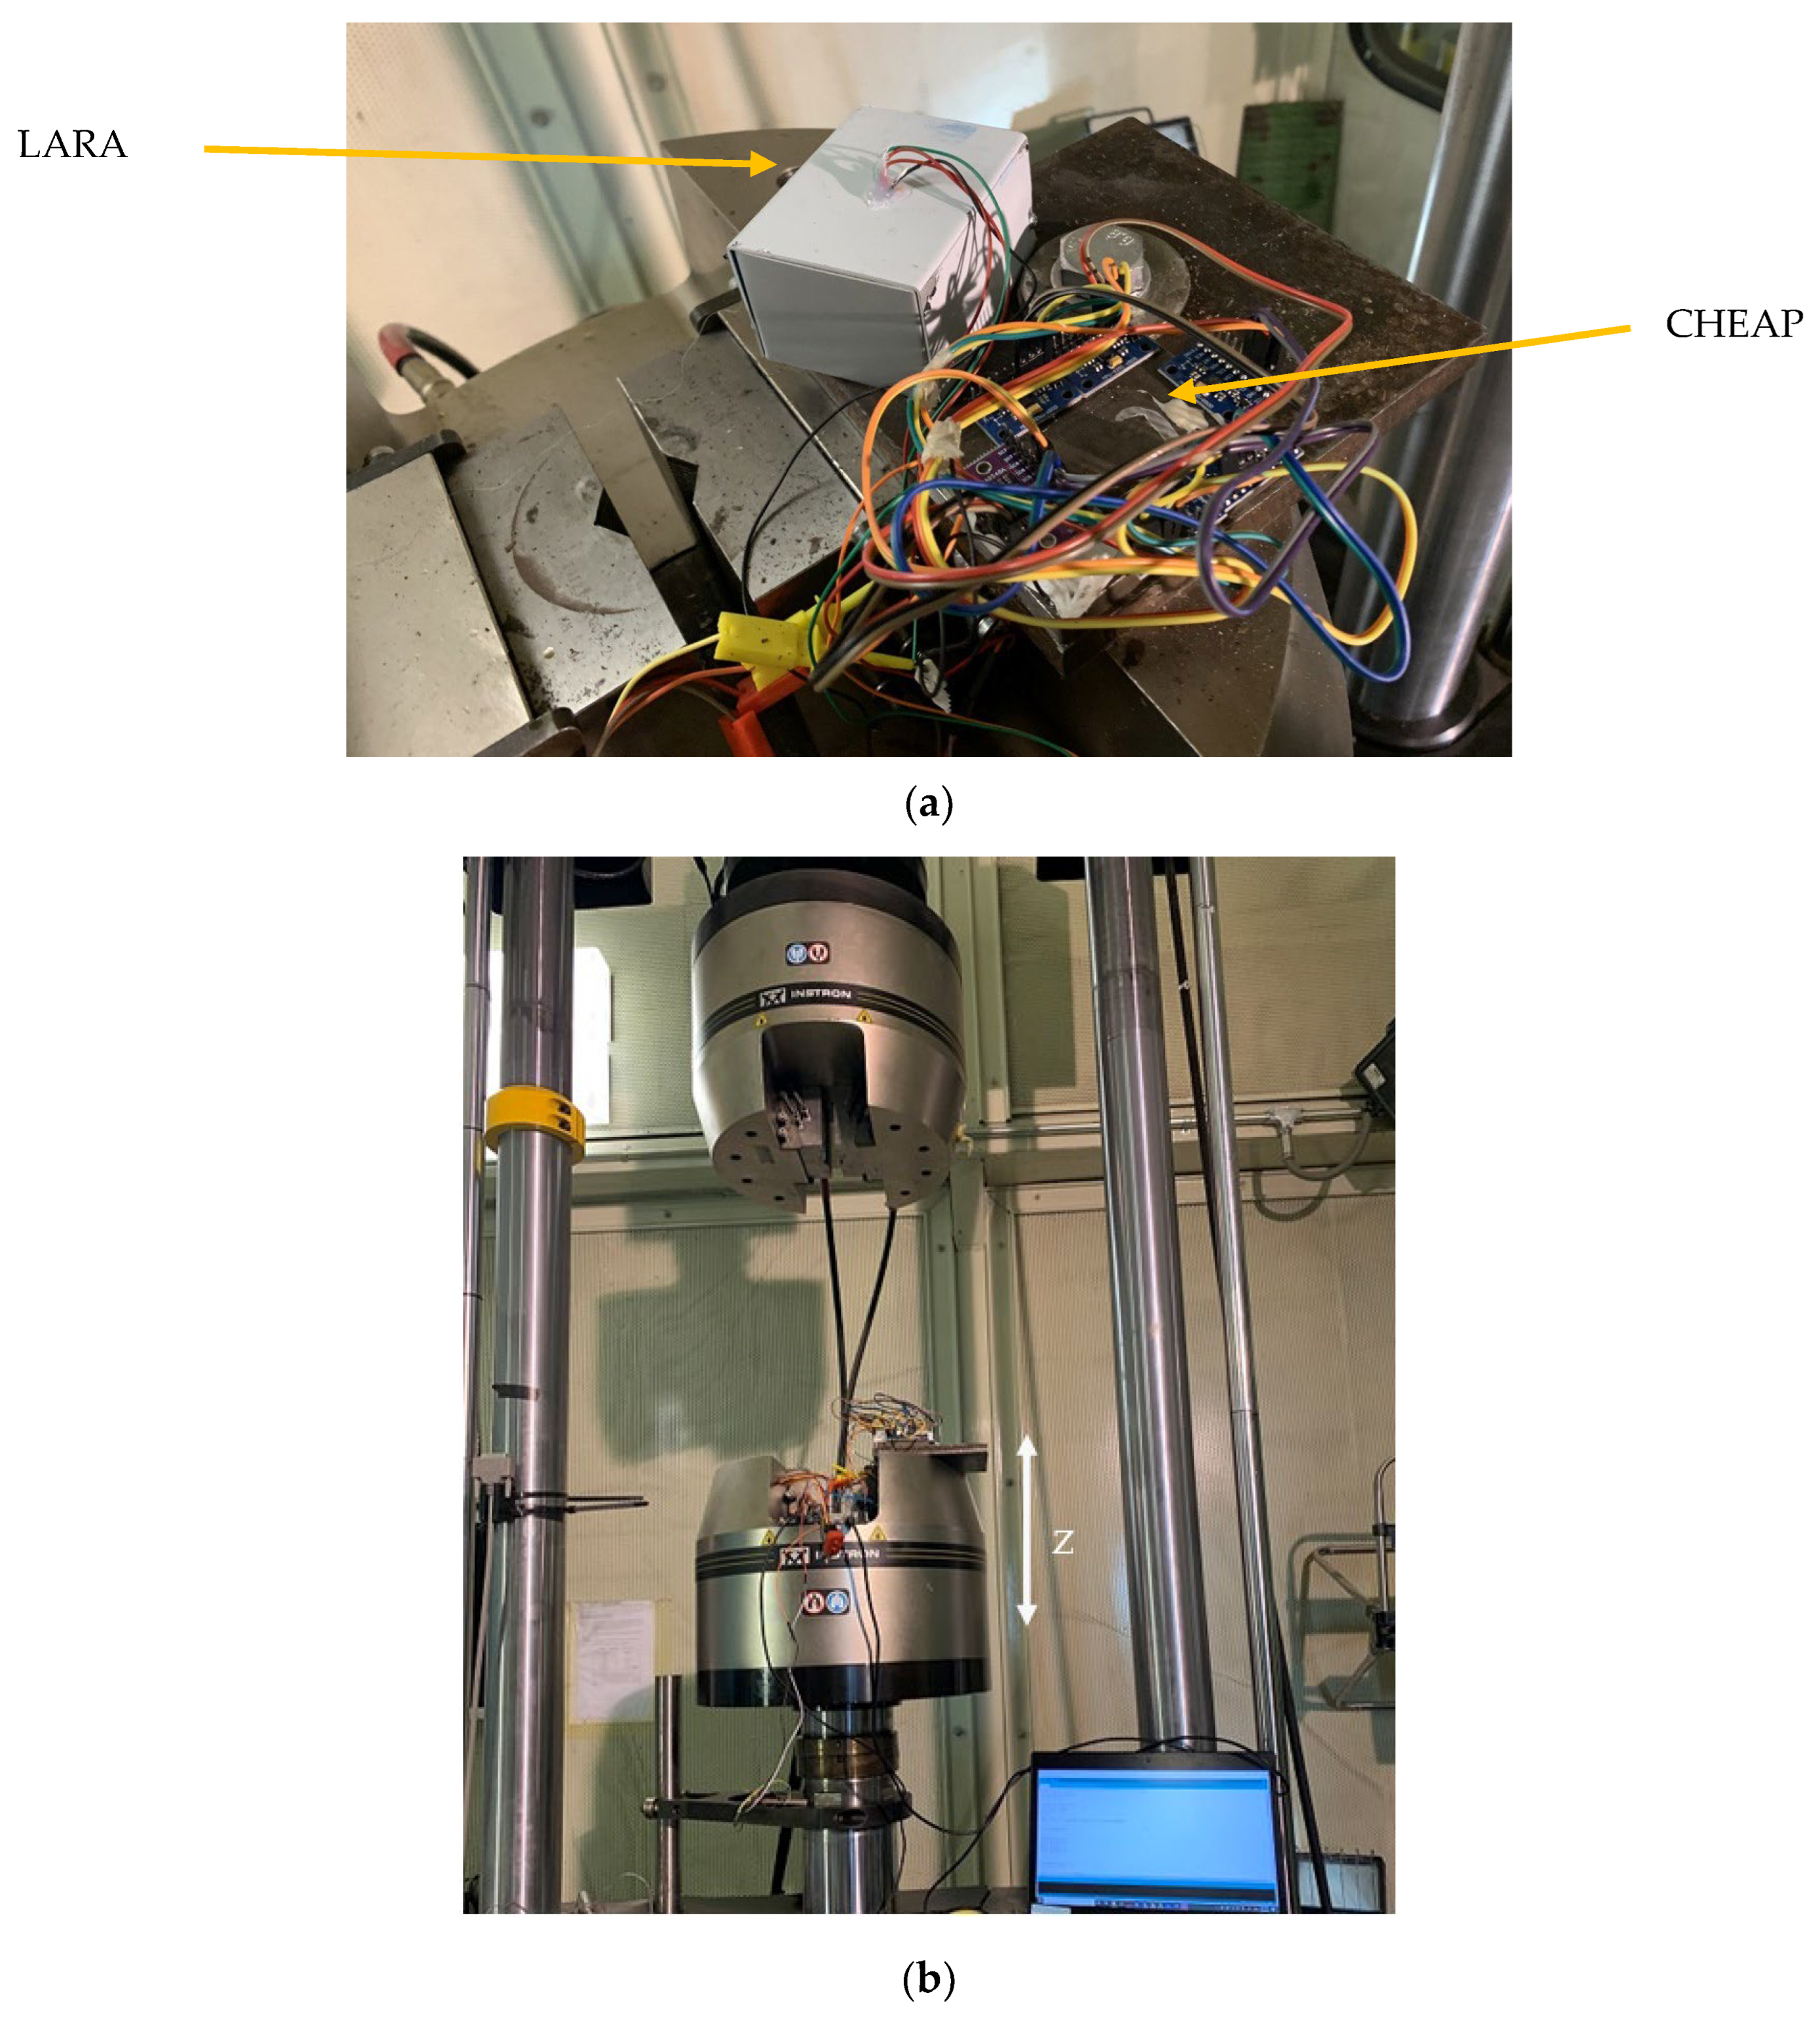
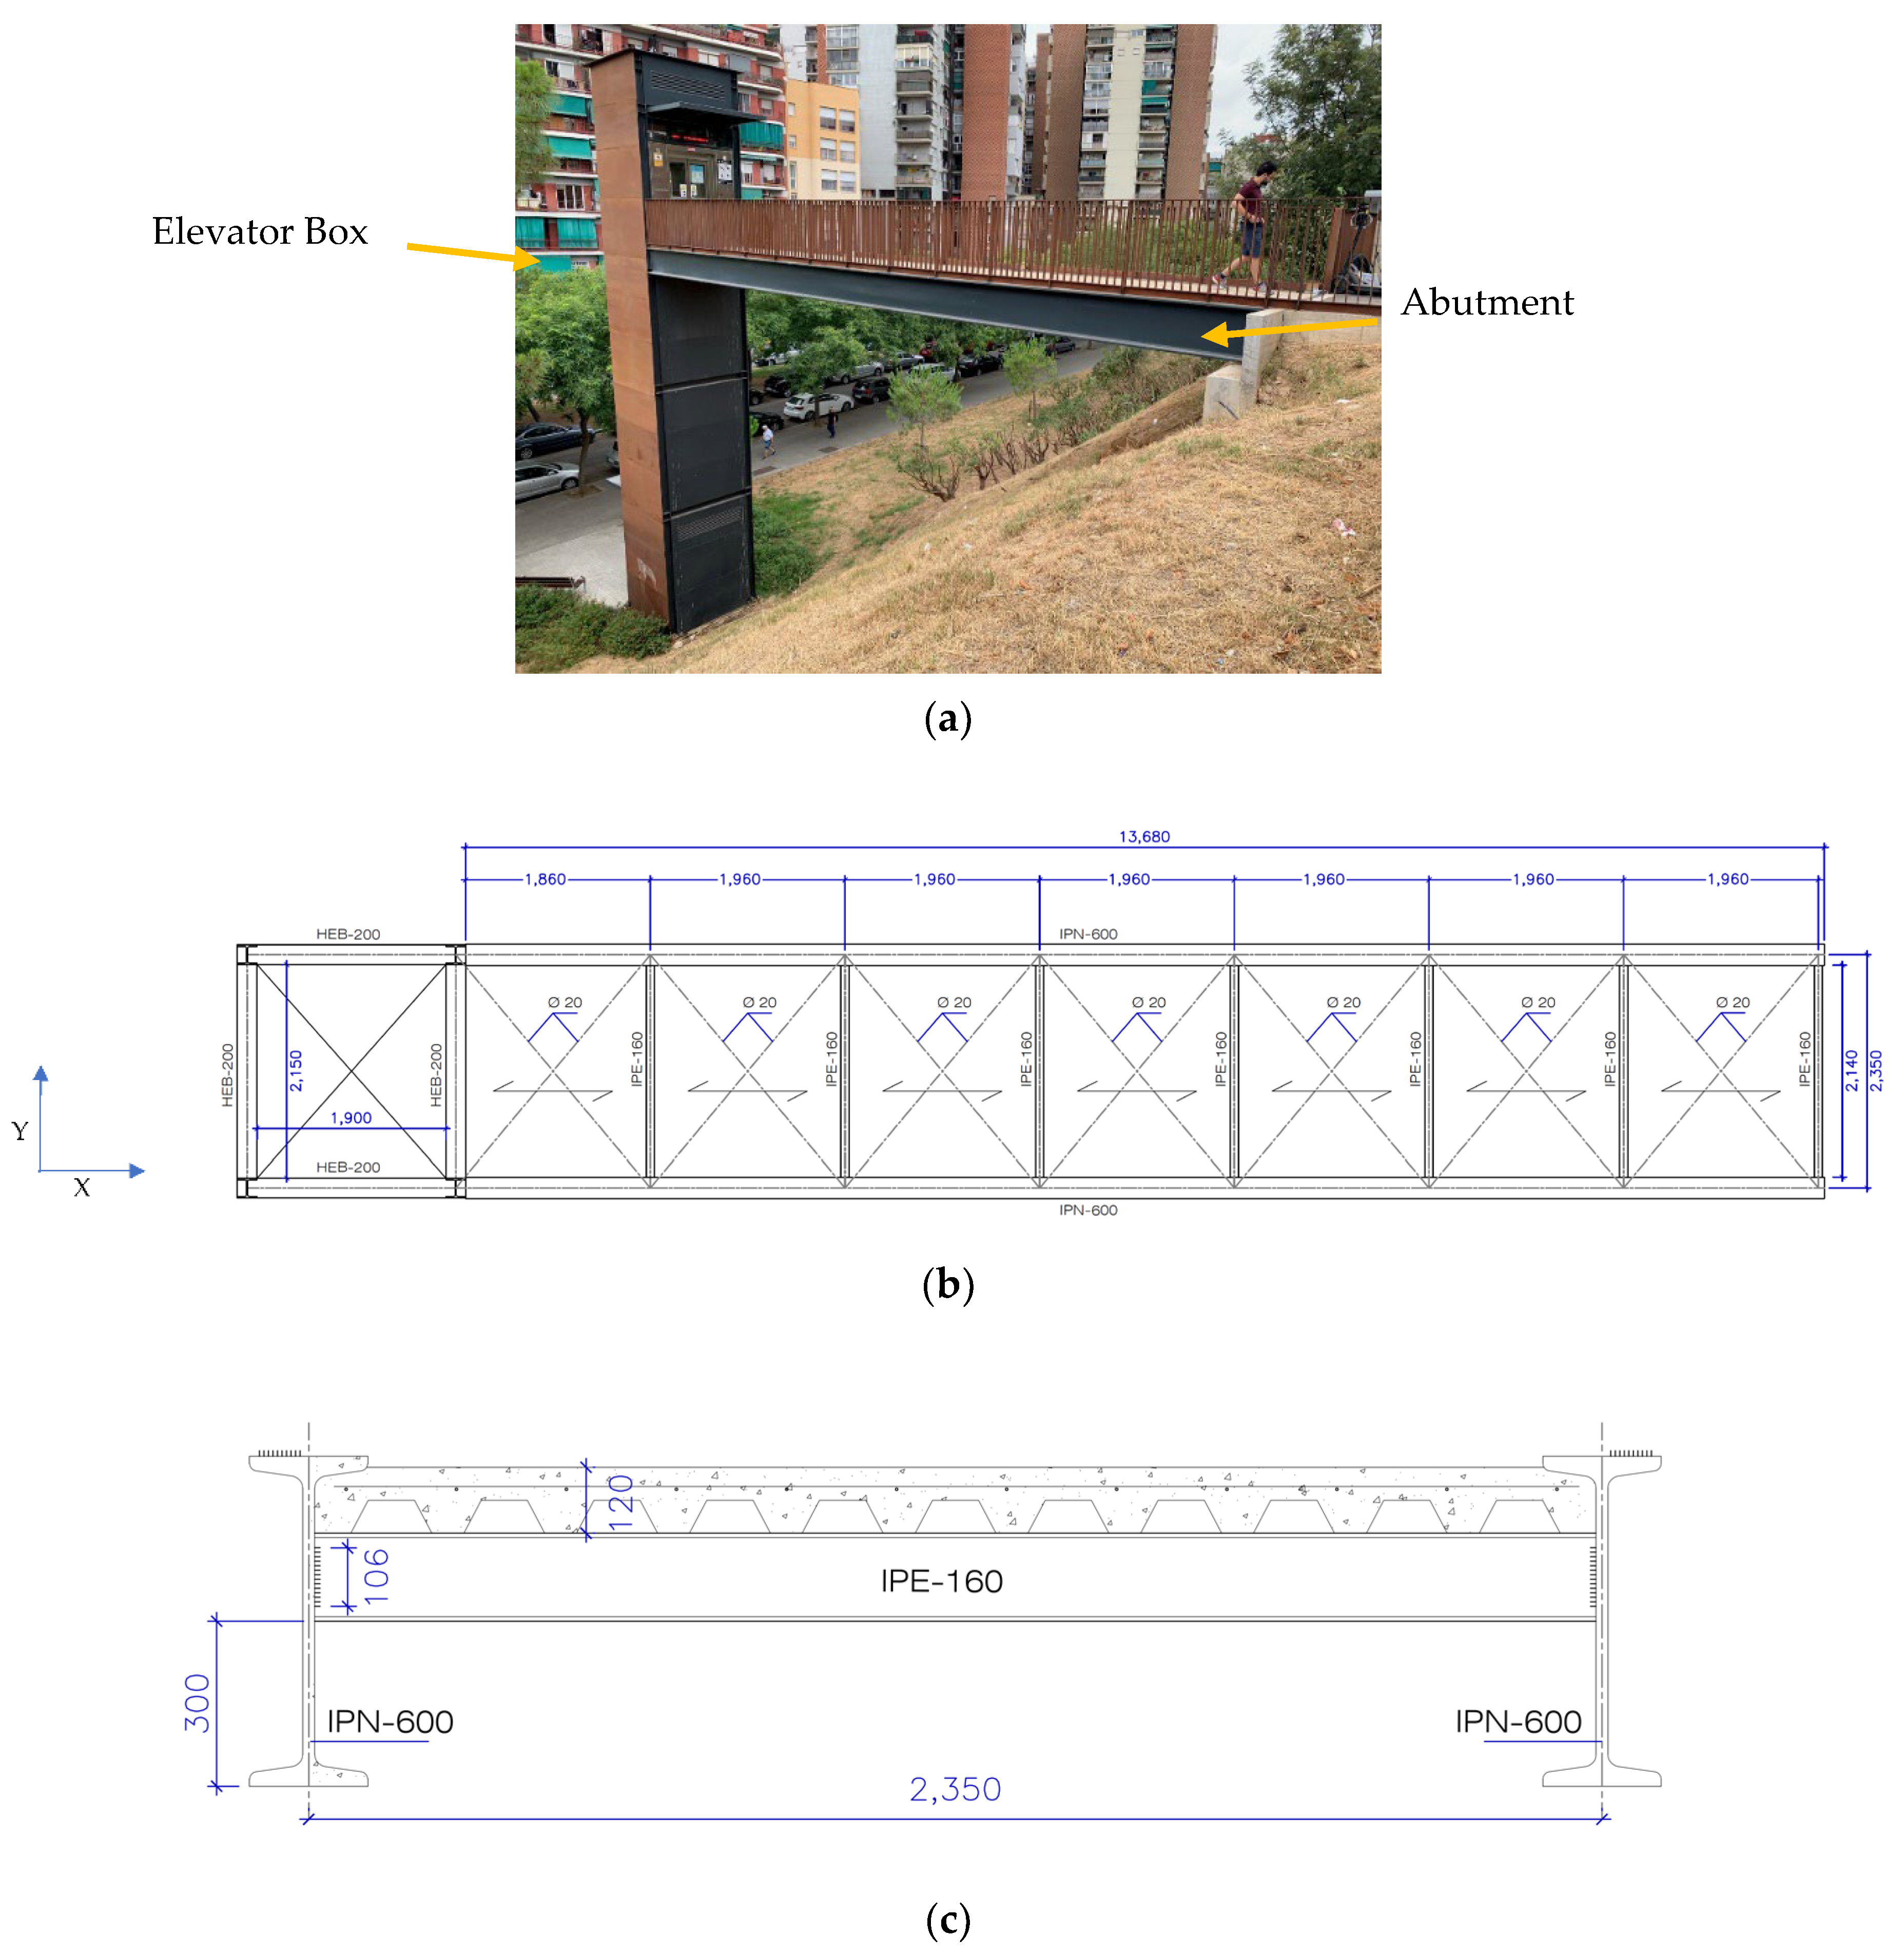
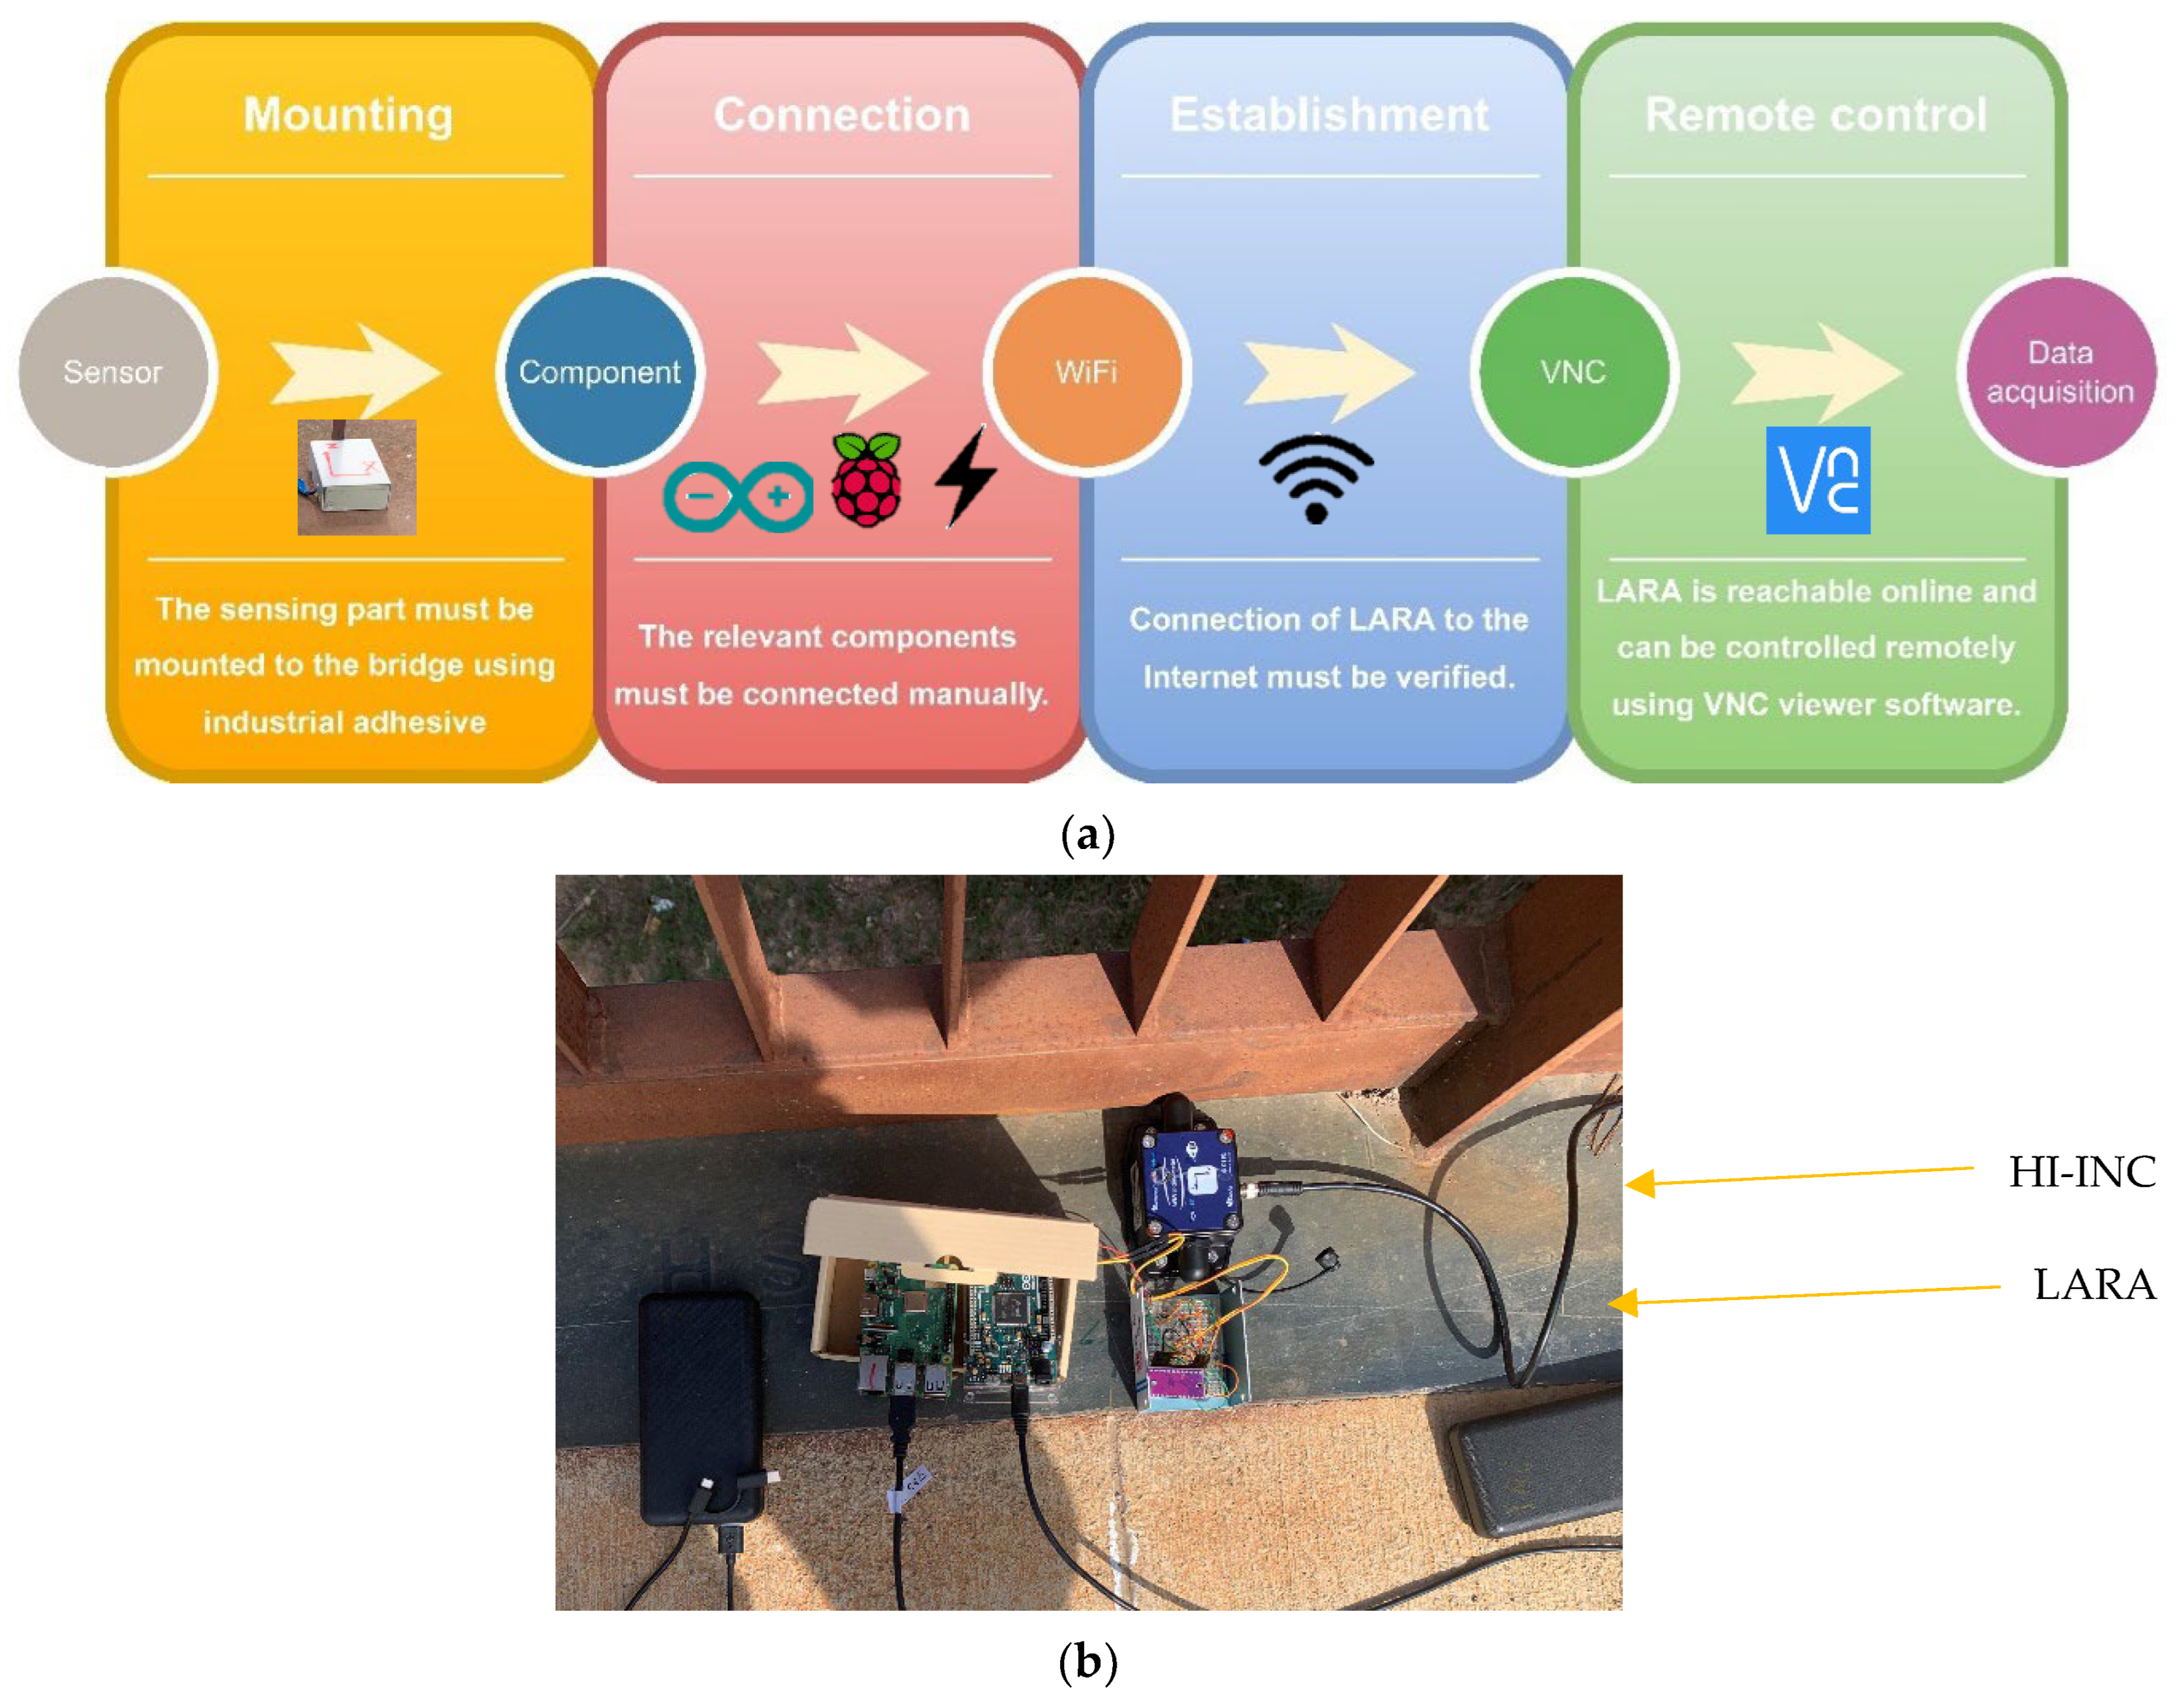
4. Real Structure Test and Results
5. Conclusions
- (1)
- By rewriting codes, LARA achieved a faster sampling frequency;
- (2)
- Having a connected Raspberry Pi to the Internet made LARA independent of any attached computer for data sampling;
- (3)
- Having aligned correctly, its accelerometers made LARA triaxial;
- (4)
- Having a better and more efficient connection reduced LARA’s ND;
- (5)
- Having the time of the Internet for future data synchronization;
- (6)
- Being completely wireless excluded the need for an engineer’s presence on the site for data acquisition.
Author Contributions
Funding
Institutional Review Board Statement
Informed Consent Statement
Data Availability Statement
Acknowledgments
Conflicts of Interest
References
- Proske, D. Fatalities due to bridge collapse. In Proceedings of the Institution of Civil Engineers—Bridge Engineering; Thomas Telford Ltd: London, UK, 2020; Volume 173, pp. 260–267. [Google Scholar] [CrossRef]
- Structurally Deficient Bridges. Available online: https://www.infrastructurereportcard.org/cat-item/bridges/ (accessed on 9 October 2020).
- Zhuang, Y.; Chen, W.; Jin, T.; Chen, B.; Zhang, H.; Zhang, W.A.; Zhuang, Y.; Chen, W.; Jin, T.; Chen, B.; et al. A Review of Computer Vision-Based Structural Deformation Monitoring in Field Environments. Sensors 2022, 22, 3789. [Google Scholar] [CrossRef] [PubMed]
- Gayakwad, H.; Thiyagarajan, J.S. Structural Damage Detection through EMI and Wave Propagation Techniques Using Embedded PZT Smart Sensing Units. Sensors 2022, 22, 2296. [Google Scholar] [CrossRef] [PubMed]
- Glowacz, A.; Antonino-Daviu, J.A.; Caesarendra, W.; Civera, M.; Surace, C. Non-Destructive Techniques for the Condition and Structural Health Monitoring of Wind Turbines: A Literature Review of the Last 20 Years. Sensors 2022, 22, 1627. [Google Scholar] [CrossRef]
- Hénault, J.-M.; Benzarti, K.; Quiertant, M.; Bado, M.F.; Tonelli, D.; Poli, F.; Zonta, D.; Casas, J.R. Digital Twin for Civil Engineering Systems: An Exploratory Review for Distributed Sensing Updating. Sensors 2022, 22, 3168. [Google Scholar] [CrossRef]
- Kalybek, M.; Bocian, M.; Nikitas, N. Performance of Optical Structural Vibration Monitoring Systems in Experimental Modal Analysis. Sensors 2021, 21, 1239. [Google Scholar] [CrossRef] [PubMed]
- Lei, X.; Xia, Y.; Komarizadehasl, S.; Sun, L. Condition level deteriorations modeling of RC beam bridges with U-Net convolutional neural networks. Structures 2022, 42, 333–342. [Google Scholar] [CrossRef]
- Komarizadehasl, S.; Mobaraki, B.; Ma, H.; Lozano-Galant, J.-A.; Turmo, J. Low-Cost Sensors Accuracy Study and Enhancement Strategy. Appl. Sci. 2022, 12, 3186. [Google Scholar] [CrossRef]
- Wu, T.; Liu, G.; Fu, S.; Xing, F. Recent Progress of Fiber-Optic Sensors for the Structural Health Monitoring of Civil Infrastructure. Sensors 2020, 20, 4517. [Google Scholar] [CrossRef] [PubMed]
- Peng, T.; Nogal, M.; Casas, J.R.; Turmo, J. Role of sensors in error propagation with the dynamic constrained observability method. Sensors 2021, 21, 2918. [Google Scholar] [CrossRef] [PubMed]
- Hajializadeh, D.; Wang, Y.; Kullaa, J. Damage Detection and Localization under Variable Environmental Conditions Using Compressed and Reconstructed Bayesian Virtual Sensor Data. Sensors 2021, 22, 306. [Google Scholar] [CrossRef]
- Lin, J.-F.; Li, X.-Y.; Wang, J.; Wang, L.-X.; Hu, X.-X.; Liu, J.-X.; Lin, J.-F.; Li, X.-Y.; Wang, J.; Wang, L.-X.; et al. Study of Building Safety Monitoring by Using Cost-Effective MEMS Accelerometers for Rapid After-Earthquake Assessment with Missing Data. Sensors 2021, 21, 7327. [Google Scholar] [CrossRef] [PubMed]
- Komarizadehasl, S.; Khanmohammadi, M. Novel plastic hinge modification factors for damaged RC shear walls with bending performance. Adv. Concr. Constr. 2021, 12, 355–365. [Google Scholar] [CrossRef]
- Lei, L.; Song, D.; Liu, Z.; Xu, X.; Zheng, Z. Displacement Identification by Computer Vision for Condition Monitoring of Rail Vehicle Bearings. Sensors 2021, 21, 2100. [Google Scholar] [CrossRef]
- Ramli, J.; Coulson, J.; Martin, J.; Nagaratnam, B.; Poologanathan, K.; Cheung, W.M. Crack Detection and Localisation in Steel-Fibre-Reinforced Self-Compacting Concrete Using Triaxial Accelerometers. Sensors 2021, 21, 2044. [Google Scholar] [CrossRef]
- Mobaraki, B.; Komarizadehasl, S.; Javier, F.; Pascual, C.; Lozano-Galant, A.; Soriano, R.P. A Novel Data Acquisition System for Obtaining Thermal Parameters of Building Envelopes. Buildings 2022, 12, 670. [Google Scholar] [CrossRef]
- Farré-Checa, J.; Komarizadehasl, S.; Ma, H.; Lozano-Galant, J.A.; Turmo, J. Direct simulation of the tensioning process of cable-stayed bridge cantilever construction. Autom. Constr. 2022, 137, 104197. [Google Scholar] [CrossRef]
- Laurendeau, D.; Ručevskis, S.; Rogala, T.; Katunin, A. Optimal Sensor Placement for Modal-Based Health Monitoring of a Composite Structure. Sensors 2022, 22, 3867. [Google Scholar] [CrossRef]
- Scholz, V.; Winkler, P.; Hornig, A.; Gude, M.; Filippatos, A. Structural Damage Identification of Composite Rotors Based on Fully Connected Neural Networks and Convolutional Neural Networks. Sensors 2021, 21, 2005. [Google Scholar] [CrossRef] [PubMed]
- Biliszczuk, J.; Hawryszków, P.; Teichgraeber, M. SHM System and a FEM Model-Based Force Analysis Assessment in Stay Cables. Sensors 2021, 21, 1927. [Google Scholar] [CrossRef] [PubMed]
- Dumitriu, M. Condition Monitoring of the Dampers in the Railway Vehicle Suspension Based on the Vibrations Response Analysis of the Bogie. Sensors 2022, 22, 3290. [Google Scholar] [CrossRef]
- Komarizadehasl, S.; Mobaraki, B.; Ma, H.; Lozano-Galant, J.-A.; Turmo, J. Development of a Low-Cost System for the Accurate Measurement of Structural Vibrations. Sensors 2021, 21, 6191. [Google Scholar] [CrossRef] [PubMed]
- Ghemari, Z. Progression of the vibratory analysis technique by improving the piezoelectric sensor measurement accuracy. Microw. Opt. Technol. Lett. 2018, 60, 2972–2977. [Google Scholar] [CrossRef]
- Cunha, Á.; Caetano, E. Experimental Modal Analysis of Civil Engineering Structures. Available online: https://repositorio-aberto.up.pt/bitstream/10216/67103/2/56957.pdf (accessed on 14 October 2020).
- Taniwaki, M.; Hanada, T.; Sakurai, N. Device for acoustic measurement of food texture using a piezoelectric sensor. Food Res. Int. 2006, 39, 1099–1105. [Google Scholar] [CrossRef] [Green Version]
- Lacidogna, G.; Yoshida, S.; Feng, G.-L.; Xu, J.; Grazzini, A.; Piana, G.; Lucà, F.; Manzoni, S.; Cigada, A.; Barella, S.; et al. Automatic Detection of Real Damage in Operating Tie-Rods. Sensors 2022, 22, 1370. [Google Scholar] [CrossRef]
- Villanueva, G.; Meruane, V.; Yanez, S.J.; Quinteros, L.; Saavedra Flores, E.I. Damage Detection in Steel–Concrete Composite Structures by Impact Hammer Modal Testing and Experimental Validation. Sensors 2022, 22, 3874. [Google Scholar] [CrossRef]
- Aktan, A.; Catbas, N.; Grimmelsman, K.; Pervizpour, M. Development of a Model Health Monitoring Guide for Major Bridges. Available online: https://www.researchgate.net/profile/Necati-Catbas/publication/267839627_Development_of_a_Model_Health_Monitoring_Guide_for_Major_Bridges/links/54732e720cf216f8cfaeae7d/Development-of-a-Model-Health-Monitoring-Guide-for-Major-Bridges.pdf (accessed on 24 January 2022).
- Michael, A.; Grubb, P.E.; Kenneth, E.; Wilson, P.E.S.E.; Christopher, D.; White, P.E.; William, N.; Nickas, P.E. Load and Resistance Factor Design (LRFD) for Highway Bridge Superstructures. Available online: https://www.fhwa.dot.gov/bridge/pubs/nhi15047.pdf (accessed on 24 January 2022).
- Costa, C.; Ribeiro, D.; Jorge, P.; Silva, R.; Calçada, R.; Arêde, A. Calibration of the Numerical Model of a Short-span Masonry Railway Bridge Based on Experimental Modal Parameters. Procedia Eng. 2015, 114, 846–853. [Google Scholar] [CrossRef] [Green Version]
- Cheng, M.-Y.; Liao, K.-W.; Chiu, Y.-F.; Wu, Y.-W.; Yeh, S.-H.; Lin, T.-C. Automated mobile vibration measurement and signal analysis for bridge scour prevention and warning. Autom. Constr. 2022, 134, 104063–104080. [Google Scholar] [CrossRef]
- Sánchez-Aparicio, L.J.; Bautista-De Castro, Á.; Conde, B.; Carrasco, P.; Ramos, L.F. Non-destructive means and methods for structural diagnosis of masonry arch bridges. Autom. Constr. 2019, 104, 360–382. [Google Scholar] [CrossRef]
- Bedon, C.; Bergamo, E.; Izzi, M.; Noè, S. Prototyping and Validation of MEMS Accelerometers for Structural Health Monitoring—The Case Study of the Pietratagliata Cable-Stayed Bridge. J. Sens. Actuator Netw. 2018, 7, 30. [Google Scholar] [CrossRef] [Green Version]
- Li, Z.; Feng, M.Q.; Luo, L.; Feng, D.; Xu, X. Statistical analysis of modal parameters of a suspension bridge based on Bayesian spectral density approach and SHM data. Mech. Syst. Signal Process. 2018, 98, 352–367. [Google Scholar] [CrossRef]
- Lin, K.; Xu, Y.-L.; Lu, X.; Guan, Z.; Li, J. Digital twin-based collapse fragility assessment of a long-span cable-stayed bridge under strong earthquakes. Autom. Constr. 2021, 123, 103547–103560. [Google Scholar] [CrossRef]
- Tran-Ngoc, H.; Khatir, S.; De Roeck, G.; Bui-Tien, T.; Nguyen-Ngoc, L.; Abdel Wahab, M. Model Updating for Nam O Bridge Using Particle Swarm Optimization Algorithm and Genetic Algorithm. Sensors 2018, 18, 4131. [Google Scholar] [CrossRef] [Green Version]
- Zonzini, F.; Carbone, A.; Romano, F.; Zauli, M.; De Marchi, L. Machine Learning Meets Compressed Sensing in Vibration-Based Monitoring. Sensors 2022, 22, 2229. [Google Scholar] [CrossRef]
- Kavitha, S.; Joseph Daniel, R.; Sumangala, K. Design and Analysis of MEMS Comb Drive Capacitive Accelerometer for SHM and Seismic Applications. Measurement 2016, 93, 327–339. [Google Scholar] [CrossRef]
- Lee, E.-T.; Eun, H.-C. An Optimal Sensor Layout Using the Frequency Response Function Data within a Wide Range of Frequencies. Sensors 2022, 22, 3778. [Google Scholar] [CrossRef]
- Farrar, C.R.; Park, G.; Allen, D.W.; Todd, M.D. Sensor network paradigms for structural health monitoring. Struct. Control. Health Monit. 2006, 13, 210–225. [Google Scholar] [CrossRef]
- Shi, Y.; Zhang, J.; Jiao, J.; Zhao, R.; Cao, H. Calibration Analysis of High-G MEMS Accelerometer Sensor Based on Wavelet and Wavelet Packet Denoising. Sensors 2021, 21, 1231. [Google Scholar] [CrossRef]
- Grimmelsman, K.A.; Zolghadri, N. Experimental evaluation of low-cost accelerometers for dynamic characterization of bridges. In Proceedings of the Society for Experimental Mechanics Series; Springer: New York, NY, USA, 2020; pp. 145–152. [Google Scholar]
- Girolami, A.; Zonzini, F.; De Marchi, L.; Brunelli, D.; Benini, L. Modal Analysis of Structures with Low-cost Embedded Systems. In Proceedings of the International Symposium on Circuits and Systems, Florence, Italy, 27–30 May 2018; Volume 2018, pp. 1–4. [Google Scholar]
- Ozdagli, A.I.; Liu, B.; Moreu, F. Low-cost, efficient wireless intelligent sensors (LEWIS) measuring real-time reference-free dynamic displacements. Mech. Syst. Signal Process. 2018, 107, 343–356. [Google Scholar] [CrossRef]
- Aguero, M.; Ozdagli, A.; Moreu, F. Measuring reference-free total displacements of piles and columns using low-cost, battery-powered, efficientwireless intelligent sensors (LEWIS2). Sensors 2019, 19, 1549. [Google Scholar] [CrossRef] [Green Version]
- Meng, Q.; Zhu, S. Developing iot sensing system for construction-induced vibration monitoring and impact assessment. Sensors 2020, 20, 6120. [Google Scholar] [CrossRef]
- Analog Devices ADXL 335 Data-Sheet. Available online: https://www.sparkfun.com/datasheets/Components/SMD/adxl335.pdf (accessed on 1 August 2020).
- ST LIS344ALH Data-Sheet. Available online: https://www.st.com/resource/en/datasheet/lis344alh.pdf (accessed on 1 August 2020).
- InvenSense MPU6050 Data-Sheet. Available online: https://www.invensense.com/wp-content/uploads/2015/02/MPU-6000-Datasheet1.pdf%0A (accessed on 1 August 2020).
- InvenSense MPU 9250 Data-Sheet. Available online: https://cdn.sparkfun.com/assets/learn_tutorials/5/5/0/MPU9250REV1.0.pdf (accessed on 1 August 2020).
- STMicroelectronics LSM9DS1 Data-Sheet. Available online: https://www.st.com/resource/en/datasheet/lsm9ds1.pdf (accessed on 21 March 2021).
- Wireless Industrial IOT Inclinometer Sensor | Overview—BeanAir | Wireless IOT Sensors. Available online: https://www.beanair.com/wireless-iot-inclinometer-sensor-overview.html (accessed on 17 September 2021).
- Bedon, C.; Noè, S. Uncoupled Wi-Fi Body CoM Acceleration for the Analysis of Lightweight Glass Slabs under Random Walks. J. Sens. Actuator Netw. 2022, 11, 10. [Google Scholar] [CrossRef]
- Alliantech Accelerometer Mounting Considerations. Available online: http://www.alliantech.com/pdf/technique/vibration_montage2.pdf (accessed on 1 August 2020).
- Elhattab, A.; Uddin, N.; OBrien, E. Extraction of Bridge Fundamental Frequencies Utilizing a Smartphone MEMS Accelerometer. Sensors 2019, 19, 3143. [Google Scholar] [CrossRef] [PubMed] [Green Version]
- Kwong, K.-M. MEMS Accelerometer Specifications and Their Impact in Inertial Applications. Available online: http://www.eecg.utoronto.ca/~johns/nobots/theses/pdf/2017_keiming_kwong_masc.pdf (accessed on 7 March 2021).
- Ribeiro, R.R.; Lameiras, R. de M. Evaluation of low-cost MEMS accelerometers for SHM: Frequency and damping identification of civil structures. Lat. Am. J. Solids Struct. 2019, 16. [Google Scholar] [CrossRef] [Green Version]
- 356A01 Data-Sheet. Available online: https://www.pcb.com/contentstore/docs/PCB_Corporate/Vibration/Products/Manuals/356A01.pdf (accessed on 4 July 2022).
- Data Acquisition Handbook. Available online: https://www.mccdaq.com/support/Data-Acquisition-Handbook (accessed on 6 March 2021).
- IAC-Hires Data-Sheet. Available online: https://micromega-dynamics.com/wp-content/uploads/2020/03/IAC-HiRes-I-01-EN-Rev1p2.pdf (accessed on 24 March 2021).
- PCB Model 3713F112G Data-Sheet. Available online: https://www.pcb.com/products?m=3713F112G (accessed on 4 July 2022).
- Unquake Accelerometer Data-Sheet. Available online: https://www.unquake.co/en/products (accessed on 23 March 2021).
- RecoVibTiny Data-Sheet. Available online: https://micromega-dynamics.com/wp-content/uploads/2020/01/RecoVibTiny-EN-Rev1p4.pdf (accessed on 4 July 2022).
- Feng, D.; Feng, M.Q. Experimental validation of cost-effective vision-based structural health monitoring. Mech. Syst. Signal Process. 2017, 88, 199–211. [Google Scholar] [CrossRef]
- Cocconcelli, M.; Spaggiari, A. Mounting of accelerometers with structural adhesives: Experimental characterization of the dynamic response. J. Adhes. 2017, 93, 585–598. [Google Scholar] [CrossRef]
- Airouche, A.; Aknouche, H.; Bechtoula, H.; Mezouer, N.; Kibboua, A. Performance of the CGS six DOF shaking table on the harmonic signal reproduction. Period. Polytech. Civ. Eng. 2018, 62, 102–111. [Google Scholar] [CrossRef] [Green Version]
- Dang, Q.K.; Suh, Y.S. Sensor Saturation Compensated Smoothing Algorithm for Inertial Sensor Based Motion Tracking. Sensors 2014, 14, 8167. [Google Scholar] [CrossRef] [Green Version]
- Potter, M.V.; Ojeda, L.V.; Perkins, N.C.; Cain, S.M. Effect of IMU Design on IMU-Derived Stride Metrics for Running. Sensors 2019, 19, 2601. [Google Scholar] [CrossRef] [Green Version]
- Acoustic and Vibration Calibration | Applus+ Laboratories. Available online: https://www.appluslaboratories.com/global/en/what-we-do/service-sheet/acoustic-and-vibration-calibration (accessed on 4 July 2022).
- Sun, S.C.; Shi, G.C. Research on the output characteristics of MEMS convective accelerometer under heavy impact. In Proceedings of the 4th IEEE International Conference on Nano/Micro Engineered and Molecular Systems, NEMS, Shenzhen, China, 5–8 January 2009; pp. 33–36. [Google Scholar] [CrossRef]
- Lindstrom, M. Written By What’s Wrong With My Piezoelectric Accelerometer? Available online: www.pcb.com (accessed on 4 July 2022).
- REAL VNC Viewer | VNC® Connect. Available online: https://www.realvnc.com/en/connect/download/viewer/ (accessed on 4 July 2022).

| No. | Name | Acceleration Range (G) | Sampling Frequency (Hz) | Spectral Noise (µg/√Hz) | Sensitivity (V/G) | Price (€) | Acquisition System |
|---|---|---|---|---|---|---|---|
| 1 | IAC-Hires [61] | ±2.0 | 800 | 8 | 2.000 | 1192 | Recovib Monitor |
| 2 | 3713F112G [62] | ±2.0 | 500 | 10 | 0.675 | 2130 | 482C27 |
| 3 | Unquake [63] | ±2.0 | 500 | 25 | 0.400 | 2500 | Independent |
| 4 | Recovib Tiny [64] | ±2.0 | 500 | 30 | 0.600 | 1125 | Independent |
| 5 | LARA | ±2.0 | 333 | 51 | 0.625 | * 140 | Independent |
| 6 | CHEAP | ±2.0 | 85 | 162 | 0.625 | † 84 | A computer |
| 7 | MPU9250 | ±2.0 | 85 | 390 | 0.625 | ‡ 50 | A computer |
| Frequency (Hz) | LARA’s Error (%) | CHEAP’s Error (%) | MPU9250’s Error (%) |
|---|---|---|---|
| 0.1 | 0.450 | ||
| 0.2 | 0.295 | ||
| 0.3 | 0.260 | ||
| 0.4 | 0.050 | 0.470 | |
| 0.5 | 0.006 | 0.011 | |
| 2 | 0.005 | 0.025 | 0.025 |
| 4 | 0.000 | 0.000 | 0.000 |
| 8 | 0.003 | 0.003 | 0.003 |
| 10 | 0.004 | 0.004 | 0.004 |
| 16 | 0.001 | 0.001 | 0.001 |
| 32 | 0.003 | 0.003 | 0.003 |
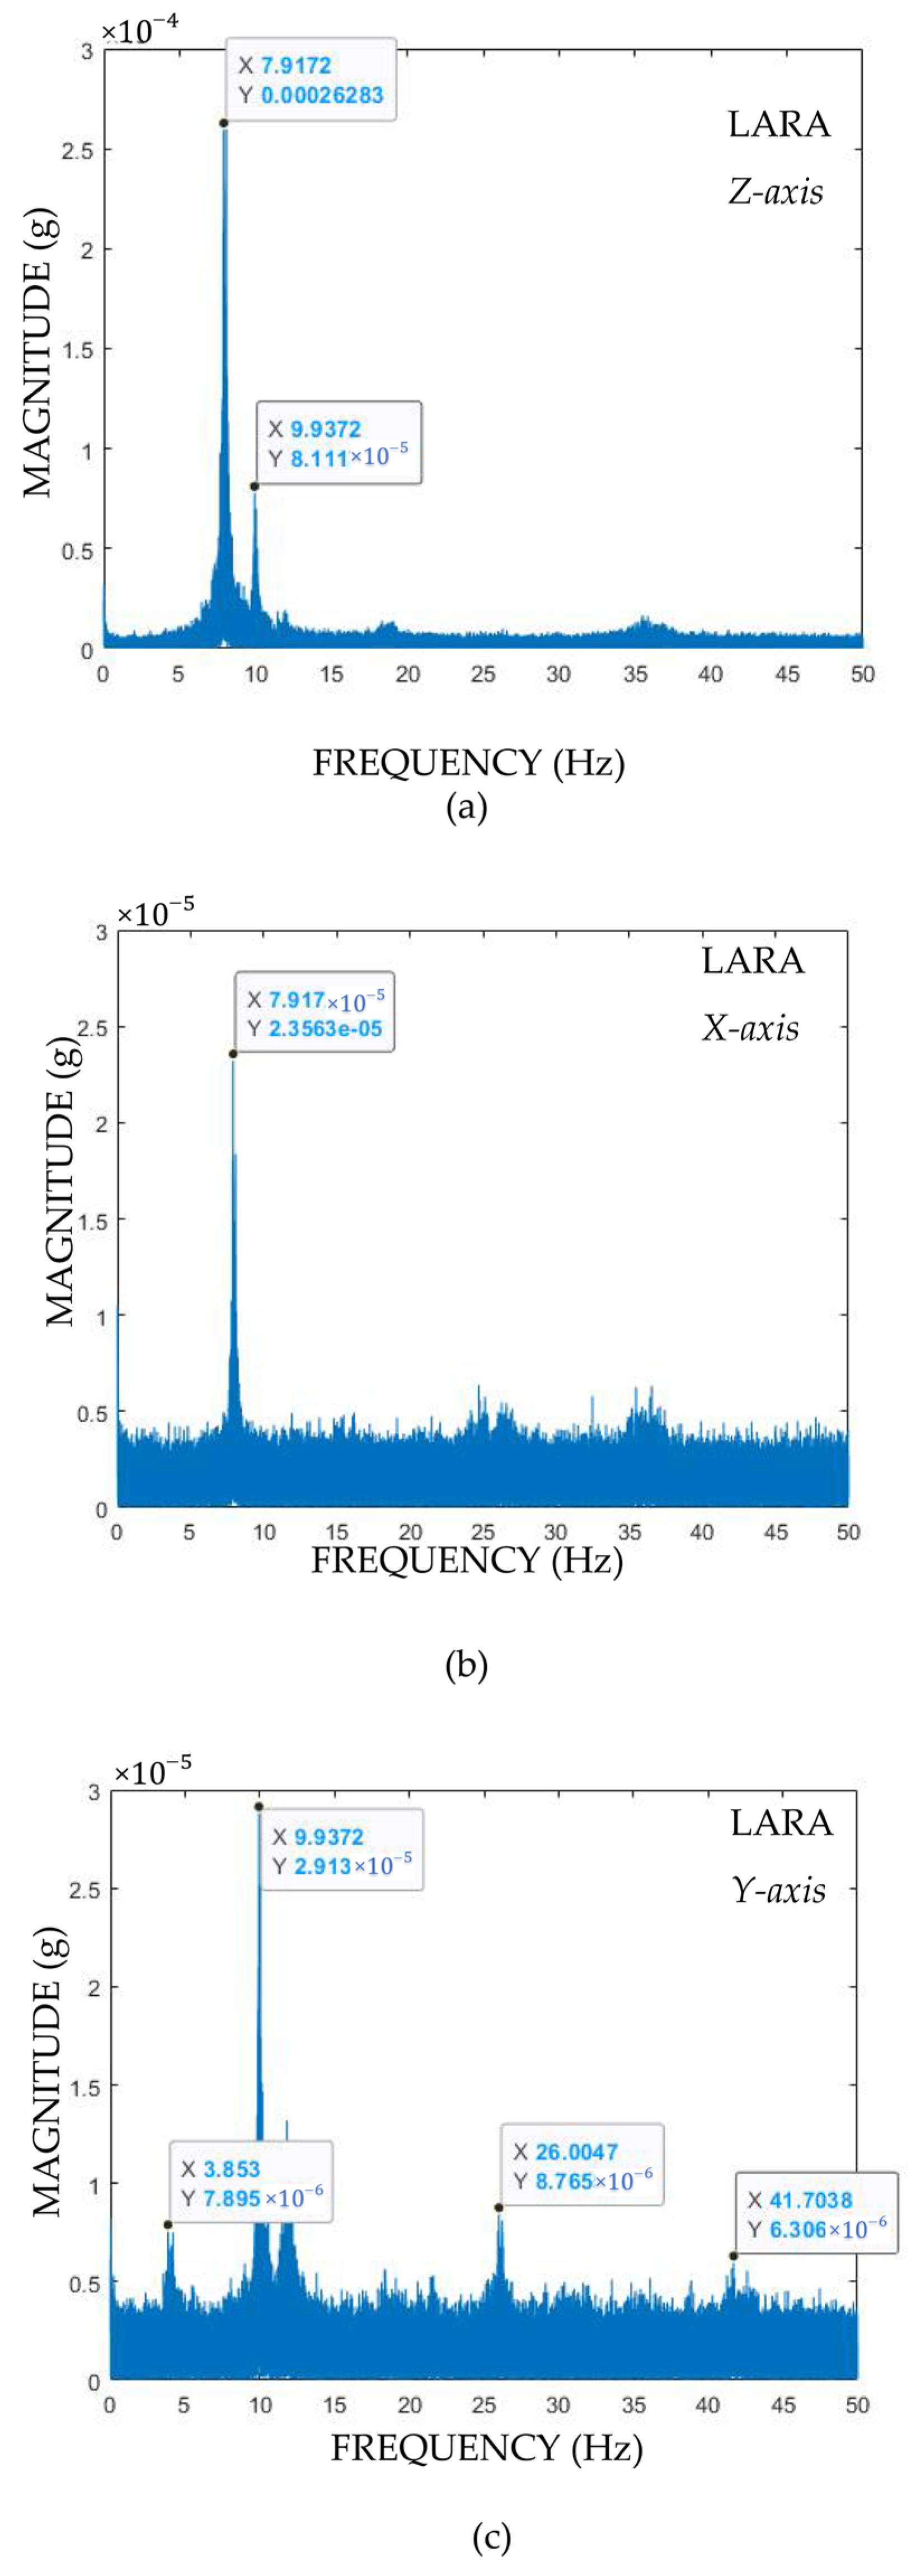
| Mode Number | HI-INC | LARA | Difference |
|---|---|---|---|
| 1 | 3.90 Hz | 3.85 Hz | 1.28% |
| 2 | 7.91 Hz | 7.91 Hz | 0.20% |
| 3 | 9.94 Hz | 9.93 Hz | 0.88% |
| 4 | 26.25 Hz | 26.01 Hz | 0.91% |
| 5 | 42.81 Hz | 41.70 Hz | 0.27% |
Publisher’s Note: MDPI stays neutral with regard to jurisdictional claims in published maps and institutional affiliations. |
© 2022 by the authors. Licensee MDPI, Basel, Switzerland. This article is an open access article distributed under the terms and conditions of the Creative Commons Attribution (CC BY) license (https://creativecommons.org/licenses/by/4.0/).
Share and Cite
Komarizadehasl, S.; Lozano, F.; Lozano-Galant, J.A.; Ramos, G.; Turmo, J. Low-Cost Wireless Structural Health Monitoring of Bridges. Sensors 2022, 22, 5725. https://doi.org/10.3390/s22155725
Komarizadehasl S, Lozano F, Lozano-Galant JA, Ramos G, Turmo J. Low-Cost Wireless Structural Health Monitoring of Bridges. Sensors. 2022; 22(15):5725. https://doi.org/10.3390/s22155725
Chicago/Turabian StyleKomarizadehasl, Seyedmilad, Fidel Lozano, Jose Antonio Lozano-Galant, Gonzalo Ramos, and Jose Turmo. 2022. "Low-Cost Wireless Structural Health Monitoring of Bridges" Sensors 22, no. 15: 5725. https://doi.org/10.3390/s22155725