
Graph-Based Resource Allocation for Integrated Space and Terrestrial Communications


Abstract
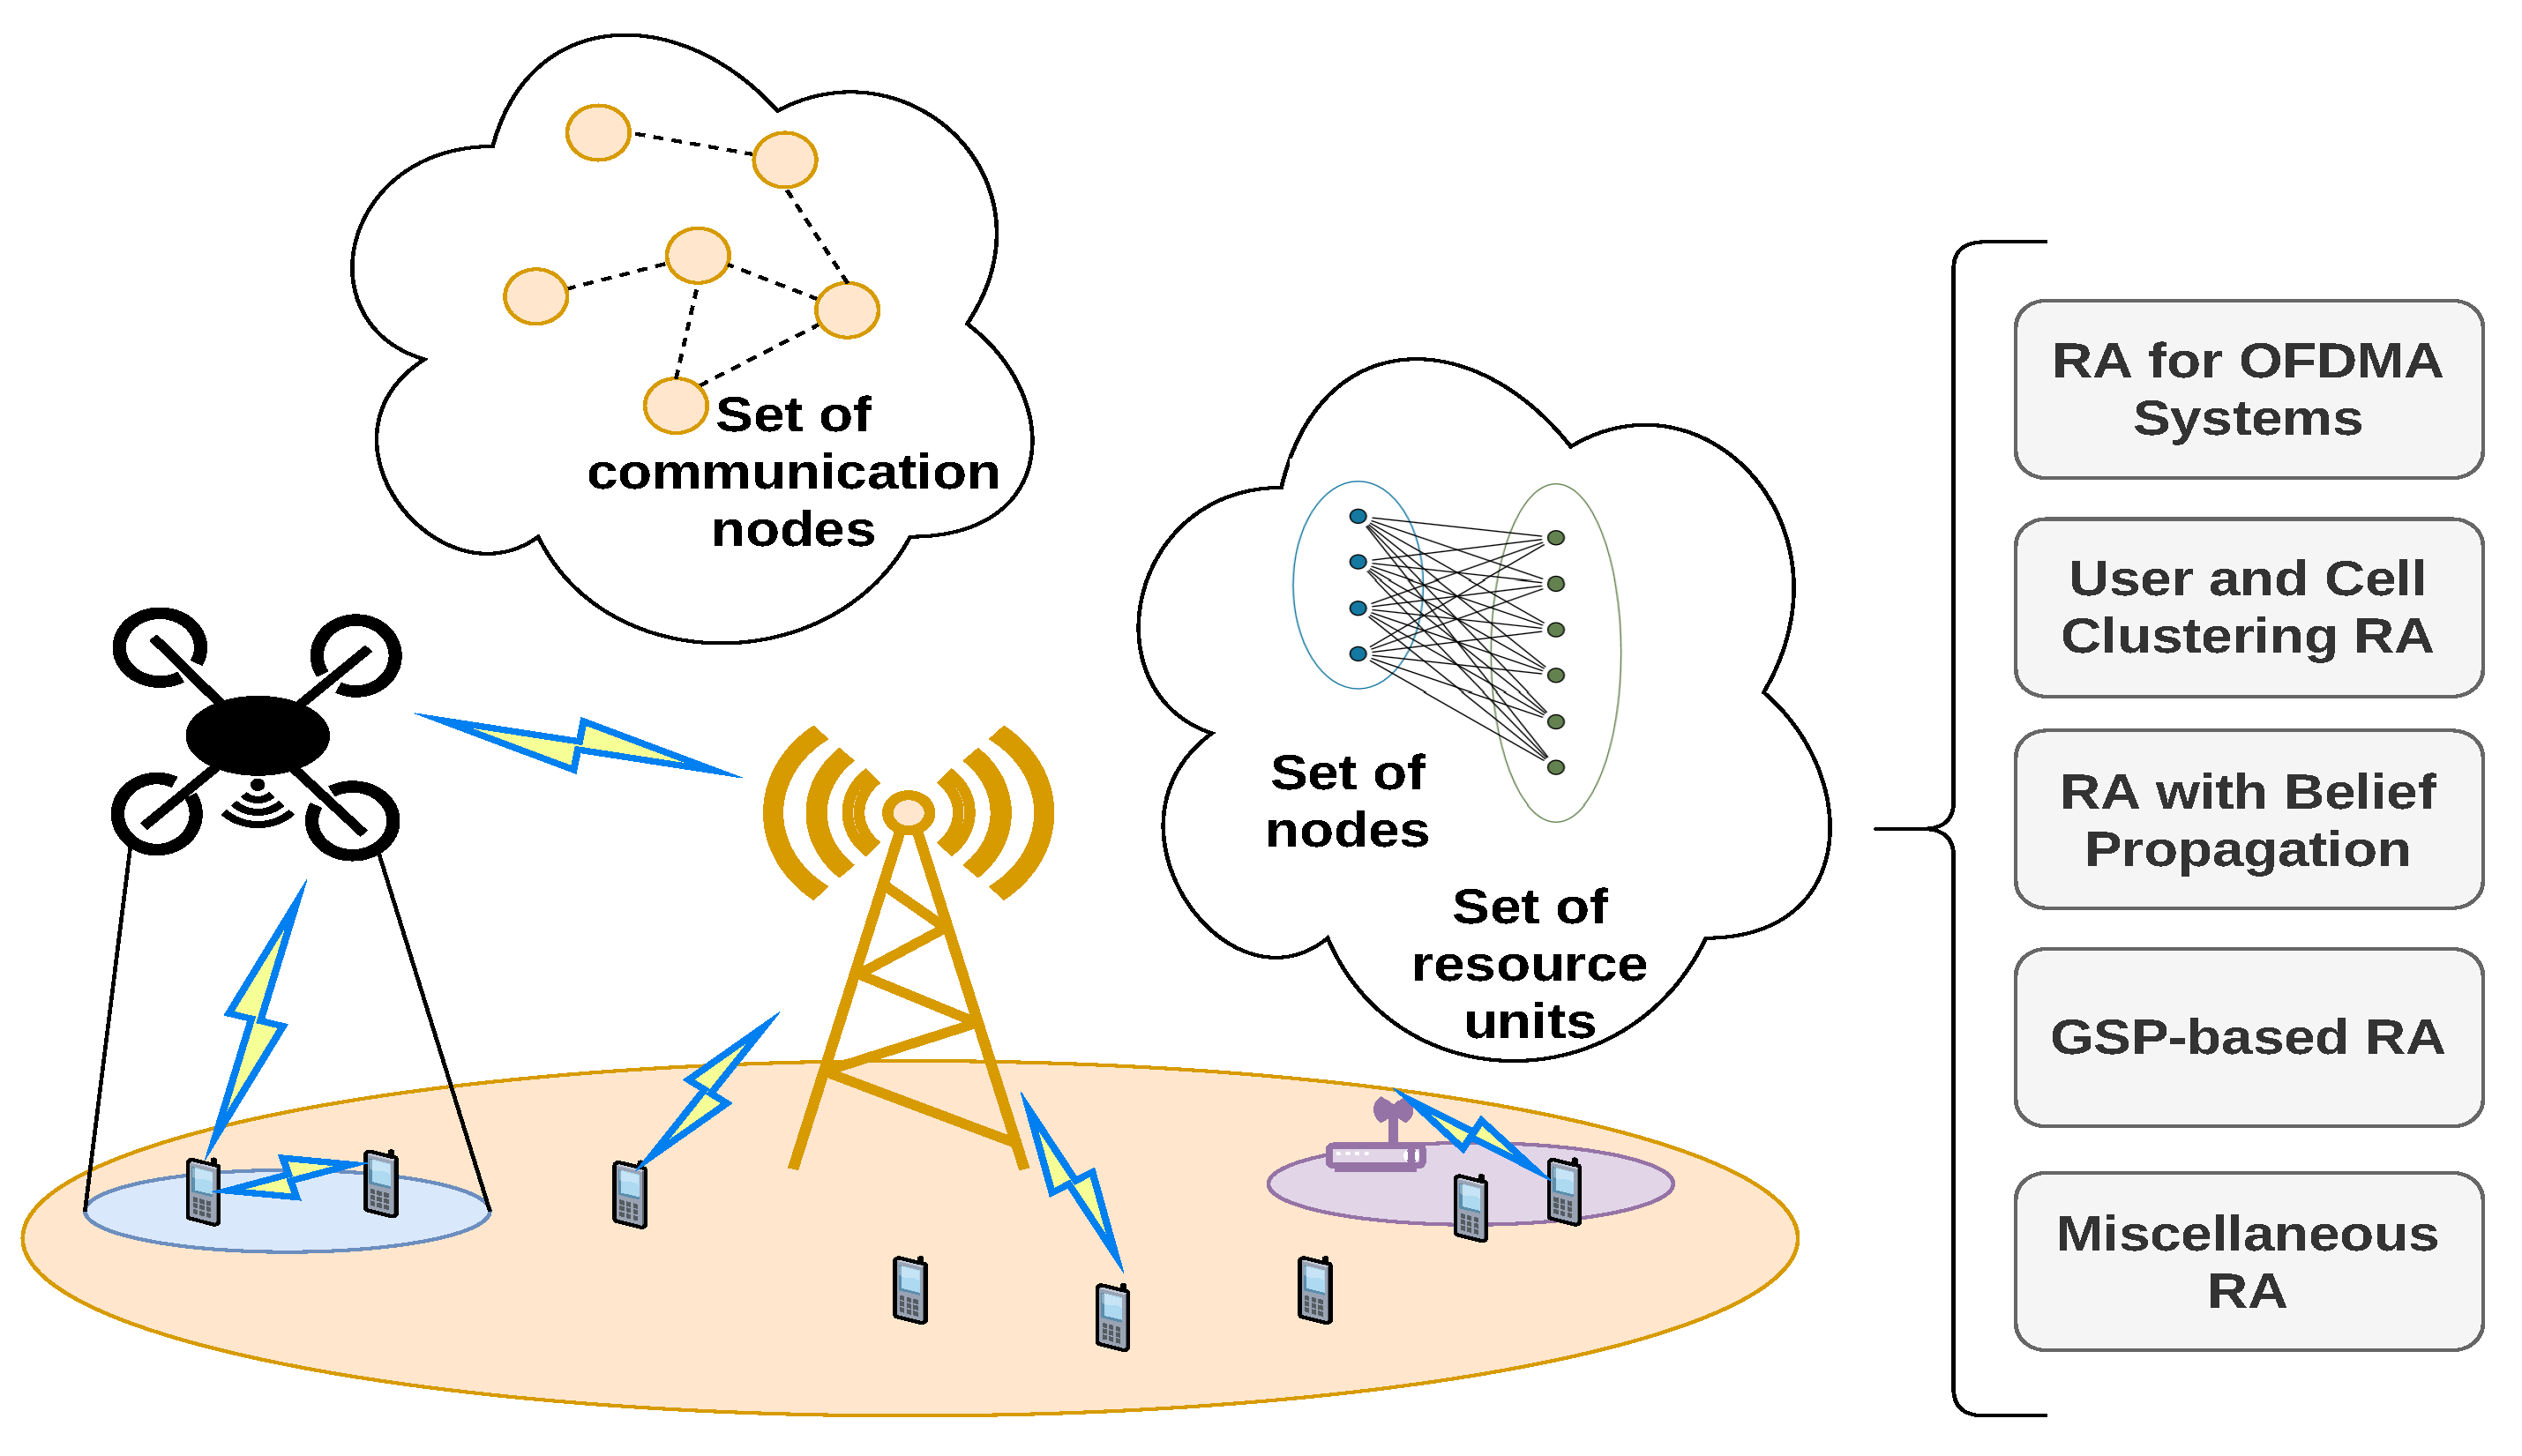
:1. Introduction
- Homogeneous and heterogeneous networks (Het-Nets). Most current wireless communication systems are of this type. Traditionally, terrestrial Het-Nets consist of cells with various ranges that serve multiple mobile UEs within their area of coverage. With the advent of integrated space and terrestrial networks (ISTNs) [2], Het-Nets expand to incorporate multiple ground-based licensed/license-free cellular networks, cell-less ultra-dense networks, as well as communications between unmanned aerial vehicle (UAV) based, marine, and satellite nodes. When only one communication standard is used in the network’s nodes, it is homogeneous. The base stations (BSs) are usually stationary, but they can also be mobile. Users are often characterized by bandwidth-intensive applications, and attach to the cell (or cells) which provides the most favorable throughput. RA is predominantly focused on providing inter-cell interference (ICI) coordination.
- Device-to-Device (D2D) Networks. They are characterized by the fact that the UEs themselves provide radio access for each other, and their communication exchanges are not intermediated by the BSs/Access Points (APs). Accordingly, low delays and high throughputs can be achieved, which makes D2D communications more prevalent in modern networks. The most significant challenge for them is what spectrum they are to utilize, considering D2D communications usually do not have particular bands assigned to them; instead, they complement the networks which use either cellular or unlicensed spectra [6].
- Cognitive Radio (CR) Networks. They increase the utilization of the spectrum allocated to other previously deployed wireless systems by accessing it opportunistically (i.e., only at locations, periods of time, and frequency channels in which no transmissions from the incumbent users, are present). CR-enabled UEs and APs (cognitive APs or CAPs) can determine the spectrum availability and perform DSA independently from, or in conjuncture with, the primary network.
1.1. Literature Search and Selection Methodology
1.2. Article Structure
- The methods for RA are categorized according to their network scenario (Het- Net/D2D/CR). The graph-based solutions and their performance are thoroughly surveyed. For each category, a tabular outline of the main design characteristics (such as the graph type and its formulation, and the optimization method used for the solution) is given. Analysis of these characteristics provides features of the research in every type of network scenario, as well as directions for future development.
- On the basis of the surveyed methods and existing visions for 6G ISTNs, the concept for Graph-based Resource allocation for Integrated Space and Terrestrial communications (GRIST) is introduced. It conceptualizes the design paradigm for the interconnectivity and coexistence of different networks within ISTN by describing their properties via a hypergraph and its attributes. The challenges in implementing GRIST are also given. Then, the design process of RA algorithms in GRIST is itself modeled by a simplified variant of a complete graph, thus presenting a scheme for determining the appropriate balance between the different design aspects (such as delay and computational complexity).
2. Motivation

| Survey Paper | Topics Addressed | Principal Advantages | Limitations, Relevant to This Work |
|---|---|---|---|
| Alwarafy et al. (2021) [5] | DRL algorithms for RA and UA in Het-Nets | Categorization of Het-Net scenarios and of the DRL methods used; advantages of DRL | Graph-based algorithms are not discussed |
| He et al. (2021) [11] | GNN-based solutions for wireless communications and image processing | Key challenges are outlined | Limited discussion of RA |
| Jiang (2021) [12] | GNN-based solutions for telecommunication networks | Comprehensive survey in wired, wireless, and software-defined networks | Limited discussion of RA |
| Xu et al. (2021) [4] | RA methods in Het-Nets | Categorization of RA algorithms according to their relevant tasks and performance parameters; new models for RA are proposed | Limited discussion of graph-based RA methods |
| Jameel et al. (2018) [6] | Aspects of D2D communications | Categorization of methods for implementing the main implementation aspects of D2D | Limited discussion of graph-based RA |
| Upadhye et al. (2021) [8] | ML-based algorithms for spectrum sensing and RA in CR networks | Categorization of ML methods according to the design for spectrum sensing, prediction, and allocation | Limited discussion of graph-based RA methods |
| This paper | Graph-based RA algorithms for RA in homogeneous and Het-Nets, D2D, CR and ISTNs | Comprehensive survey of the design and performance of graph-based RA algorithms; discussion of challenges for graph-based design for inter-connectivity and coexistence algorithms in ISTNs through GRIST | - |
3. Graphs for Signal Processing in Wireless Networks
- Adjacency matrix . The most important mathematical description of the graph, the adjacency matrix of size (N is the number of vertices) which describes the connectivity between edges and vertices. The columns of show the connections of each vertex to the rest.
- Incidence matrix . It is similar to the adjacency matrix, but its dimensions are (M is the number of edges). For undirected graphs, there are ones on all positions which indicate a vertex connected to an edge.
- Weight matrix. Its dimensions and the positions of the non-zero elements match those of the adjacency matrix. The weight matrix can be obtained by replacing the non-zero values of with coefficients (the edges’ weights) that carry physical meaning in some domain and are defined according to it.
- Degree matrix . Its dimensions are , and it contains the sum of the weights of all edges connected to each of the vertices. So shows that the importance of each vertex in the overall graph structure can be determined.
- Laplacian matrix . This is derived from the matrices above and is significant for practical signal processing applications. The Laplacian matrix is defined as . Its dimensions are , and it is characterized by positive elements on the diagonal and negative on the off-diagonal non-zero elements.
3.1. Types of Graphs
- General/Complete graph—This category includes various kinds of graphs that are defined using the physical relationships between the wireless network’s nodes (such as interference, social connections between users, and others). As for the complete graph, each of its vertices is connected to all of the rest. Accordingly, all non-diagonal entries of will be one, and all of the diagonal ones will be zero. An example is illustrated in Figure 3a. Depending on the physical relationships described via the model, some of the graphs are not necessarily complete.
- Bipartite (Kuratowski) graph—its vertices can be divided into two subsets and , such that there are edges between the nodes of each subset, but not those within the subset (Figure 3b). If all vertices in are connected to those in , the bipartite graph is complete. This type of graph may be extended to more than two subsets (a tripartite graph, for example, is composed of three subsets—two on each side and one between them), the vertices of each being connected to those of the adjacent subset.
- Star graph—a bipartite graph for which one subset contains only one vertex, while the other consists of the remaining vertices. In this way, the graph is formed in the shape of a star (Figure 3c) with one vertex connected to all of the others, whereas they do not have connections between themselves.
- Path graph—its first and last vertices are connected to only one other vertex (i.e., they have a degree of connectivity ), whereas all the rest connect to two (). A path graph is directed if all of its edges have directions which point to the succeeding vertices (Figure 3d).
3.2. Signal Processing on Graphs and Graph Neural Networks
4. Graph-Based RA in Cellular Homogeneous and Het-Nets
4.1. RA Methods in OFDMA Systems
4.2. RA Methods with User and Cell Clustering
4.3. RA Methods with Belief Propagation
4.4. RA Methods Based on GSP
4.5. Miscellaneous Methods
4.6. Lessons Learned and Trends in Development
- In this deployment scenario, the most prominent problem is RA because it is usually assumed that: (1) UA is performed independently through traditional methods, and (2) there is no inter-network spectrum sharing (SSh), i.e., the spectrum access is static, which is the usual case for this type of network. Due to the cell-edge throughput degradation problem, however, UA and RA should be considered together, and graph-based algorithms are a potent solution [28,29,37]. A significant challenge of designing them lies in how to properly group the different sets of vertices (UEs, macro cells, small cells, and APs), so that their constraints on the transmission power may be satisfied. In addition, the users in each tier are influenced by interference in an non-reciprocal manner (a small-cell user may receive more interference from a nearby macro cell than a user served by that cell). This also needs to be considered in the way that the graph’s edges are defined. Furthermore, the optimization problems will involve multiple independent variables such as the channel gains, power allocations, available channels, and distance between the nodes.
- When it comes to graph-based RA algorithms for Het-Nets, little attention has been given to the influence of the channel’s impairments (such as UE movement speed, fading, and noise distributions) on the received SINR, and thus to the throughput. Consequently, there is worth in considering whether a particular graph topology can take advantage of the dynamic network conditions (for example, the graph’s edges may need to be readjusted often with the movement of the UE). Modeling the Het-Net via GNN and considering these conditions as attributes of the vertices and edges can provide effective solutions in this case. These challenges become even more intricate when it comes to whether a particular set of channels is available or not, i.e., when multiple radio access technologies (RATs) coexist in the same or adjacent portions of the spectrum [20]. Then, dynamic and intelligent multiple access needs to be implemented through CR methods (discussed in Section 6).
- Several noteworthy works [44,45,46,47,48,49] have expanded the scope of RA methods for communications between UAV and satellite nodes, as well as their connection to terrestrial Het-Nets. The presented graph models are hereby briefly reviewed, and the relevant challenges described. Reliable connectivity between satellite nodes, considering the temporal changes due to their varying movement velocities, is considered in [44,45,46,47]. The creation of edges is determined by the duration of direct visibility between two communication nodes and their link latency. Network topology is adapted in time by the vertices’ attributes, according to the shortest path length and relevance (number of shortest paths going through a vertex) [44]. Alternatively, an RA solution is proposed in [45] which constructs the time-varying graph using two types of edges. They represent caching links and communication links, with each type of edge connecting two vertices (satellites/high-altitude platforms) that are related by either the cached data at one of the nodes, or by their information exchange. This approach is built upon in [46] by a commodity-flow algorithm for frequency scheduling of ground-based, UAV, and satellite nodes, and the links between those that communicate directly for the provision of a particular service. In [47], both the change in the nodes’ available bandwidth and their traffic load are modeled by a Markov model, jointly with the time-varying graph that models the space and terrestrial nodes’ movements. The connections between these nodes (vertices of the time-varying graph) constitute the edges, which change with the fluctuation of link availability (i.e., when handover occurs). This dynamic is described by the angular parameters of the satellites’ positions. RA is performed separately for the ground and space-based nodes. Link establishment that satisfies the shortest path in a graph for terrestrial, aerial and space communications is explored in [48]. The processing power and link delay between a node and the ones connected to it are considered, and they define the vertex attributes. RA is determined for specific user requirements modeled by a utility function. User pairing for NOMA has been modeled in [49] by a bipartite graph for terrestrial mobile users, the coverage of which is supplemented by a satellite node when they are outside of BS range. The channel gain between the users defines the edge attributes, and the pairing is solved via maximal matching to increase the throughput of the terrestrial BSs. The limitation of accumulating graph topology changes in time; however, it comes from the number of vertices and connections between them, as larger graphs will require not only a more significant computational burden on each iteration, but also a more complex accumulation process. Further development can be achieved through distributed topology generation via federated learning (FL) [50]. In addition, the implementation of the overall RA algorithm often includes several sub-problems (channel and power allocation, user grouping, handover, multiple access, etc.) that are solved independently [37,40,49]. Then, the challenge is to define and solve each of them in the most computationally efficient manner using traditional optimization methods or deep learning, with respect to the essential parameters (such as the number of channels and communication nodes).
- Considering the advantage of using graph-based methods to describe the physical characteristics of the communication nodes of homogeneous and Het-Nets, their relationships, and the disadvantage of computational complexity due to allocation of many users, channels, and power levels, the review in this Section has shown that GNNs are promising for decreasing the computational load of standard heuristic optimization solutions. However, their implementation requires the following considerations: (1) the training method involves either a preliminary simulation of the network’s operation to obtain data about the nodes and their relationships (in supervised learning), or the design of a RL procedure; (2) it involves definition of the relationships between the network’s nodes as components of the graph; (3) addressing MC (one UE being connected to multiple cells) and UA requires differentiation between the vertices that describe BSs and UEs; (4) attributes (such as interference levels, channel gain, associated nodes) of the vertices and edges may facilitate the learning of more complex graphs.
- Most graph-based methods in this category are evaluated for the DL case, but they may not be naturally applicable for UL communications because the interference sources (i.e., other UEs) are much greater in number than for the BSs (in the cellular Het-Net scenario). Their transmission power is also much weaker, which needs to be considered when determining the criterion (i.e., distance) of drawing an edge between two interfering users.
5. Graph-Based RA in D2D Networks
5.1. Joint Power and Channel Allocation Methods
5.2. Hypergraph-Based RA Methods
| Reference | Application | Graph Model Type | Tasks Solved via Graphs | Graph Formulation | Optimization Method | Performance Assessment |
|---|---|---|---|---|---|---|
| [51] | Channel allocation for CUEs and DUEs | Interference graph | Channel and power allocation | Vertices—CUEs and DUEs; edges—between CUEs and DUEs | Greedy algorithm | of 2.4 Mb/s for |
| [52] | Channel allocation for CUEs and DUEs | Tripartite/tree graph | Channel allocation | Vertices—channels, CUEs, DUEs; edges—between channels, CUEs, and DUEs; weights—throughput | Hungarian algorithm | of up to 650 b/s/Hz for and |
| [53] | Channel allocation for CUEs and DUEs | Bipartite graph | Channel allocation | Vertices—CUEs and D2D pairs; edges—between CUEs and D2D pairs; weights—SINR | Hungarian algorithm | up to 16 b/s/Hz for and |
| [54] | Channel allocation for CUEs and DUEs | Hypergraph | Channel allocation | Vertices—CUEs and DUEs; hyperedges—encompassing CUEs and DUEs, depending on the SINR | Greedy algorithm | Stable of up to 600 b/s/Hz for and |
| [55] | RA for V2Vs | Tripartite hypergraph | Channel allocation | Vertices—channels, V2Is, V2Vs; edges—between channels, V2Is, and V2Vs; weights—throughput | Heuristic algorithm | of up to 120 b/s/Hz |
| [56] | Channel allocation for V2Is and V2Vs | Tripartite hypergraph | Channel allocation | Vertices—V2Is, V2Vs, RBs; hyperedges—connecting RBs, V2Is and clusters of V2Vs | Greedy/iterative algorithm | of up to 26 b/s/Hz for up to 70 nodes |
| [57] | Channel allocation for CUEs, V2Is and V2Vs | Interference hypergraph | Channel allocation | Vertices—CUEs, V2Is, V2Vs; hyperedges—encompassing CUEs, V2Is, and V2Vs, depending on the SINR | Greedy algorithm | of up to 105 b/s/Hz for and |
| [59] | RA for DUEs | Interference graph | Channel allocation | Vertices - D2D pairs; edges—between the D2D pairs; weights—interference | Heuristic algorithm | of up to 1 Gb/s |
| [60] | Channel allocation for FD CUEs and D2Ds | Interference graph | Channel and power allocation | Vertices—DL CUEs, UL CUEs, DUEs; edges—between DL CUEs, UL CUEs, DUEs; weights—interference | Heuristic algorithm | of up to 38 b/s/Hz and for 120 links |
| [58] | Channel allocation for CUEs and DUEs | Bidirected interference graph | Channel allocation | Vertices—CUEs, DUEs; edges—between CUEs and DUEs; weights—cumulative interference | Tabu search algorithm | of up to 410 b/s/Hz and for , |
| [61] | Channel allocation for CUEs and DUEs | Interference graph | Channel allocation | Vertices—D2D pairs; edges—connecting the interfering D2D pairs | Heuristic algorithm | Average DUE satisfaction up to 70% for and |
| [62] | Channel allocation for CUEs and DUEs | Bipartite graph | Channel allocation | Vertices—CUEs, DUEs; edges—between CUEs and DUEs; weights—EE | Hungarian algorithm | of up to 1.5 kb/s/Hz for , |
| [63] | Channel allocation for CUEs and DUEs | Bipartite graph | Channel allocation | Vertices—D2D pairs and channels; edges—connecting D2D pairs and channels; weights—throughput | Hungarian algorithm | of up to 95 b/s/Hz for and |
| [64] | Channel allocation for CUEs and DUEs | Interference/ bipartite graph | Channel allocation | Vertices—CUEs/DUEs/CUE and DUE clusters; edges—connecting all respective vertices; weights—channel correlations/interference | Heuristic/ Hungarian algorithm | up to 100 b/s/Hz for |
| [65] | Channel allocation for CUEs and DUEs | Bipartite graph | Channel allocation | Vertices—CUEs and DUEs; edges—between CUEs and DUEs | Hungarian algorithm | at dB and dB for and |
| [66] | Channel allocation for CUEs and DUEs with social relationships | Interference/ social graph | Channel allocation | Vertices—CUEs and DUEs; edges—between CUEs and DUEs | Potential game | of 11 b/s/Hz for and |
| [67] | Channel allocation for CUEs and DUEs with limited CSI | Bipartite/ interference graph | Channel allocation | Vertices—CUEs and channels/CUEs and DUEs; edges’ weights—received signal/throughput | Heuristic algorithm | Stable for and |
| [68] | Channel allocation for CUEs and DUEs | Bipartite graph | Channel allocation | Vertices—channels, DUEs; edges—between channels and DUEs; weights—PF | Heuristic algorithm | of up to 12 b/s/Hz and for and |
| [69] | Channel allocation for CUEs and DUEs | Interference graph | Channel allocation | Vertices—small cells; edges—between interfering small cells | Hungarian algorithm | of up to 5 Gb/s for |
| [70] | Channel allocation for CUEs and DUEs | Interference graph | Channel allocation | Vertices—CUEs and DUEs; edges—connecting the interfering nodes | Heuristic algorithm | up to 2.5 Mb/s and for and |
5.3. Graph Coloring-Based RA Methods
5.4. RA Methods in NOMA Systems
5.5. Miscellaneous Methods
5.6. Lessons Learned and Trends in Development
- Significant emphasis is placed on the modeling of the network as a graph whereas the optimization algorithms are similar in principle. The main challenge, then, is to define a graph which corresponds well to the real-world relationships between the network nodes and the available frequency and power resources. On the other hand, introducing new modes of communication (such as NOMA or FD [60,62,63]) or application scenarios (such as V2V and V2I [55,56,57]) can expand the graph’s representation potency. Most of the reviewed methods utilize interference or bipartite grpahs due to their emphasis, either on the mutual influence between CUEs and DUEs, or on the allocation relationships between the nodes and the channels. Usually the solutions are divided into sub-problems which are solved in a particular sequence.
- Social graph and hypergraph structures are notable in some works. The social graph [66] has the benefit of incorporating not just the physical characteristics of the network’s nodes, but the user-related ones as well. Therefore, it is better suited for application-driven algorithms (such as cellular BS offloading), which also underlines its main design challenge, i.e., the definition of the user’s social relationship, so as to be described via attributes of the vertices/edges. The disadvantage of the social graph lies in the determination of the relationships of interest between the users in a D2D network. They are not directly related to the physical relationships between the communication nodes, and need to be modeled separately, thus potentially increasing the computational cost of the RA algorithm. The hypergraph, although harder to define, more completely captures the interference and movement dynamics between the incumbent and underlay nodes in the network. It also has the potential for matching not just multiple types of nodes, but also channel and power allocations at the same time. This model has been shown to be of particular usefulness in vehicular D2D scenarios [55,56,57].
- As the number of nodes within a macro cell increases, graph-based methods may cause a very significant delay in order to reach convergence [73]. Hence, they may be less suitable for scenarios where UEs change their mode from cellular to D2D due to the decreased performance for QoS in the high layers of OSI. Consequently, it is desirable for graph-based solutions to be evaluated through high-layer performance metrics as well. Another common limitation of the graph-based solutions is that each cellular user utilizes only one channel, which is usually not the case in realistic deployments. If different numbers of channels for each user are considered, the resulting graphs may be overly complex, both in their definition and solution.
- Some open questions concerning graph-based methods in D2D networks pertain to (1) The extent to which they are scalable, and at what D2D deployment density does a method become unreasonably complex. The graph’s topology may provide hints (such as maximum weight, maximum degree, and evaluation of the number of vertices at which the method converges in a reasonable time) as to how to determine such critical density. (2) The delay and the bandwidth needed for overhead exchange in large D2D networks are not usually considered directly. It would be reasonable to assume, nonetheless, that it may be prohibitive, even if the RA algorithm is itself computationally light. (3) The lack of perfect CSI at the BS, which may be alleviated through ML. However, a sufficient amount of training data will be necessary, the generation of which may not be trivial.
6. Graph-Based RA in CR Networks
6.1. RA Methods in Underlay CR Networks
6.2. RA Methods in Interweave CR Networks
6.3. RA Methods Based GSP
6.4. Miscellaneous Methods
6.5. Lessons Learned and Trends in Development
- The mutual influence between the PU network and that of the SUs (which, in a realistic scenario, may be significant) is rarely considered. Usually, the CR network is described as a separate graph. The SUs’ available channels are assumed to be fixed, and consequently, only the SUs’ throughput is assessed. However, in this case, the interference originating both from the SUs to the PUs, and the other way around, as well as the spectrum utilization gain (The throughput increase related to the introduction of the CR network in the spectrum of the PU) is not accounted for. The difficulty, then, comes from the graph and optimization algorithm designed to consider the RA of both networks, and (depending on the CR’s mode of operation) coordinate the SSh and RA decisions to provide optimal spectrum utilization and protection of the PU communications. A suitable tool for this purpose is for them to be modeled via GSP.
- The assumption of perfect CSI/spectrum occupancy information is problematic, especially in CR networks, which are not licensed users of the spectrum. PU misdetections should be considered in graph-based RA for SUs. Their and (as functions of the measured SNR) may be used as valuable attributes in a graph. Respectively, mechanisms that reduce the influence of imperfect spectrum sensing are needed. As presented by [79], high-accuracy CSS can be implemented as a GSP-based solution, and thus included in the procedure.
- Depending on the CR operation mode and the SUs’ number, the overhead exchange for clustering and RA may be prohibitive. Moreover, the RA method should consider the variable number of channels for SUs, which are characteristic of interweave CR networks. A disadvantage of graphs is that their number of vertices is fixed, and thus, their definition for modeling allocation of rapidly varying availability of channels (within the duration of the same simulation instance), may be significantly more difficult. Therefore, the graph-based solution may include UL/DL decoupling on different modes (DL on interweave, featuring non-graph based optimization, UL on underlay), with preliminary training of a GSP-based DRL method for specific deployment scenarios.
- The UA and RA of SUs/CAPs should be designed with consideration of whether the CR nodes are stationary, airborne (on UAVs), ground-based vehicular, marine, or carried/worn by humans [74]. They are situated in different locations/heights and diverse radio propagation conditions, so the complexity/capability of their functionalities for spectrum sensing, clustering, UA, and RA should reflect the environment’s severity.
7. Challenges and Design Aspects of the Holistic Graph-Based Resource Allocation for Integrated Space Terrestrial Networks
- Hypervertex attributes:
- -
- Available/unutilized channels. They may be shared with sub-networks of the same type or via CRs. In addition, CPs in nearby sub-networks can use this information to regulate their power and channel allocation.
- -
- Resource demands to meet the sub-network’s QoS requirements. A supplementary attribute that provides greater agility in SSh pairing between sub-networks. It also establishes priority in resource distribution due to the requirements (for example, groups of users requesting the same high-throughput streaming content, holographic telepresence, etc.) of certain sub-networks.
- -
- Sub-network EE gain. Its purpose is to describe the sub-network’s overall performance to notify its neighbors of the need for channel/power allocation readjustment. Furthermore, some operator infrastructure nodes (BSs/APs) may be switched to idle mode so as to reduce the power consumption. Achieving high EE will be the main optimization goal of the GRIST.
- -
- User data characteristics. Cooperative caching between sub-networks (both terrestrial and non-terrestrial) is facilitated by information about which data (type, amount, and period of time to be cached at a particular node) are required in a sub-network (or a set of sub-networks). This information is acquired through ML.
- Hyperedge attributes:
- -
- Distance between sub-networks. Determines the viability of frequency reuse and communication quality due to path loss. Unused channels can also be shared within a distance such that the potential interference is avoided. In addition, path loss is a significant consideration in communications between terrestrial and air/space nodes, so their association is dependent on the distance.
- -
- Carrier frequency of the connected sub-networks. It is an additional factor, together with the path loss, for association, resource sharing and information exchange between two sub-networks, especially considering the frequency range expansion with mmWave and terahertz in beyond 5G.
- The implementation of the RA procedures in ISTNs naturally involves a large number of nodes, sub-networks, and the optimization of the relevant parameters. Therefore, defining and solving graph-based RA algorithms in such scenarios is limited by the number of communication nodes that will ensure feasible computational complexity for the devices’ processing capabilities. This also poses the question of the optimization method’s scalability for realistic scenarios.
- Consequently, the implementation of RA will be limited by the requirements for EE of the sub-networks’ nodes.
- The RA algorithm for GRIST is unlikely to employ a unified graph model to describe the sub-problems that need to be solved due to the variety of the design parameters and radio environments in the different layers. As a consequence, the design process will be overburdened.
- Modeling coexistence and communications between sub-networks on different layers of GRIST. As it has been explored in various studies [90,91,93,96,97], the realization of the coexistence and reliable information exchange between contemporary and future networks is non-trivial. In order to provide ubiquitous and saleable networks that ensure seamless communications on all four layers [93,96], the integration of TN and NTNs can be facilitated by graph-based algorithms for RA, energy conservation, data offloading, localization, and dynamic spectrum access in the unlicensed bands (that are suitable for upcoming aerial communication nodes [97]). Such solutions will need to consider the physical parameters (speed, direction, weight, altitude of operation, size, available power supply/battery, etc.) of the communication node, which, together with the environmental aspects (such as fading, shadowing, wind, rain, and distance-dependent path loss) affect the communications. These aspects will then define the graphs’ structures and attributes within GRIST. The following two examples are given: (1) RA for a sub-network that includes terrestrial and aerial nodes (Figure 8a), is dependent on the physical parameters of the UAVs mentioned above, as well as on the movement speed and the spectrum access scheme (fixed/dynamic) of the ground users [96,97]. Together with the traditional RA problems in a terrestrial network, the graph-based solutions within GRIST will need to solve the problems of user and UAV mobility, determined by the aerial nodes’ battery limitation, transmission power, and available channels (incumbent or shared), which can also be described as vertex attributes. (2) The most essential parameters that concern the RA for a sub-network comprised of terrestrial/marine/aerial and space nodes (Figure 8b) are the link delay, achievable data rate, and the duration of direct visibility between the nodes [98]. They can be used as edge attributes, while physical parameters (such as longitude, latitude, speed, and capacity) serve as vertex attributes for graph-based RA algorithms for ISTNs.The optimization problem can be solved using deep neural networks and reinforcement learning (RL)-based training procedures, which have shown promising performance gains (such as fast convergence and short processing time) [99]. Different learning procedures may be utilized depending on the operations for service provision in the sub-networks. Supervised learning has widely been used for functions such as signal decoding, spectrum sensing, and multiple access, while reinforcement learning has been applied for RA on a sub-network level, and for radio access technology selection for ISTN [100,101].
- Modeling of graphs for RA methods in GRIST sub-networks. The relevant types of graphs, including GSP (Section 3), which is used for the modeling of the reviewed RA methods in each sub-category (comprising Section 4, Section 5 and Section 6), are highlighted in Table 9 that matches them with the sub-categories. The table illustrates which of them are most commonly applied, as well as those appropriate for application in GRIST. Firstly, as noted in Table 9, applying a graph-based RA approach will likely model both the sub-network’s nodes as a general/complete graph, and connect the available channel and/or power resources and users as a bipartite/tripartite graph. The general/complete graph type is the most intuitive for modeling the physical relationships between the network’s nodes, as their parameters (power level, channel gain, distance, interference, etc.) are aptly considered. In this way, the optimization method will also be updated at each iteration with inputs that reflect the influence of the nodes’ movement and the changes in their radio environment. The main limitation of this type is the significant increase in complexity with the number of nodes. Bipartite/tripartite graphs allow for resource distribution that also considers the environment’s influence, and they are easier to define. Nevertheless, they are viable for a fixed set of resources that are only available to a particular sub-network. Thus, these two types of graphs are near-universally applied in RA methods, as exemplified by the review in the previous Sections. Depending on the optimization method’s complexity (contributed primarily by the nodes’ density, the number of their links (i.e., whether they implement MC), the number of frequency channels, the social relationships between the nodes, etc.), an edge reduction mechanism will likely be necessary to increase the algorithm’s convergence speed. Overhead exchange for resource availability between sub-networks, as well as the management of resources for multiple sub-networks, may be modeled via star graphs, as they can describe the consolidation of the overhead in a single node (such as the CP). The current advancements in deep learning and its prominence in wireless communications research [12] point to the potential for RA algorithms within GRIST to be trained using GSP/GNN. In general, path graphs are not appropriate for modeling of RA methods for GRIST due to their linear, non-hierarchical nature.
- Solving algorithm. As seen in the review in the previous sections, heuristic algorithms based on logical sequence of procedures are prevalent in graph-based solutions for wireless communications. In addition, complex RA algorithms are often decomposed into sub-graphs or a combination of graph-based and traditional optimization methods. It is questionable to what extend such approaches will be practical, in terms of efficiency and performance, for implementing GRIST on a wide-scale. Therefore, scalability as the number of connected vertices grows substantially, even within a small area in a single layer of the ISTN, is a primary research direction for the development of GNN-based learning methods for RA between sub-networks. Although not a universal solution, graph encoding and compression [102] may be appropriate alternatives for application in GRIST. Furthermore, a recent method for sequential graph construction and aggregation [103] for GNNs has shown significant reduction in memory usage and processing time.
- GNN-based solutions for sub-network functionalities. Deep learning on graphs has shown potential for not just RA, but also for cognitive functionalities such as cooperative spectrum sensing, spectrum database construction, localization, modulation recognition, and spectrum decision [79,104,105], due to its ability for feature (SNR, distance, achievable throughput, QoS requirements) extraction from the network’s nodes. The impact of deep learning on graphs for these functionalities depends on the sub-network’s application, density, and throughput requirements. For the implementation of some of them, it may be more feasible to use a combination of probabilistic and deep learning methods, or the employment of the same type of data (such as received signal samples or statistics of various performance indicators) to train multi-purpose neural networks. Accordingly, multiple tasks (such as transmitter detection and recognition) may be performed both by the CP, or distributively (by sensors/APs/UEs) via the same deep learning model, while the achieved results can yield the information parameters (spectrum occupancy, user density, etc.) that form the hypergraph attributes described above. Then, the RA problem may be solved through reinforcement/supervised learning of a neural network on a graph.
- Applying FL for RA between sub-networks. The novel FL concept allows for decentralized learning of a global model by multiple devices in the network that perform training on their local datasets and transmit only the resulting parameters to the aggregation unit (usually a cloud server) [106]. In this way, the overhead exchange is reduced and the protection of the users’ private data is increased. Thus, the CSI and other traffic information can be provided from the sub-network’s UEs to their serving CPs, which perform continuous learning of their local models. Cooperating CPs can collaborate by aggregating just their individual RA decisions/results or GNN parameters (such as in [50]) at higher-level nodes within a network’s architecture (such as a remote cloud server of an IoT/cellular network).
- A significant challenge in the implementation of GRIST is the overhead exchange between the CPs and among the sub-networks’ nodes. It can be reduced through decentralized prediction of the wireless nodes’ movement behavior, traffic, and link delay [92]. This is made possible by the availability of information at each node, as well as the requirements and conditions of the vertices connected to it [95]. The prediction process can be further incorporated into a FL scheme for sub-network RA. It has been envisioned that the power consumption of the incurred overhead exchange will be reduced through renewable energy sources, dedicated to the wireless nodes [107]. Furthermore, compression of the redundant overhead information has also been recognized as an important research direction for decentralized learning in 6G.
- Spectrum sharing. Generally, it is considered a requirement for: (1) achieving the efficient utilization of the allocated spectrum of a particular communication system by sharing it with other wireless standards (it has been established by multiple measurement campaigns, such as [109,110], that the spectrum of many modern communication systems, especially those operating in the sub-6 GHz range, is poorly utilized for most of the time. Therefore, the coexistence between different wireless technologies is presently considered as a major research topic); and (2) integration of communication systems operating in different (especially, adjacent) frequency bands [111]. In other words, SSh is performed: (1) between the incumbent (primary) and non-licensed (or secondary) users; and (2) between the primary users of different wireless technologies. This aspect is applicable mostly for CR networks, and related to all other aspects apart from Data Caching, because that is directly associated with EE and RA.
- User association. The upcoming and future networks are multi-tiered, i.e., users communicate via multiple types of cells or access points (APs), and they do not associate with them in the same way. In some applications, the users are attached to multiple macro cells, while for others, numerous APs serve a single user (especially in scenarios where they are much more densely deployed than the UEs). Thus, UA is generally relevant for EE, SSh, Security, RA, and Delay.
- EE and conservation. This aspect represents a design requirement for not only the hardware components of the BSs, APs, and the user terminals, but also the network self-organization schemes which they operate on. These algorithms need to be designed with the consideration of minimizing the power consumption, which will otherwise become intolerably large as the networks in 5G and beyond encompass an ever-increasing number of nodes [112]. EE balances the computational complexity of the RA and power consumption, and it is relevant to all other aspects except Coexistence Capacity.
- Delay and Age of Information (AoI). Traditionally, wireless networks have had different latency and throughput requirements depending on whether the transferred information is to be perceived by the recipient in real time or not (and also how “real time” is defined for a particular scenario). With the increasing connectivity between machines and cyber-physical systems, the delay requirements have become more diverse. Recently, the AoI as a more general metric has been proposed [113], denoting the cumulative timing delays that consider both the physical and communication mechanisms that comprise the operation of the network’s nodes. The AoI is dependent on the number of nodes and the maximum number of iterations for the communication process’ completion. This aspect is related to all the rest.
- Coexistence capacity. This aspect describes the extent to which the application permits/enables coexistence of the network with others of different RATs, and is associated with the nodes’ communication capabilities and the operator’s policies. It is the most important determining factor for the complexity of the resource management scheme. This aspect is related to RA, SSh, Delay, and Security.
- Data caching. If the deployment scenario (such as V2V and cellular offloading) requires caching at the UEs/CPs, its realization (by determining which nodes are to cache what information, and how they are clustered) may have greater importance than the EE. That is due to the power conservation gained from avoiding the unnecessary transmissions from the BS/AP to each user. This aspect is related to the RA, Delay, EE, and Security.
- Security. As the services provided by the wireless networks, as well as the RATs that facilitate them, become more complex and demanding, security protocols need to be additionally enhanced to provide user data protection and prevention of unauthorized spectrum access. Achieving this will require supplementary procedures implemented in the various nodes via FL-based distributed methods [107,114], and a non-negligible overhead that is used for encryption of user data, authorization, and jamming of the malicious users for protection on the physical layer and of the authorized users’ access to the spectrum. Consequently, it is relevant to all the other aspects.
8. Future Research Directions
- The main challenge is decreasing the computational complexity of the RA methods by defining the graph in such a way as to decrease the number of vertices and avoid unnecessary connections between them.
- Using the proposed graph-based algorithm design model, the most prominent challenges for a specific network scenario and user terminal capabilities can be identified and focused upon.
- Incorporation of different functionalities that enable satisfactory communications and low power consumption.
- Integration of novel communication networks and services alongside existing ones through cognitive capabilities.
9. Conclusions
Author Contributions
Funding
Institutional Review Board Statement
Informed Consent Statement
Data Availability Statement
Conflicts of Interest
References
- Giordani, M.; Polese, M.; Mezzavilla, M.; Rangan, S.; Zorzi, M. Toward 6G networks: Use cases and technologies. IEEE Commun. Mag. 2020, 58, 55–61. [Google Scholar] [CrossRef]
- Jiang, W.; Han, B.; Habibi, M.A.; Schotten, H.D. The road towards 6G: A comprehensive survey. IEEE Open J. Commun. Soc. 2021, 2, 334–366. [Google Scholar] [CrossRef]
- Tataria, H.; Shafi, M.; Molisch, A.F.; Dohler, M.; Sjöland, H.; Tufvesson, F. 6G wireless systems: Vision, requirements, challenges, insights, and opportunities. Proc. IEEE 2021, 109, 1166–1199. [Google Scholar] [CrossRef]
- Xu, Y.; Gui, G.; Gacanin, H.; Adachi, F. A survey on resource allocation for 5G heterogeneous networks: Current research, future trends and challenges. IEEE Commun. Surv. Tutor. 2021, 23, 668–695. [Google Scholar] [CrossRef]
- Alwarafy, A.; Abdallah, M.; Ciftler, B.S.; Al-Fuqaha, A.; Hamdi, M. Deep Reinforcement Learning for Radio Resource Allocation and Management in Next Generation Heterogeneous Wireless Networks: A Survey. arXiv 2021, arXiv:2106.00574. [Google Scholar]
- Jameel, F.; Hamid, Z.; Jabeen, F.; Zeadally, S.; Javed, M.A. A survey of device-to-device communications: Research issues and challenges. IEEE Commun. Surv. Tutor. 2018, 20, 2133–2168. [Google Scholar] [CrossRef]
- Hu, F.; Chen, B.; Zhu, K. Full spectrum sharing in cognitive radio networks toward 5G: A survey. IEEE Access 2018, 6, 15754–15776. [Google Scholar] [CrossRef]
- Upadhye, A.; Saravanan, P.; Chandra, S.S.; Gurugopinath, S. A Survey on Machine Learning Algorithms for Applications in Cognitive Radio Networks. arXiv 2021, arXiv:2106.10413. [Google Scholar]
- Shen, Y.; Shi, Y.; Zhang, J.; Letaief, K.B. A graph neural network approach for scalable wireless power control. In Proceedings of the 2019 IEEE Globecom Workshops (GC Wkshps), Waikoloa, HI, USA, 9–13 December 2019; IEEE: Piscataway, NJ, USA, 2019; pp. 1–6. [Google Scholar]
- Chen, Q.; Meng, W.; He, C. Graph-Based Resource Allocation for Air-Ground Integrated Networks. Mob. Netw. Appl. 2021, 27, 492–501. [Google Scholar] [CrossRef]
- He, S.; Xiong, S.; Ou, Y.; Zhang, J.; Wang, J.; Huang, Y.; Zhang, Y. An overview on the application of graph neural networks in wireless networks. IEEE Open J. Commun. Soc. 2021, 2, 2547–2565. [Google Scholar] [CrossRef]
- Jiang, W. Graph-based deep learning for communication networks: A survey. Comput. Commun. 2021, 185, 40–54. [Google Scholar] [CrossRef]
- Page, M.J.; McKenzie, J.E.; Bossuyt, P.M.; Boutron, I.; Hoffmann, T.C.; Mulrow, C.D.; Shamseer, L.; Tetzlaff, J.M.; Akl, E.A.; Brennan, S.E.; et al. The PRISMA 2020 statement: An updated guideline for reporting systematic reviews. Syst. Rev. 2021, 10, 1–11. [Google Scholar] [CrossRef]
- Stankovic, L.; Mandic, D.P.; Dakovic, M.; Kisil, I.; Sejdic, E.; Constantinides, A.G. Understanding the basis of graph signal processing via an intuitive example-driven approach [lecture notes]. IEEE Signal Process. Mag. 2019, 36, 133–145. [Google Scholar] [CrossRef]
- Sandryhaila, A.; Moura, J.M. Big data analysis with signal processing on graphs: Representation and processing of massive data sets with irregular structure. IEEE Signal Process. Mag. 2014, 31, 80–90. [Google Scholar] [CrossRef]
- Stankovic, L.; Mandic, D.; Dakovic, M.; Brajovic, M.; Scalzo, B.; Constantinides, T. Graph Signal Processing—Part I: Graphs, Graph Spectra, and Spectral Clustering. arXiv 2019, arXiv:1907.03467. [Google Scholar]
- Stankovic, L.; Mandic, D.; Dakovic, M.; Brajovic, M.; Scalzo, B.; Constantinides, A.G. Graph signal processing—Part II: Processing and analyzing signals on graphs. arXiv 2019, arXiv:1909.10325. [Google Scholar]
- Wu, Z.; Pan, S.; Chen, F.; Long, G.; Zhang, C.; Philip, S.Y. A comprehensive survey on graph neural networks. IEEE Trans. Neural Netw. Learn. Syst. 2020, 32, 4–24. [Google Scholar] [CrossRef] [PubMed] [Green Version]
- Zaki, A.N.; Fapojuwo, A.O. Optimal and efficient graph-based resource allocation algorithms for multiservice frame-based OFDMA networks. IEEE Trans. Mob. Comput. 2010, 10, 1175–1186. [Google Scholar] [CrossRef]
- Khaturia, M.; Suman, S.; Karandikar, A.; Chaporkar, P. Spectrum sharing for LTE-A network in TV white space. In Proceedings of the 2018 Twenty Fourth National Conference on Communications (NCC), Hyderabad, India, 25–28 February 2018; IEEE: Piscataway, NJ, USA, 2018; pp. 1–6. [Google Scholar]
- Zhao, F.; Ma, W.; Zhou, M.; Zhang, C. A graph-based QoS-aware resource management scheme for OFDMA femtocell networks. IEEE Access 2017, 6, 1870–1881. [Google Scholar] [CrossRef]
- Pateromichelakis, E.; Shariat, M.; Quddus, A.; Dianati, M.; Tafazolli, R. Dynamic clustering framework for multi-cell scheduling in dense small cell networks. IEEE Commun. Lett. 2013, 17, 1802–1805. [Google Scholar] [CrossRef] [Green Version]
- Pateromichelakis, E.; Shariat, M.; Quddus, A.U.; Tafazolli, R. Graph-based multicell scheduling in OFDMA-based small cell networks. IEEE Access 2014, 2, 897–908. [Google Scholar] [CrossRef]
- Chen, Z.; Hou, X.; Yang, C. Training resource allocation for user-centric base station cooperation networks. IEEE Trans. Veh. Technol. 2015, 65, 2729–2735. [Google Scholar] [CrossRef]
- Jiang, L.; Sha, X.; Wu, X.; Zhang, N. A novel resource allocation algorithm based on downlink and uplink decouple access scheme in heterogeneous networks. China Commun. 2016, 13, 22–31. [Google Scholar] [CrossRef]
- Guo, F.; Lu, H.; Zhu, D.; Wu, H. Interference-aware user grouping strategy in NOMA systems with QoS constraints. In Proceedings of the IEEE INFOCOM 2019-IEEE Conference on Computer Communications, Paris, France, 29 April–2 May 2019; IEEE: Piscataway, NJ, USA, 2019; pp. 1378–1386. [Google Scholar]
- Zeng, M.; Yadav, A.; Dobre, O.A.; Poor, H.V. Energy-efficient joint user-RB association and power allocation for uplink hybrid NOMA-OMA. IEEE Internet Things J. 2019, 6, 5119–5131. [Google Scholar] [CrossRef] [Green Version]
- Chen, Y.; Li, J.; Chen, W.; Lin, Z.; Vucetic, B. Joint user association and resource allocation in the downlink of heterogeneous networks. IEEE Trans. Veh. Technol. 2015, 65, 5701–5706. [Google Scholar] [CrossRef]
- Fan, Y.; Zhang, Z.; Li, H. Message passing based distributed learning for joint resource allocation in millimeter wave heterogeneous networks. IEEE Trans. Wirel. Commun. 2019, 18, 2872–2885. [Google Scholar] [CrossRef]
- Shen, Y.; Shi, Y.; Zhang, J.; Letaief, K.B. Graph neural networks for scalable radio resource management: Architecture design and theoretical analysis. IEEE J. Sel. Areas Commun. 2020, 39, 101–115. [Google Scholar] [CrossRef]
- Guo, J.; Yang, C. Learning Power Control for Cellular Systems with Heterogeneous Graph Neural Network. In Proceedings of the 2021 IEEE Wireless Communications and Networking Conference (WCNC), Nanjing, China, 29 March–1 April 2021; IEEE: Piscataway, NJ, USA, 2021; pp. 1–6. [Google Scholar]
- Chowdhury, A.; Verma, G.; Rao, C.; Swami, A.; Segarra, S. Efficient power allocation using graph neural networks and deep algorithm unfolding. In Proceedings of the ICASSP 2021-2021 IEEE International Conference on Acoustics, Speech and Signal Processing (ICASSP), Toronto, ON, Canada, 6–11 June 2021; IEEE: Piscataway, NJ, USA, 2021; pp. 4725–4729. [Google Scholar]
- Wang, Z.; Eisen, M.; Ribeiro, A. Unsupervised learning for asynchronous resource allocation in ad-hoc wireless networks. In Proceedings of the ICASSP 2021-2021 IEEE International Conference on Acoustics, Speech and Signal Processing (ICASSP), Toronto, ON, Canada, 6–11 June 2021; IEEE: Piscataway, NJ, USA, 2021; pp. 8143–8147. [Google Scholar]
- Nakashima, K.; Kamiya, S.; Ohtsu, K.; Yamamoto, K.; Nishio, T.; Morikura, M. Deep reinforcement learning-based channel allocation for wireless lans with graph convolutional networks. IEEE Access 2020, 8, 31823–31834. [Google Scholar] [CrossRef]
- Chen, C.S.; Baccelli, F.; Roullet, L. Joint optimization of radio resources in small and macro cell networks. In Proceedings of the 2011 IEEE 73rd Vehicular Technology Conference (VTC Spring), Budapest, Hungary, 15–18 May 2011; IEEE: Piscataway, NJ, USA, 2011; pp. 1–5. [Google Scholar]
- Song, Q.; Wang, X.; Qiu, T.; Ning, Z. An interference coordination-based distributed resource allocation scheme in heterogeneous cellular networks. IEEE Access 2017, 5, 2152–2162. [Google Scholar] [CrossRef]
- Wang, F.; Chen, W.; Tang, H.; Wu, Q. Joint optimization of user association, subchannel allocation, and power allocation in multi-cell multi-association OFDMA heterogeneous networks. IEEE Trans. Commun. 2017, 65, 2672–2684. [Google Scholar] [CrossRef] [Green Version]
- Zhao, F.; Ma, W.; Zhou, M.; Zhang, C. A two-timescale graph-based resource allocation scheme combing dynamic eICIC in Heterogeneous Networks. Phys. Commun. 2018, 29, 191–202. [Google Scholar] [CrossRef]
- Guo, K.; Liu, T.; Yang, C.; Xiong, Z. Interference coordination and resource allocation planning with predicted average channel gains for HetNets. IEEE Access 2018, 6, 60137–60151. [Google Scholar] [CrossRef]
- Chai, R.; Chen, M.; Chen, Q.; Gao, Y. An optimal joint user association and power allocation algorithm for secrecy information transmission in heterogeneous networks. Wirel. Commun. Mob. Comput. 2017, 2017, 5120538. [Google Scholar] [CrossRef]
- Kingma, D.P.; Ba, J. Adam: A method for stochastic optimization. arXiv 2014, arXiv:1412.6980. [Google Scholar]
- Hinton, G.; Srivastava, N.; Swersky, K. Neural networks for machine learning lecture 6a overview of mini-batch gradient descent. Cited 2012, 14, 2. [Google Scholar]
- Wang, Z.; Eisen, M.; Ribeiro, A. Learning Decentralized Wireless Resource Allocations with Graph Neural Networks. arXiv 2021, arXiv:2107.01489. [Google Scholar] [CrossRef]
- Du, J.; Jiang, C.; Yu, S.; Ren, Y. Time cumulative complexity modeling and analysis for space-based networks. In Proceedings of the 2016 IEEE International Conference on Communications (ICC), Kuala Lumpur, Malaysia, 22–27 May 2016; IEEE: Piscataway, NJ, USA, 2016; pp. 1–6. [Google Scholar]
- Wang, P.; Zhang, X.; Zhang, S.; Li, H.; Zhang, T. Time-expanded graph-based resource allocation over the satellite networks. IEEE Wirel. Commun. Lett. 2018, 8, 360–363. [Google Scholar] [CrossRef]
- Zhang, T.; Li, J.; Li, H.; Zhang, S.; Wang, P.; Shen, H. Application of time-varying graph theory over the space information networks. IEEE Netw. 2020, 34, 179–185. [Google Scholar] [CrossRef]
- Chen, L.; Tang, F.; Li, Z.; Yang, L.T.; Yu, J.; Yao, B. Time-varying resource graph based resource model for space-terrestrial integrated networks. In Proceedings of the IEEE INFOCOM 2021-IEEE Conference on Computer Communications, Vancouver, BC, Canada, 10–13 May 2021; IEEE: Piscataway, NJ, USA, 2021; pp. 1–10. [Google Scholar]
- Zhang, P.; Yang, P.; Kumar, N.; Guizani, M. Space-Air-Ground Integrated Network Resource Allocation Based on Service Function Chain. IEEE Trans. Veh. Technol. 2022, 71, 7730–7738. [Google Scholar] [CrossRef]
- Wang, L.; Wu, Y.; Zhang, H.; Choi, S.; Leung, V.C. Resource allocation for NOMA based space-terrestrial satellite networks. IEEE Trans. Wirel. Commun. 2020, 20, 1065–1075. [Google Scholar] [CrossRef]
- Li, B.; Swami, A.; Segarra, S. Power Allocation for Wireless Federated Learning using Graph Neural Networks. arXiv 2021, arXiv:2111.07480. [Google Scholar]
- Zhang, R.; Cheng, X.; Yang, L.; Jiao, B. Interference graph-based resource allocation (InGRA) for D2D communications underlaying cellular networks. IEEE Trans. Veh. Technol. 2014, 64, 3844–3850. [Google Scholar] [CrossRef]
- Hoang, T.D.; Le, L.B.; Le-Ngoc, T. Resource allocation for D2D communication underlaid cellular networks using graph-based approach. IEEE Trans. Wirel. Commun. 2016, 15, 7099–7113. [Google Scholar] [CrossRef]
- Kai, C.; Wu, Y.; Hu, X.; Huang, W. Joint subcarrier and power allocation in D2D communications underlaying cellular networks. In Proceedings of the 2020 IEEE Wireless Communications and Networking Conference (WCNC), Seoul, Korea, 25–28 May 2020; IEEE: Piscataway, NJ, USA, 2020; pp. 1–6. [Google Scholar]
- Zhang, H.; Song, L.; Han, Z. Radio resource allocation for device-to-device underlay communication using hypergraph theory. IEEE Trans. Wirel. Commun. 2016, 15, 4852–4861. [Google Scholar] [CrossRef] [Green Version]
- Liang, L.; Xie, S.; Li, G.Y.; Ding, Z.; Yu, X. Graph-based radio resource management for vehicular networks. In Proceedings of the 2018 IEEE International Conference on Communications (ICC), Kansas City, MO, USA, 20–24 May 2018; IEEE: Piscataway, NJ, USA, 2018; pp. 1–6. [Google Scholar]
- Wang, B.; Zhang, R.; Chen, C.; Cheng, X.; Yang, L.; Jin, Y. Interference hypergraph-based 3D matching resource allocation protocol for NOMA-V2X networks. IEEE Access 2019, 7, 90789–90800. [Google Scholar] [CrossRef]
- Khan, U.A.; Lee, S.S. Three-dimensional resource allocation in D2D-based V2V communication. Electronics 2019, 8, 962. [Google Scholar] [CrossRef] [Green Version]
- Zhao, L.; Wang, H.; Zhong, X. Interference graph based channel assignment algorithm for D2D cellular networks. IEEE Access 2018, 6, 3270–3279. [Google Scholar] [CrossRef]
- Deng, J.; Tirkkonen, O.; Freij-Hollanti, R.; Chen, T.; Nikaein, N. Resource allocation and interference management for opportunistic relaying in integrated mmWave/sub-6 GHz 5G networks. IEEE Commun. Mag. 2017, 55, 94–101. [Google Scholar] [CrossRef]
- Yang, T.; Zhang, R.; Cheng, X.; Yang, L. Graph coloring based resource sharing (GCRS) scheme for D2D communications underlaying full-duplex cellular networks. IEEE Trans. Veh. Technol. 2017, 66, 7506–7517. [Google Scholar] [CrossRef]
- Alsharfa, R.M.; Mohammed, S.L.; Gharghan, S.K.; Khan, I.; Choi, B.J. Cellular-D2D Resource Allocation Algorithm Based on User Fairness. Electronics 2020, 9, 386. [Google Scholar] [CrossRef] [Green Version]
- Alemaishat, S.; Saraereh, O.A.; Khan, I.; Choi, B.J. An efficient resource allocation algorithm for D2D communications based on NOMA. IEEE Access 2019, 7, 120238–120247. [Google Scholar] [CrossRef]
- Dai, Y.; Sheng, M.; Liu, J.; Cheng, N.; Shen, X.; Yang, Q. Joint mode selection and resource allocation for D2D-enabled NOMA cellular networks. IEEE Trans. Veh. Technol. 2019, 68, 6721–6733. [Google Scholar] [CrossRef]
- Solaiman, S.; Nassef, L.; Fadel, E. User Clustering and Optimized Power Allocation for D2D Communications at mmWave Underlaying MIMO-NOMA Cellular Networks. IEEE Access 2021, 9, 57726–57742. [Google Scholar] [CrossRef]
- Nguyen, H.V.; Duong, Q.; Nguyen, V.D.; Shin, Y.; Shin, O.S. Optimization of resource allocation for underlay device-to-device communications in cellular networks. Peer- Netw. Appl. 2016, 9, 965–977. [Google Scholar] [CrossRef]
- Zhao, Y.; Li, Y.; Cao, Y.; Jiang, T.; Ge, N. Social-aware resource allocation for device-to-device communications underlaying cellular networks. IEEE Trans. Wirel. Commun. 2015, 14, 6621–6634. [Google Scholar] [CrossRef]
- Maghsudi, S.; Stańczak, S. Hybrid centralized–distributed resource allocation for device-to-device communication underlaying cellular networks. IEEE Trans. Veh. Technol. 2015, 65, 2481–2495. [Google Scholar] [CrossRef] [Green Version]
- Mondal, I.; Neogi, A.; Chaporkar, P.; Karandikar, A. Bipartite graph based proportional fair resource allocation for D2D communication. In Proceedings of the 2017 IEEE wireless communications and networking conference (WCNC), San Francisco, CA, USA, 19–22 March 2017; IEEE: Piscataway, NJ, USA, 2017; pp. 1–6. [Google Scholar]
- Liu, Y.; Wang, Y.; Sun, R.; Miao, Z. Distributed resource allocation for D2D-assisted small cell networks with heterogeneous spectrum. IEEE Access 2019, 7, 83900–83914. [Google Scholar] [CrossRef]
- Lai, W.K.; Wang, Y.C.; Lin, H.C.; Li, J.W. Efficient resource allocation and power control for LTE-A D2D communication with pure D2D model. IEEE Trans. Veh. Technol. 2020, 69, 3202–3216. [Google Scholar] [CrossRef]
- Glover, F. Tabu search—part I. ORSA J. Comput. 1989, 1, 190–206. [Google Scholar] [CrossRef] [Green Version]
- Eberhart, R.; Kennedy, J. A new optimizer using particle swarm theory. In Proceedings of the Sixth International Symposium on Micro Machine and Human Science, Nagoya, Japan, 4–6 October 1995; IEEE: Piscataway, NJ, USA, 1995; pp. 39–43. [Google Scholar]
- Asheralieva, A.; Miyanaga, Y. QoS-oriented mode, spectrum, and power allocation for D2D communication underlaying LTE-A network. IEEE Trans. Veh. Technol. 2016, 65, 9787–9800. [Google Scholar] [CrossRef] [Green Version]
- Ivanov, A.; Tonchev, K.; Poulkov, V.; Manolova, A. Probabilistic Spectrum Sensing Based on Feature Detection for 6G Cognitive Radio: A Survey. IEEE Access 2021, 9, 116994–117026. [Google Scholar] [CrossRef]
- Tushir, B.; Dhurandher, S.K.; Woungang, I.; Obaidat, M.S.; Teotia, V. Graph colouring technique for efficient channel allocation in cognitive radio networks. In Proceedings of the 2016 IEEE International Conference on Communications (ICC), Kuala Lumpur, Malaysia, 22–27 May 2016; IEEE: Piscataway, NJ, USA, 2016; pp. 1–5. [Google Scholar]
- Lu, L.; He, D.; Li, G.Y.; Yu, X. Graph-based robust resource allocation for cognitive radio networks. IEEE Trans. Signal Process. 2015, 63, 3825–3836. [Google Scholar] [CrossRef]
- Dai, J.; Wang, S. Clustering-based spectrum sharing strategy for cognitive radio networks. IEEE J. Sel. Areas Commun. 2016, 35, 228–237. [Google Scholar] [CrossRef]
- Driouch, E.; Ajib, W. Downlink scheduling and resource allocation for cognitive radio MIMO networks. IEEE Trans. Veh. Technol. 2013, 62, 3875–3885. [Google Scholar] [CrossRef]
- Cai, P.; Zhang, Y.; Pan, C. Coordination Graph-Based Deep Reinforcement Learning for Cooperative Spectrum Sensing Under Correlated Fading. IEEE Wirel. Commun. Lett. 2020, 9, 1778–1781. [Google Scholar] [CrossRef]
- Zhao, D.; Qin, H.; Song, B.; Han, B.; Du, X.; Guizani, M. A graph convolutional network-based deep reinforcement learning approach for resource allocation in a cognitive radio network. Sensors 2020, 20, 5216. [Google Scholar] [CrossRef]
- Hoang, A.T.; Liang, Y.C. Maximizing spectrum utilization of cognitive radio networks using channel allocation and power control. In Proceedings of the IEEE Vehicular Technology Conference, Melbourne, Australia, 7–10 May 2006; IEEE: Piscataway, NJ, USA, 2006; pp. 1–5. [Google Scholar]
- Hoang, A.T.; Liang, Y.C. Downlink channel assignment and power control for cognitive radio networks. IEEE Trans. Wirel. Commun. 2008, 7, 3106–3117. [Google Scholar] [CrossRef] [Green Version]
- Li, F.; Bai, B.; Zhang, J.; Letaief, K.B. Location-based joint relay selection and channel allocation for cognitive radio networks. In Proceedings of the 2011 IEEE Global Telecommunications Conference-GLOBECOM 2011, Houston, TX, USA, 5–9 December 2011; IEEE: Piscataway, NJ, USA, 2011; pp. 1–5. [Google Scholar]
- Wu, J.; Dai, Y.; Zhao, Y. Effective channel assignments in cognitive radio networks. Comput. Commun. 2013, 36, 411–420. [Google Scholar] [CrossRef]
- Tabakovic, Z.; Grgic, M. Cognitive radio frequency assignment with interference weighting and categorization. EURASIP J. Wirel. Commun. Netw. 2016, 2016, 45. [Google Scholar] [CrossRef] [Green Version]
- Han, R.; Gao, Y.; Wu, C.; Lu, D. An effective multi-objective optimization algorithm for spectrum allocations in the cognitive-radio-based Internet of Things. IEEE Access 2018, 6, 12858–12867. [Google Scholar] [CrossRef]
- Ren, J.; Zhang, H.; Du, Z.; Sun, Y.; Hu, H.; Zhu, X. Weighted-Directed-Hypergraph-Based Spectrum Access for Energy Harvesting Cognitive Radio Sensor Network. IEEE Access 2020, 8, 68570–68579. [Google Scholar] [CrossRef]
- Liu, Z.; Li, F.; Yu, D.; Karl, H.; Sheng, H. On-Line Learning-Based Allocationof Base Stations and Channels in Cognitive Radio Networks. In Proceedings of the International Conference on Wireless Algorithms, Systems, and Applications, Qingdao, China, 13–15 September 2020; Springer: Berlin/Heidelberg, Germany, 2020; pp. 346–358. [Google Scholar]
- Bradonjić, M.; Lazos, L. Graph-based criteria for spectrum-aware clustering in cognitive radio networks. Ad Hoc Netw. 2012, 10, 75–94. [Google Scholar] [CrossRef]
- De Alwis, C.; Kalla, A.; Pham, Q.V.; Kumar, P.; Dev, K.; Hwang, W.J.; Liyanage, M. Survey on 6G frontiers: Trends, applications, requirements, technologies and future research. IEEE Open J. Commun. Soc. 2021, 2, 836–886. [Google Scholar] [CrossRef]
- Alsabah, M.; Naser, M.A.; Mahmmod, B.M.; Abdulhussain, S.H.; Eissa, M.R.; Al-Baidhani, A.; Noordin, N.K.; Sait, S.M.; Al-Utaibi, K.A.; Hashim, F. 6G Wireless Communications Networks: A Comprehensive Survey. IEEE Access 2021, 9, 148191–148243. [Google Scholar] [CrossRef]
- Wang, P.; Zhang, J.; Zhang, X.; Yan, Z.; Evans, B.G.; Wang, W. Convergence of satellite and terrestrial networks: A comprehensive survey. IEEE Access 2019, 8, 5550–5588. [Google Scholar] [CrossRef]
- Azari, M.M.; Solanki, S.; Chatzinotas, S.; Kodheli, O.; Sallouha, H.; Colpaert, A.; Montoya, J.F.M.; Pollin, S.; Haqiqatnejad, A.; Mostaani, A.; et al. Evolution of Non-Terrestrial Networks From 5G to 6G: A Survey. arXiv 2021, arXiv:2107.06881. [Google Scholar]
- Wang, C.X.; Di Renzo, M.; Stanczak, S.; Wang, S.; Larsson, E.G. Artificial intelligence enabled wireless networking for 5G and beyond: Recent advances and future challenges. IEEE Wirel. Commun. 2020, 27, 16–23. [Google Scholar] [CrossRef] [Green Version]
- Lee, M.; Yu, G.; Dai, H. Decentralized inference with graph neural networks in wireless communication systems. arXiv 2021, arXiv:2104.09027. [Google Scholar] [CrossRef]
- Dao, N.N.; Pham, Q.V.; Tu, N.H.; Thanh, T.T.; Bao, V.N.Q.; Lakew, D.S.; Cho, S. Survey on aerial radio access networks: Toward a comprehensive 6G access infrastructure. IEEE Commun. Surv. Tutor. 2021, 23, 1193–1225. [Google Scholar] [CrossRef]
- Bajracharya, R.; Shrestha, R.; Kim, S.; Jung, H. 6G NR-U Based Wireless Infrastructure UAV: Standardization, Opportunities, Challenges and Future Scopes. IEEE Access 2022, 10, 30536–30555. [Google Scholar] [CrossRef]
- Liu, D.; Zhang, J.; Cui, J.; Ng, S.X.; Maunder, R.G.; Hanzo, L. Deep Learning Aided Routing for Space-Air-Ground Integrated Networks Relying on Real Satellite, Flight, and Shipping Data. IEEE Wirel. Commun. 2022, 29, 177–184. [Google Scholar] [CrossRef]
- Zhong, X.; Huo, Y.; Dong, X.; Liang, Z. Deep Q-network based dynamic movement strategy in a UAV-Assisted network. In Proceedings of the 2020 IEEE 92nd Vehicular Technology Conference (VTC2020-Fall), Victoria, BC, Canada, 18 November–16 December 2020; IEEE: Piscataway, NJ, USA, 2020; pp. 1–6. [Google Scholar]
- Hlophe, M.C.; Maharaj, B.T. AI meets CRNs: A prospective review on the application of deep architectures in spectrum management. IEEE Access 2021, 9, 113954–113996. [Google Scholar] [CrossRef]
- Niu, Z.; Shen, X.S.; Zhang, Q.; Tang, Y. Space-air-ground integrated vehicular network for connected and automated vehicles: Challenges and solutions. Intell. Converg. Netw. 2020, 1, 142–169. [Google Scholar] [CrossRef]
- Seba, H.; Lagraa, S.; Ronando, E. Comparison issues in large graphs: State of the art and future directions. arXiv 2015, arXiv:1502.07576. [Google Scholar]
- Mostafa, H. Sequential Aggregation and Rematerialization: Distributed Full-batch Training of Graph Neural Networks on Large Graphs. arXiv 2021, arXiv:2111.06483. [Google Scholar]
- Liu, Y.; Liu, Y.; Yang, C. Modulation recognition with graph convolutional network. IEEE Wirel. Commun. Lett. 2020, 9, 624–627. [Google Scholar] [CrossRef]
- Fallah, M.; Pourahmadi, V. Graph-based iterative measurement-denoising and radio-map generation for semi-supervised indoor localisation. IET Commun. 2018, 12, 848–853. [Google Scholar] [CrossRef]
- Liu, Y.; Yuan, X.; Xiong, Z.; Kang, J.; Wang, X.; Niyato, D. Federated learning for 6G communications: Challenges, methods, and future directions. China Commun. 2020, 17, 105–118. [Google Scholar] [CrossRef]
- Letaief, K.B.; Shi, Y.; Lu, J.; Lu, J. Edge Artificial Intelligence for 6G: Vision, Enabling Technologies, and Applications. arXiv 2021, arXiv:2111.12444. [Google Scholar] [CrossRef]
- Petkova, R.; Ivanov, A.; Poulkov, V. Challenges in implementing Ultra-Dense scenarios in 5G networks. In Proceedings of the 2020 Joint International Conference on Digital Arts, Media and Technology with ECTI Northern Section Conference on Electrical, Electronics, Computer and Telecommunications Engineering (ECTI DAMT & NCON), Pattaya, Thailand, 11–14 March 2020; IEEE: Piscataway, NJ, USA, 2020; pp. 168–172. [Google Scholar]
- Patil, K.; Prasad, R.; Skouby, K. A survey of worldwide spectrum occupancy measurement campaigns for cognitive radio. In Proceedings of the 2011 International conference on devices and communications (ICDeCom), Mesra, India, 24–25 February 2011; IEEE: Piscataway, NJ, USA, 2011; pp. 1–5. [Google Scholar]
- Dzulkifli, M.R.; Kamarudin, M.R.; Rahman, T.A. Spectrum occupancy at UHF TV band for cognitive radio applications. In Proceedings of the 2011 IEEE International RF & Microwave Conference, Seremban, Malaysia, 12–14 December 2011; IEEE: Piscataway, NJ, USA, 2011; pp. 111–114. [Google Scholar]
- Voicu, A.M.; Simić, L.; Petrova, M. Survey of spectrum sharing for inter-technology coexistence. IEEE Commun. Surv. Tutor. 2018, 21, 1112–1144. [Google Scholar] [CrossRef] [Green Version]
- Han, S.; Xie, T.; Chih-Lin, I. Greener Physical Layer Technologies for 6G Mobile Communications. IEEE Commun. Mag. 2021, 59, 68–74. [Google Scholar] [CrossRef]
- Popovski, P.; Chiariotti, F.; Huang, K.; Kalør, A.E.; Kountouris, M.; Pappas, N.; Soret, B. A Perspective on Time towards Wireless 6G. arXiv 2021, arXiv:2106.04314. [Google Scholar] [CrossRef]
- Wang, M.; Zhu, T.; Zhang, T.; Zhang, J.; Yu, S.; Zhou, W. Security and privacy in 6G networks: New areas and new challenges. Digit. Commun. Netw. 2020, 6, 281–291. [Google Scholar] [CrossRef]


| Acronym | Definition |
|---|---|
| 5G | Fifth-generation wireless communications |
| 6G | Sixth-generation wireless communications |
| ABRB | Almost blank resource block |
| AoI | Age of information |
| AP | Access point |
| BP | Belief propagation |
| BS | Base station |
| CAP | Cognitive AP |
| CP | Centralization point |
| CR | Cognitive radio |
| CSI | Channel state information |
| CSS | Cooperative spectrum sensing |
| CUE | Cellular user equipment |
| D2D | Device to device |
| DCA | Difference of two convex functions approximation |
| DL | Downlink |
| DRL | Deep reinforcement learning |
| DSA | Dynamic spectrum access |
| DUE | D2D pair |
| EE | Energy efficiency |
| FD | Full-duplex |
| GDFT | Graph Discrete Fourier transform |
| GNN | Graph neural network |
| GRIST | Graph-based Resource management for Integrated Space and Terrestrial communications |
| GSP | Graph signal processing |
| Het-Net | Heterogeneous network |
| ICI | Inter-cell interference |
| IoT | Internet of Things |
| ISTN | Integrated space and terrestrial network |
| KKT | Karun–Kush–Tucker |
| LTE | Long-Term evolution |
| MC | Multiple connectivity |
| MCNF | Minimum cost network flow |
| MIMO | Multiple-input–multiple-output |
| ML | Machine learning |
| mmWave | Millimeter wave |
| NOMA | Non-orthogonal multiple access |
| NTN | Non-terrestrial network |
| OFDMA | Orthogonal frequency division multiple access |
| OSI | Open systems interconnection |
| PF | Proportional fair |
| Acronym | Definition |
|---|---|
| PCE | Power consumption and externality |
| PU | Primary user |
| QoS | Quality of service |
| RA | Resource allocation |
| RAT | Radio access technology |
| RB | Resource block |
| SGD | Stochastic gradient descent |
| SINR | Signal-to-noise-plus-interference ratio |
| SSh | Spectrum sharing |
| SU | Secondary user |
| TN | Terrestrial network |
| TSR | Throughput satisfaction rate |
| UA | User association |
| UAV | Unmanned aerial vehicle |
| UC | User centric |
| UDN | Ultra-dense network |
| UE | User equipment |
| UL | Uplink |
| V2I | Vehicle-to-infrastructure |
| V2V | Vehicle-to-vehicle |
| WLAN | Wireless local area network |
| WSR | Weighted sum-rate |
| Notation | Definition |
|---|---|
| Averaged risk-averse rate | |
| Adjacency matrix | |
| Ratio of guaranteed users | |
| Set of edges | |
| Incidence matrix | |
| Fairness index | |
| C | Number of output channels |
| Target SINR of the CUEs | |
| Target SINR of the DUEs | |
| Minimum DL SINR for the SUs | |
| Energy efficiency | |
| Graph | |
| h | Scaling coefficient (weight) |
| Maximum DL interference towards the PUs | |
| Throughput satisfaction rate | |
| Degree of connectivity | |
| Laplacian matrix | |
| Number of users per RB | |
| Laplacian eigenvalues matrix | |
| Deployment density of AUEs | |
| Deployment density of MUEs | |
| Deployment density of RRHs | |
| Deployment density of UEs | |
| M | Number of edges |
| N | Number of vertices |
| Number of UEs | |
| Number of BSs | |
| Number of DUEs | |
| Number of CUEs | |
| Number of SUs that obtain service |
| Notation | Definition |
|---|---|
| Number of PUs | |
| Number of CAPs | |
| Number of channels | |
| Number of APs | |
| Number of RRHs | |
| Number of AUEs | |
| Number of RBs | |
| Outage probability | |
| Probability of false alarm | |
| Probability of misdetections | |
| Total network transmit power | |
| Total CR network transmit power | |
| r | Distance |
| Total CR network throughput | |
| Average throughput per user | |
| Average throughput per cell | |
| Average throughput per SU | |
| Average throughput per AUE | |
| Average throughput per MUE | |
| Average throughput per AP | |
| Total network throughput | |
| Average network throughput | |
| Maximum number of RBs per D2D link | |
| Set of vertices | |
| Weight matrix | |
| Utility function | |
| Social utility function |
| Reference | Application | Graph Model Type | Tasks Solved via Graphs | Graph Formulation | Optimization Method | Performance Assessment |
|---|---|---|---|---|---|---|
| [19] | Channel and power allocation in OFDMA | MCNF | Channel and power allocation | All channels connected to each user | Simplex network | of 500 kb/s, and of 50 Mb/s at () MIMO and 120 UEs of 1 cell |
| [20] | Channel allocation and sharing of TVWS with LTE networks | Interference graph | Channel allocation | Vertices—BSs; edges—interfering BSs | Heuristic algorithm | of up to 1.2 b/s/Hz for 3 BSs |
| [21] | RA for OFDMA small cell network | Conflict/cordial graph | RB allocation | Vertices—UEs; edges—interfering UEs | Heuristic algorithm | Convergence for , , and for 150 small cells and 60 RBs |
| [22] | Channel and power allocation in OFDMA HetNet | Interference graph | Channel and power allocation | Vertices—UEs; edges—interfering UEs | Heuristic method | of 6 b/s/Hz, and of 2.5 b/s/Hz/W for 4 UEs per AP |
| [23] | Channel and power allocation in OFDMA HetNet | Interference graph | Channel and power allocation | Vertices—UEs; edges—interfering UEs | Heuristic method | of 2.5 b/s/Hz, of 3.5 b/s/Hz/W, and of 350 Mb/s for 4 UEs per AP |
| [24] | Channel allocation in a femto-cell network | Conflict graph | Channel allocation | Vertices—BSs; edges—conflicting BSs | Heuristic method | of 600 b/s/Hz for 100 BSs and 2 channels per BS |
| [25] | RB allocation in an OFDMA Het-Net | Interference/ bipartite graph | Channel allocation | Vertices—UEs/user clusters; edges—between all UEs/RBs | Hungarian algorithm | of 12 b/s/Hz, and of 0.1 b/s/Hz for up to 10 small cells, 100 UEs and 64 channels |
| [26] | RA for NOMA network | Directed graph | Power allocation | Vertices—UEs; edges—all UEs | Fast greedy algorithm | of up to 65 dBm for 300 users and 50 groups |
| [27] | RA for NOMA network | Bipartite graph | RB and power allocation | Vertices—UEs, RBs; edges—allocations | Heuristic algorithm, analytical solution | up to 46 kb/s/J for 24 users and 8 RBs |
| [28] | Channel and power allocation in a Het-Net | Factor graph | Power and channel allocation | Vertices—BSs and UEs; edges—between BSs and UEs with adequate SINR | BP | of up to 11 Mb/s, and of up to 6 Mb/s for 20 UEs and up to 6 small cells and 1 macro-cell |
| [29] | Channel and power allocation in a mmWave Het-Net | Coordination graph | Power and channel allocation | Vertices—BSs and UEs/between BSs; edges—between BSs and UEs with adequate SINR/between interfering BSs | BP/RL | of up to 11 Mb/s, and of up to 1.5 b/s/Hz for 8 small cells and 1 macro-cell |
| [30] | Channel allocation in a wireless network | Directed graph | Channel allocation | Vertices—BS and UEs; edges—between BSs and UEs within a certain range | Adam optimizer | of up to 8 b/s/Hz for 50 UEs |
| [31] | Power allocation in a Het-Net | Conflict graph | Power allocation | Vertices—BSs and UEs; edges—between BSs and UEs, and interfering BSs | RMSProp | Over 90% spectrum utilization for 8 BSs and 16 UEs |
| [32] | Power allocation in an ad-hoc network | Directed graph | Power allocation | Vertices—links between nodes; edges—between interfering links | SGD | of up to 90 b/s/Hz for 30 nodes |
| [33] | Power allocation in an ad-hoc network | Interference graph | Power allocation | Vertices—transmitters and receivers; edges—between associated and interfering links | Asynchronous SGD | of up to 6.5 b/s/Hz for up to 300 pairs |
| [34] | Channel allocation in a WLAN | Conflict graph | Channel allocation | Vertices—APs; edges—between APs within a certain range | RL/greedy algorithm | Over 90% spectrum utilization for 10 APs and 3 channels |
| [35] | RA and EE in HetNet | Interference graph | Channel and power allocation | Vertices—UEs; edges—interfering UEs | Gibbs sampler | of 1.8 b/s/Hz, and of 3 b/s/Hz/W for 96 UEs, with a dedicated channel for each |
| [36] | Channel and power allocation in a Het-Net | Interference graph | Power and channel allocation | Vertices—BSs; edges—interfering BSs | KKT | of up to 100 Mb/s (UL) and 80 Mb/s (DL), and of up to 550 kb/s (UL) and 250 kb/s (DL) for 100 UEs and up to 4 small cells and 1 macro-cell |
| [37] | Channel and power allocation in an OFDMA Het-Net | Bipartite graph | Channel allocation | Vertices—BSs and UEs; edges—between BSs and UEs with adequate SINR | Hungarian algorithm, DCA | of up to 55 b/s/Hz for up to 350 UEs and 6 small cells and 1 macro-cell |
| [38] | RA for OFDMA Het-Net | Conflict/ cordial/tree graph | RB allocation | Vertices—cells/UEs; edges—interfering cells/UEs | Heuristic algorithm | Convergence for , , and for 50 small cells and 50 RBs |
| [39] | Predictive RA for Het-Net | Conflict graph | Channel allocation | Vertices—BSs and UEs; edges—interfering cells and served UEs | Heuristic algorithm | of up to 80% and of 16 b/s/Hz for 30 UEs |
| [40] | EE, channel and power allocation | Bipartite graph | Channel allocation | Vertices—UEs; edges—channels | Dual Lagrangian algorithm | of 12 b/s/Hz/J for up to 5 UEs and 5 BSs |
| Reference | Application/Assumptions | Graph Model Type | Tasks Solved via Graphs | Graph Formulation | Optimization Method | Performance Assessment |
|---|---|---|---|---|---|---|
| [75] | RA in an underlay CR network/CAP-BS coordination (realistic) | Undirected/ conflict graph | Channel allocation | Vertices—SUs/sets of links; edges—between SUs/between links; weights—SINR | Heuristic algorithm | up to 5 kb/s for , and |
| [76] | RA in an underlay CR network/Channel selection functionality (realistic) | Bipartite graph | Channel allocation | Vertices—SUs and channels; edges—between SUs and channels; weights—utility function | Heuristic algorithm | Channel allocation error close to 0% for |
| [77] | RA in an underlay CR network/ Clustering-based organization (realistic) | Interference graph | Clustering of SUs | Vertices—SUs; edges—between SUs; weights—channel gain | Heuristic algorithm | up to 3.5 Mb/s for , and |
| [78] | RA in an interweave CR network/Perfect CSI knowledge (unrealistic) | Undirected graph | Channel allocation | Vertices—SUs; edges—between SUs with sufficient orthogonality | Greedy algorithm | up to 22 b/s/Hz for , and |
| [79] | CSS for CR network/Low (realistic) | Coordinated graph | CSS | Vertices—SUs; message passing between SUs | SGD | and for a CSS among 4 SUs |
| [80] | RA in an underlay CR network/CAP handover not available (unrealistic) | Interference graph | Power and channel allocation | Vertices—associated links of the UEs and BSs; edges—between interfering links | SGD | of up to 5 for , and |
| [81] | RA in a CR network/Stationary CAPs (realistic) | Interference graph | Channel allocation | Vertices—CAPs and SUs; edges—between interfering CAPs and SUs | Greedy algorithm | for , and |
| [82] | RA in a CR network/Local CSI knowledge (realistic) | Bipartite graph | Channel allocation | Vertices—SUs and channels; edges—between SUs and channels | Heuristic algorithm | for , and |
| [83] | RA in a relay CR network/User location knowledge (unrealistic) | Bipartite graph | Channel allocation and relay selection | Vertices—CR pairs and channels; edges—between CR pairs and channels; weights—transmission power | Heuristic algorithm | is up to 20% higher than |
| [84] | RA in a CR network/control channel availability (realistic) | Undirected/ star graph | Channel allocation | Vertices—SUs/channels and links; edges—between SUs/between links and channels; weights—conflict probability | Hungarian algorithm | Up to 70% of links are assigned for , and |
| [85] | RA in an interweave CR network/PU protection (realistic) | Conflict graph | Channel allocation | Vertices—SUs pairs; edges—between SUs pairs; weights—interference | Heuristic algorithm | up to 4.5 b/s/Hz, and up to 1 for and |
| [86] | RA in a CR IoT network/Channels of equal bandwidth (unrealistic) | Directed graph | Channel allocation | Vertices—SUs; edges—between SUs; weights—SINR | Genetic algorithm | up to 20 b/s/Hz for |
| [87] | RA in an underlay CR network/Perfect CSI knowledge (unrealistic) | Interference hypergraph | Channel allocation | Vertices—SUs; edges—between SUs; weights—received power | Potential game | for |
| [88] | RA in a CR network/PU and SU synchronization (unrealistic) | Conflict graph | Channel allocation | Vertices—SUs; edges—between SUs; weights—mean throughput | Greedy algorithm | Up to 46 dB performance loss for , and |
| General/Complete Graph | Bipartite Graph | Star Graph | Path Graph | GSP/GNN | References | |
|---|---|---|---|---|---|---|
| RA methods in OFDM Systems | ✗ | ✗ | [19,20,21] | |||
| RA Methods with user and cell clustering | ✗ | ✗ | ✗ | [22,23,24,25,26,27] | ||
| RA methods With belief propagation | ✗ | ✗ | [28,29] | |||
| RA Methods based on GSP | ✗ | ✗ | ✗ | [30,31,32,33,34,43,79,80] | ||
| Joint power and channel allocation methods | ✗ | ✗ | [51,52,53] | |||
| Hypergraph-based RA methods | ✗ | ✗ | [54,55,56,57] | |||
| Graph-coloring-based RA methods | ✗ | [58,59,60,61] | ||||
| RA methods in NOMA systems | ✗ | [62,63,64] | ||||
| RA methods in underlay CR networks | ✗ | ✗ | [75,76,77] | |||
| RA Methods in interweave CR networks | ✗ | ✗ | [78,79,80,89] | |||
| Miscellaneous methods | ✗ | ✗ | ✗ | ✗ | [35,36,37,38,39,65,66,67,68,69,70,81,82,83,84,85,86,87,88] | |
| Graph models appropriate for GRIST | ✗ | ✗ | ✗ | ✗ | [19,20,21,22,24,25,26,27,28,29,30,31,32,33,34,35,36,37,38,39,43,51,52,53,54,55,56,57,58,59,60,61,62,63,64,66,67,68,69,70,75,76,77,78,79,80,81,82,83,84,85,86,87,88,89,87,88] |
Publisher’s Note: MDPI stays neutral with regard to jurisdictional claims in published maps and institutional affiliations. |
© 2022 by the authors. Licensee MDPI, Basel, Switzerland. This article is an open access article distributed under the terms and conditions of the Creative Commons Attribution (CC BY) license (https://creativecommons.org/licenses/by/4.0/).
Share and Cite
Ivanov, A.; Tonchev, K.; Poulkov, V.; Manolova, A.; Neshov, N.N. Graph-Based Resource Allocation for Integrated Space and Terrestrial Communications. Sensors 2022, 22, 5778. https://doi.org/10.3390/s22155778
Ivanov A, Tonchev K, Poulkov V, Manolova A, Neshov NN. Graph-Based Resource Allocation for Integrated Space and Terrestrial Communications. Sensors. 2022; 22(15):5778. https://doi.org/10.3390/s22155778
Chicago/Turabian StyleIvanov, Antoni, Krasimir Tonchev, Vladimir Poulkov, Agata Manolova, and Nikolay N. Neshov. 2022. "Graph-Based Resource Allocation for Integrated Space and Terrestrial Communications" Sensors 22, no. 15: 5778. https://doi.org/10.3390/s22155778
APA StyleIvanov, A., Tonchev, K., Poulkov, V., Manolova, A., & Neshov, N. N. (2022). Graph-Based Resource Allocation for Integrated Space and Terrestrial Communications. Sensors, 22(15), 5778. https://doi.org/10.3390/s22155778