1. Introduction
Compared to high-tech industries with much professional equipment, traditional manufacturing factories rely on a large amount of manual labor, which is scattered throughout the production line to maintain the requirements of mass production. In production lines, the inspection stage is a relatively non-technical but unavoidable part of the process. In the current method, the operator usually observes the condition of the finished product through optical instruments or directly through the eyes. However, the human body accumulates fatigue due to long hours of work or various reasons that lead to a decrease in concentration, so relying on the human eye alone to judge is not rigorous enough.
For this reason, many manufacturers have partnered with technology companies to develop and produce a variety of automated equipment to replace labor-intensive manual operations, among which Automated Optical Inspection (AOI) is a high-speed, high-accuracy optical image inspection system. In factories equipped with vision sensor equipment, AOI is used to detect, judge, and filter out products with defects, and is widely used in various automated production as an improvement to the traditional human inspection using optical instruments. Especially at this time when most of the factories have moved into Industry 4.0, AOI is an indispensable part of it. A machine with AOI can operate automatically to save manpower on some decisions. The benefits of AOI are reliability and consistency. It shows great ability to integrate with the industrial Internet of Things (IoT) applications. With this system integration on AOI and IoT, many techniques are investigated to support this trend and finally to apply in products. However, different products have different inspection methods on AOI, so it is necessary to use the proper techniques to design the dedicated product.
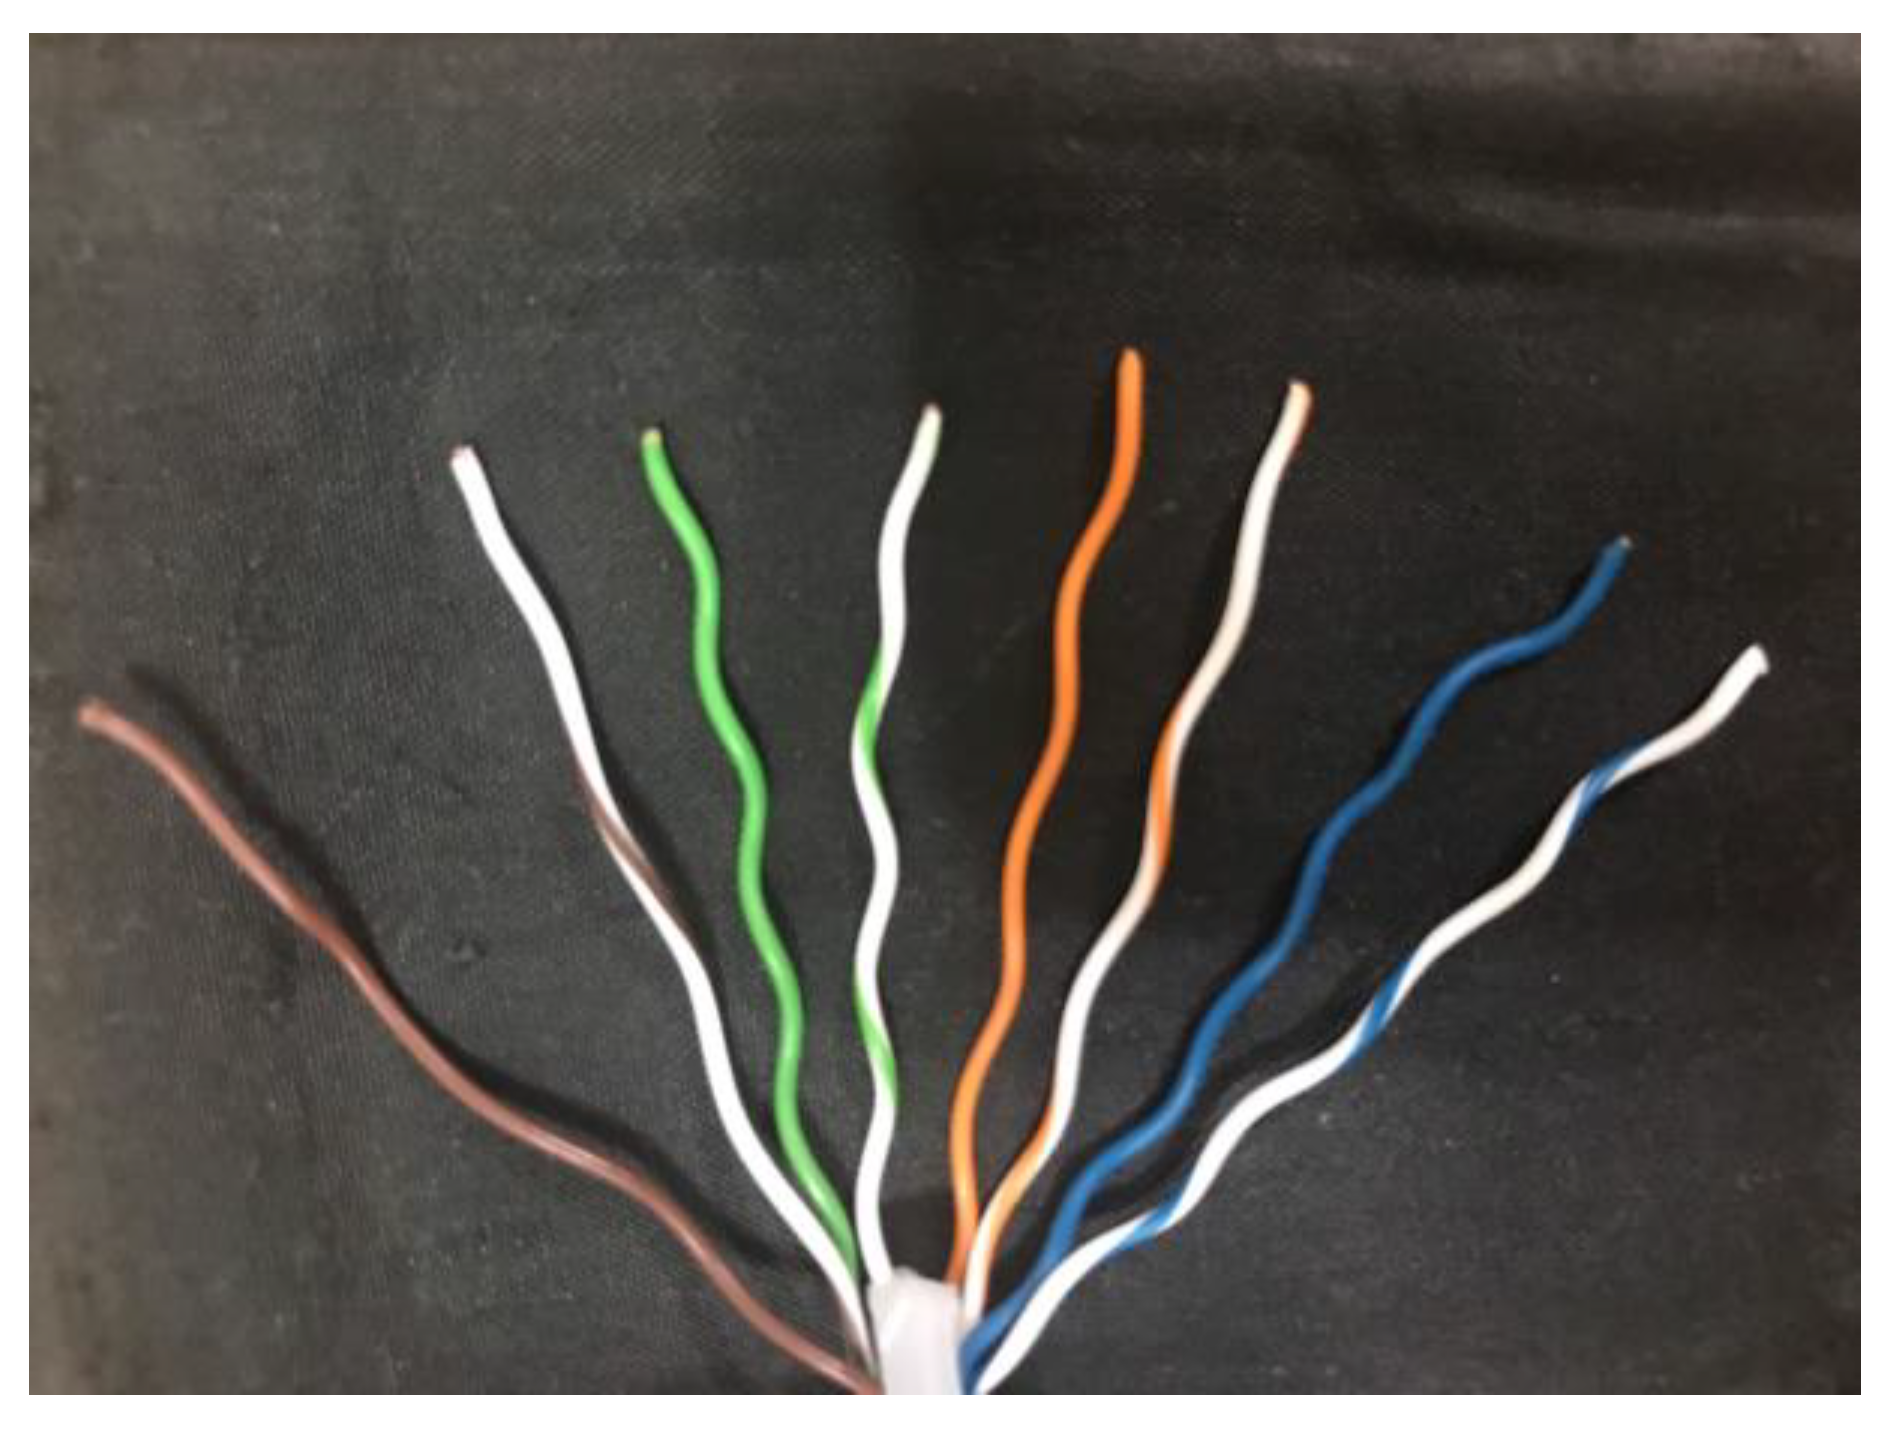
In today’s society, there is a huge request for wire, such as cell phones, computers, and other consumer electronic products. While manufacturing in large quantities, the quality control of wire is very important. To ensure the quality of the finished product, many manufacturers require their employees to check the condition of the wire between processes, such as whether the wire has defects or is correctly aligned. Wiring is one of the more important steps in the manufacture of wire. At this stage, the wire is placed in the slot of the jig in the given color sequence. However, different types of wire have different color compositions. For example,
Figure 1 shows the front end of RJ45 Ethernet connector. Since the next stage requires the placement of the arranged wires in a special mold for fixing, this step is irreversible. Once the formed product has any defects or wrong color arrangement, the whole product should be eliminated.
To check whether the color sequence of the wire is correct, the traditional method is to manually use a high-resolution digital microscope to zoom in directly, so self-inspection through the human eye alone still results in the waste of many wires. Among the existing methods, deep learning-based methods [
1,
2,
3] are more mainstream to solve such automated optical inspection problems. This method trains the designed neural network model by giving a large amount of data, and the parameters are continuously updated to achieve higher accuracy. However, the large datasets required by deep learning-based methods are not easily available, and the complexity of training increases the cost of hardware and inspection time. For automatic optical inspection, real-time is extremely important. If the developed inspection system is slower than the original manual process, it can seriously slow down the production line of the factory. Compared to training neural network models, traditional feature extraction methods [
4,
5,
6] have relatively low hardware requirements and fast computational speed but are less robust to the environment.
Since most wire factories place wires according to a uniform standard to identify the color sequence of the wires, the environmental impact is not significant. For the above reason, a system for detecting the color sequence of wires in a factory does not necessarily require a large neural network. In this paper, a system for identifying the color sequence of wires based on the traditional feature extraction method is proposed. Since the object to be detected is a wire in a clean background, edge detection is used to obtain edge characteristics. In addition, labels and specially designed methods are used to eliminate skin reflections and wrinkles that often occur when capturing wire. Finally, by using the designed identification method, the common types of wires are identified and then the color sequence from left to right is recognized. To match the requirements of most manufacturers, the proposed approach has the following contributions:
Identifying three common types of wire with specially designed color identification methods.
Using feature acquisition method to improve overall accuracy and maintain real-time processing.
Using a specially designed noise reduction method to eliminate light reflections and surface folds that are more difficult to remove.
2. Related Works
As human resources gradually failed to satisfy the quality requirements of companies, automatic optical inspection technology to replace human eyes and hands came into being. The core principle of automatic optical inspection technology depends on the use of optical instruments as inspection tools, and the difficulty is how to process the high-value optical images through the designed algorithms. In addition, there is a corresponding solution for different detection objects. In the following, existing technologies related to automatic optical inspection are discussed first, and the main architectures are divided into methods using convolutional neural networks (CNNs) and methods based on traditional feature extraction. After that, some common types of wire used today are explained.
2.1. Methods of Convolutional Neural Networks
Deep learning-based methods are relatively new and accurate techniques, among which transfer learning [
7,
8,
9] has better adaptability to automatic optical techniques. For common machine learning techniques, the learning system can only process samples located in the same domain. In contrast, transfer learning is not limited to samples in the same domain but can be applied to slightly related categories. Even completely unrelated samples are possible, but additional learning methods need to be designed to deal with the data mismatch problem.
For the above reasons, the challenge of applying general deep neural networks to the field of automatic optical inspection is the lack of enough datasets for network training. Each company has a different deployment to use this inspection technology inside the production line; this also differs from the datasets for different components. To detect each product well, it needs to take a large number of datasets and even label each data point, which is a very time-consuming and costly process. In contrast, the learning method used for transfer learning does not require a large dataset of objects to be examined, but only the design of a learning model that fits the current application situation. Finally, the network is trained with the rest of the different but related data, thus eliminating the need to produce large datasets.
In the method based on transfer learning, both [
10,
11] use a deep neural network based on VGG-16 to train the model for detecting optical images. VGG-16 is a network model that uses a large amount of data to train and has many layers inside. This method trains the parameters and weights inside the source domain network with the 1000 classes provided by ImageNet, and transfers all of the weights from the trained model to the convolutional layers of the target domain network through a designed transfer method. Then, the target domain convolutional neural network is fine-tuned by the dataset to be used for detection, e.g., [
10] trains the network with six different types of texture patterns, and the trained network model detects which of the input texture patterns has defects. In [
11], the network is trained by inputting different types of battery weld images and detecting which of the input images has a defective battery weld.
In addition, there are still some automatic optical inspection methods that use a non-transfer learning architecture [
12,
13,
14]. In [
15], a deep convolutional neural network is trained to detect scratches on the optical fiber connector end-face. The model consists of three main blocks, namely the feature extraction network for feature extraction, the BFE module with the CCMP block, and the SAU module. First, the image and ground truth are input into the network model, and the features are extracted by convolution. The boundary characteristics of the defect are then refined by a specially designed BFE module. Finally, the SAU module is used to locate and cut out the defect and output the defect location in the image.
2.2. Methods of Rule-Based Feature Extraction
In the existing methods, rule-based methods on feature extraction are widely used such as [
16,
17,
18]. Although they are not more accurate than deep neural networks trained with large datasets, this technique is still needed due to its low complexity, low hardware requirements, and fast execution speed. Compared to deep neural networks, which train and update weights to obtain various features from a large number of datasets, traditional rule-based feature extraction methods take different approaches to capture features depending on the object.
For some mainstream detection and tracking fields, the optical flow method, frame difference method, and background subtraction method are adopted. The optical flow method determines the object’s position by calculating the object’s motion trajectory, while the frame difference method calculates the change of pixels in the front and back frames to find the object in motion. For the background subtraction method, Barnich proposed an innovation classification model technology, named ViBe [
19]. This method uses several frames of images as background to adapt to complex dynamic environments. Although some AOI methods use this technique to detect objects in motion or changes in the surface of an object [
20], it is still not useful for this paper being used to detect static objects.
In [
21], the wire harnesses in the image were detected by using traditional feature extraction. First, they carried out a series of pre-processing on the incoming image such as noise reduction, contrast enhancement, etc. After that, the wire harness was divided into four interesting blocks by individual design, which were the whole line body, the color part of the line head, the QR code, and the black square component in the middle. Since the objects to be detected in this paper were all the same type of wire harness, including the color and placement of the wire, it was possible to detect the area of interest by specially designed color masking. Finally, the wire length, color composition, etc. were calculated from the blocks obtained previously, and the results were displayed on the screen.
In [
22], an AOI system based on simple feature processing was used to inspect railway sleepers and surface defects. As the number of defective railway sleepers was very small compared to the number of non-defective railway sleepers, it was more difficult to adopt a machine learning approach. Firstly, this paper calculated the derivatives quickly through Haar transform and integral images and found the position of the rail in the image through a single Haar structure. Similarly, the fasteners were located by rotating the Haar structure. To accurately identify sleepers, the low entropy area of the image was searched first, and then the correct sleeper location was filtered out by Sobel vertical edge features. Once the correct position information was obtained, a specially designed method could be used to detect if a railway sleeper had a defect.
2.3. Common Wire Types
In this paper, the object to be inspected is a wire. However, there is a huge variety of cables, such as the ones used as USB, network cables, telephone cables, HDMI, etc. Each different cable has a different internal composition. Among all types of cables, most of them are multi-core wires made from multiple single-core wires, so most wire manufacturers need to check the correct color alignment of multiple single-core wires inside the cable during the fixing stage to ensure the normal function of the cable.
The most common type of wire inspection is a single-core wire with only one color. Another common cable is used in the RJ45 Ethernet connector, and it is also a single-core wire but consists of one or two colors in its wrap. In addition to the above two types of single-core wires, USB Type-C has become increasingly popular in recent years, and this cable is composed of multiple single-core and multi-core wires. For this multicore wire inspection method, the color of the aluminum foil wrapped around the wire and the color of the wrapped wire should be considered at the same time. For the convenience of reading, the single-core wire with only one color, the single-core wire with two colors, and two wires covered with aluminum foil are abbreviated as single-color wire, two-color wire, and multicore wire, respectively.
4. Experimental Results
4.1. System Specification and Image Resolution
The recognition environment is simulated and evaluated by using C++ on a computer with a 4 GHz Core i7 CPU, and the selected inspection tool is the AD409 digital microscope produced by Andonstar. The resolution of the output image is 4032 × 3024, and the magnification can reach 240 times under the 27-inch screen when the distance is 5 cm. The test wire is the ordinary single-color wire, two-color wire used in RJ45 Ethernet connector, and multicore wire used in USB Type-C, respectively, as shown in
Figure 10. Their diameters are 0.511 mm, 0.511 mm, and 0.812 mm, respectively. These three types of wire are chosen because there are many different types of wire in the factory. In the following evaluation, we will discuss some factors which influence the detection result of the system.
Firstly, to verify the effectiveness and timeliness of the system,
Table 1 shows the effect of different image resolutions on the accuracy and execution time of the system. In this experiment, the image resolution is standardized to 4:3 and scaled in proportion, and the maximum resolution is limited by the use of a digital microscope of 4032 × 3021. The average accuracy in the table is determined by directly comparing the color sequence of the input image and the output result. If the comparison is completely correct, the output is judged to be correct; otherwise, the output is wrong. In addition, for consistency, a single-color wire is used for comparison. The background is unified in white, and the wire is exposed from the bottom by 5 mm. The entire dataset contains 200 images of the scenarios described above, and each image contains three to six wires.
When the image resolution is higher, the average accuracy increases as the overall feature information increases. However, once resolving 2048 × 1536 or even 4032 × 3024, the average accuracy decreases rather than increases. This is because when images are taken at high resolution, things such as noise or folds and reflections on the surface of the wire are also overly magnified. Due to these unexpected features, the average execution time also increases significantly when the resolution reaches 2048 × 1536 and it becomes more difficult to keep the system running in real-time. After this experiment, it is believed that the resolution of 1600 × 1200 or 1280 × 960 has better accuracy and the execution speed can be run immediately, so the following experiments are run with the resolution of 1280 × 960.
4.2. System Profiling and Result
Figure 11 shows the time required for each stage of the system. It can be found that the longest time is required for de-noise. The percentage of time spent in this stage grows as the resolution increases, which means that the high resolution also generates a lot of noise.
Figure 12 shows the results of feature extraction and color sequence of the system for different wires. For the convenience of the display, different colored edge features represent different gradient directions, and the output has colored blocks from left to right to represent the color of the wires in the input image from left to right, respectively. The multicore wire is divided into upper and lower parts, while the two-color wire splits the original block into two pieces.
To simulate the operation of the production line in the real factory and further verify the integrality of the system, the test results are done by combining different wire materials and different color backgrounds with each other as shown in
Table 2. In this experiment, 50 images are taken from each group of test situations and run at 1280 × 960 resolution. For different wire types, it is clear that the accuracy is highest in the case of single-color wire followed by multicore wire, while the accuracy of two-color wire is much lower than in the other two cases. This result is also easily understood even if the detection task is made by humans. The technical reason is that the wire is twisted to make two colors appeared in one plane, and the maximum area that the digital microscope can contain may not be able to appear in two colors at the same time. When taking pictures of the dataset, due to the angle of placement, it is easy to have only one color appearing on the surface of the wire, resulting in a loss of accuracy.
For different background colors, white backgrounds generally show relatively good results. Only in the case of two-color wire, the accuracy of the black background is higher than that of the white background. This is because the two-color wire is a white part with another color, which causes the white part to be ignored due to low contrast after capturing the features on the white background. In addition, the white and black backgrounds are the very large and very small values of the grayscale values, which are more convenient for the system to recognize edge features, and the yellow background is in between. This may lead to misjudgment of the edge feature when identifying the multicore wire that has different colors on top and bottom.
4.3. Evaluation for Different Wire Lengths
To further test various situations in the factory, the length of the wire exposed in the image is additionally adjusted and the results of the experiment are recorded in
Table 3. For multicore wire, since both upper and lower parts of this wire need to be inspected, the upper and lower sections are cut at the same time for inspection. Due to the above reasons, it is difficult to divide this wire into five situations like single-color wire, so only 5 mm and 2.5 mm are used for the test. In the case of two-color wire, it is more difficult to display both colors under a high magnification digital microscope, so there is no way to shorten the wire. Based on the mention above, only single-color wire and multicore wire are tested in this experiment.
In this experiment, 100 images are prepared for different exposure lengths and run with a resolution of 1280 × 960 with a white background. The length of the wire should affect the execution time since the length of the wire is proportional to the detection region. When the exposed length of the wire is more than 3 mm, the average accuracy remains at a good level. When the length exceeds 5 mm, the effect of improvement becomes limited. However, once the exposed length is only 2 mm, 1 mm, or even 2.5 mm, the accuracy rate drops significantly. This is because the shortening of the wires in the image will cause the overall edge features smaller. This system takes the longest edge feature as the basis when dealing with wrinkles and reflections on the surface of the wire, so this kind of noise is not easily eliminated with shorter edge features.


