
Quantification of Serum Exosome Biomarkers Using 3D Nanoporous Gold and Spectrophotometry


Abstract
:
1. Introduction
2. Materials and Methods
2.1. Materials
2.2. Fabrication of Nanoporous Gold (NPG) Substrate
2.3. Exosomes Isolation and Characterization in Culture Media
2.4. Integration of Exosomes with Nanoporous Gold (NPG) Substrate
3. Results and Discussion
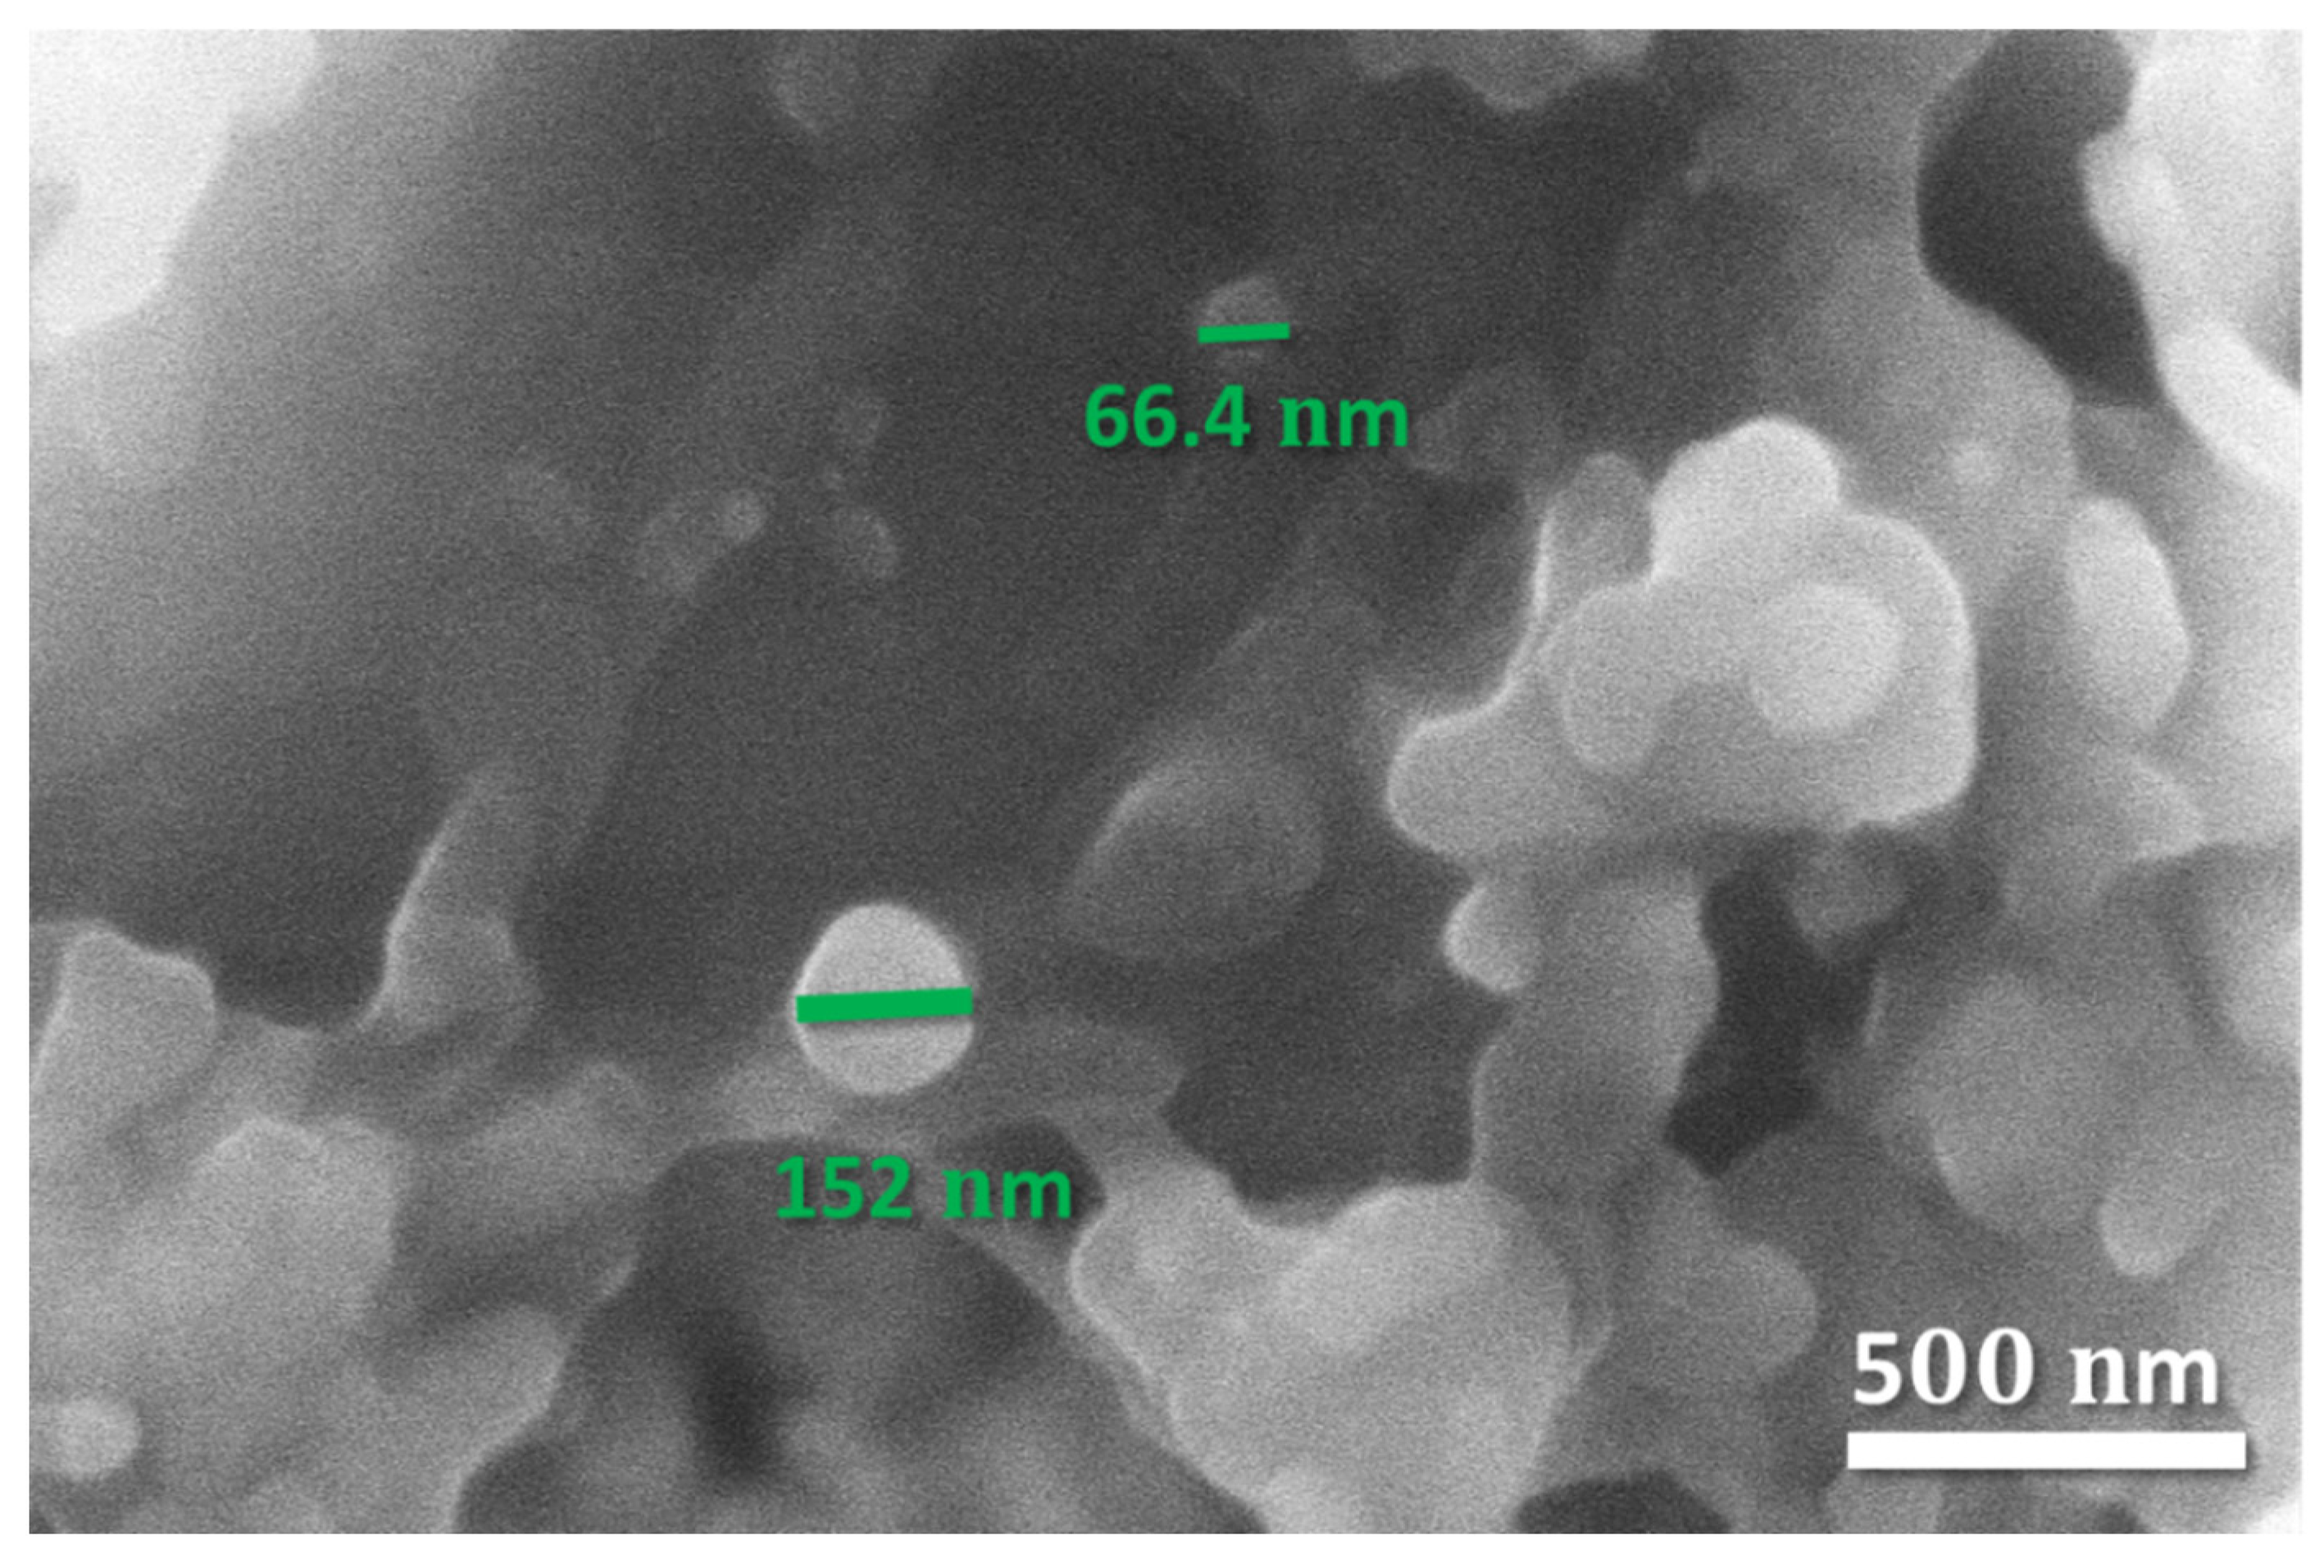
3.1. Characterization of Exosomes
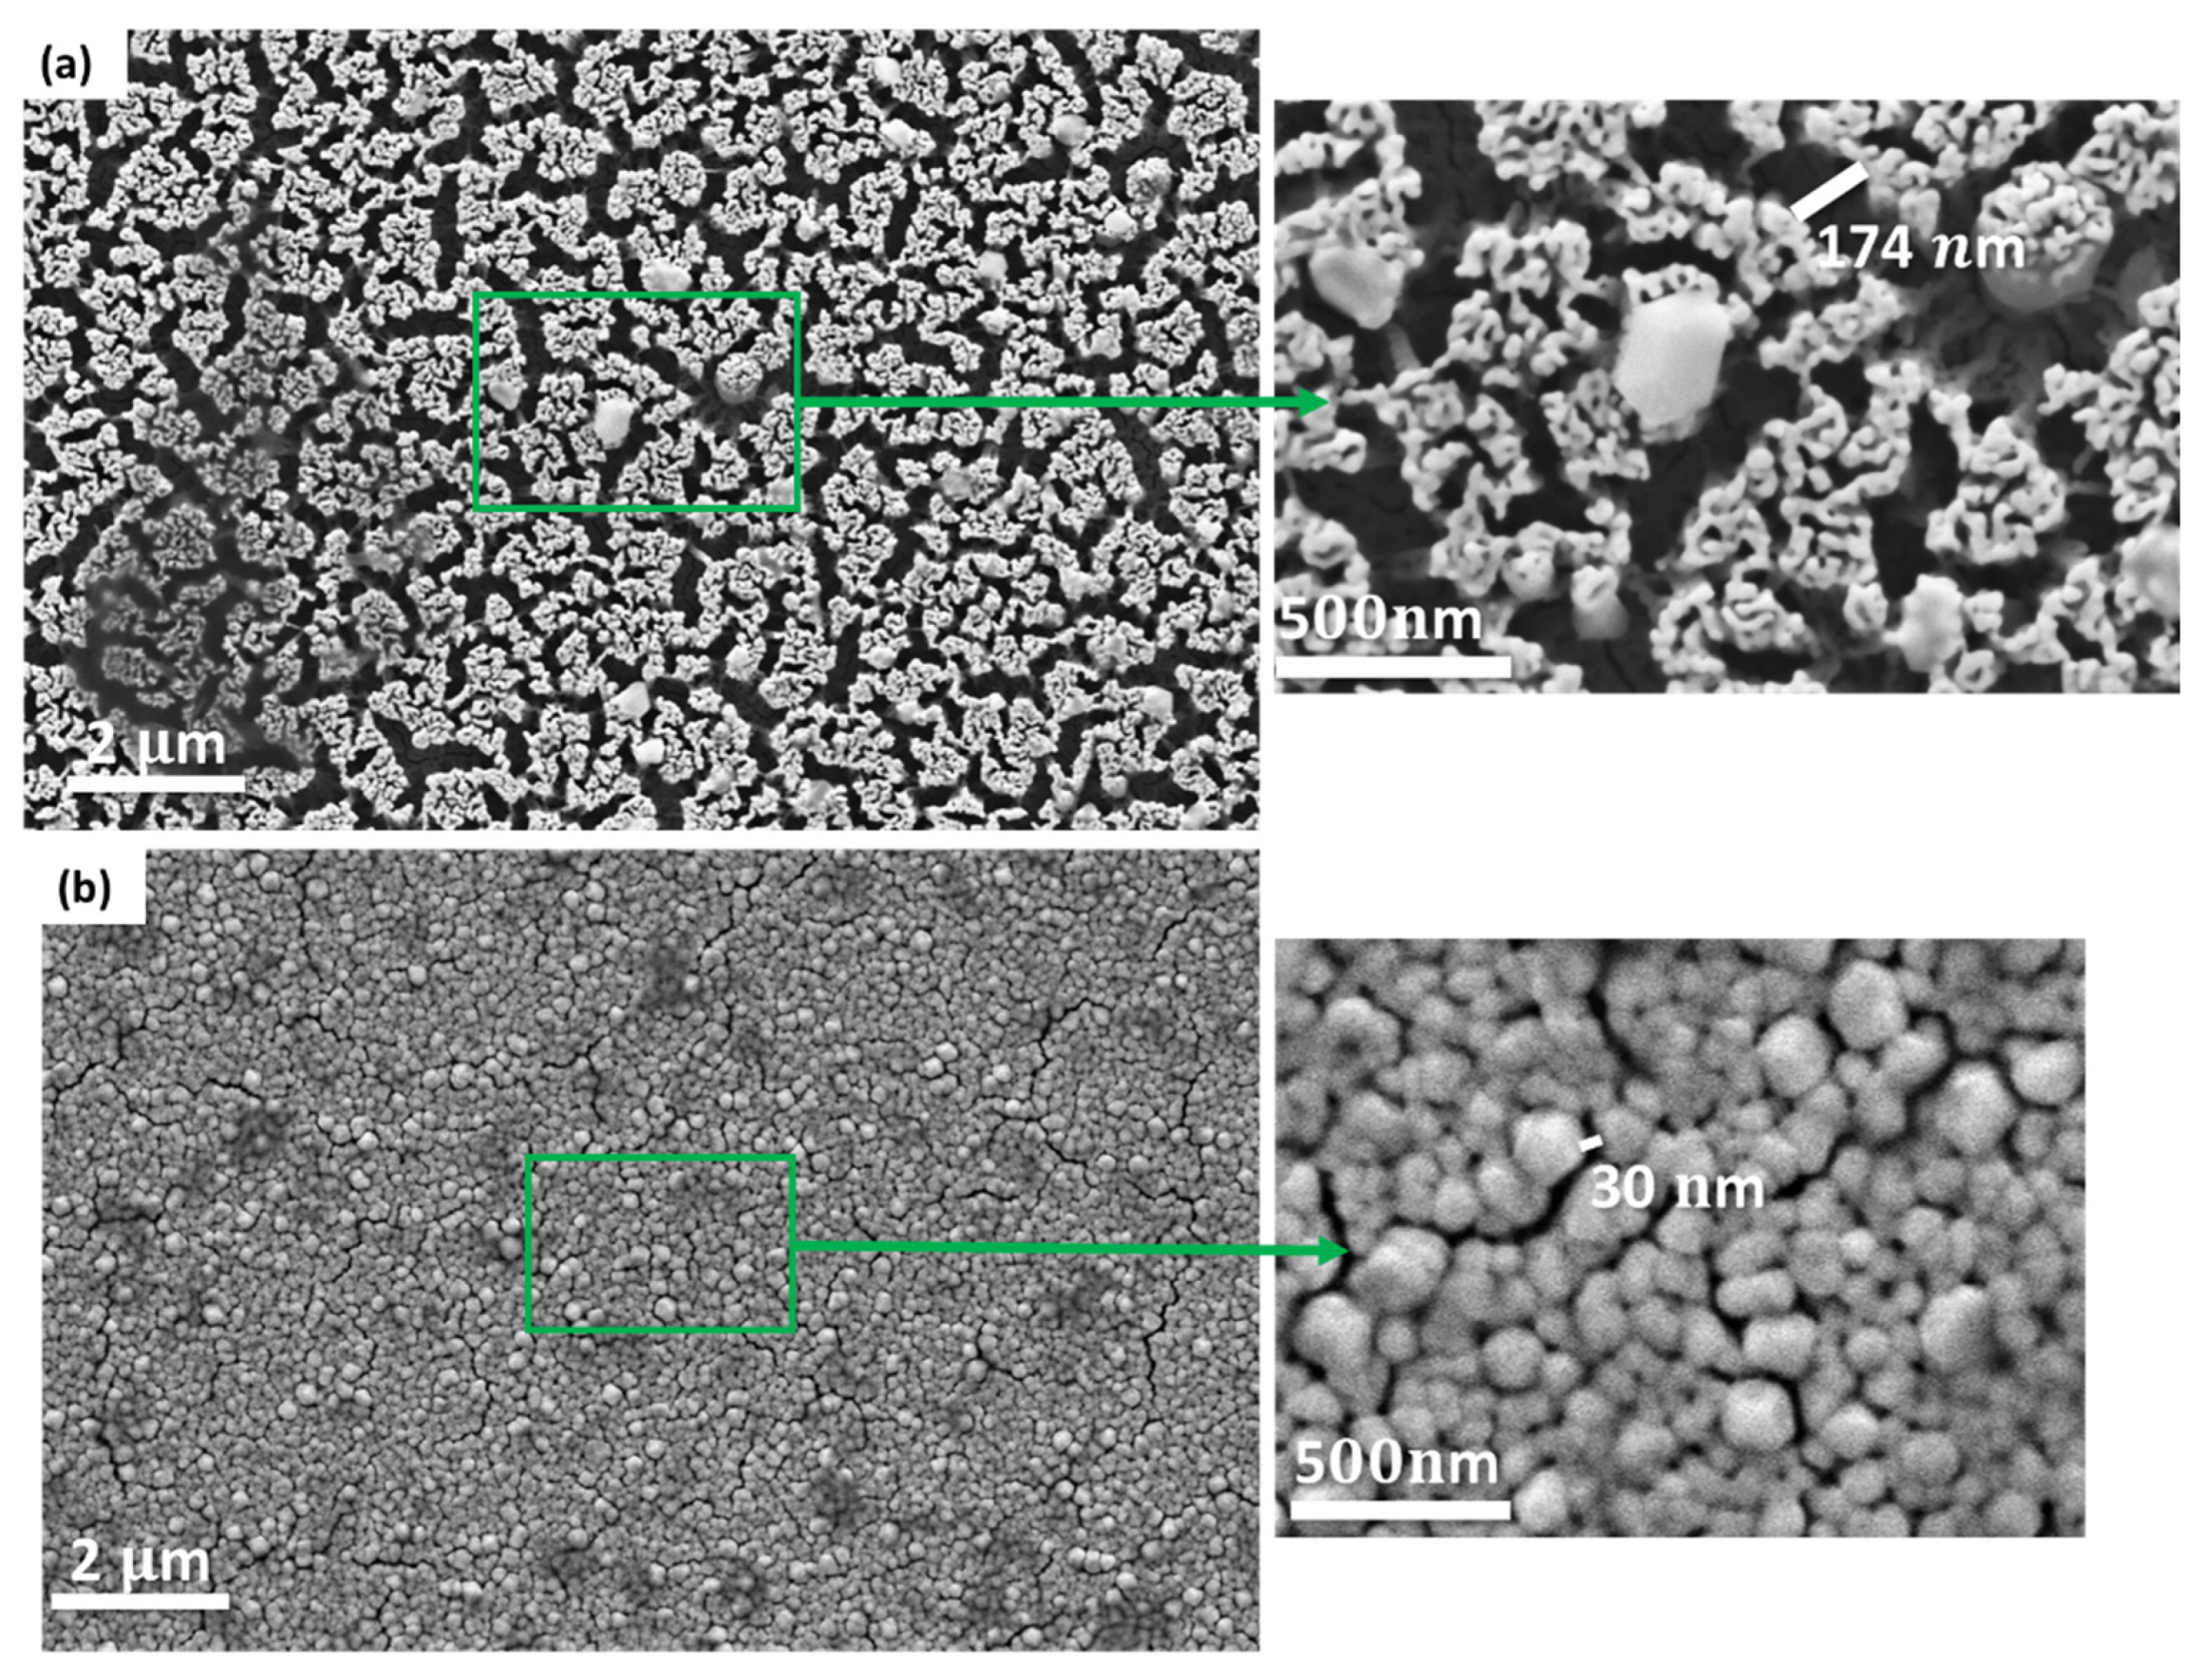
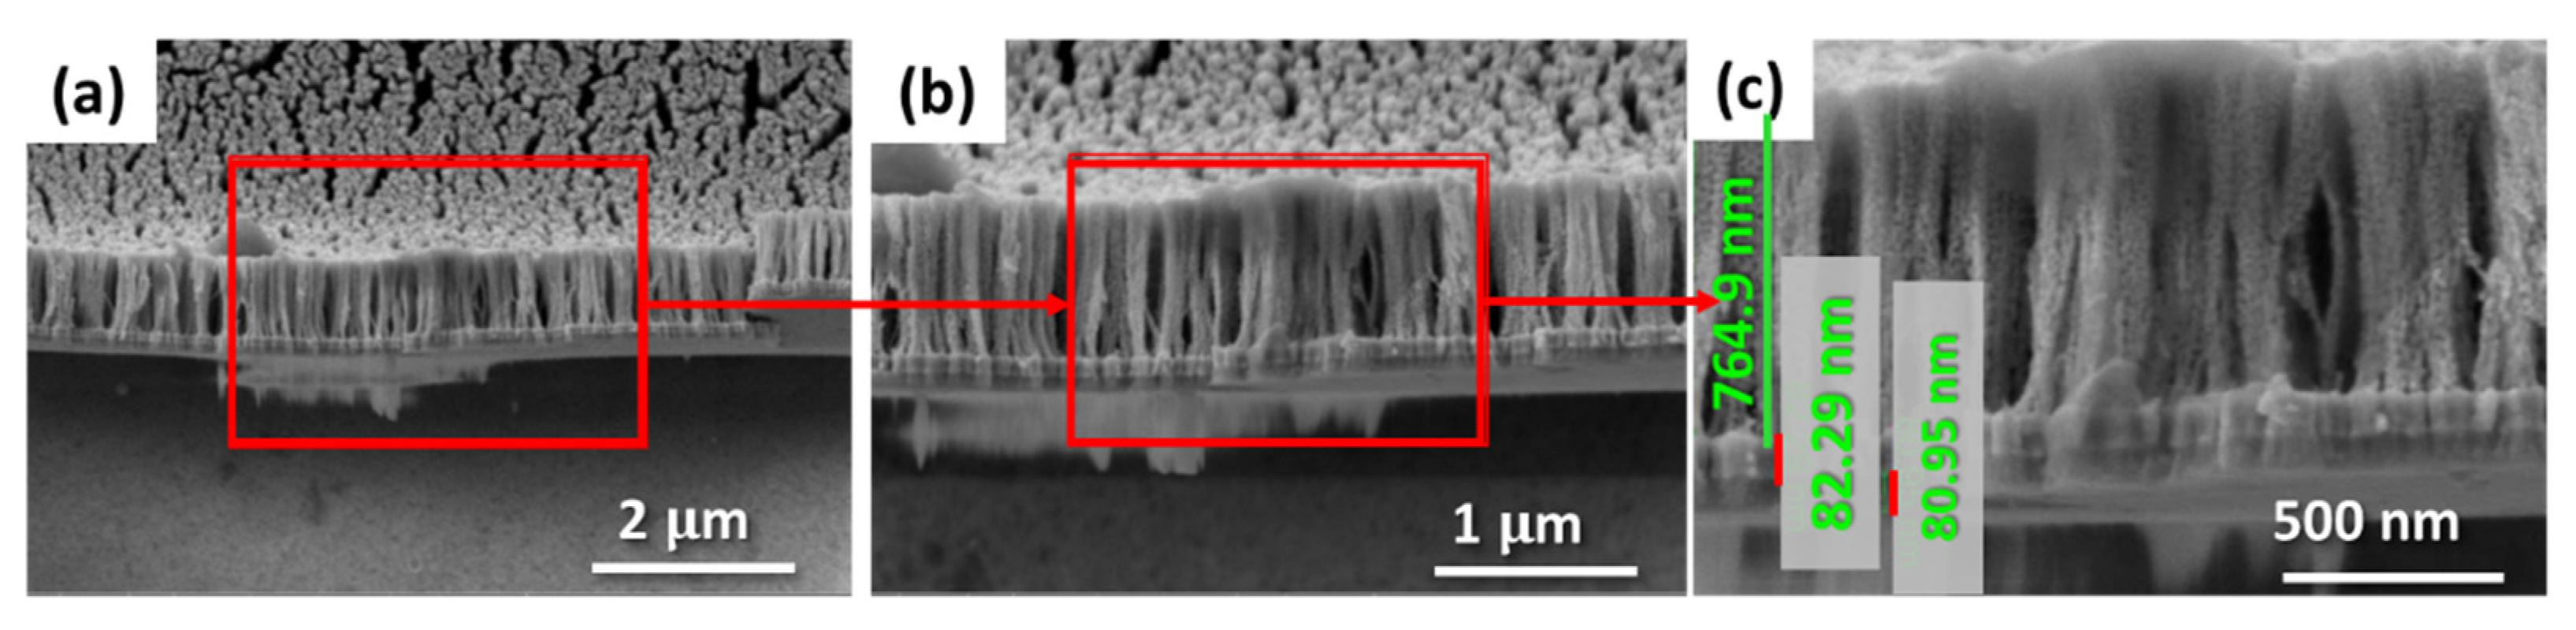
3.2. Characterization of Nanoporous Gold (NPG) Substrates
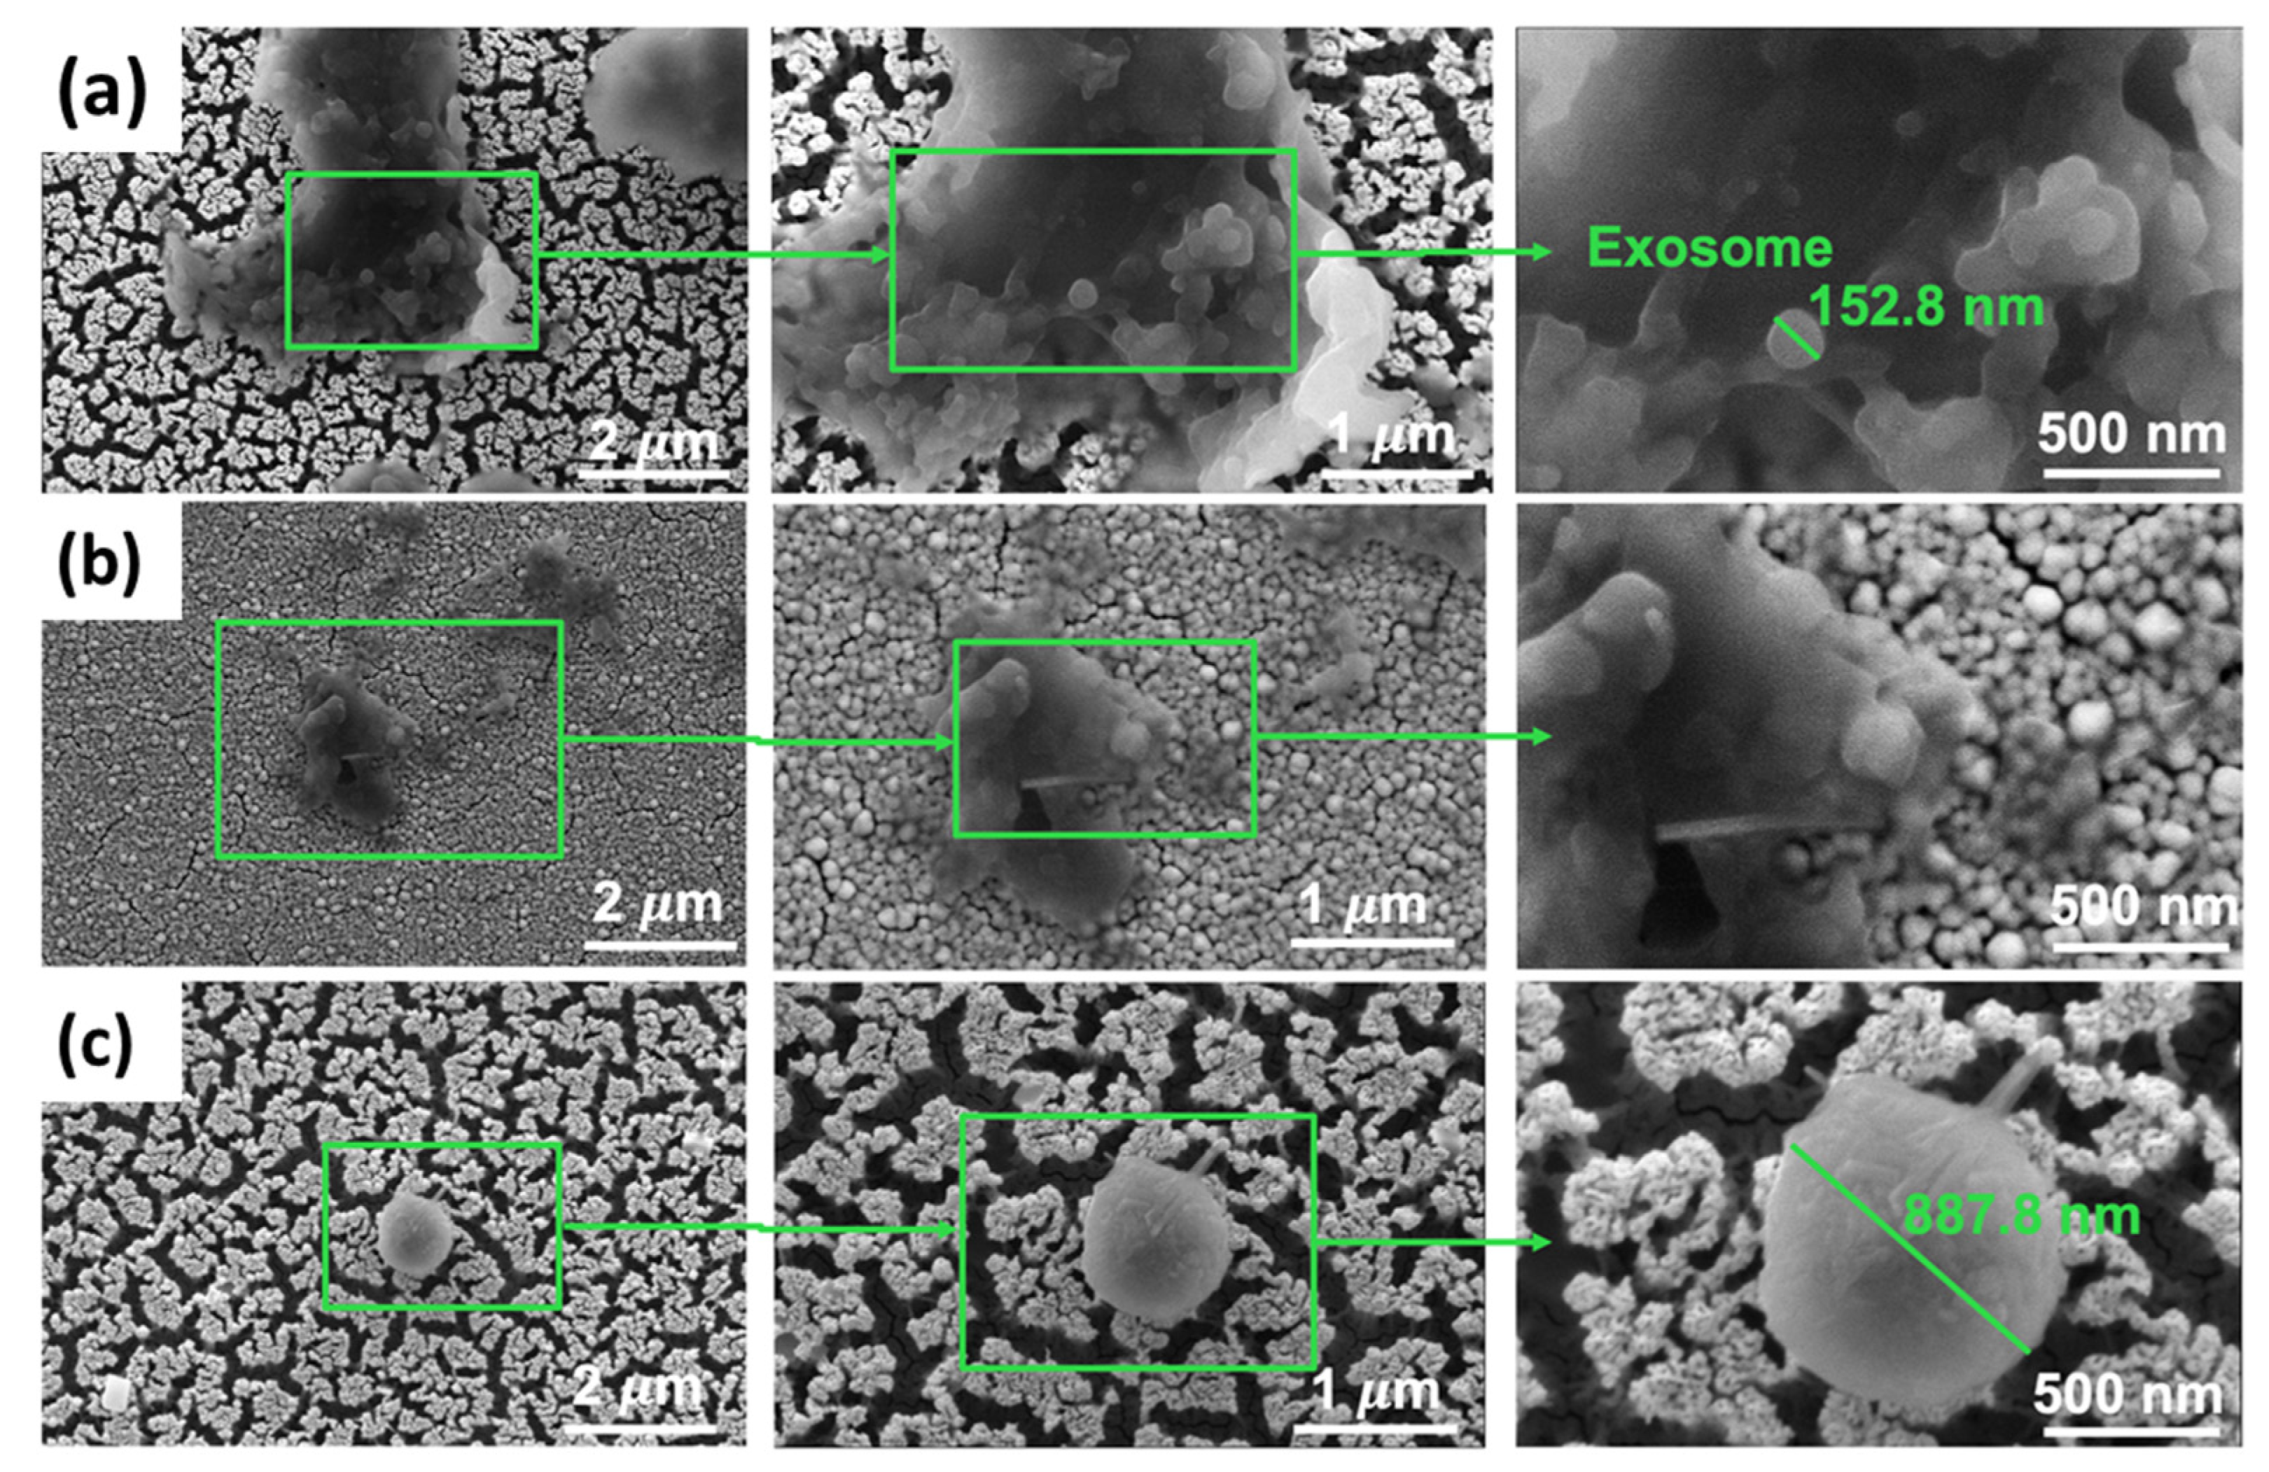
3.2.1. Functionalization of Nanoporous Gold (NPG) Substrate with Exosomes
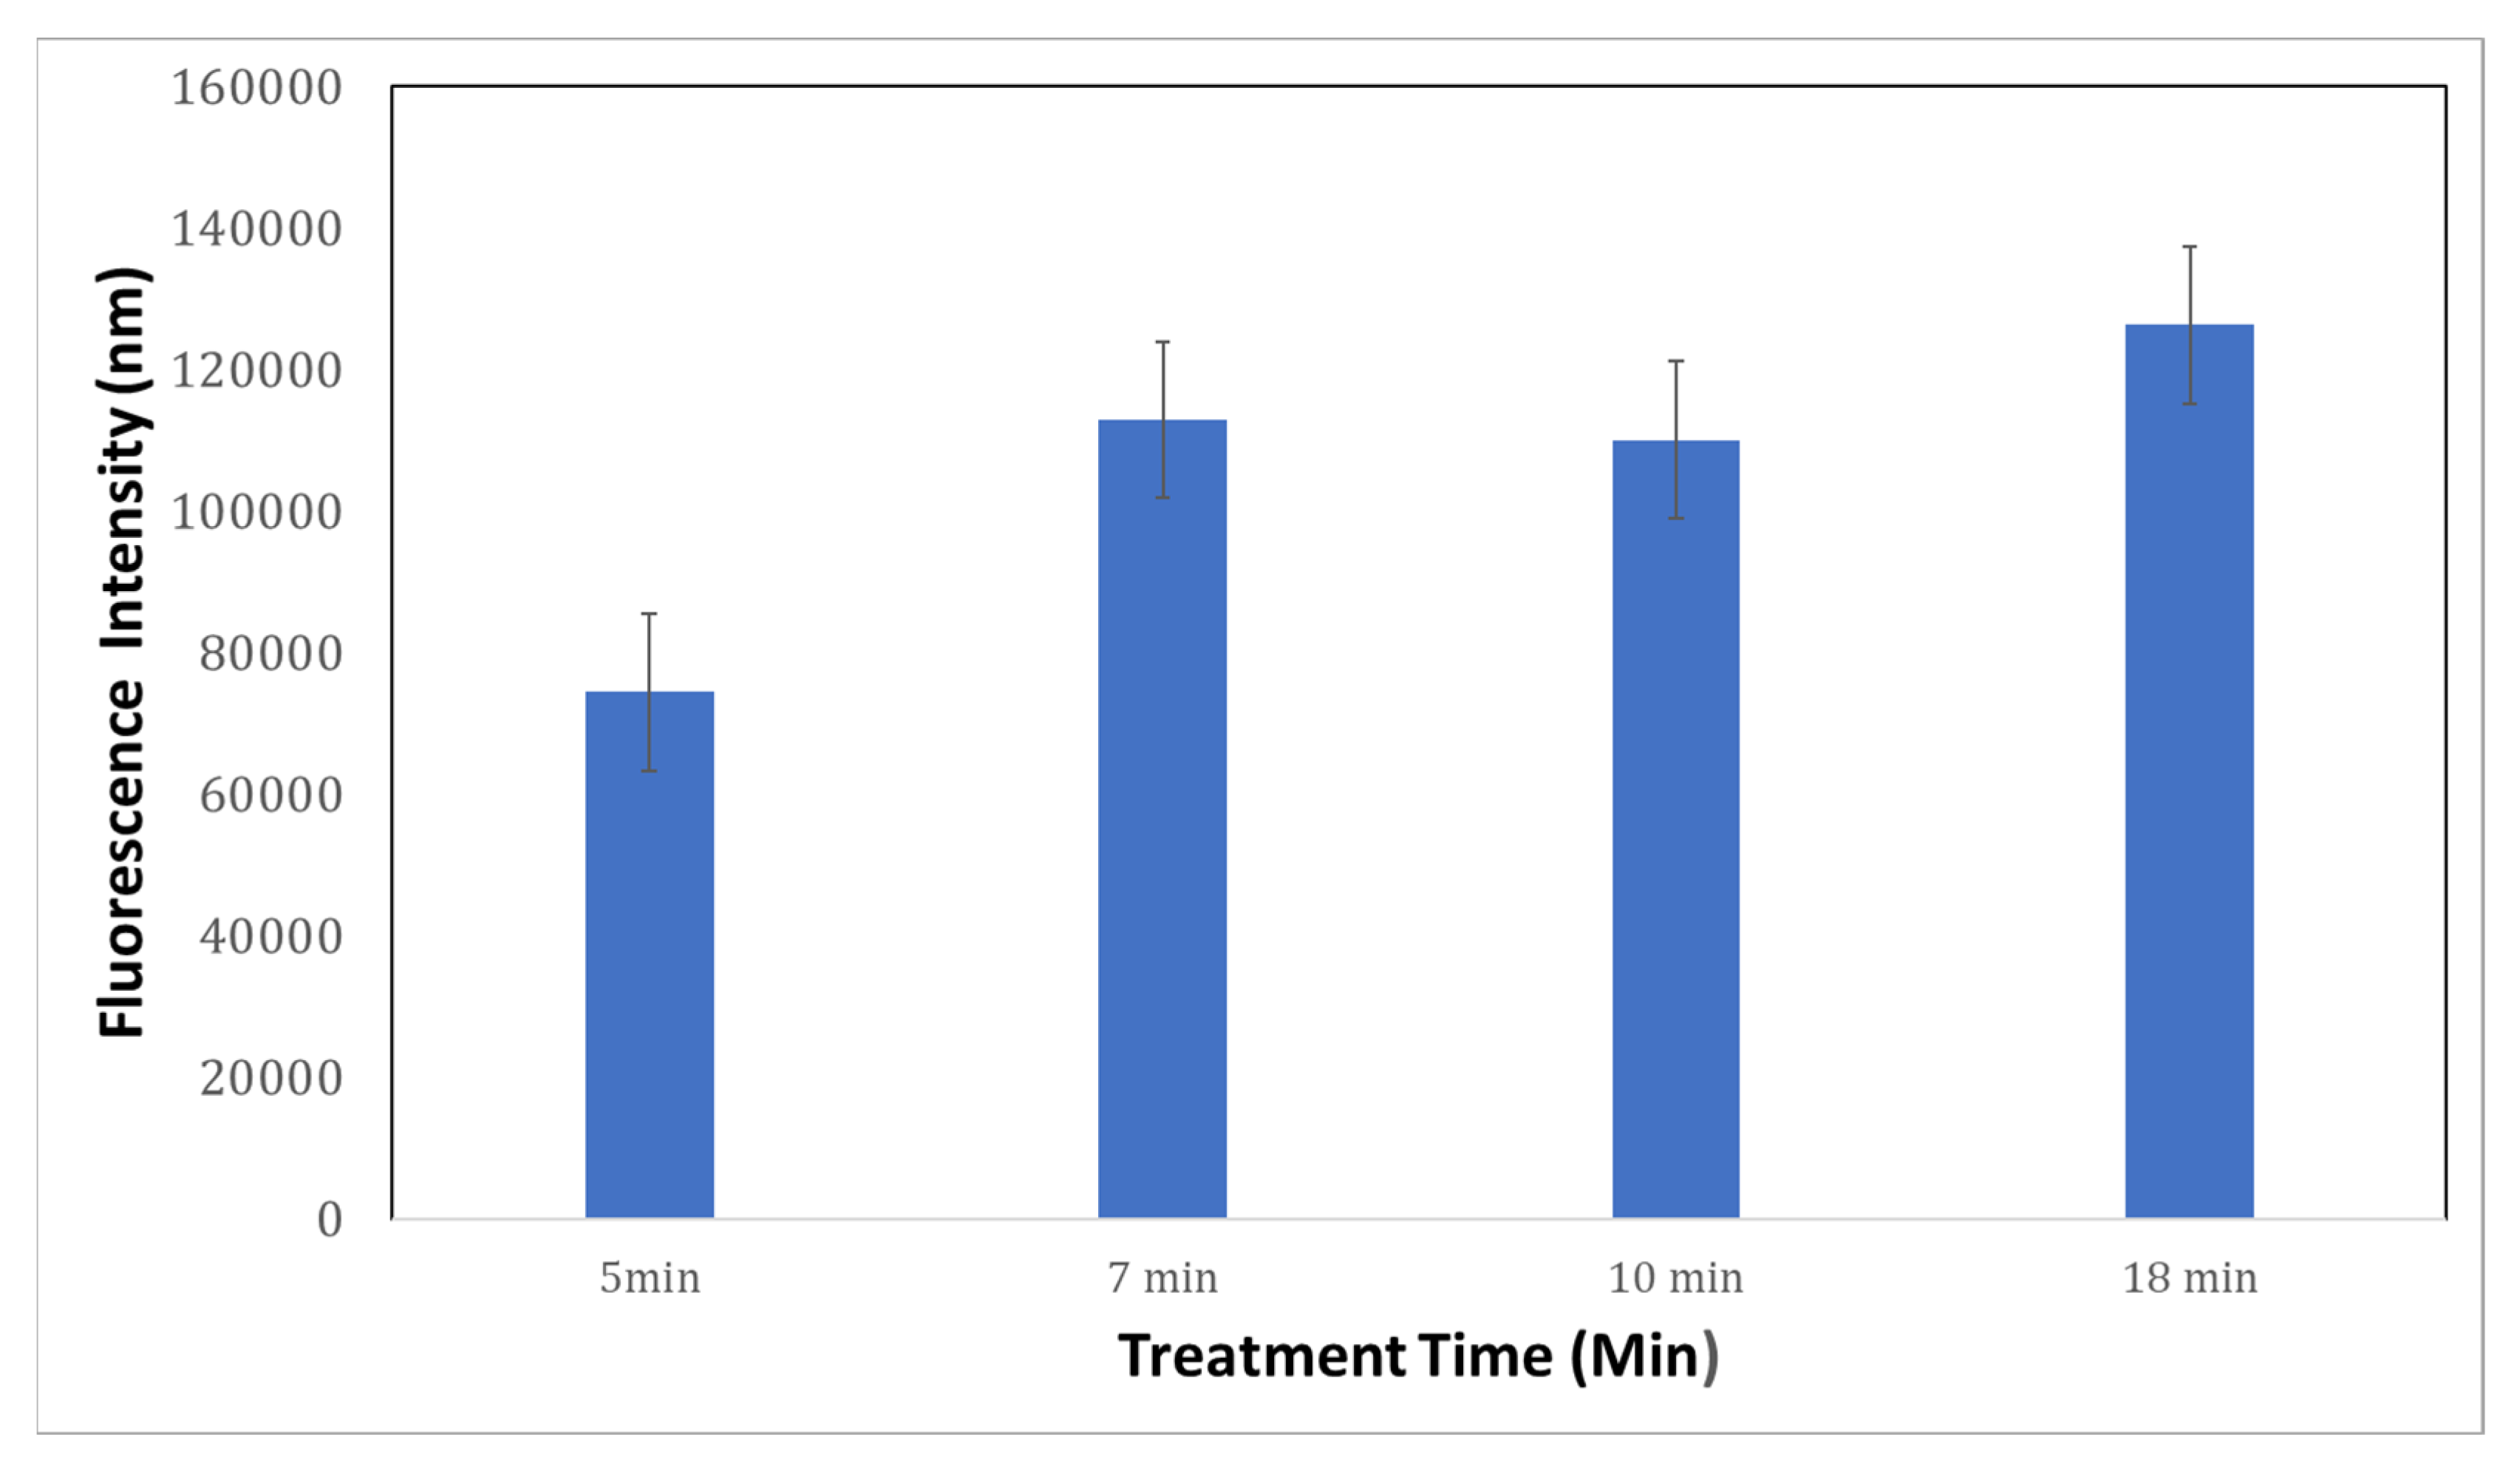
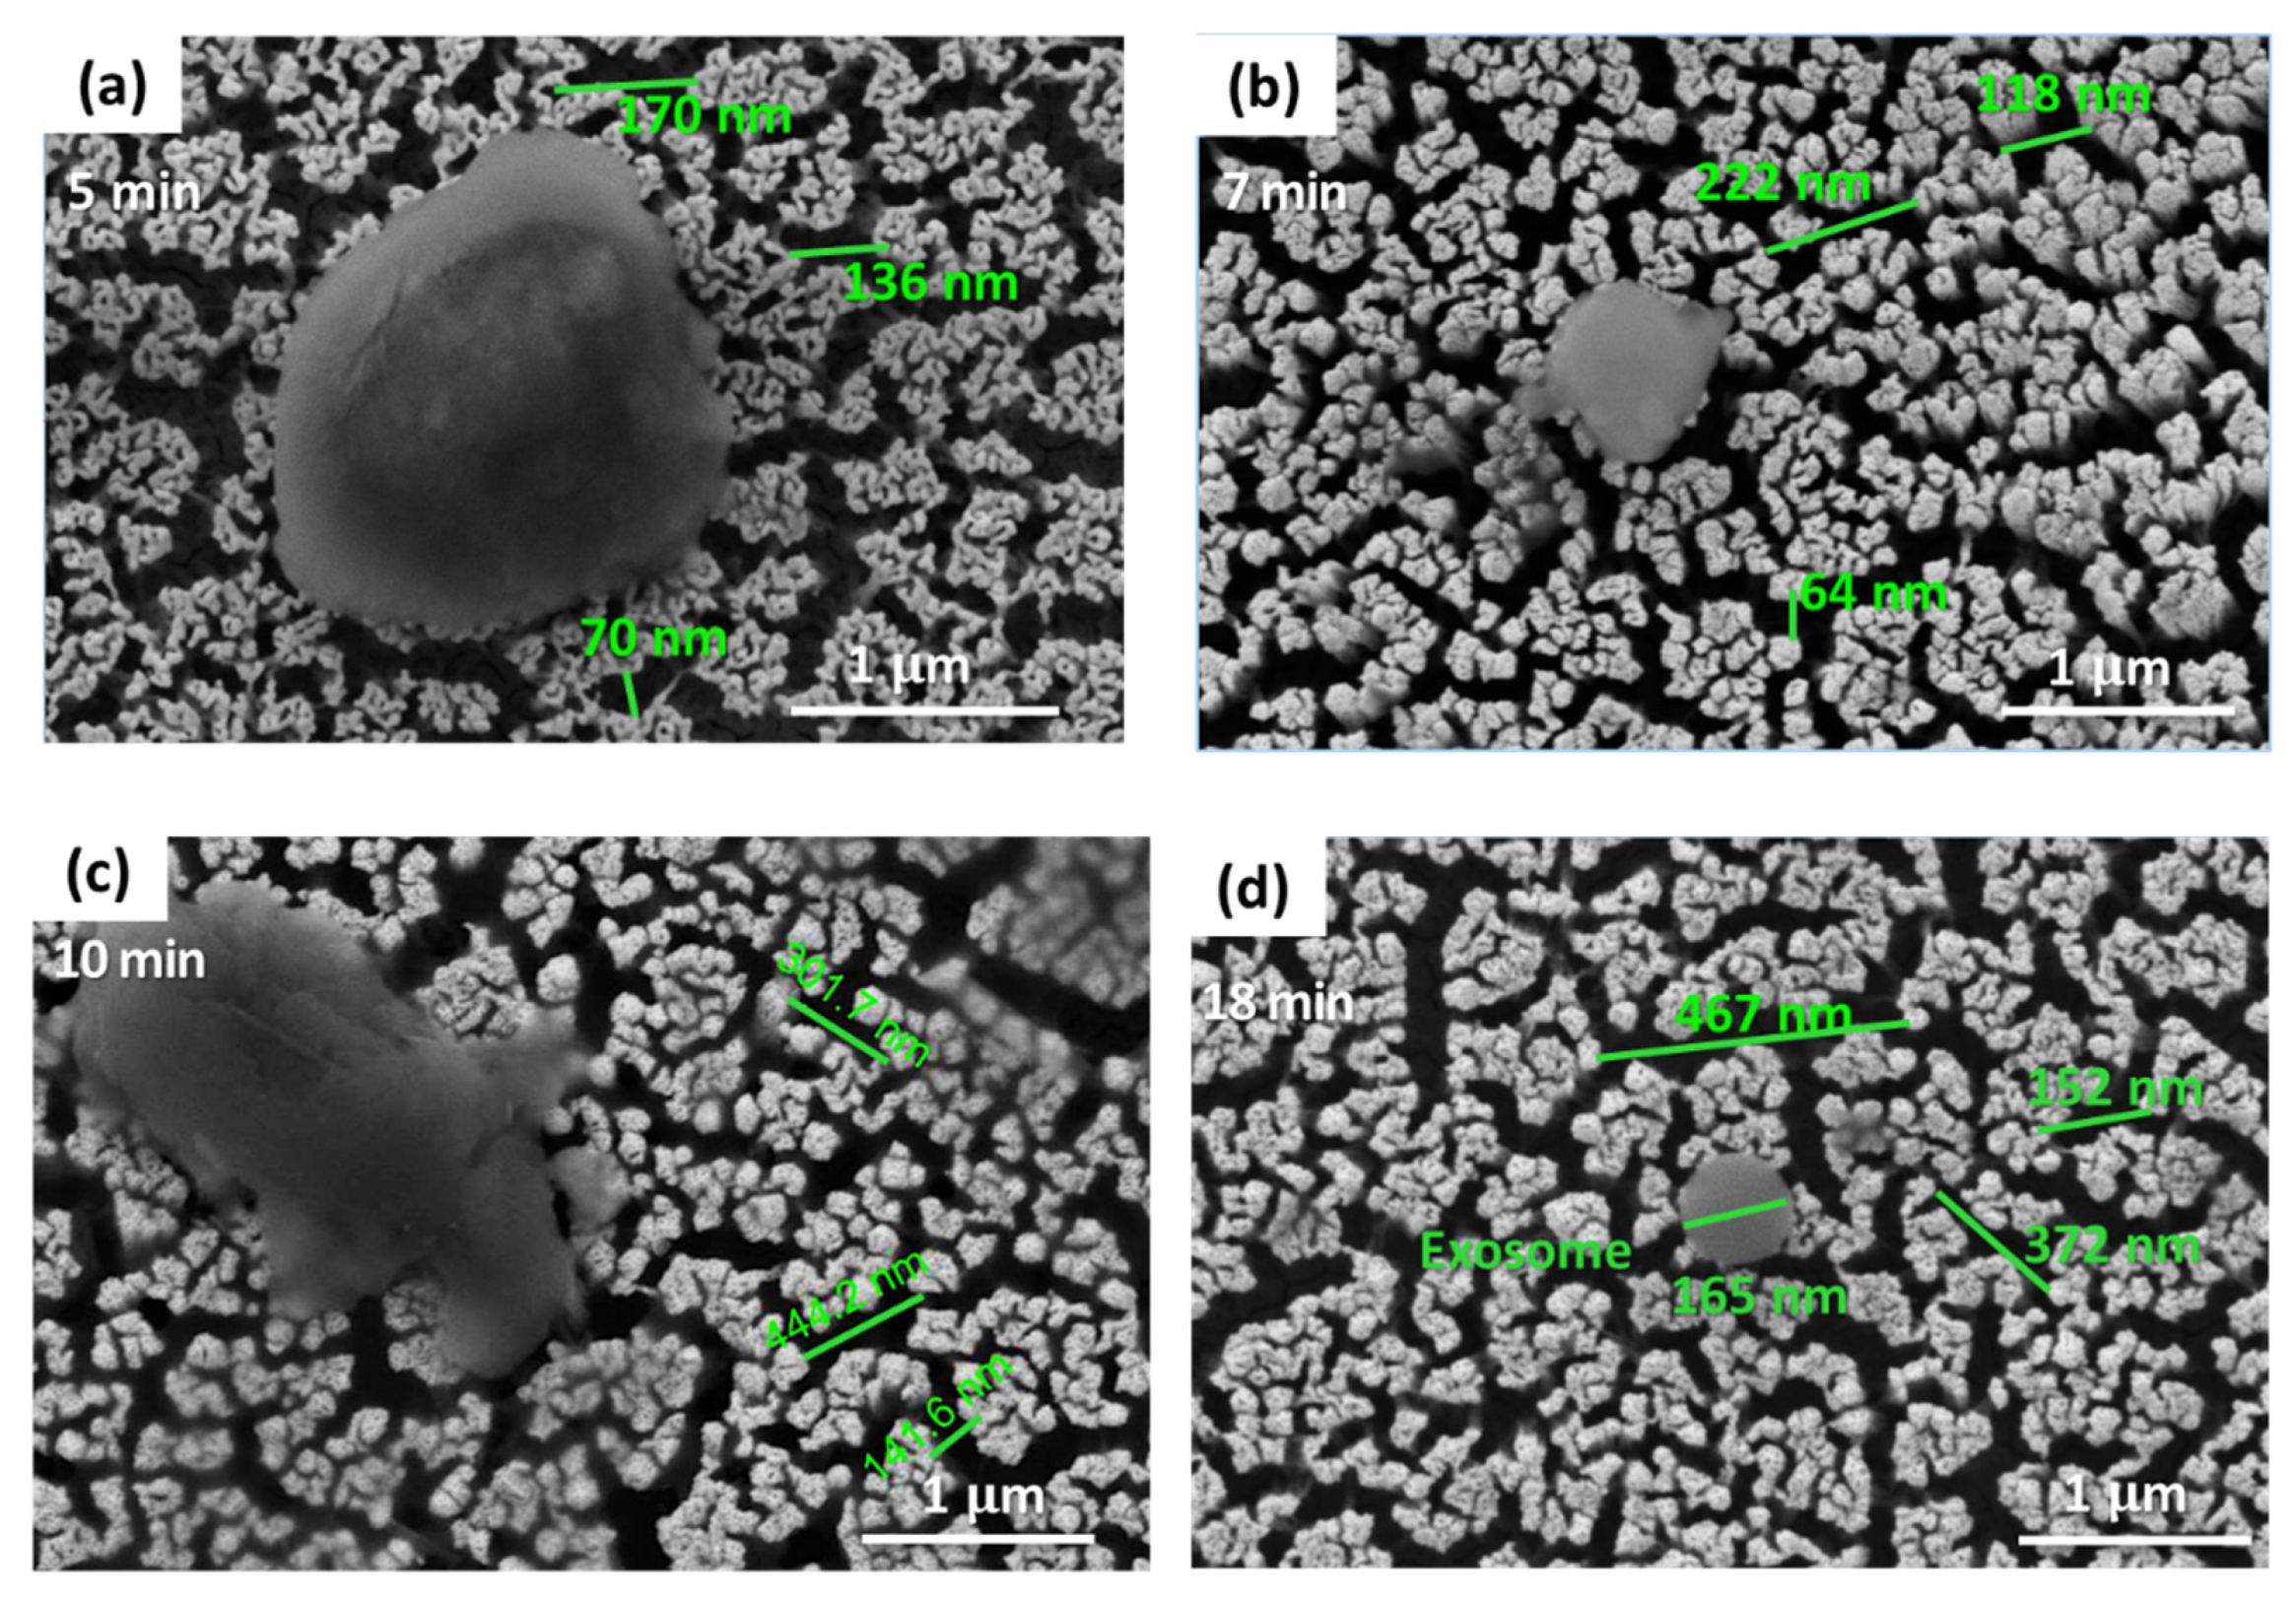
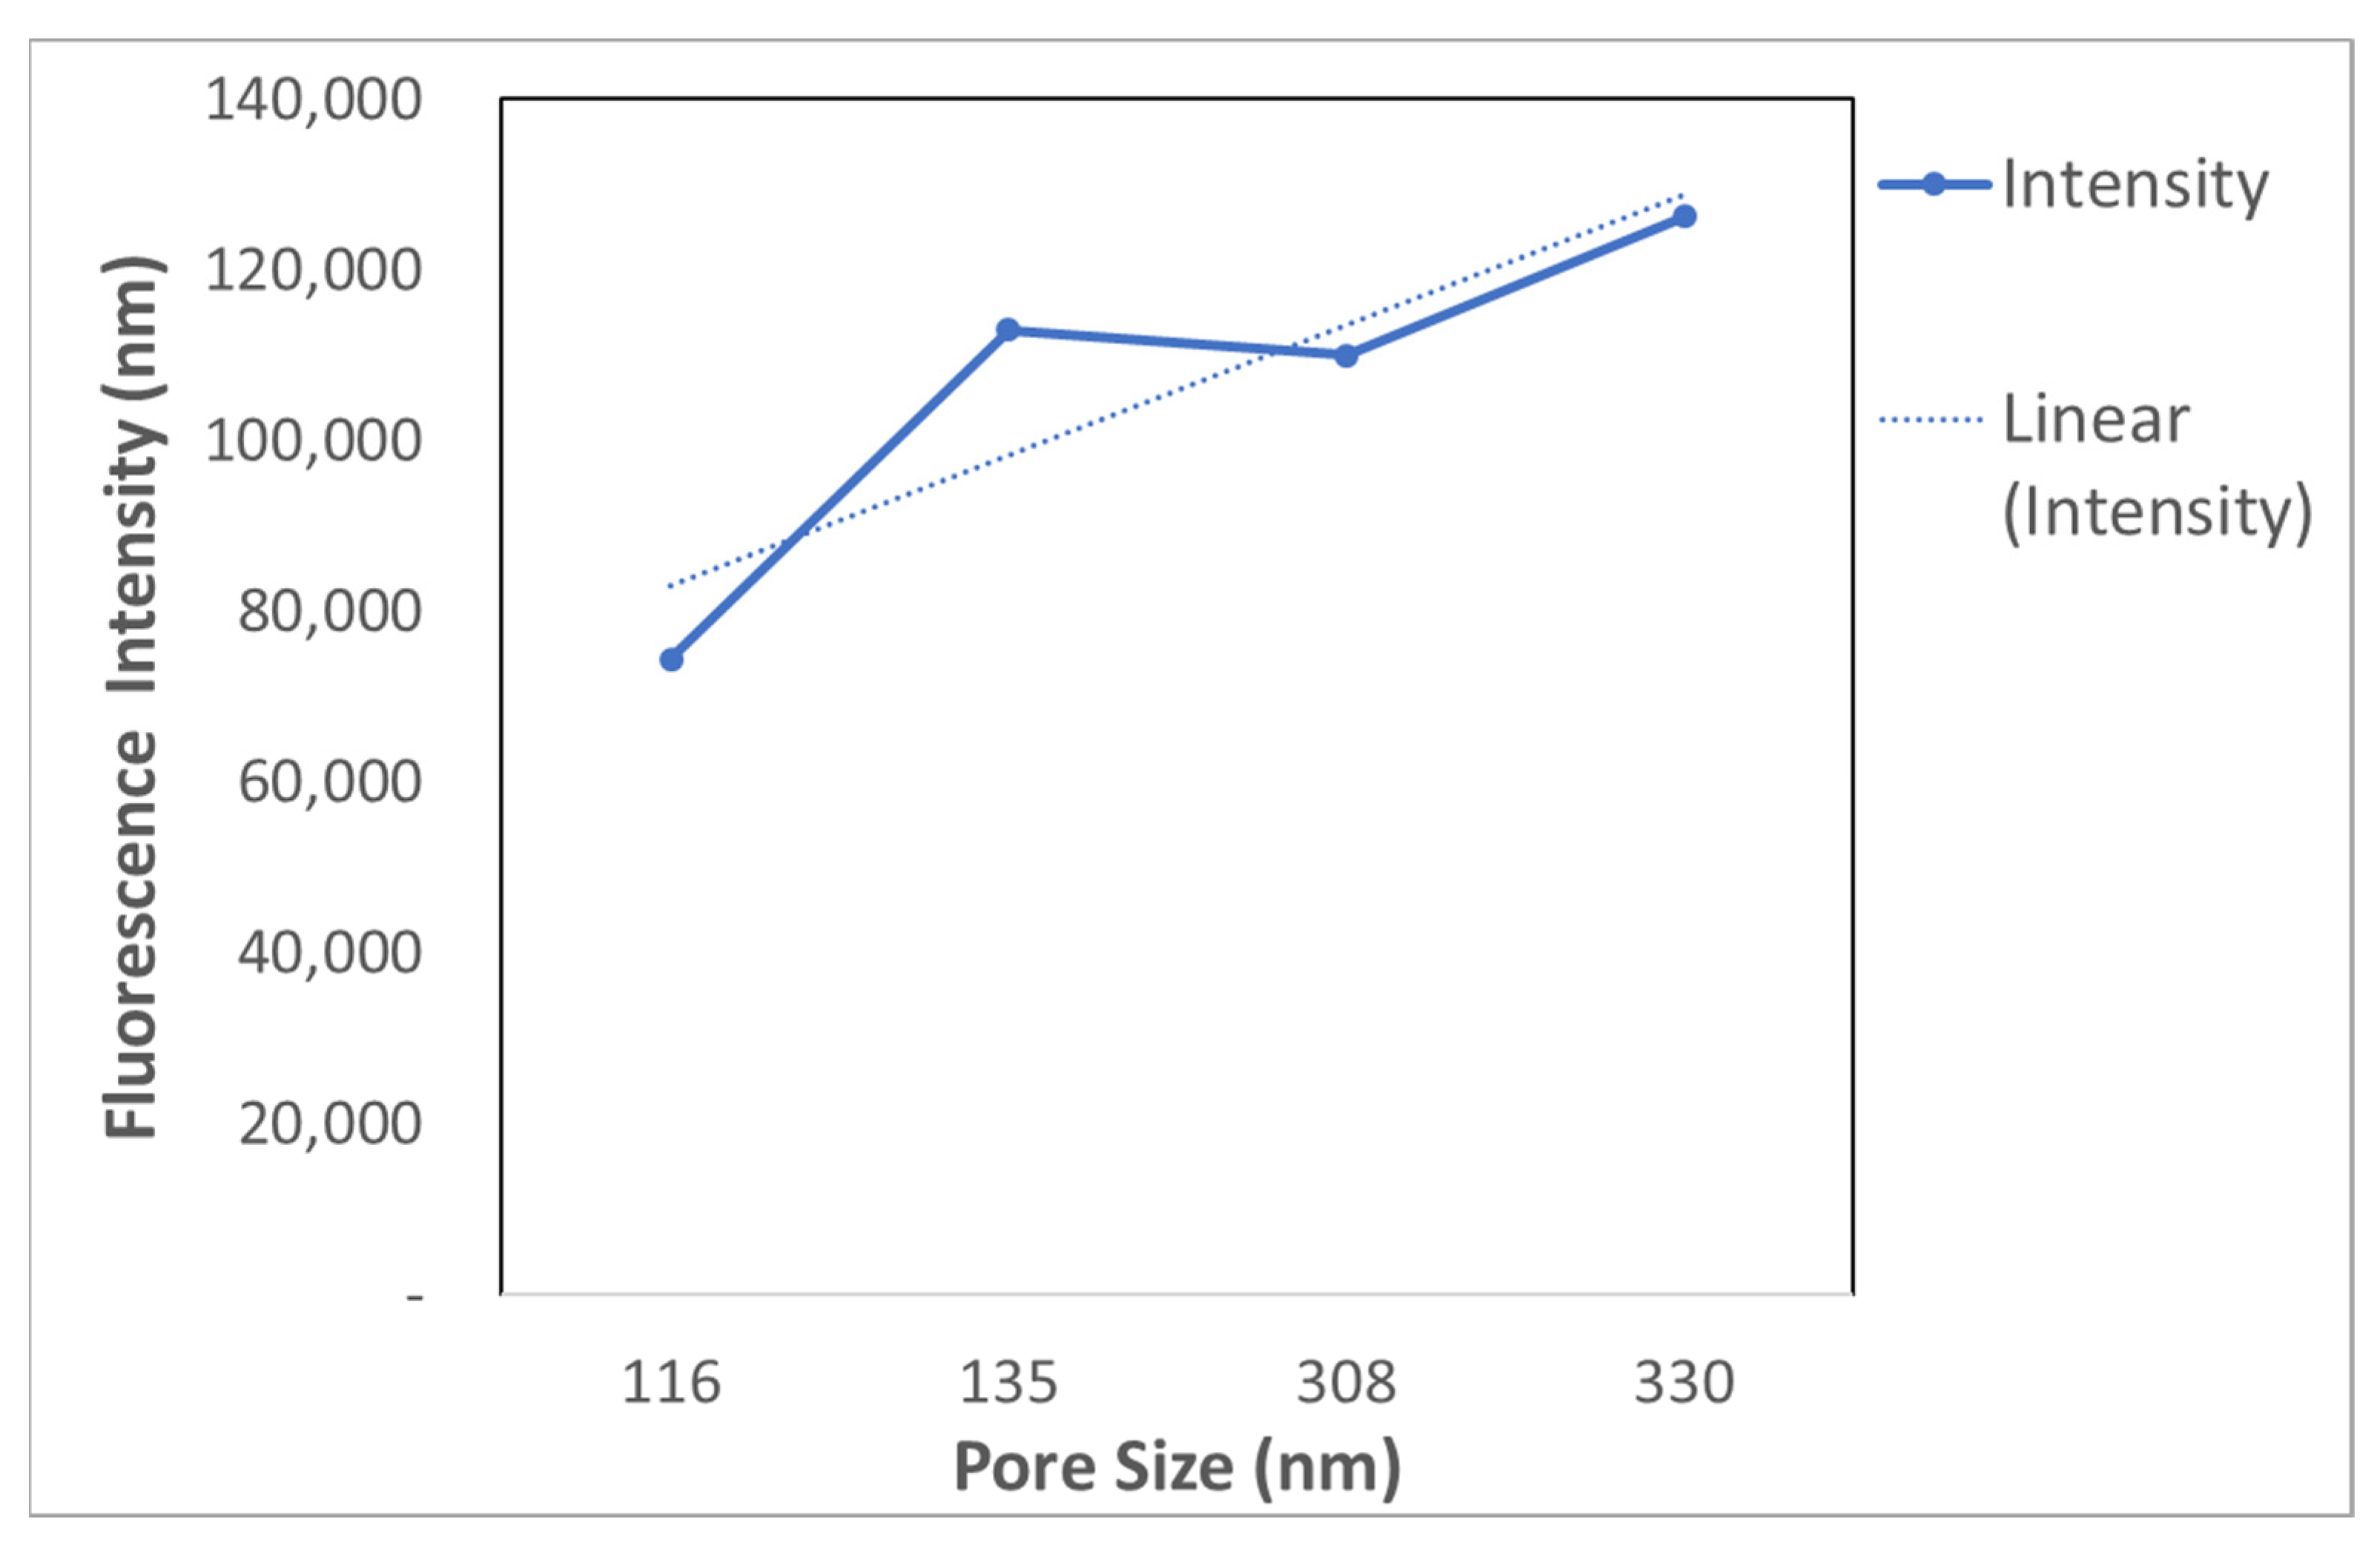
3.2.2. Functionalization of Nanoporous Gold (NPG) Substrate with Exosomes at Different Pore Sizes
4. Conclusions
Supplementary Materials
Author Contributions
Funding
Institutional Review Board Statement
Informed Consent Statement
Data Availability Statement
Acknowledgments
Conflicts of Interest
References
- Jafari, S.H.; Saadatpour, Z.; Salmaninejad, A.; Momeni, F.; Mokhtari, M.; Nahand, J.S.; Rahmati, M.; Mirzaei, H.; Kianmehr, M. Breast cancer diagnosis: Imaging techniques and biochemical markers. J. Cell. Physiol. 2018, 233, 5200–5213. [Google Scholar] [CrossRef] [PubMed]
- Tran, P.H.-L.; Xiang, D.; Nguyen, T.N.-G.; Tran, T.T.-D.; Chen, Q.; Yin, W.; Zhang, Y.; Kong, L.; Duan, A.; Chen, K.; et al. Aptamer-guided extracellular vesicle theranostics in oncology. Theranostics 2020, 10, 3849–3866. [Google Scholar] [CrossRef] [PubMed]
- Moura, S.L.; Martín, C.G.; Martí, M.; Pividori, M.I. Electrochemical immunosensing of nanovesicles as biomarkers for breast cancer. Biosens. Bioelectron. 2020, 150, 111882. [Google Scholar] [CrossRef]
- Rajagopal, C.; Harikumar, K.B. The Origin and Functions of Exosomes in Cancer. Front. Oncol. 2018, 8, 66. [Google Scholar] [CrossRef] [PubMed] [Green Version]
- Jabbari, N.; Akbariazar, E.; Feqhhi, M.; Rahbarghazi, R.; Rezaie, J. Breast cancer-derived exosomes: Tumor progression and therapeutic agents. J. Cell. Physiol. 2020, 235, 6345–6356. [Google Scholar] [CrossRef]
- Wen, S.W.; Lima, L.G.; Lobb, R.J.; Norris, E.L.; Hastie, M.L.; Krumeich, S.; Möller, A. Breast Cancer-Derived Exosomes Reflect the Cell-of-Origin Phenotype. Proteomics 2019, 19, e1800180. [Google Scholar] [CrossRef] [PubMed]
- King, H.W.; Michael, M.Z.; Gleadle, J.M. Hypoxic enhancement of exosome release by breast cancer cells. BMC Cancer 2012, 12, 421. [Google Scholar] [CrossRef] [PubMed] [Green Version]
- Zhang, Z.; Dombroski, J.A.; King, M.R. Engineering of Exosomes to Target Cancer Metastasis. Cell. Mol. Bioeng. 2020, 13, 1–16. [Google Scholar] [CrossRef] [Green Version]
- Logozzi, M.; De Milito, A.; Lugini, L.; Borghi, M.; Calabrò, L.; Spada, M.; Perdicchio, M.; Marino, M.L.; Federici, C.; Iessi, E.; et al. High levels of exosomes expressing CD63 and caveolin-1 in plasma of melanoma patients. PLoS ONE 2009, 4, e5219. [Google Scholar] [CrossRef] [Green Version]
- Mahgoub, E.O.; Razmara, E.; Bitaraf, A.; Norouzi, F.-S.; Montazeri, M.; Behzadi-Andouhjerdi, R.; Falahati, M.; Cheng, K.; Haik, Y.; Hasan, A.; et al. Advances of exosome isolation techniques in lung cancer. Mol. Biol. Rep. 2020, 47, 7229–7251. [Google Scholar] [CrossRef] [PubMed]
- Xu, L.; Shoaie, N.; Jahanpeyma, F.; Zhao, J.; Azimzadeh, M.; Al−Jamal, K.T. Optical, electrochemical and electrical (nano)biosensors for detection of exosomes: A comprehensive overview. Biosens. Bioelectron. 2020, 161, 112222. [Google Scholar] [CrossRef] [PubMed]
- Shao, B.; Xiao, Z. Recent achievements in exosomal biomarkers detection by nanomaterials-based optical biosensors—A review. Anal. Chim. Acta 2020, 1114, 74–84. [Google Scholar] [CrossRef] [PubMed]
- Merdalimova, A.; Chernyshev, V.; Nozdriukhin, D.; Rudakovskaya, P.; Gorin, D.; Yashchenok, A. Identification and analysis of exosomes by surface-enhanced Raman spectroscopy. Appl. Sci. 2019, 9, 1135. [Google Scholar] [CrossRef] [Green Version]
- Lang, X.Y.; Guan, P.F.; Fujita, T.; Chen, M.W. Tailored nanoporous gold for ultrahigh fluorescence enhancement. Phys. Chem. Chem. Phys. 2011, 13, 3795–3799. [Google Scholar] [CrossRef]
- Bollella, P. Porous gold: A new frontier for enzyme-based electrodes. Nanomaterials 2020, 10, 722. [Google Scholar] [CrossRef] [Green Version]
- al Mannai, A.; Haik, Y.; Elmel, A.; Qadri, S.; Saud, K.M. 3D SERS-based biosensor for the selective detection of circulating cancer-derived exosomes. Emergent Mater. 2021. [Google Scholar] [CrossRef]
- Xiao, S.; Wang, S.; Wang, X.; Xu, P. Nanoporous gold: A review and potentials in biotechnological and biomedical applications. Nano Sel. 2021, 2, 1437–1458. [Google Scholar] [CrossRef]
- Koya, A.N.; Zhu, X.; Ohannesian, N.; Yanik, A.A.; Alabastri, A.; Zaccaria, R.P.; Krahne, R.; Shih, W.-C.; Garoli, D. Nanoporous Metals: From Plasmonic Properties to Applications in Enhanced Spectroscopy and Photocatalysis. ACS Nano 2021, 15, 6038–6060. [Google Scholar] [CrossRef]
- Akkilic, N.; Geschwindner, S.; Höök, F. Single-molecule biosensors: Recent advances and applications. Biosens. Bioelectron. 2020, 151, 111944. [Google Scholar] [CrossRef]
- El Mel, A.-A.; Mansour, S.A.; Pasha, M.; Zekri, A.; Ponraj, J.; Shetty, A.; Haik, Y. Oxidation of Au/Ag films by oxygen plasma: Phase separation and generation of nanoporosity. Beilstein J. Nanotechnol. 2020, 11, 1608–1614. [Google Scholar] [CrossRef]
- Purohit, B.; Vernekar, P.R.; Shetti, N.P.; Chandra, P. Biosensor nanoengineering: Design, operation, and implementation for biomolecular analysis. Sens. Int. 2020, 1, 100040. [Google Scholar] [CrossRef]
- Lin, J.; Li, J.; Huang, B.; Liu, J.; Chen, X.; Chen, X.-M.; Xu, Y.-M.; Huang, L.-F.; Wang, X.-Z. Exosomes: Novel Biomarkers for Clinical Diagnosis. Sci. World J. 2015, 2015, 657086. [Google Scholar] [CrossRef]
- Stahl, P.D.; Raposo, G. Extracellular Vesicles: Exosomes and Microvesicles, Integrators of Homeostasis. Physiol. Bethesda Md. 2019, 34, 169–177. [Google Scholar] [CrossRef]
- Li, G.; Zhu, N.; Zhou, J.; Kang, K.; Zhou, X.; Ying, B.; Yi, Q.; Wu, Y. A magnetic surface-enhanced Raman scattering platform for performing successive breast cancer exosome isolation and analysis. J. Mater. Chem. B 2021, 9, 2709–2716. [Google Scholar] [CrossRef] [PubMed]
- Kang, T.; Zhu, J.; Luo, X.; Jia, W.; Wu, P.; Cai, C. Controlled Self-Assembly of a Close-Packed Gold Octahedra Array for SERS Sensing Exosomal MicroRNAs. Anal. Chem. 2021, 93, 2519–2526. [Google Scholar] [CrossRef] [PubMed]
- Xue, Y.; Paschalidou, E.M.; Rizzi, P.; Battezzati, L.; Denis, P.; Fecht, H.J. Nanoporous gold thin films synthesised via de-alloying of Au-based nanoglass for highly active SERS substrates. Philos. Mag. 2018, 98, 2769–2781. [Google Scholar] [CrossRef]
- Han, Y.; Qiang, L.; Gao, Y.; Gao, J.; He, Q.; Liu, H.; Han, L.; Zhang, Y. Large-area surface-enhanced Raman spectroscopy substrate by hybrid porous GaN with Au/Ag for breast cancer miRNA detection. Appl. Surf. Sci. 2021, 541, 148456. [Google Scholar] [CrossRef]
- Franchi, M.; Piperigkou, Z.; Karamanos, K.-A.; Franchi, L.; Masola, V. Extracellular Matrix-Mediated Breast Cancer Cells Morphological Alterations, Invasiveness, and Microvesicles/Exosomes Release. Cells 2020, 9, 2031. [Google Scholar] [CrossRef]
- Yan, Z.; Dutta, S.; Liu, Z.; Yu, X.; Mesgarzadeh, N.; Ji, F.; Bitan, G.; Xie, Y. A Label-free platform for identification of exosomes from different sources. ACS Sens. 2019, 4, 488–497. [Google Scholar] [CrossRef] [PubMed]
- Chen, C.; Zong, S.; Wang, Z.; Lu, J.; Zhu, D.; Zhang, Y.; Zhang, R.; Cui, Y. Visualization and intracellular dynamic tracking of exosomes and exosomal miRNAs using single molecule localization microscopy. Nanoscale 2018, 10, 5154–5162. [Google Scholar] [CrossRef]
- Chauvin, A.; Lafuente, M.; Mevellec, J.Y.; Mallada, R.; Humbert, B.; Pina, M.P.; Tessier, P.-Y.; El Mel, A. Lamellar nanoporous gold thin films with tunable porosity for ultrasensitive SERS detection in liquid and gas phase. Nanoscale 2020, 12, 12602–12612. [Google Scholar] [CrossRef] [PubMed]
- Ranjbar, S.; Shahrokhian, S.; Nurmohammadi, F. Nanoporous gold as a suitable substrate for preparation of a new sensitive electrochemical aptasensor for detection of Salmonella typhimurium. Sens. Actuators B Chem. 2018, 255, 1536–1544. [Google Scholar] [CrossRef]
- Taylor, A.B.; Zijlstra, P. Single-Molecule Plasmon Sensing: Current Status and Future Prospects. ACS Sens. 2017, 2, 1103–1122. [Google Scholar] [CrossRef] [PubMed] [Green Version]


| Type | Concentration | 1 | 2 | 3 | Average | |
|---|---|---|---|---|---|---|
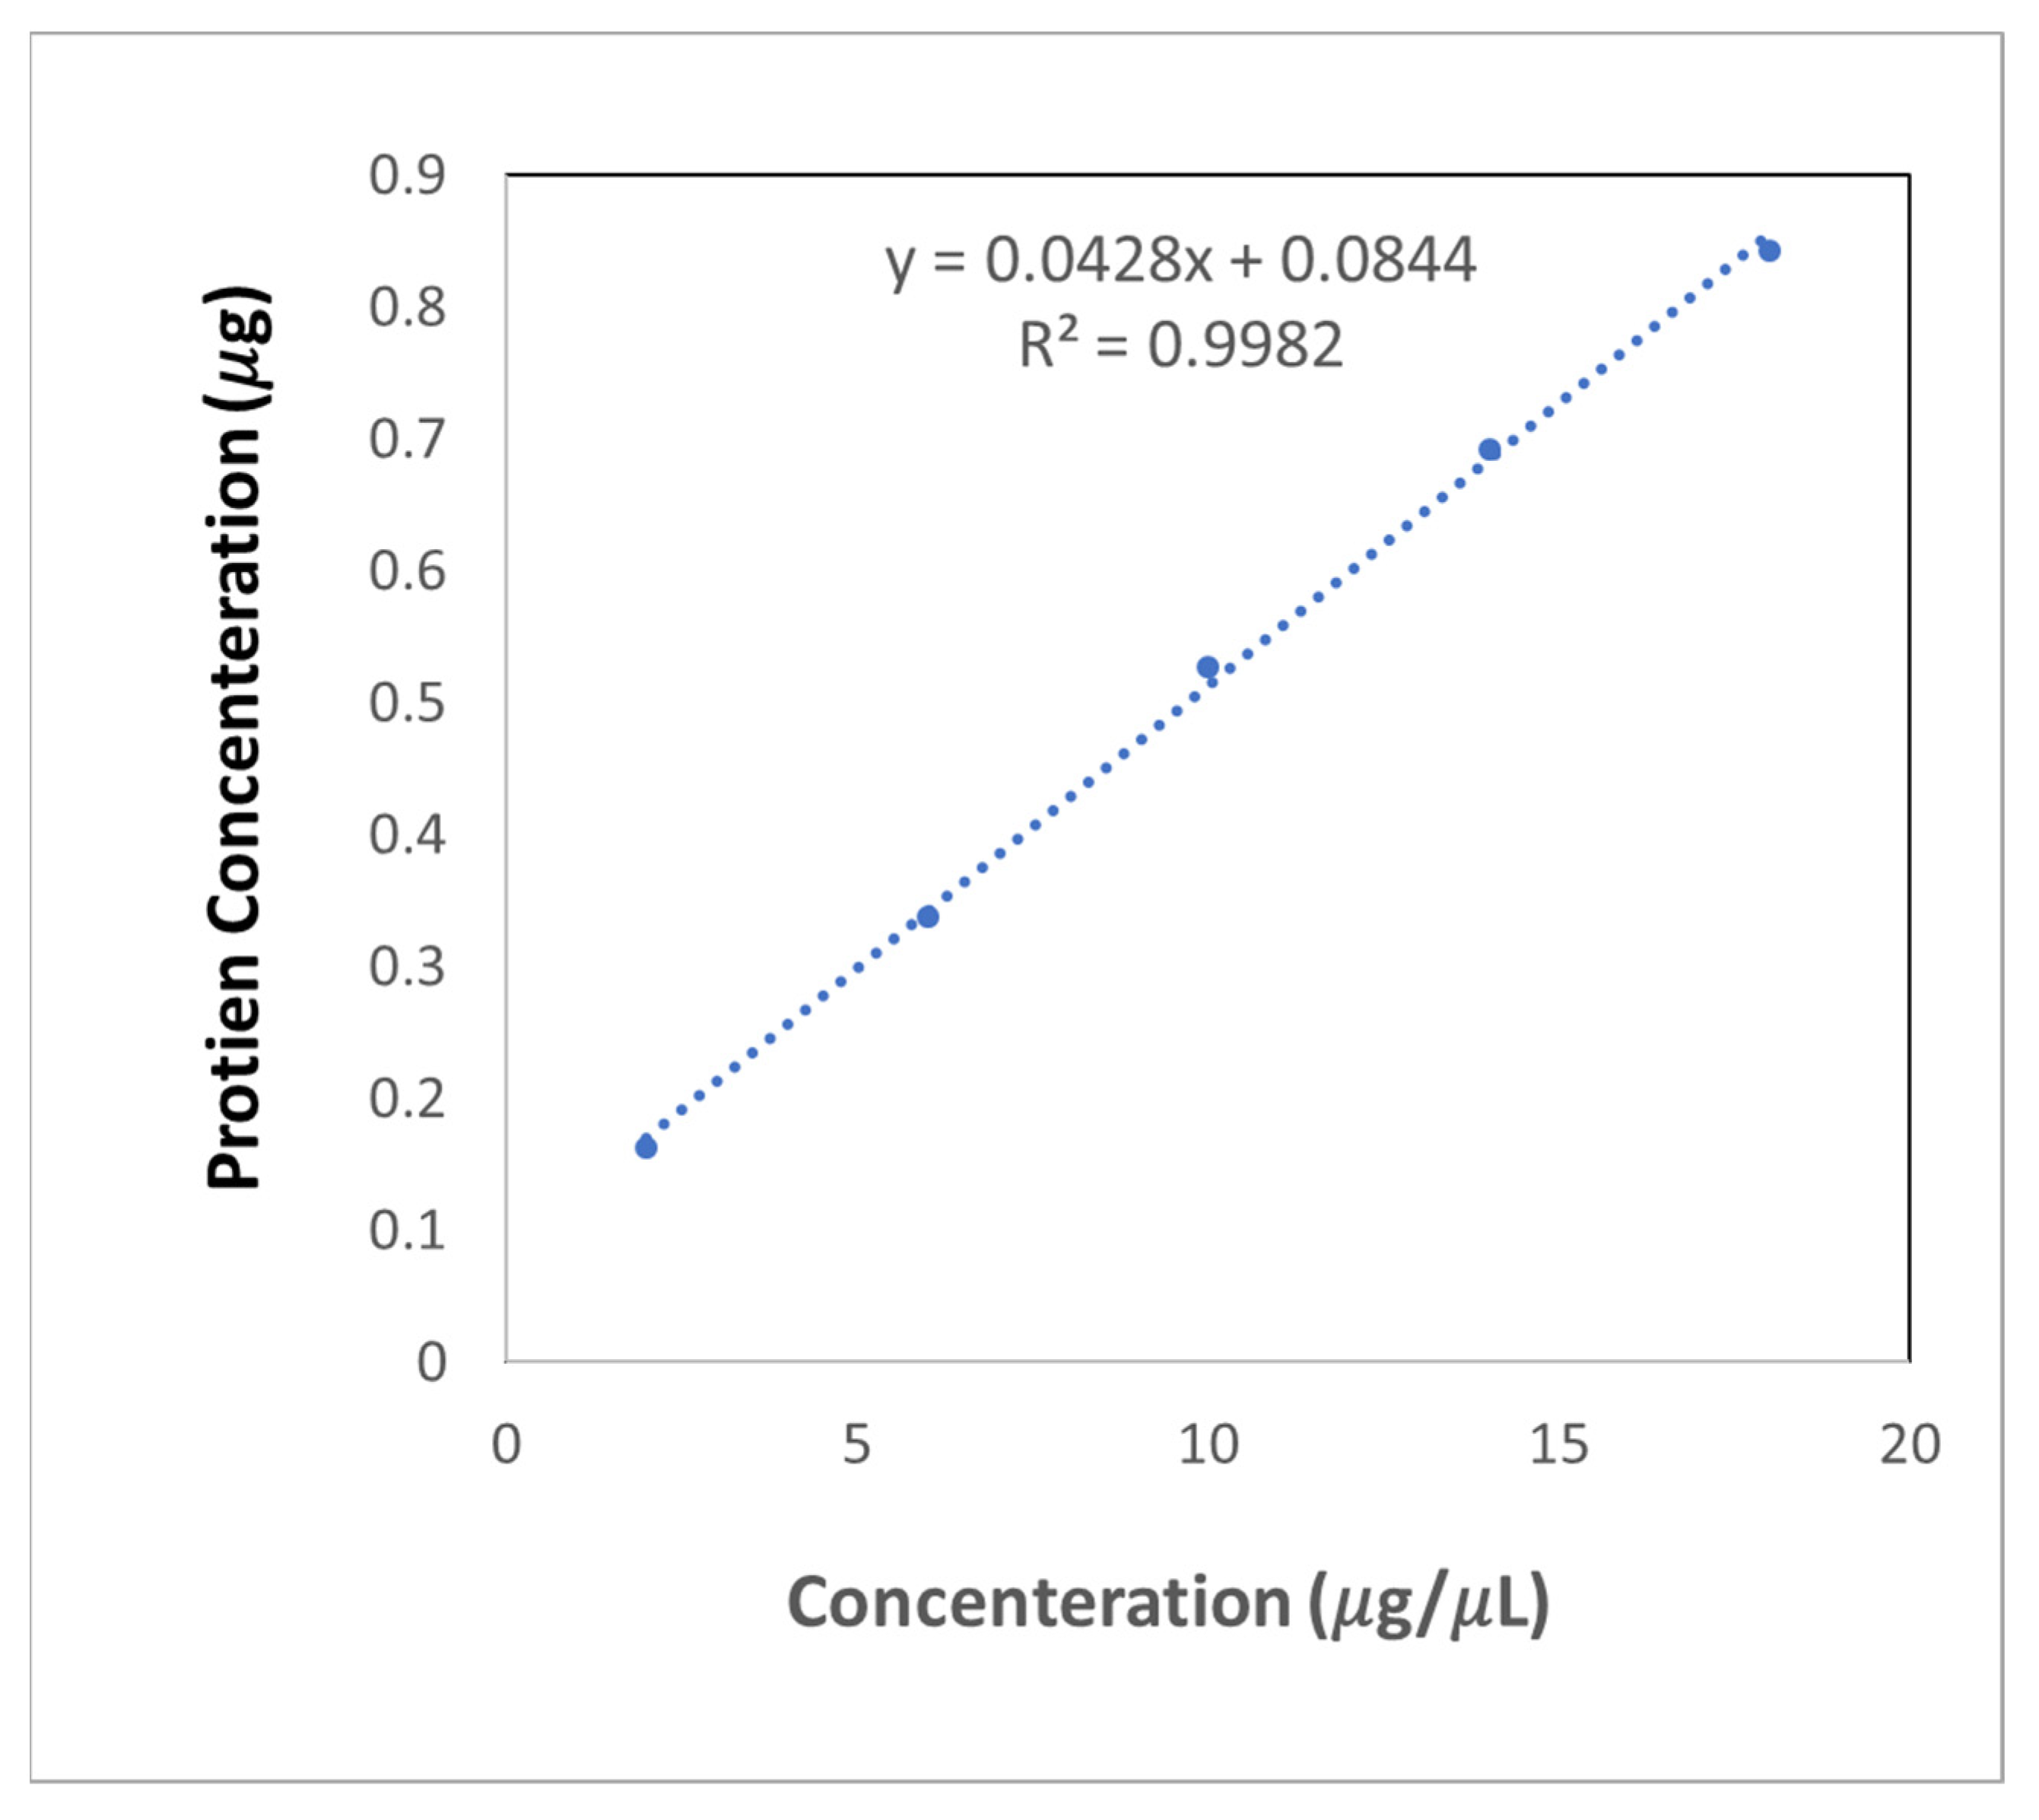
| A | BSA0 | 0 | 0.085 | 0.085 | 0.094 | 0.088 |
| B | BSA1 | 2 | 0.257 | 0.253 | 0.245 | 0.252 |
| C | BSA3 | 6 | 0.438 | 0.417 | 0.422 | 0.426 |
| D | BSA5 | 10 | 0.621 | 0.643 | 0.582 | 0.615 |
| E | BSA7 | 14 | 0.770 | 0.775 | 0.796 | 0.781 |
| F | BSA9 | 18 | 0.936 | 0.922 | 0.933 | 0.930 |
| G | EXO1 | 2 | 0.253 | 0.280 | 0.269 | 0.267 |
| Treatment Time | Average Pore Size (nm) |
|---|---|
| 5 min | ~116 |
| 7 min | ~135 |
| 10 min | ~308 |
| 18 min | ~330 |
Publisher’s Note: MDPI stays neutral with regard to jurisdictional claims in published maps and institutional affiliations. |
© 2022 by the authors. Licensee MDPI, Basel, Switzerland. This article is an open access article distributed under the terms and conditions of the Creative Commons Attribution (CC BY) license (https://creativecommons.org/licenses/by/4.0/).
Share and Cite
Al Mannai, A.; Al-Ansari, T.; Saoud, K.M. Quantification of Serum Exosome Biomarkers Using 3D Nanoporous Gold and Spectrophotometry. Sensors 2022, 22, 6347. https://doi.org/10.3390/s22176347
Al Mannai A, Al-Ansari T, Saoud KM. Quantification of Serum Exosome Biomarkers Using 3D Nanoporous Gold and Spectrophotometry. Sensors. 2022; 22(17):6347. https://doi.org/10.3390/s22176347
Chicago/Turabian StyleAl Mannai, Amera, Tareq Al-Ansari, and Khaled M. Saoud. 2022. "Quantification of Serum Exosome Biomarkers Using 3D Nanoporous Gold and Spectrophotometry" Sensors 22, no. 17: 6347. https://doi.org/10.3390/s22176347
APA StyleAl Mannai, A., Al-Ansari, T., & Saoud, K. M. (2022). Quantification of Serum Exosome Biomarkers Using 3D Nanoporous Gold and Spectrophotometry. Sensors, 22(17), 6347. https://doi.org/10.3390/s22176347