1. Introduction
Epilepsy is the second most common neurological disease, affecting around 0.5% of the population worldwide [
1]. Treatment with adequately chosen antiseizure drugs allows for adequate control in up to 60% of patients, but the remainder have persisting and frequently disabling seizures (drug-resistant epilepsy, DRE) [
2]. For a minority of those patients, resective surgery is a safe and effective option, but a substantial number of patients do not achieve long-lasting remission [
3]. Moreover, many patients with DRE are not suitable candidates for cortical resections due to overlapping eloquent cortex or multifocal seizure onsets. Neurostimulation is often considered in these patients, including vagal nerve stimulation or deep brain stimulation (DBS). For adults with focal DRE, the DBS of the anterior nucleus of the thalamus (ANT) is an established approved treatment [
4].
The ANT has long been considered a suitable DBS anatomical target for patients with refractory epilepsy, due to its therapeutic action on the interruption of seizure spread [
5,
6,
7,
8]. The ANT is in the superior region of the thalamus and is separated from the rest of the thalamus by the anterior medullary lamina. It consists of three subnuclei designated as anteroventral (AV), anterodorsal (AD) and anteromedial (AM) nuclei [
9]. After the first ANT-DBS surgery performed by Cooper and Upton in 1980 [
10,
11,
12], several studies have reported the therapeutic efficacy as well as the safety of this procedure [
13,
14,
15,
16,
17,
18]. The larger-scale multicenter trial, the SANTE trial, has reported a seizure reduction of 56–69% [
19,
20].
It is generally accepted that stimulation of the ANT is more effective compared to stimulation outside this region, since lead locations deviating from the target region (the AV nucleus) have been related with poorer surgical outcomes [
21,
22]. Furthermore, it is known that changes in stimulation parameters (current voltage, pulse width, frequency and stimulation cycling) produce a minimal effect compared with the choice of the active contact selection [
21,
22]. This highlights the importance of an accurate identification of the precise location of stimulation.
The identification of the DBS target relies on the visualization of anatomical structures in magnetic resonance imaging (MRI), which can be performed indirectly or directly [
21]. In the indirect methodology, the target is defined in the brain atlas using common landmarks, such as the anterior and posterior commissures; the direct method can be performed using 3T MRI techniques [
23], which allow for the direct visualization of white-matter structures involving the ANT, such as the external medullary lamina (EML), the internal medullary lamina (IML) and the mammillothalamic tract (MMT) [
23,
24]. However, both methods present some disadvantages: the indirect method is limited due to anatomical variations of the target structure in the stereotactic space between individuals [
23,
24]; the direct method, on the other hand, requires advanced imaging techniques, which may be limited in some DBS centers [
23].
Several studies have investigated the potential of complementary methods in the guidance of the target identification, such as the analysis of single-unite (SU) recordings during DBS [
21,
24,
25,
26,
27]. Hodaie et al. were the first to describe the electrophysiological properties of SU signals from the ANT of anesthetized patients during DBS along transventricular trajectory. They found bursting activity characterized as low-threshold calcium spikes (LTS), which were mostly observed during sleep [
25]. Later, Schaper et al., found the same pattern using an extraventricular trajectory to the ANT [
27]. The same result was also reported by Mottonen et al. [
28]. Considering both trajectories, the same authors showed that SU signals were able to distinguish between the ANT from the ventral anterior nucleus [
28]. In all these studies, an increase in the firing rate was found at the entrance of the ANT, and a decrease was found when exiting this structure. Despite these advances, it is still unknown whether there is a relation between the neuronal firing properties of the ANT and the clinical DBS outcome in epilepsy [
27,
28]. On the other hand, LTS bursts were not specific to ANT, since they were also found in other structures, such as the circularis and dorsomedial nucleus of the thalamus [
27]. This highlights the need to find new methods that can complement the existing techniques for DBS targeting.
Local field potentials (LFPs) can be recorded by DBS leads and reflect the synchronous pre- and postsynaptic activity of neural populations [
29,
30,
31,
32,
33,
34]. Unlike SU recordings, LFPs can detect focal network rhythms and can be recorded both intra and extraoperatively [
35]. Temporary recordings of LFPs can be performed by externalized DBS leads (e.g., [
36]), but this recording type presents disadvantages, such as the tome restriction of recording, the influence of microlesions provoked by the oedema around the lead [
37] and the increased risk of infection [
38]. Recently, the Medtronic company (Medtronic Inc. (Dublin, Ireland)) launched a new neurostimulator device, the Percept
TM PC, which can record LFPs at the same time it stimulates, whether the patient is in the hospital or not (UC202013078EE©Medtronic2020). Compared to the previous systems (e.g., the Active TM PC+S), the Percept
TM PC system has longer battery life and is also able to stream data continuously in real time, as well as to correlate data with patient logged events.
To understand the potential role of DBS-LFPs for DBS targeting, a literature survey in PubMed and Web of Science was conducted, following the keywords (“Percept
TM PC” [tiab] or “Activa
TM PC+S” [tiab] and “Local Field Potentials”). A total of 12 human-based studies were found [
39,
40,
41,
42,
43,
44,
45,
46,
47,
48,
49,
50]. These studies are summarized in
Table 1. Most of them research and report biomarkers of motor fluctuations in Parkinson’s disease (PD). These biomarkers can be found by extracting features from LFPs. The most common type of features can be categorized into spectral (features extracted in the frequency domain reflecting potential fluctuations associated with neural activity); morphological (features describing the signal morphology); statistical (features describing signal variance distribution) and multivariate (features that capture correlations between channels) [
51]. For PD, LFP power density was the most frequent feature extracted since beta activity has been seen to correlate with PD symptoms. Regarding epilepsy, no study was found. Moreover, none of these studies focus of the study of LFPs in the optimization of DBS targeting.
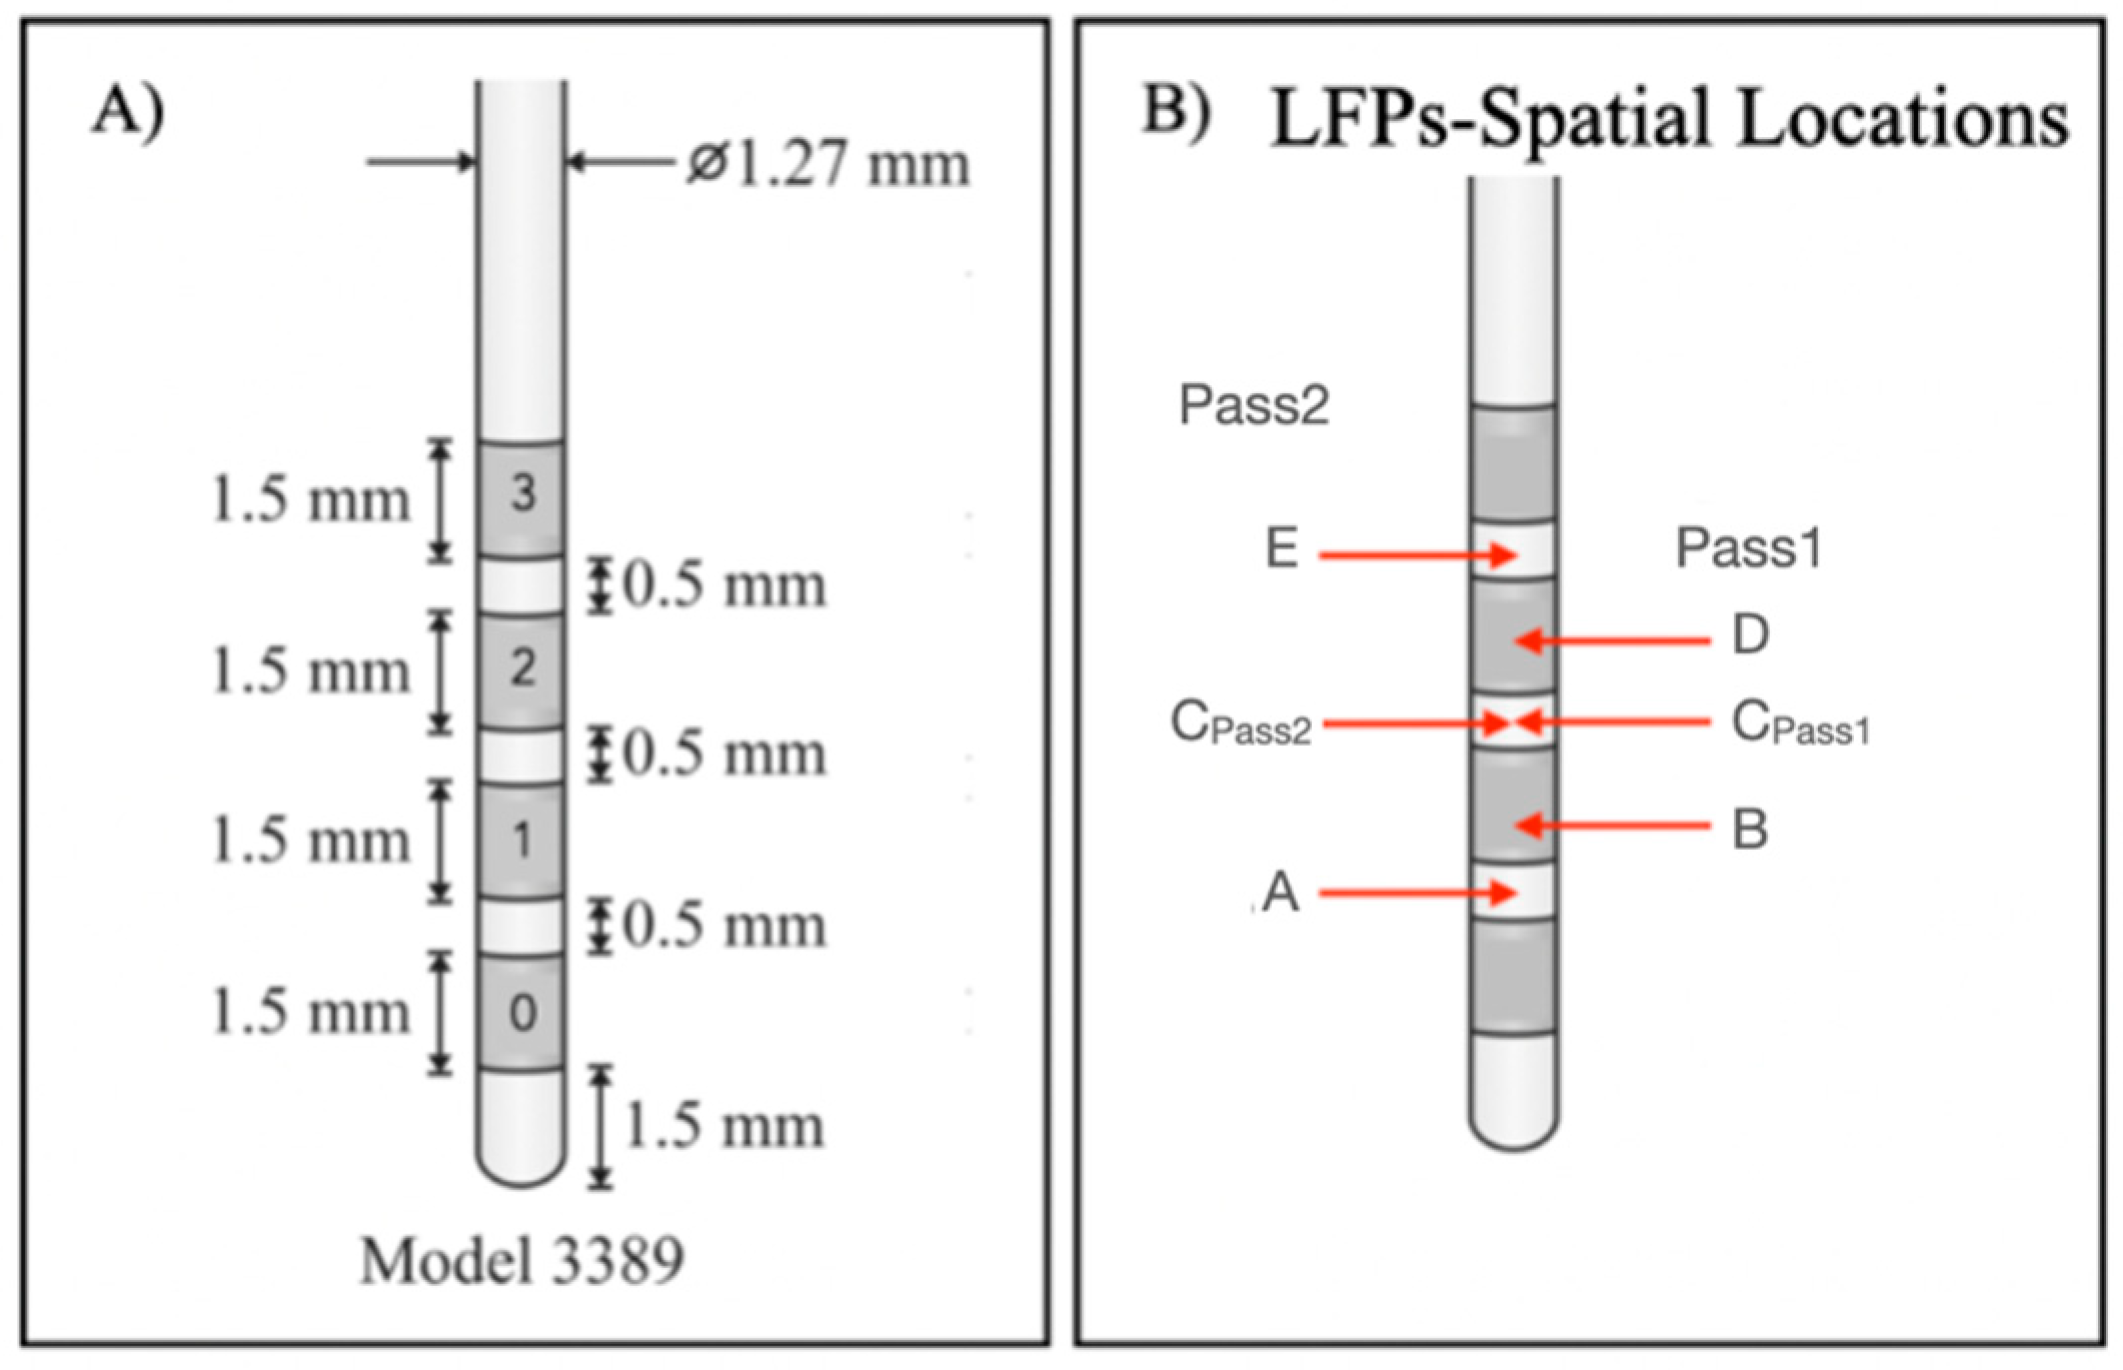
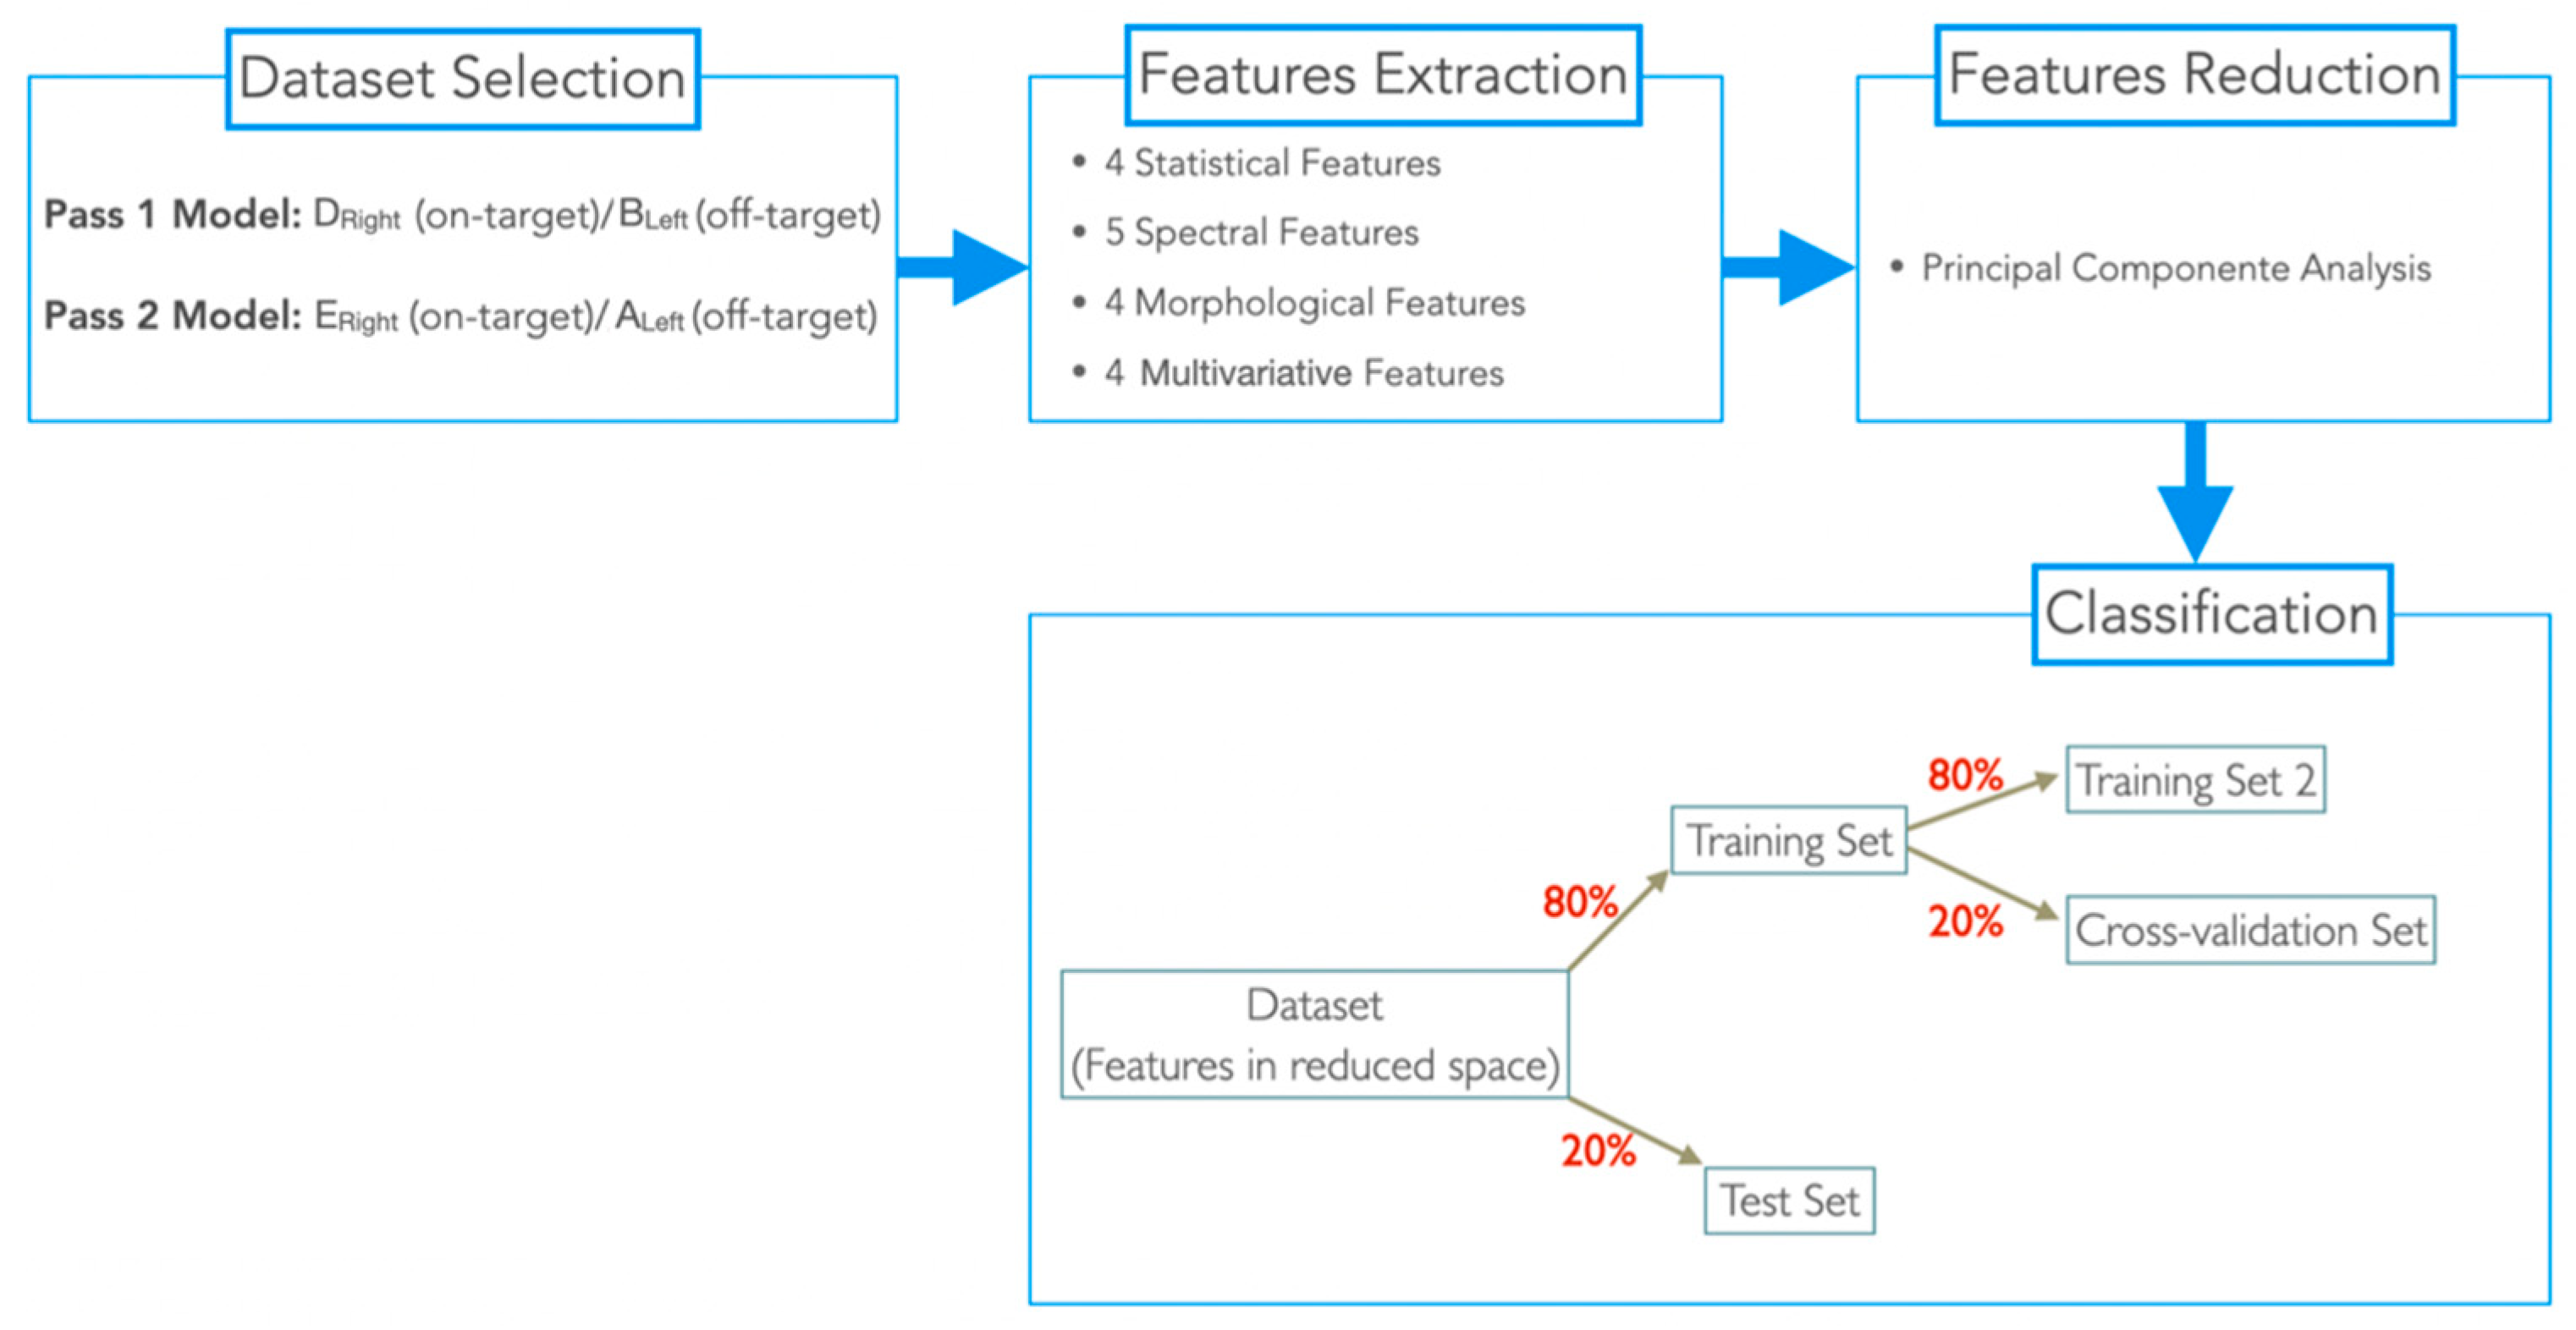
In this work, we aimed to study whether ANT-LFPs recorded extraoperatively can be an asset in the identification of DBS target structures, to complement structural imaging approaches, making its joint usage a swifter and more reliable procedure. For this purpose, LFP signals were recorded from a single epilepsy patient, who stayed at an epilepsy monitoring unit (EMU) for 5 days, for simultaneous video-electroencephalography (vEEG) and Percept PC-LFP recordings. From time-domain LFP signals recorded during periods with no stimulation, 17 features were extracted and then integrated into two machine learning (ML)-based methodologies, developed to identify which led contacts (in both hemispheres) show a “signal-signature” of the ANT target. This paper aims to present the processing and classification methodology and discuss the results and their capability to support neurosurgeons to use LFPs an surrogate marker of the AV nucleus position. To the best of our knowledge, we present the first-ever study to use multichannel LFP signals, collected months after electrodes’ implantation (already out of the influence of the microlesion effect), to identify the best-targeted contacts of the implanted electrodes.
4. Discussion
Both classifiers (Pass1 and Pass2) classified the two class groups (in-target and out-target signals) with an average accuracy of 80%. Specificity, which quantifies the effectiveness of classifiers to identify correctly negative class labels (i.e., non-target signals), was also similar for both classifiers (70%, in average). Sensitivity, which classifies the effectiveness of classifiers to classify correctly positive class labels, i.e., target signals, was higher for the Pass2 classifier than Pass 1 (100% against 81.82%). Therefore, we considered that the Pass2 classifier had high performance, which was expected since spatial locations in Pass2 signals are closest to LFP channels.
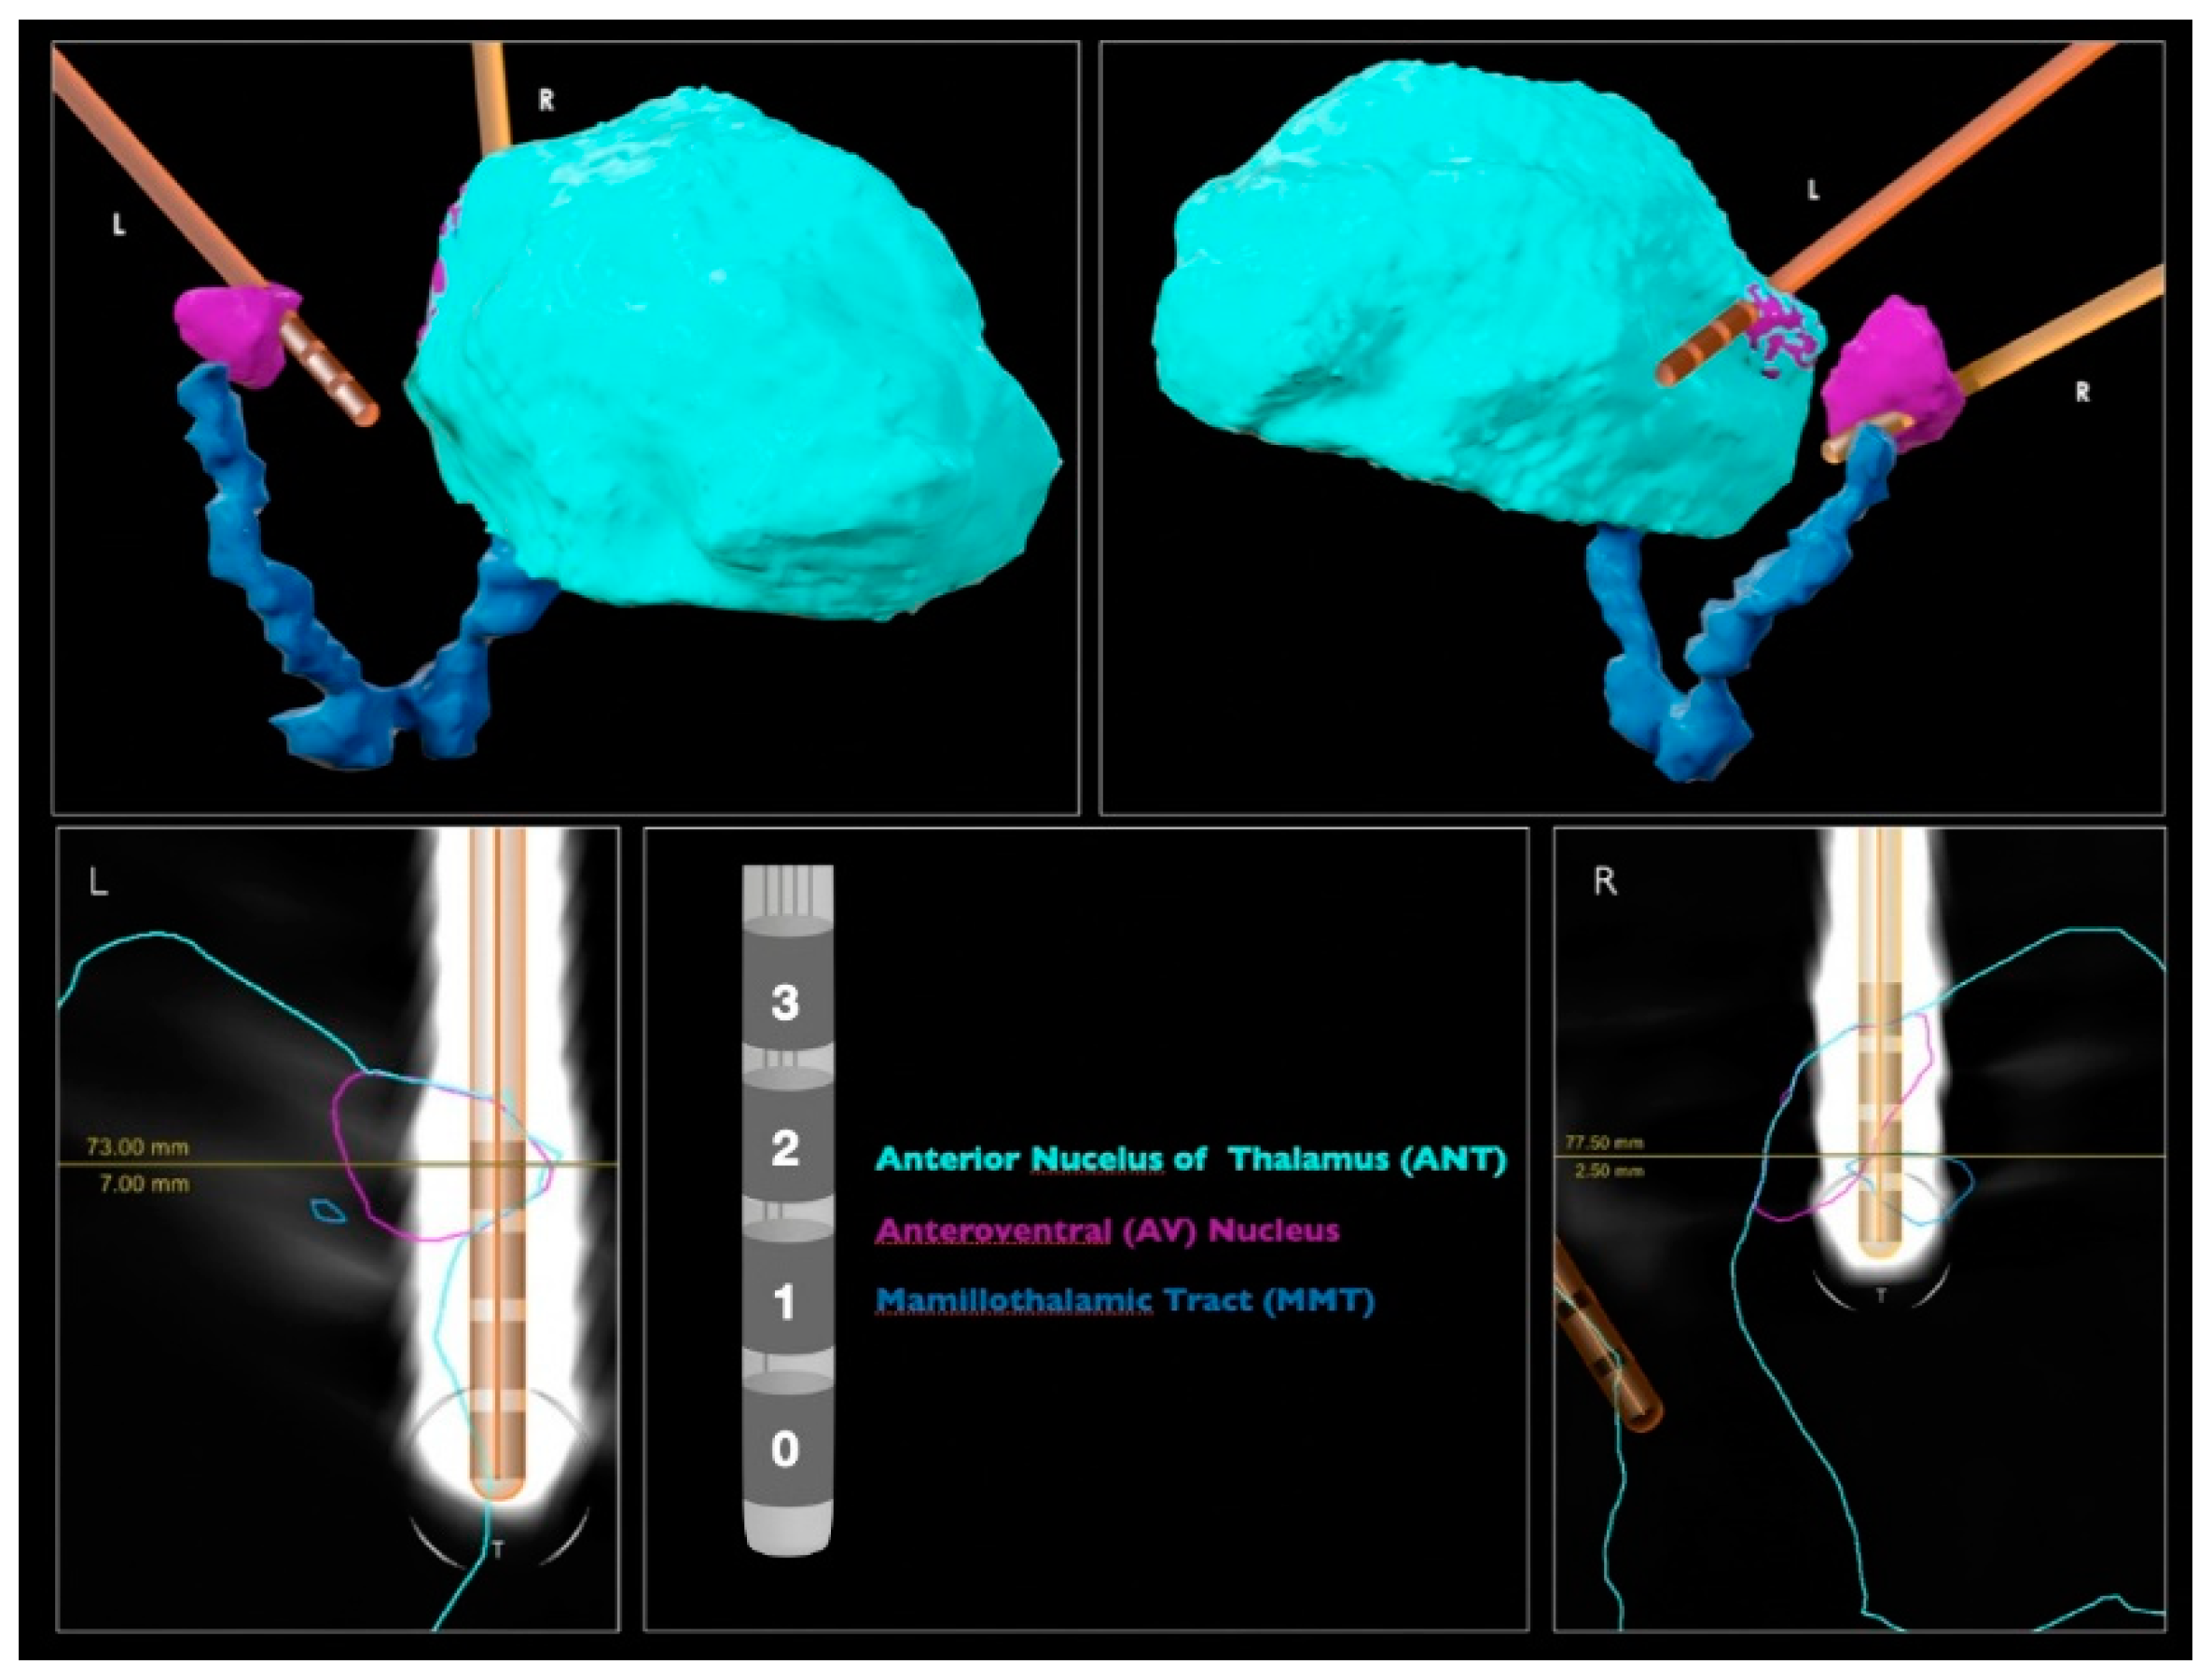
The Pass1 classifier identified spatial locations completely outside the target (−) as 40% of the target; physical locations marginally in the target (+) as 50%; physical locations partially but not completely inserted in the target (++) as 50–70%. The spatial location completely inserted in the target (+++) was used as a classifier class label. Since the classifier results increased with the degree of involvement of each spatial location to the target, the Pass2 classifier predictions seem to agree with the medical imaging results (
Figure 1).
The Pass2 classifier identified spatial locations completely outside the target (−) as 50% of the target; spatial locations marginally in the target (+) as 60%; spatial locations partially but not completely inserted in the target (++) as 50%. The spatial location completely inserted in the target (+++) was also used as a classifier label. These predictions seem to be worse than those obtained with the Pass1 classifier, since DLeft (+) was classified to be more target percentage than CRight (++).
The target percentage of spatial locations used as class labels for each classifier were predicted by the opposite classifier (
Table 5). Pass1 classified A
Left as 50% (which agrees with other predictions made by his classifier) and E
Right as 60% (higher target percentage obtained than other (++) spatial locations); The Pass2 classifier classified B
Left as 60% (higher target percentage than other (+) spatial locations) and D
Right as 60% (the same order of magnitude as other (++) predictions). Therefore, the Pass1 classifier seems to predict better Pass2 spatial locations than the opposite situation. This result was expected since spatial locations of nonadjacent channels include those for adjacent channels. Note that we considered Pass1 and Pass2 signals from different natures, since distance between channels and their midpoints vary according to the bipolar montage used. However, the only way to obtain a quantitative evaluation of the target prediction of spatial locations used to build each classifier is to use the opposite classifier. This is a limitation of the proposed methodology.
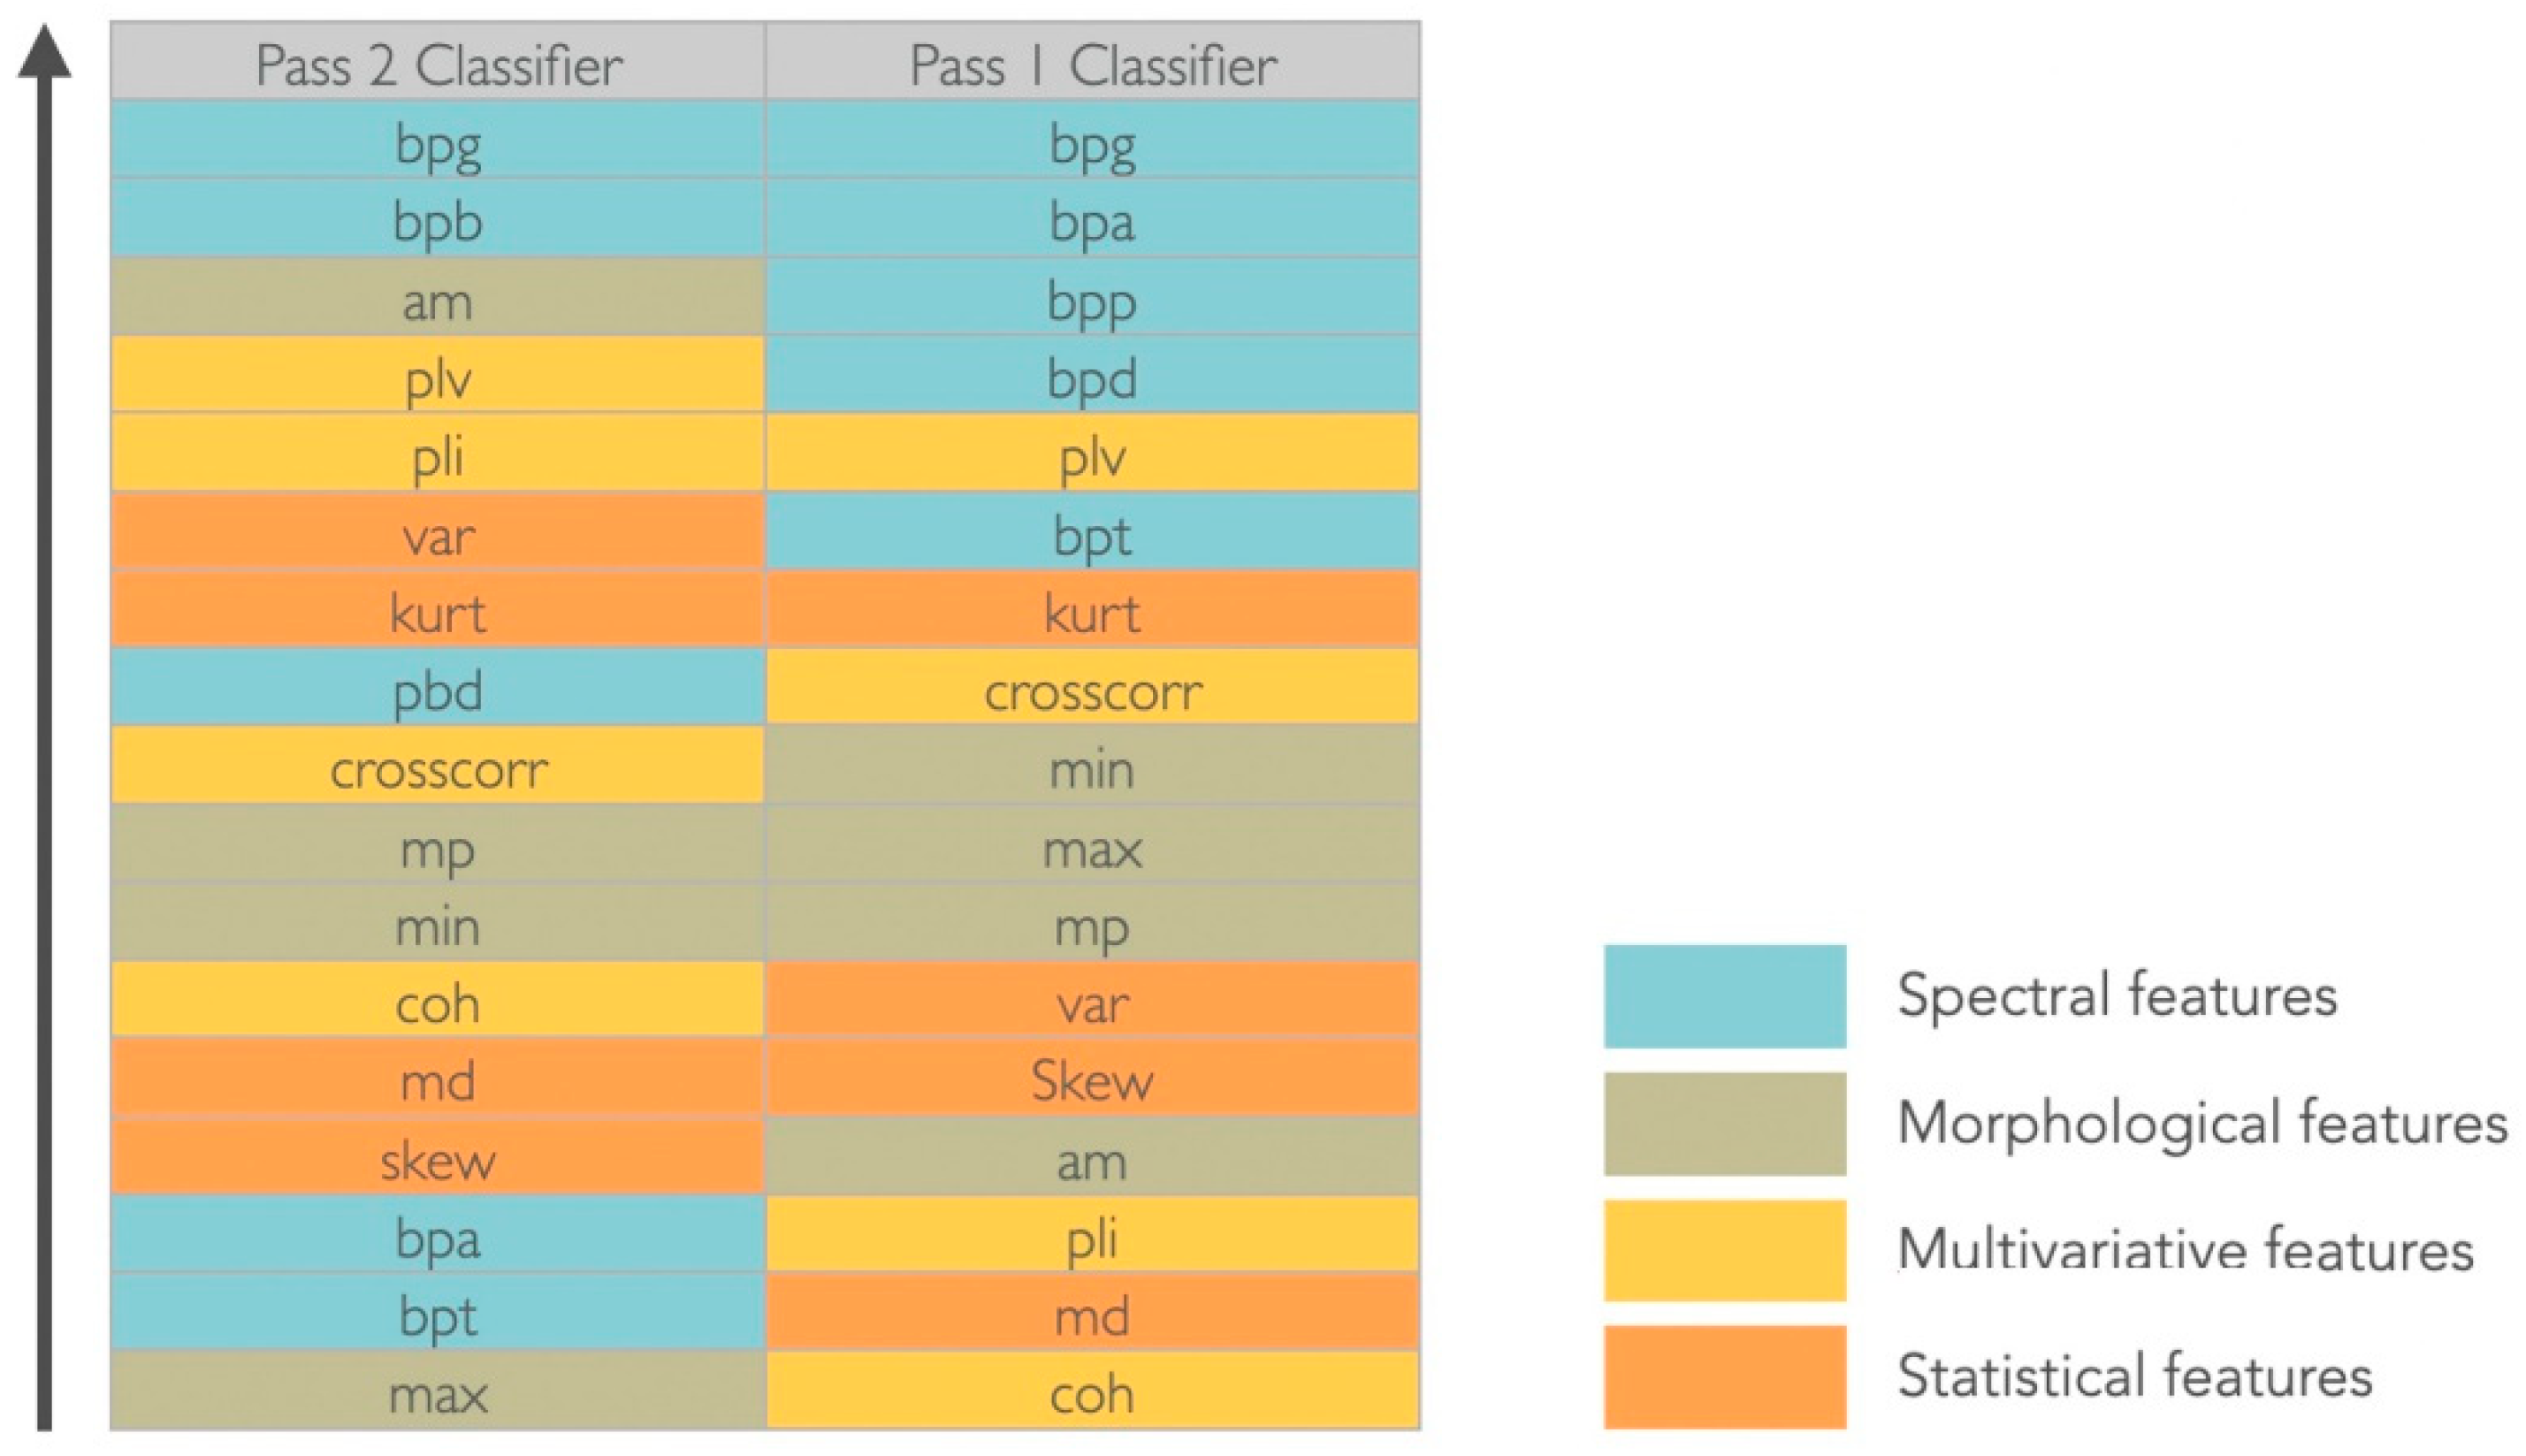
The gamma band power (30–100 Hz) was considered the most significant feature to discriminate between target and non-target signals in both montages and for the considered dataset (
Figure 4). For the Pass2 classifier, the alpha band power (8–13 Hz) was equally relevant, whereas for the Pass1 classifier, all spectral features were considered discriminative. Considering morphological features, in the Pass2 classifier only the average mean had discriminative power; mean peaks and minimum values had middle discriminative power and the maximum value was the less discriminative. For the Pass1 classifier, morphological features were medially discriminative. Considering statistical features, variance and kurtosis seem to have good discriminative power for the Pass2 classifier, whereas for the Pass1 classifier only kurtosis appeared to have middle-range discriminative power. Considering multivariate features, the phase locking value had good discriminative power and cross-correlation was medially discriminative power in both classifiers. The phase lag index also discriminated well the two classes for the Pass2 classifier, and coherence had middle discriminative power. For the Pass1 classifier, phase lag index and coherence were not good features to discriminate between two classes.
5. Conclusions
In this work, we extracted 17 features from off-stimulation time-domain LFPs, recorded from one patient; and two ML-based methods, designed to identify which lead contacts presented a “signal signature” of the ANT target, the anteroventral (AV) nucleus. These methods were designed using different LFP bipolar montages: Pass1 (nonadjacent channels) and Pass2 (adjacent channels). After the best classification model for each dataset was identified, we obtained an accuracy of 76.62% for the Pass1 classifier and 83.33% for the Pass2 classifier. Then, we used both classifiers to predict the target percentage of all possible spatial locations, with the aim of identifying which contacts (in the left and right hemisphere) were closer or inserted to the target, and consequently, should be chosen for chronic stimulation.
We found that the spatial location E
Left had highest target percentage in the left hemisphere and spatial locations D
Right and E
Right in the right hemisphere. Converting spatial locations into channels (
Table 2), we concluded that LFP signals from 2–3 L and 2–3 R and 1–3 R channels may present higher ANT target signatures. These results agree with those obtained by clinical images (
Figure 1).
We concluded that the Pass1 and Pass2 classifiers were able to predict ANT target signatures for this patient. These results may be useful in support of the early selection of the best stimulation electrode, avoiding the trial-and-error process that usually takes place in the months after the implantation. To the best of our knowledge, we presented the first-ever study using multichannel LFPs collected months after the electrodes’ implantation (already out of the influence of the microlesion effect) in the guidance of the DBS target identification. However, further studies should be carried out in the future, with a larger number of patients, to validate this result.


 ,
, 


