Article

Development of Prediction Models for Soil Nitrogen Management Based on Electrical Conductivity and Moisture Content

1
Department of Farm Machinery & Power Engineering, College of Agricultural Engineering and Technology (COAE&T), Punjab Agricultural University (PAU), Ludhiana 141004, India
2
Division of Agricultural Engineering, Indian Council of Agricultural Research-Indian Agricultural Research Institute (ICAR-IARI), New Delhi 110012, India
3
Centre for Protected Cultivation Technology, Indian Council of Agricultural Research-Indian Agricultural Research Institute (ICAR-IARI), New Delhi 110012, India
4
Precision Agriculture Extension, Raven Precision Agriculture Center, South Dakota State University, Brookings, SD 57007, USA
5
Division of Agronomy, Indian Council of Agricultural Research-Indian Agricultural Research Institute (ICAR-IARI), New Delhi 110012, India
*
Author to whom correspondence should be addressed.
Sensors 2022, 22(18), 6728; https://doi.org/10.3390/s22186728
Submission received: 21 March 2022 / Revised: 18 April 2022 / Accepted: 18 April 2022 / Published: 6 September 2022
(This article belongs to the Section Environmental Sensing)

Abstract

:
A study was conducted with the goal of developing an algorithm for use in sensors to monitor available soil N. For this purpose, three different soils were selected. The soils were studied for electrical conductivity (EC) at four different moisture levels and four levels of N. The selection of moisture levels was based on optimum moisture levels between tillage moisture and field capacity. The results revealed a significant relationship between electrical conductivity and moisture level of the soil as well as between electrical conductivity and soil N content. Based on these relations, a polynomial model was developed between the EC of each selected soil sample and moisture content as well as N levels. The regression model for moisture content-based EC determination had coefficients of determination of 0.985, 0.988, and 0.981 for clay loam, sandy loam, and sandy loam soils, respectively. Similarly, the regression model for N content-based EC determination had coefficients of determination of 0.9832, 0.9, and 0.99 for clay loam, sandy loam, and sandy loam soils, respectively. An algorithm developed using a polynomial relationship between the EC of each selected soil sample at all moisture and N levels can be used to develop a sensor for site-specific N application.

1. Introduction

As awareness of the need to reduce the use of costly inputs in precision farming has increased, the field of precision agriculture has also begun to draw the attention of planners, researchers, and users. Precision farming may be defined as an accurate application of agricultural inputs for crop growth considering relevant factors such as soil, weather, and crop management practices [1]. More specifically, it is an information and technology-based farming system where inputs are managed and distributed on a site-specific basis for long-term benefit. The concept of precision agriculture was developed in the 1990s and initially referred to the application of technologies that allowed for site-specific (spatial) management in a field-scale crop production context. Zhang and Kovacs [2] refer to precision agriculture as “the application of geospatial techniques and sensors to identify variations within a field and the solution to smooth the difference using diverse strategies”. Precision farming helps farmers to maximize the effectiveness of inputs. The major aims of precision agriculture technologies are to increase the profitability of crop production, improve product quality, and protect the environment, via site-specific management of agricultural inputs.
Variability in field conditions is one of the major contributors to field-scale differences in yield; therefore, varying agricultural inputs according to crop requirements could be beneficial. As such, information with respect to the variability of different soil attributes in the field is mandatory for any decision-making process. The ability to generate such information accurately at an affordable cost is a significant limitation in precision agriculture today. Fertilizer is both one of the major input costs for farmers and a source of great variability in the field. N available to plant roots in the soil is the main factor limiting the yield of crops. Variable rate application of fertilizers without accurate soil maps is often inappropriate and may result in economic losses. Hence, sensor development is expected to increase the effectiveness of variable application of fertilizers. Measurement of soil properties with the use of sensors has the potential to provide benefits at a relatively low price [3]. Fertilizer requirements vary within a field and in different cropping seasons based on the soil type, climate, and crops grown during previous years. Fertilizers are either expensive or their efficiency is limited based on the availability of water, especially in semi-arid and semi-humid zones. N is the main fertilizer being applied by farmers; therefore, improving N use efficiency is vital. To manage N fertilizer rates, it is essential to consider the organic N mineralized and soil inorganic N in crop development period [4]. In order to enhance crop productivity by controlling the N fertilizer rate, it is necessary to determine the exact N mineralized amount in soil organic matter (SOM). Soil mineral N measurement in real time is very difficult to achieve, as N is available to crop in the form of both nitrate (NO3) and ammonium (NH4+) in soil [5,6]. Crops use different forms of N in soils; inorganic forms of N consist of nitrate, nitrite, and ammonium. Nitrate is the main form of N in many aerated soils; however, ammonium can be the main form in several acidic and/or anaerobic soils [7]. To improve the efficiency of crop production systems, affordable, reliable, and easily executable methods to measure the available mineral N in the top 0.90 m of soil need to be developed [8]. Aerobic incubation is one feasible way to predict the approximate amount of mineral N in soil; however, this takes a long time and only works in a fixed condition [9,10]. This technique is used to identify the capability of conversion of soil organic N to mineral, and to specify the feasibility of mineralizable organic N. This is the unstable N supply deemed to be a normal prediction of probable mineralization in soil and indicates the rate of N which is feasible to be mineralized [11,12].
Martínez and Galantini [10] conducted an experiment over an extended period of time to estimate organic N mineralization through a fast and simple approach using several chemical and biological procedures. However, laboratories reject the use of these procedures on soils as they require a long period of time to implement. For different soil monitoring techniques, organic indices, for instance, anaerobic incubation is critical [13,14]. In chemical procedures, the idea is that a particular solvent removes N from a pool. However, in these procedures, it is not essential for the removed N to be chemically homogeneous or biologically significant [12]. To evaluate the soil N mineralization, digestion of soil with a high salt can be applied [15]. Nevertheless, chemical approaches may have detrimental impacts on the environment and lack the potential to simulate the function of microorganisms [16].
In adjusting N-dynamics, the organic component of soil and its labile portions play a significant role in determining available N for plants and N mineralization [14,17]. Mineralization of the organic component of soil mainly increases N availability of soil and meets between 50 and 80% of plants’ N requirements [12,18]. The upper layer of soil is considered to have the highest soil organic N, i.e., about 95% of the overall N [19]. The soil organic N moves in the soil over ground crop litter and root litter as particulate organic matter [14]. The particulate organic matter may offer further precise details on N mineralization as it includes simply mineralizable N portions. This portion characterizes the mineralizable pool and it offers a simple and feasible way to estimate the N mineralization capacity [14]. Haynes [20] stated that particulate organic matter is a significant labile N pool in numerous soils. Nevertheless, residue input and climate situations have a strong impact on the decomposition of this labile portion [14], which changes over years in semi-arid and semi-humid regions.
There is significant uncertainty regarding the function of mineralization indices or SOM portions in the N-cycle, and they have not been confirmed as a soil measurement technique to identify N [11]. In contrast, the N mineralization could be influenced by the chemical and physical characteristics of the soil [12]. Nevertheless, our skill to estimate N mineralization may be enhanced by recognizing their role, as well as by studying their interactions with other soil characteristics in the N-cycle. Therefore, the estimation of N mineralization in various soils could be enhanced by incorporating these characteristics in multiple regression (MR) models [11,21]. Several investigations have linked soil characteristics and climate situations to N mineralization [21]. The precision of estimation of potential N mineralization could be enhanced by merging SOM portion and soil characteristics in MR models [21,22,23]. Nevertheless, several researchers [11,24] have stated that there is a potential cause of multicollinearity between the model’s factors, and that the biological logic of variables in their mineralization procedure may be complicated by applying MR. One technique to address the multicollinearity and specify the interaction of all variables in various dimensions is to apply a statistical method that can categorize very correlated parameters into meaningful data and can be applied as a new category of independent variables [24]. Currently, there are some related investigations via associating of N mineralization indices, labile organic portions, and soil characteristics by involving two or more variables in analyses. Moreover, to estimate the potential N mineralization, this statistical analysis incorporates multivariate methods such that the major soil parameters contributing to model fit can be specified [11,25,26]. Furthermore, Martínez-Lagos et al. [18] stated that enhancing suitable fertilization approaches requires having data on the cycling and the size of the inorganic-N pool.
Several studies have been conducted on soil sensors development and enhancement methods in order to measure soil properties [27,28,29,30,31,32,33,34,35]. The mechanism of these approaches was built on electronics, mechanics, and chemistry aspects of the soil [36,37,38]. Chighladze et al. [39] studied two sensors (ECH2O EC-5 and EC-10) to evaluate their response on availability of different concentrations in soil (e.g., NO3, Cl). Their results revealed that the sensor’s response to difference rates of NO3 were more sensitive than variations in Cl. Furthermore, they stated that high-frequency and low-frequency assessments can be applied to evaluate soil moisture content and some concentrations in soil (e.g., salinity and different ions), respectively.
To monitor changes in soil physical and chemical properties, soil EC maps can be utilized [40]. Many studies have highlighted the inevitable relationship between soil EC with changes in soil physical and chemical properties, and crop productivity [41,42,43,44,45,46,47,48,49,50,51,52,53]. Grisso et al. [54] stated that soil characteristics are correlated with soil EC. They specified that soil cation exchange capacity (CEC), topsoil depth, salinity, texture, organic matter, pH, and moisture content have an influence on soil EC. Furthermore, soil EC maps can be applied for precision agriculture decisions and site-specific crop management. Zhang and Wienhold [55] studied the impact of changes in soil moisture content on EC, soil mineral N, and pH in a research laboratory condition. The study reported that an increase in soil moisture level in the range of 0–0.008 m3 resulted in an increase in soil NO3 N, however, increasing soil moisture above this level did not result in variation in NO3 N but raised NH4+ N. There was no variation in soil pH with respect to increased soil moisture. The study found a positive correlation (with a portable EC sensor, R2 = 0.85; in the laboratory as 1:1 soil water slurries R2 = 0.92) between soil EC and soil mineral N. Authors recommend using soil EC for quick identification of variations in soil inorganic N rate in soils with lower salt and carbonate-free conditions.
Recently many investigators have attempted to develop EC sensors and to enhance techniques for soil EC measurement [56,57,58,59]. They have used EC sensors to monitor soil properties due to their easy and fast soil measurement. For instance, EC sensors have been used to monitor soil salinity, estimate plants’ water requirements, and improve irrigation systems [60,61]. An EC sensor was used to evaluate the impacts of existing waste on soil chemical properties and crop development [62,63]. It is also feasible to monitor some soil characteristics and the spatial distribution of clay using soil EC [64]. Therefore, soil electrical conductivity can be used for site-specific management by categorizing areas with close soil properties faster and more inexpensively. Nevertheless, several soil properties such as moisture content, organic matter, salinity, texture, soil mineralization, density, and temperature, affect soil electrical conductivity [65,66,67,68]. Moreover, studies have demonstrated that soil characteristics with a larger impact on soil electrical conductivity should be taken into account for investigated fields [69,70]. Small and marginal farmers often face problems with variability in their fields and cannot afford costly and sophisticated methods for getting information about variability and applying input accordingly. There is a need for an innovative, smart, and cost-effective sensing system. Electrical conductivity-based soil moisture and available N sensors could potentially bridge this gap. However, a key prerequisite for this advance is a clear understanding of the interactions between EC and soil moisture, as well as between EC and available N for different soils with varying moisture levels. Thus, in view of the above, the present study seeks to address this gap in order to develop a sensor that can form the base for any type of variable rate detection using electrical conductivity for site-specific N application by exploring the relationships between electrical conductivity, moisture content, and N level for different selected soils in the field. Based on the relationships observed, an algorithm was developed for electrical conductivity and moisture-content-based soil N management.

2. Materials and Methods

The experiments in this study were conducted in two phases at the division of Agricultural Engineering, Centre for Protected Cultivation Technology, the division of Agronomy, the division of Soil Science and Agricultural Chemistry, and the division of Agricultural Physics, IARI, New Delhi. In the first phase, an experiment was carried out to characterize the soil samples in terms of soil texture. Samples from five types of soils were selected from IARI fields and Yamuna river banks to form a representative sample of all major soil types in India. These five different soil types were analyzed for their textural characteristics and, accordingly, three soil types representing a soil with maximum clay, sand, and silt content, respectively, were selected for further experimentation. Samples from these three soil types were then analyzed for their physical and chemical properties using standard methods.

2.1. Measurement of Soil Physical Properties

2.1.1. Soil Texture

Soil texture was determined using the Bouyoucos hydrometer method [71]. Two beakers were taken and one was filled with 0.050 kg of the dry soil sample. Sodium hexametaphosphate (NaPO3)6 weighing 0.100 kg was mixed with 1000 mL distilled water and 50 mL of sodium hexa meta phosphorus solution was added to the soil sample and shaken well. An amount of 100 mL of distilled water was then added and stirred and the solution was kept at room temperature for 4–5 h. The samples were then transferred to a larger cylinder and distilled water was added to each soil sample until the total volume of the solution became 1000 mL. The cylinder was shaken vigorously several times so that soil particles dispersed completely. Then, the hydrometer was immediately placed in the suspension and data was collected after 40 s. After 2 h, an additional hydrometer reading was taken. All the experiments were repeated without the soil sample, i.e., repeated with water and were denoted as blank.
The percentage of silt and clay was calculated using the following formula [72], initial reading.
percentage   of   silt   and   clay = ( Soil   sample   reading Blank   reading ) + CF weight   of   Soil   ( kg ) × 100
CF = Correction Factor = (T°F − 68) × 0.2
Second reading after 2 h
percentage   of   clay = ( Soil   sample   reading Blank   reading ) + CF weight   of   Soil   ( kg ) × 10

2.1.2. Field Capacity

A few days after wetting of the soil, when the water has drained, the volume of water maintained in the soil is the field capacity [73]. The field capacity was computed using a dash pressure extractor. Soil samples were collected in volumetric rings, which were saturated on a ceramic plate for one night. The saturated soil-filled rings were then put inside the dash pressure plate apparatus. Water was drained out of the soil by maintaining a pressure of 22 kPa in the apparatus for one week. After one week, the moisture content of the soil sample was measured using the oven drying method [74]. The resulting moisture content was the field capacity (FC).

2.1.3. Permanent Wilting Point

Permanent wilting point was evaluated by using a dash pressure extractor as was done for field capacity. Soil samples were collected in volumetric rings and were saturated on a ceramic plate for one night. The saturated soil-filled rings were then put inside the dash pressure plate apparatus. Water was drained from the soil by maintaining a pressure of 100 kPa in the apparatus for one week. After one week, the moisture content of the soil sample was measured using the oven method. This moisture content was the permanent wilting point (PWP) [73].

2.1.4. Permanent Available Water Capacity

The volume of water that can be used by crop roots is the total available water capacity [73]. Available water capacity (AWC) was calculated by subtracting the moisture content at permanent wilting point from that at field capacity.

2.2. Determination of Chemical Properties of Selected Soil Types

The chemical properties of soil, such as pH, available N and total N, organic carbon (OC), phosphorus, and potassium, were determined.

2.2.1. Soil pH

Soil pH was determined using the KCL method [75]. Fifty ml of 1 molar (M) KCL solution was poured into a beaker (100 mL capacity) filled with 0.020 kg of soil sample. Suspension was stirred for 15 min and pH was determined on a pH meter using a glass electrode.

2.2.2. Total N of soil

For determination of total N in soil, the Kjeldahl digestion method was used [76]. Organic N in the soil sample was converted to NH4-N by digestion with concentrated H2SO4 containing substances (K2SO4 or Na2SO4) that promote this conversion. The NH4+ N in the digestion was determined from the amount of NH3 liberated by distillation of the digest with an alkali (sodium hydroxide) (NaOH). Soil sample, weighing 0.005 kg which was passed through a 100-mesh sieve, was transferred to a 500 mL Kjeldahl flask. An amount of 25 mL of concentrated H2SO4 was added and allowed to stand for 30 min. Then, 0.005 kg of sodium thiosulphate was added, and it was again allowed to stand for 30 min. A catalyst mixture was added and heated in a Kjeldahl flask; at first, it was heated slowly until frothing began, and then was heated rapidly. Digestion continued for half an hour. It was then cooled and combined with 150 mL of water. One hundred twenty ml of 40% NaOH solution was applied along the sides of the Kjeldahl flask. Distilled ammonia evolved in 25 mL of boric acid solution was collected continuously until 150 mL of distillate was obtained. Titration of ammonia was done against standard sulfuric acid. A blank sample test was run simultaneously with a piece of paper (of the same size as those used for wrapping the samples) and other reagents.
Total   N   ( % ) = ( mL   of   acid   used   for   sample     mL   of   acid   used   for   blank )   ×   0.02   ×   14   ×   10 3 Sample   weight   in   kg   ×   100

2.2.3. Available N in Soil

Potentially available N in soil was estimated using calcium hydroxide hydrolysis, and the NH3 liberated was absorbed in boric acid containing a mixed indicator. The amount of NH3 was calculated by titration of distillate against standard acid (HCl or H2SO4). A 0.020 kg of soil sample was transferred into a 500 mL Kjeldahl flask and combined with a quarter tea-spoon of calcium hydroxide dissolved in 200 mL water plus a few glass beads, and a drop of a heavy mineral oil. Ammonia was collected by connecting the flask to the Kjeldahl distillation assembly in a 250 mL Erlenmeyer flask, which contained 25 mL of 4% boric acid mixed indicator solution placed below the receiver. Distillation continued for 30 min. Finally, ammonia was titrated and collected against a standard sulfuric acid solution and a blank sample was run simultaneously.
Available N was calculated using the formula blow:
Available N (kg ha−1) = (mL H2SO4 used for sample − mL H2SO4 used
for blank) × Normality of H2SO4 × 1568 *
*   ( Weight   of   0 0.15   m   layer   of   soil   in   kg Sample   weight   in   kg     ×   Equivalent   weight   of   N = 2.24 0.02 × 14 = 1568 )
Experimental procedure for study of effect of soil moisture and N level on electrical conductivity of selected soil types.
Experiments were conducted to measure electrical conductivity of different soil types at varying levels of soil moisture and N as per the experimental layout, Table 1.

2.3. Measurement of Soil Electrical Conductivity

The capacity of an element to transfer a current is electrical conductivity (EC). It is generally known in milliSiemens per meter (mS m−1) units. It is sometimes expressed in deciSiemens per meter (dS m−1) units as well, and equals to 0.01 mS m−1 [77]. An EC sensor (HI98331 Soil Test™ direct soil EC Tester, Hanna Instruments, Woonsocket, RI, USA) was used to measure soil electrical conductivity. The sensor consisted of two metal electrodes and a constant voltage was applied across the electrodes resulting in an electrical current flowing through the sample.

2.3.1. Measurement of EC at Different Levels of Soil Moisture

Five levels of moisture content of different soils were included in the study. The five levels of moisture content were 0% (dry soil), 13%, 15%, 17%, and 22% (dry basis). A moisture content of 22% was considered as field capacity [78] and 13% represented ploughing moisture [79]. Therefore, one level was initial soil moisture, which was zero moisture or dry soil, and for others, the moisture levels constituted the base for choosing various levels. To achieve the required moisture content in the soil, a calculated amount of water was added to dry soil. The selected levels of moisture content were obtained with the help of a moisture sensor (HI98331 Soil Test™ direct soil EC Tester, Hanna Instruments, Woonsocket, RI, USA) as well as by dry oven method testing. Electrical conductivity of different soils with different levels of moisture content was directly measured in miliSimon per meter using a soil EC sensor.

2.3.2. Measurement of Soil EC at Different Levels of N

Four levels of N 50 kg, 100 kg, 150 kg, and 200 kg ha−1 were added to the soil by adding a calculated amount of urea and then the electrical conductivity at each level was measured with an EC meter. A 0.100 kg soil sample of each soil type was used in this experiment. Soil weight from 0 to 0.15 m of depth was considered as 2.2 × 10⁶ kg ha−1 [80] and, accordingly, the level of N in the soil was adjusted by adding urea (46% N). A sample of 22 mL of water was mixed with different amounts of urea and added to 0.100 kg of soil sample so as to achieve a constant moisture content of the soil, i.e., 22%. Using an EC meter, the electrical conductivity of N-enriched soil was measured at a constant moisture level of 22%. The same procedure was followed to measure soil EC for other levels of soil moisture and N levels.

2.3.3. Statistical Analysis

To evaluate the effect of individual and interactive effects of independent variables on the response variable, an analysis of variance was carried out for a randomized block design. The analysis of variance (ANOVA) was carried out individually for the significance of moisture and N on electrical conductivity.

3. Results

3.1. Physical Properties of Selected Soil Types

The results for various physical properties of selected soil types are presented below.

3.1.1. Soil Texture of Selected Soil Samples

In all the studied representative soil samples, sand was predominantly present and there was also a distinct variation in clay percentage. The clay, silt, and sand percentage ranged between 16–45.84%, 18–41.32%, and 36.16–58.52%, respectively (Table 2). Out of five samples, three soil samples were selected for further study based on the maximum percentages of sand, clay, and silt.

3.1.2. Field Capacity, Permanent Wilting Point, and Available Water Capacity

A maximum field capacity of 23.63% was observed for the clay soil sample followed by 18.21%, which was observed for a soil sample higher in sand (61% sand, Table 3). This aligns with the findings of a previous study conducted by Saxton et al. [81], which also showed that the maximum field capacity was observed for soil with 50% clay and 25% sand content. The soil sample with the highest silt percentage exhibited the minimum permanent wilting point due to having less clay content which is similar to the conclusions drawn by Saxton et al. [81]. The minimum and maximum permanent wilting points were 5.66% and 12.23%, respectively. The available water, computed as the difference of the above two variables, showed the expected pattern, i.e., the amount of available water was highest for the soil with the highest clay percentage. In general, it was observed that clay loam soil exhibited the highest field capacity, permanent wilting point, and available water capacity due to having a higher percentage of clay and less porous space. The role of clay percentage in determining these characteristics was important. A summary of soil characteristics and composition is included below (Table 3).

3.2. Chemical Properties of Selected Soil Types

Nitrogen in Soil

The available N in kg ha−1 was highest (112.1 kg ha−1) in sandy loam soil with a higher sand proportion followed by clay loam (94.1 kg ha−1) and sandy loam (37.1 kg ha−1), which had a higher silt percentage. The total N percentage revealed a similar pattern for the three different soils. The total N percentage ranged from 0.01 to 0.07%, and was the highest for sandy loam soil with a higher sand percentage (Table 4).

3.3. Variation in Electrical Conductivity with Moisture Levels

The EC of all three soils was found to increase as moisture levels increased. The highest EC of 0.59 mS m−1 was observed for sandy loam soil (61% sand) followed by 0.57 mS m−1 for clay loam soil (46% clay). The lowest EC value of 0.21 mS m−1 was observed for sandy loam soil (41% silt) at all the studied soil moisture levels ranging from 13–22%. The result showed 0.00 mS m−1 for dry soil, which increased with increases in moisture content. The EC of sandy loam, with 61% sand, was the highest as this soil sample had the maximum available N and total N (Figure 1).
For clay loam, the increase in EC was 83.87% when moisture was increased from 13 to 22%. Likewise, the same difference in EC was observed as moisture level was increased for both sandy loam with higher silt and sandy loam with higher sand; their corresponding EC increases were 91% and 111%, respectively. Therefore, moisture level significantly influenced the EC of all three soils.

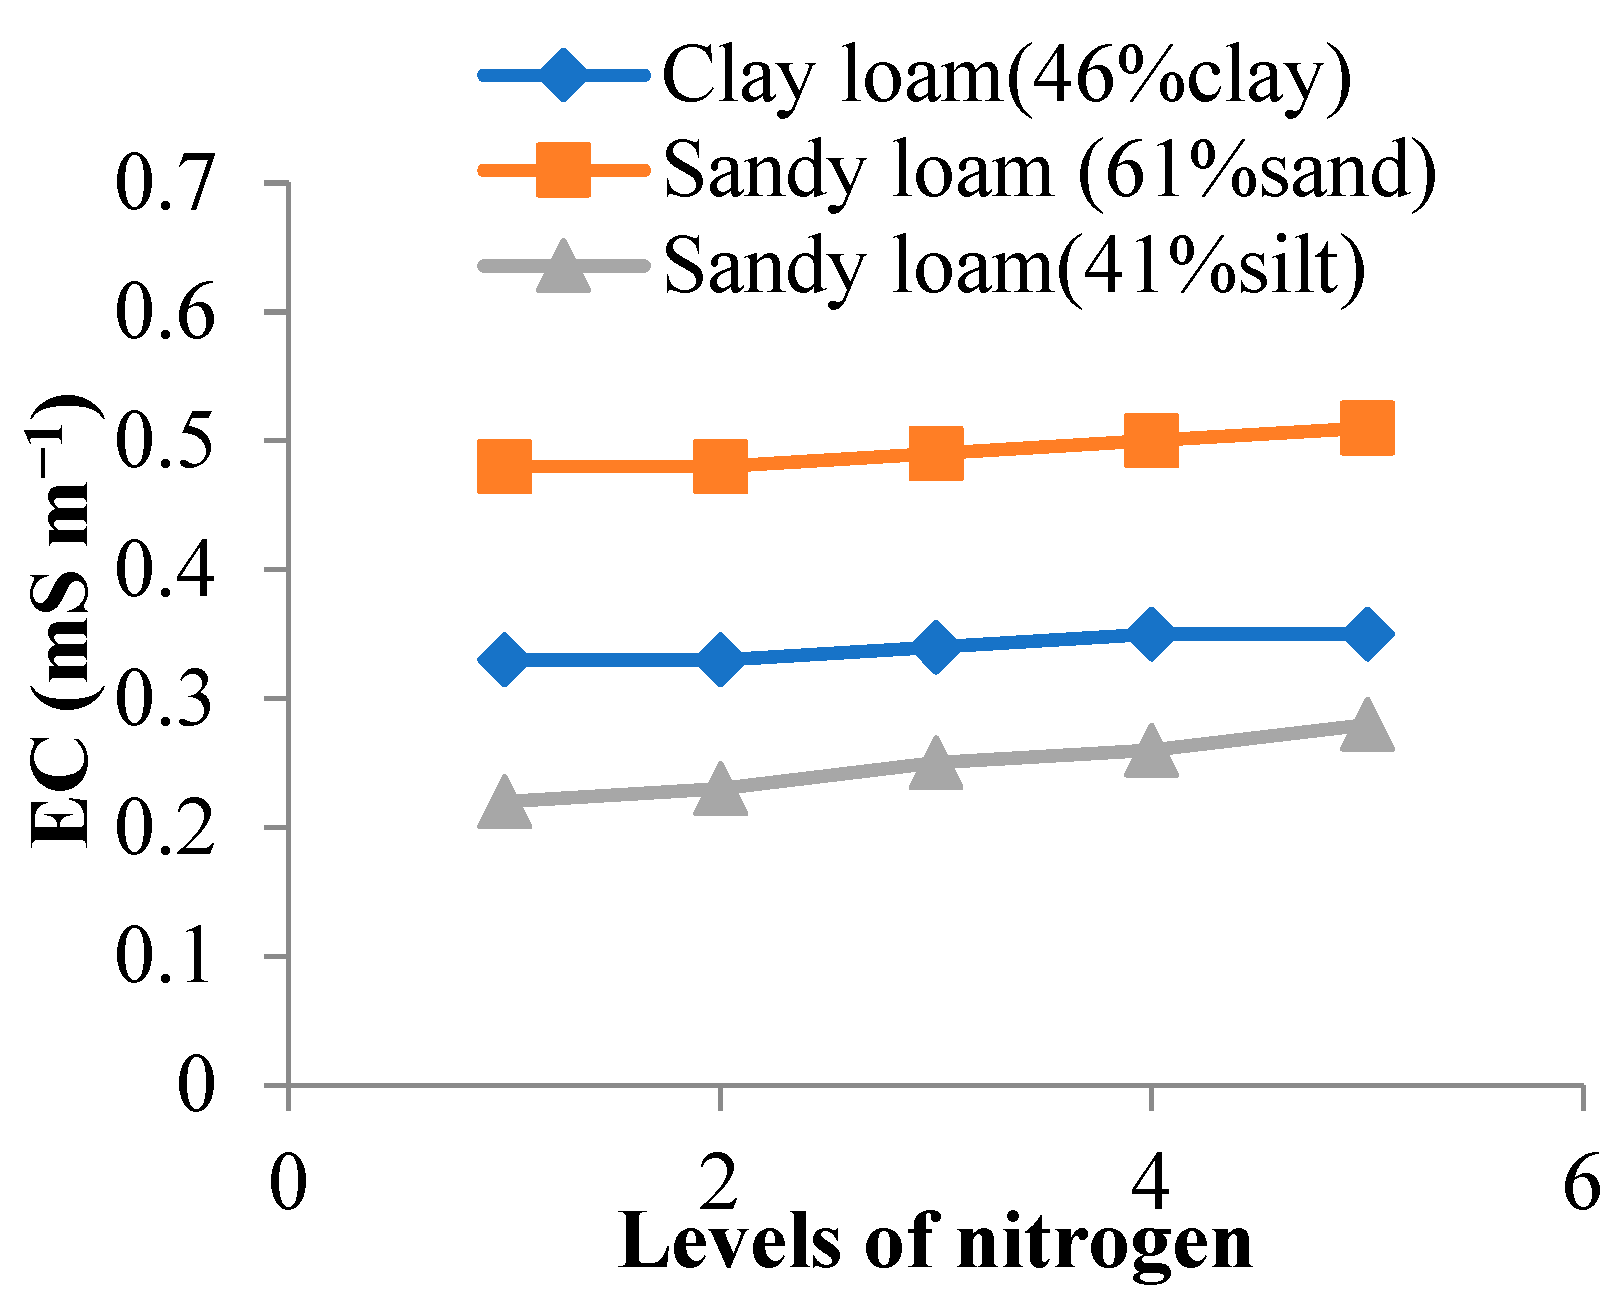
3.4. Variation in Soil Electrical Conductivity by N Level

The EC of three different types of soils ranging from sandy loam to clay loam revealed an increasing trend with the level of N gradually increasing from 50–200 kg ha−1 (Figure 2). EC was highest (0.51 mS m−1) for sandy loam (61% sand) and lowest (0.22 mS m−1) for sandy loam (41% silt) soil, as demonstrated in Figure 2. For clay loam, the increase in EC was 6.1% when the N level was increased from 50 kg ha−1 to 200 kg ha−1. For sandy loam (61% sand), the EC increased by 6.2% with an increase in N level from 50 kg ha−1 to 200 kg ha−1, while for sandy loam (41% silt), the change in EC was the highest (21.7%) for the same change in N level. Thus, the influence of N on EC was found to be the highest in soil with the maximum silt percentage.

3.5. Algorithm for Real Time N Measurement

An algorithm was developed using a polynomial relationship between the EC of the selected soil samples and their moisture levels. A polynomial relationship was also developed between the EC of each of the selected soil samples and their N levels. A significant correlation was observed between EC and different levels of N as well as different levels of moisture. The equations of this algorithm are as follows:
(A)
For different levels of moisture,
(i).
For clay loam (46% clay)
y = −0.037x2 + 0.362x − 0.306 (R2 = 0.985)
(ii).
For sandy loam (61% sand)
y = −0.027x2 + 0.308x − 0.264 (R2 = 0.988)
(iii).
For sandy loam (41% silt)
y = −0.013x 2 + 0.130x − 0.11 (R2 = 0.981)
where (y) is EC of soil and (x) is the moisture level (%) and R is regression coefficient
(B)
For different levels of N,
(i).
For clay loam (46% clay)
y = 0.0014x2 − 0.0006x − 0.478 (R2 = 0.983)
(ii).
For sandy loam (61% sand)
y = 0.006x − 0.322 (R2 = 0.900)
(iii).
For sandy loam (41% silt)
y = 0.0007x2 + 0.0107x + 0.208 (R2 = 0.99)
where (y) is EC of soil and (x) is level of N and R is the regression coefficient.
The coefficients of determination for N levels were 0.98, 0.90, and 0.99 for clay loam (46% clay), sandy loam (61% sand), and sandy loam (41% silt), respectively.
The data showed that when input into the equation that resulted from the correlation between EC and nitrate-N soil concentration, EC values provided reliable information about N availability. However, there is need to further investigate the interference of factors such as soil texture, CEC, salinity, pH, and organic matter.

4. Discussion

Nitrogen is the main element used in plant fertilization and measurement of its concentration in soil yields reliable information on N availability. Electrical conductivity indicates the presence of the major inorganic solutes dissolved in the aqueous phase consisting of soluble and readily dissolvable salts in soil solution, which include cations (e.g., Na+, K+, Mg2+, and Ca2+), anions (Cl, HCO3, NO3, and SO42−), and nonionic solutes [69]. Thus, soil EC has become one of the most frequently used measurement methods for characterizing nutrient variability in the field for application in precision agriculture [82]. The data revealed that the values of EC provided useful information on soil N availability using the equation that resulted from the correlation between EC and nitrate-N soil concentration. In this study, the relationship between soil EC and N availability for all the soil types was best described using a second degree. Similar studies conducted in controlled conditions [83,84] as well as in field experiments [85,86,87] have found a direct relationship between EC and nitrate concentration in soil solutions. However, there is need to further study if and how additional soil characteristics may interact with this relationship.
We observed that the soil EC changed across soil textures in accordance with previous studies in which a correlation between EC and soil texture was found [88,89]. The EC of different soils ranged between 0.00–0.59 mS m−1 for different soil moisture content of between 0–22% and EC increased with an increasing moisture content of soil. This correlation between EC and soil moisture content was observed in previous studies. However, in those studies, Faulin and Molin [90] concluded that there was a significant correlation between soil EC and moisture content, while Valente et al. [41] stated that there was no significant correlation between soil moisture content and EC.
In this study, results showed a significant correlation between EC with sandy loam soil (61% sand) and clay loam soil (46% clay) which is similar to previous studies’ results. Specifically, [70,89,91,92] reported a significant relationship between EC and soil with clay content. However, other studies [40,93,94,95,96,97] reported this correlation was not significant, underscoring the need for further research on this topic. This dissimilarity across studies could be due to differences in the combined percentage of clay, sand, and silt of the soils being tested, or may stem from variations in soil inorganic N rate in those soils [59].
The results of changes in EC with change in N levels revealed a correlation between soil EC and soil N, and soil EC was increased in different soil samples by increasing soil N; this correlation has been reported in previous studies as well [59,98].
The prediction models presented in this study concern three soil types: clay loam (higher clay), sandy loam (higher silt), and sandy loam (higher sand), which paved the way to explore similar trends in other soil types which have intermediate soil texture. However, there should be future studies on many other different soil types. Moreover, in the field, reality might be complex (due to dynamic factors such as climate or the impact of other physical and chemical properties of soil that are not considered in this study). Therefore, further research should be conducted on field conditions considering other physical and chemical properties of soil as well.

5. Conclusions

Samples of three soil types were selected based on maximum percentages of sand, clay, and silt present in each with the goal of developing an understanding of the relationships between soil EC, moisture content, and N level. The nitrogen content and moisture content in all selected soil types was found to significantly affect the EC of the soil. Therefore, accurate information regarding the EC and texture class of soil can be used to inform how its nitrogen content can be optimally managed. The relationships established can be used to develop a sensor for real-time measurement of available soil N, which, in turn, will enable farmers to precisely apply nitrogenous fertilizer.

Author Contributions

Conceptualization, H.M., I.M. and A.M.N.; methodology, H.M., I.M., M.H., A.M.N., D.K. and R.A.P.; formal analysis, H.M. and I.M.; investigation, H.M. and I.M.; resources, H.M., I.M., M.H. and D.K.; data curation, H.M. and I.M.; writing—original draft preparation, H.M.; writing—review and editing, H.M., I.M., M.H., A.M.N., R.A.P. and D.K. All authors have read and agreed to the published version of the manuscript.

Funding

This study was conducted under the PG program of ICAR-Indian Agricultural Research Institute, New Delhi, India.

Institutional Review Board Statement

Not applicable.

Informed Consent Statement

Not applicable.

Data Availability Statement

Not applicable.

Acknowledgments

The authors acknowledge the assistance received from the Ministry of Science, Research and Technology, Agricultural Ministry (Iran), Indian Council for Cultural Relations (ICCR), Division of Agricultural Engineering, Centre for Protected Cultivation Technology, Division of Agronomy, Division of Soil Science and Agricultural Chemistry, and Division of Agricultural Physics, IARI, New Delhi, during the study.

Conflicts of Interest

The authors declare that they have no conflict of interest.

References

  1. Shafi, U.; Mumtaz, R.; García-Nieto, J.; Hassan, S.A.; Zaidi, S.A.R.; Iqbal, N. Precision agriculture techniques and practices: From considerations to applications. Sensors 2019, 19, 3796. [Google Scholar] [CrossRef] [PubMed]
  2. Zhang, C.; Kovacs, J.M. The application of small unmanned aerial systems for precision agriculture: A review. Precis. Agric. 2012, 13, 693–712. [Google Scholar] [CrossRef]
  3. Pierce, F.J.; Nowak, P. Aspects of precision agriculture. Adv. Agron. 1999, 67, 1–85. [Google Scholar] [CrossRef]
  4. Martínez, J.M.; Galantini, J.A.; Duval, M.E. Contribution of nitrogen mineralization indices, labile organic matter and soil properties in predicting nitrogen mineralization. J. Soil Sci. Plant Nutr. 2018, 18, 73–89. [Google Scholar] [CrossRef]
  5. Lockman, R.B.; Storer, D.A. Soil nitrate and ammonium variation with area and date sampled. Commun. Soil Sci. Plant Anal. 1990, 21, 2219–2226. [Google Scholar] [CrossRef]
  6. Muñoz-Huerta, R.F.; Guevara-Gonzalez, R.G.; Contreras-Medina, L.M.; Torres-Pacheco, I.; Prado-Olivarez, J.; Ocampo-Velazquez, R.V. A review of methods for sensing the nitrogen status in plants: Advantages, disadvantages and recent advances. Sensors 2013, 13, 10823–10843. [Google Scholar] [CrossRef] [PubMed]
  7. Miller, A.J.; Cramer, M.D. Root nitrogen acquisition and assimilation. Plant Soil 2005, 274, 1–36. [Google Scholar] [CrossRef]
  8. Kolodziejczyk, M. Effectiveness of nitrogen fertilization and application of microbial preparations in potato cultivation. Turk. J. Agric. For. 2014, 38, 299–310. [Google Scholar] [CrossRef]
  9. Stanford, G.; Smith, S.J. Nitrogen mineralization potentials of soils. Soil Sci. Soc. Am. J. 1972, 36, 465–472. [Google Scholar] [CrossRef]
  10. Martínez, J.M.; Galantini, J.A. A rapid chemical method for estimating potentially mineralizable and particulate organic nitrogen in Mollisols. Commun. Soil Sci. Plant Anal. 2017, 48, 113–123. [Google Scholar] [CrossRef]
  11. Ros, G.H.; Hanegraaf, M.C.; Hoffland, E.; van Riemsdijk, W.H. Predicting soil N mineralization: Relevance of organic matter fractions and soil properties. Soil Biol. Biochem. 2011, 43, 1714–1722. [Google Scholar] [CrossRef]
  12. Luce, M.S.; Whalen, J.K.; Ziadi, N.; Zebarth, B.J. Nitrogen dynamics and indices to predict soil nitrogen supply in humid temperate soils. Adv. Agron. 2011, 112, 55–102. [Google Scholar] [CrossRef]
  13. Moya, H.; Verdejo, J.; Yáñez, C.; Álvaro, J.E.; Sauvé, S.; Neaman, A. Nitrification and nitrogen mineralization in agricultural soils contaminated by copper mining activities in Central Chile. J. Soil Sci. Plant Nutr. 2017, 17, 205–213. [Google Scholar] [CrossRef]
  14. Martínez, J.M.; Galantini, J.A.; Duval, M.E.; López, F.M. Tillage effects on labile pools of soil organic nitrogen in a semi-humid climate of Argentina: A long-term field study. Soil Tillage Res. 2017, 169, 71–80. [Google Scholar] [CrossRef]
  15. Gianello, C.; Bremner, J.M. A simple chemical method of assessing potentially available organic nitrogen in soil. Commun. Soil Sci. Plant Anal. 1986, 17, 195–214. [Google Scholar] [CrossRef]
  16. Sharifi, M.; Zebarth, B.J.; Burton, D.L.; Grant, C.A.; Cooper, J.M. Evaluation of some indices of potentially mineralizable nitrogen in soil. Soil Sci. Soc. Am. J. 2007, 71, 1233–1239. [Google Scholar] [CrossRef]
  17. Ramírez, M.V.; Rubilar, R.A.; Montes, C.; Stape, J.L.; Fox, T.R.; Lee Allen, H. Nitrogen availability and mineralization in Pinus radiata stands fertilized mid-rotation at three contrasting sites. J. Soil Sci. Plant Nutr. 2016, 16, 118–136. [Google Scholar] [CrossRef]
  18. Martínez-Lagos, J.; Salazar, F.; Alfaro, M.; Rosas, M.; Macías, F. Nitrogen mineralization in a silandic andosol fertilized with dairy slurry and urea. J. Soil Sci. Plant Nutr. 2015, 15, 60–75. [Google Scholar] [CrossRef]
  19. Li, S.X.; Wang, Z.H.; Miao, Y.F.; Li, S.Q. Soil organic nitrogen and its contribution to crop production. J. Integr. Agric. 2014, 13, 2061–2080. [Google Scholar] [CrossRef]
  20. Haynes, R.J. Labile organic matter fractions as central components of the quality of agricultural soils: An overview. Adv. Agron. 2005, 5, 221–268. [Google Scholar] [CrossRef]
  21. Schomberg, H.H.; Wietholter, S.; Griffin, T.S.; Reeves, D.W.; Cabrera, M.L.; Fisher, D.S.; Endale, D.M.; Novak, J.M.; Balkcom, K.S.; Raper, R.L.; et al. Assessing indices for predicting potential nitrogen mineralization in soils under different management systems. Soil Sci. Soc. Am. J. 2009, 73, 1575–1586. [Google Scholar] [CrossRef]
  22. Dessureault-Rompré, J.; Zebarth, B.J.; Georgallas, A.; Burton, D.L.; Grant, C.A.; Drury, C.F. Temperature dependence of soil nitrogen mineralization rate: Comparison of mathematical models, reference temperatures and origin of the soils. Geoderma 2010, 157, 97–108. [Google Scholar] [CrossRef]
  23. Nyiraneza, J.; Ziadi, N.; Zebarth, B.J.; Sharifi, M.; Burton, D.L.; Drury, C.F.; Bittman, S.; Grant, C.A. Prediction of soil nitrogen supply in corn production using soil chemical and biological indices. Soil Sci. Soc. Am. J. 2012, 76, 925–935. [Google Scholar] [CrossRef]
  24. Shukla, M.K.; Lal, R.; Ebinger, M. Principal component analysis for predicting corn biomass and grain yields. Soil Sci. 2004, 169, 215–224. [Google Scholar] [CrossRef]
  25. Motie, J.B.; Aghkhani, M.H.; Rohani, A.; Lakzian, A. A soft-computing approach to estimate soil electrical conductivity. Biosyst. Eng. 2021, 205, 105–120. [Google Scholar] [CrossRef]
  26. Uribeetxebarria, A.; Arnó, J.; Escolà, A.; Martinez-Casasnovas, J.A. Apparent electrical conductivity and multivariate analysis of soil properties to assess soil constraints in orchards affected by previous parcelling. Geoderma 2018, 319, 185–193. [Google Scholar] [CrossRef]
  27. Hummel, J.W.; Sudduth, K.A.; Hollinger, S.E. Soil moisture and organic matter prediction of surface and subsurface soils using an NIR soil sensor. Comput. Electron. Agric. 2001, 32, 149–165. [Google Scholar] [CrossRef]
  28. Tomkiewicz, D.; Piskier, T. A plant based sensing method for nutrition stress monitoring. Precis. Agric. 2012, 13, 370–383. [Google Scholar] [CrossRef]
  29. Peets, S.; Mouazen, A.M.; Blackburn, K.; Kuang, B.; Wiebensohn, J. Methods and procedures for automatic collection and management of data acquired from on-the-go sensors with application to on-the-go soil sensors. Comput. Electron. Agric. 2012, 81, 104–112. [Google Scholar] [CrossRef]
  30. Sinfield, J.V.; Fagerman, D.; Colic, O. Evaluation of sensing technologies for on-the-go detection of macro-nutrients in cultivated soils. Comput. Electron. Agric. 2010, 70, 1–18. [Google Scholar] [CrossRef]
  31. Adamchuk, V.I.; Viscarra Rossel, R.A.; Hartemink, A.E.; McBratney, A.B. Development of on-the-go proximal soil sensor systems. In Proximal Soil Sensing; Rossel, R.A.V., McBratney, A.B., Minasny, B., Eds.; Springer Science + Business Media B.V.: Berlin, Germany, 2010; pp. 15–28. [Google Scholar] [CrossRef]
  32. Pei, X.; Sudduth, K.A.; Veum, K.S.; Li, M. Improving in-situ estimation of soil profile properties using a multi-sensor probe. Sensors 2019, 19, 1011. [Google Scholar] [CrossRef] [PubMed]
  33. Othaman, N.N.C.; Isa, M.M.; Hussin, R.; Ismail, R.C.; Naziri, S.M.; Murad, S.A.Z.; Harun, A.; Ahmad, M.I. Development of Soil Electrical Conductivity (EC) Sensing System in Paddy Field. In Journal of Physics: Conference Series; IOP Publishing: Bristol, UK, 2021; Volume 1755, p. 12005. [Google Scholar] [CrossRef]
  34. Lukas, V.; Neudert, L.; Novák, J.; Kren, J. Estimation of Soil Physico-chemical Properties by On-the-go Measurement of Soil Electrical Conductivity. Agric. Conspec. Sci. 2018, 83, 93–98. [Google Scholar]
  35. Paz, A.M.; Castanheira, N.; Farzamian, M.; Paz, M.C.; Gonçalves, M.C.; Santos, F.A.M.; Triantafilis, J. Prediction of soil salinity and sodicity using electromagnetic conductivity imaging. Geoderma 2020, 361, 114086. [Google Scholar] [CrossRef]
  36. Hummel, J.W.; Gaultney, L.D.; Sudduth, K.A. Soil property sensing for site-specific crop management. Comput. Electron. Agric. 1996, 14, 121–136. [Google Scholar] [CrossRef]
  37. Sudduth, K.A.; Hummel, J.W.; Birrell, S.J. Sensors for site-specific management. In The State of Site Specific Management for Agriculture; Wiley: Hoboken, NJ, USA, 1997; pp. 183–210. [Google Scholar] [CrossRef]
  38. Adamchuk, V.I.; Hummel, J.W.; Morgan, M.T.; Upadhyaya, S.K. On-the-go soil sensors for precision agriculture. Comput. Electron. Agric. 2004, 44, 71–91. [Google Scholar] [CrossRef]
  39. Chighladze, G.; Kaleita, A.; Birrell, S. Sensitivity of capacitance soil moisture sensors to nitrate ions in soil solution. Soil Sci. Soc. Am. J. 2010, 74, 1987–1995. [Google Scholar] [CrossRef]
  40. Medeiros, W.N.; Valente, D.S.M.; Queiroz, D.M.D.; Pinto, F.D.A.D.C.; Assis, I.R.D. Apparent soil electrical conductivity in two different soil types. Rev. Cienc. Agron. 2018, 49, 43–52. [Google Scholar] [CrossRef]
  41. Valente, D.S.M.; Queiroz, D.M.D.; Pinto, F.D.A.D.C.; Santos, N.T.; Santos, F.L. The relationship between apparent soil electrical conductivity and soil properties. Rev. Cienc. Agron. 2012, 43, 683–690. [Google Scholar] [CrossRef] [Green Version]
  42. Farooque, A.A.; Zaman, Q.U.; Schumann, A.W.; Madani, A.; Percival, D.C. Delineating management zones for site specific fertilization in wild blueberry fields. Appl. Eng. Agric. 2012, 28, 57–70. [Google Scholar] [CrossRef]
  43. Rodríguez-Pérez, J.R.; Plant, R.E.; Lambert, J.J.; Smart, D.R. Using apparent soil electrical conductivity (ECa) to characterize vineyard soils of high clay content. Precis. Agric. 2011, 12, 775–794. [Google Scholar] [CrossRef]
  44. Morari, F.; Castrignanò, A.; Pagliarin, C. Application of multivariate geostatistics in delineating management zones within a gravelly vineyard using geo-electrical sensors. Comput. Electron. Agric. 2009, 68, 97–107. [Google Scholar] [CrossRef]
  45. Gholizadeh, A.; Amin Mohd Soom, M.; Anuar, A.R.; Aimrun, W. Relationship between apparent electrical conductivity and soil physical properties in a Malaysian paddy field. Arch. Agron. Soil Sci. 2012, 58, 155–168. [Google Scholar] [CrossRef]
  46. Wang, Z.; Timlin, D.; Kojima, Y.; Luo, C.; Chen, Y.; Li, S.; Fleisher, D.; Tully, K.; Reddy, V.R.; Horton, R. A piecewise analysis model for electrical conductivity calculation from time domain reflectometry waveforms. Comput. Electron. Agric. 2021, 182, 106012. [Google Scholar] [CrossRef]
  47. Molin, J.P.; Faulin, G.D.C. Spatial and temporal variability of soil electrical conductivity related to soil moisture. Sci. Agric. 2013, 70, 1–5. [Google Scholar] [CrossRef]
  48. Serrano, J.M.; Shahidian, S.; Marques da Silva, J. Spatial variability and temporal stability of apparent soil electrical conductivity in a Mediterranean pasture. Precis. Agric. 2017, 18, 245–263. [Google Scholar] [CrossRef]
  49. Sudduth, K.A.; Kitchen, N.R.; Wiebold, W.J.; Batchelor, W.D.; Bollero, G.A.; Bullock, D.G.; Clay, D.E.; Palm, H.L.; Pierce, F.J.; Schuler, R.T.; et al. Relating apparent electrical conductivity to soil properties across the north-central USA. Comput. Electron. Agric. 2005, 46, 263–283. [Google Scholar] [CrossRef]
  50. Jung, W.K.; Kitchen, N.R.; Sudduth, K.A.; Kremer, R.J.; Motavalli, P.P. Relationship of apparent soil electrical conductivity to claypan soil properties. Soil Sci. Soc. Am. J. 2005, 69, 883–892. [Google Scholar] [CrossRef]
  51. Terrón, J.M.; Marques da Silva, J.R.; Moral, F.J.; García-Ferrer, A. Soil apparent electrical conductivity and geographically weighted regression for mapping soil. Precis. Agric. 2011, 12, 750–761. [Google Scholar] [CrossRef] [Green Version]
  52. Corwin, D.L.; Scudiero, E. Field-scale apparent soil electrical conductivity. Soil Sci. Soc. Am. J. 2020, 84, 1405–1441. [Google Scholar] [CrossRef]
  53. Nocco, M.A.; Ruark, M.D.; Kucharik, C.J. Apparent electrical conductivity predicts physical properties of coarse soils. Geoderma 2019, 335, 1–11. [Google Scholar] [CrossRef]
  54. Grisso, R.D.; Alley, M.M.; Holshouser, D.L.; Thomason, W.E. Precision Farming Tools. Soil Electrical Conductivity; Publications, Virginia Cooperative Extension (VCE); Publication 442-508; Virginia Polytechnic Institute and State University: Blacksburg, VA, USA, 2005; Available online: https://vtechworks.lib.vt.edu/bitstream/handle/10919/51377/442-508.pdf?sequence=1&isAllowed=y (accessed on 17 December 2021).
  55. Zhang, R.; Wienhold, B.J. The effect of soil moisture on mineral nitrogen, soil electrical conductivity, and pH. Nutr. Cycl. Agroecosystems 2002, 63, 251–254. [Google Scholar] [CrossRef]
  56. Queiroz, D.M.; Sousa, E.D.; Lee, W.S.; Schueller, J.K. Development and testing of a low-cost portable apparent soil electrical conductivity sensor using a beaglebone black. Appl. Eng. Agric. 2020, 36, 341–355. [Google Scholar] [CrossRef]
  57. Hanssens, D.; Delefortrie, S.; Bobe, C.; Hermans, T.; De Smedt, P. Improving the reliability of soil EC-mapping: Robust apparent electrical conductivity (rECa) estimation in ground-based frequency domain electromagnetics. Geoderma 2019, 337, 1155–1163. [Google Scholar] [CrossRef]
  58. Dos Santos Sousa, E.D.T.; de Queiroz, D.M.; de Freitas Coelho, A.L.; Valente, D.S.M. Development of signal analysis algorithm for apparent soil electrical conductivity sensor. Biosyst. Eng. 2021, 211, 183–191. [Google Scholar] [CrossRef]
  59. Huang, Y.; Jiang, H.; Wang, W.; Sun, D. Prediction Model of Soil Electrical Conductivity Based on ELM Optimized by Bald Eagle Search Algorithm. Electronics 2021, 25, 50–56. [Google Scholar] [CrossRef]
  60. Coppola, A.; Smettem, K.; Ajeel, A.; Saeed, A.; Dragonetti, G.; Comegna, A.; Lamaddalena, N.; Vacca, A. Calibration of an electromagnetic induction sensor with time-domain reflectometry data to monitor rootzone electrical conductivity under saline water irrigation. Eur. J. Soil Sci. 2016, 67, 737–748. [Google Scholar] [CrossRef]
  61. Peng, Y.; Xiao, Y.; Fu, Z.; Dong, Y.; Zheng, Y.; Yan, H.; Li, X. Precision irrigation perspectives on the sustainable water-saving of field crop production in China: Water demand prediction and irrigation scheme optimization. J. Clean. Prod. 2019, 230, 365–377. [Google Scholar] [CrossRef]
  62. Yang, B.; Cetin, B.; Zhang, Y.; Luo, C.; Ceylan, H.; Horton, R.; Kim, S.; Mahedi, M. Effects of concrete grinding residue (CGR) on selected sandy loam properties. J. Clean. Prod. 2019, 240, 118057–118066. [Google Scholar] [CrossRef]
  63. Luo, C.; Wang, Z.; Kordbacheh, F.; Li, S.; Cetin, B.; Ceylan, H.; Horton, R. A greenhouse study of concrete grinding residue influences on seedling emergence and early growth of selected prairie species. Water Air Soil Pollut. 2020, 231, 253–262. [Google Scholar] [CrossRef]
  64. Sanches, G.M.; Magalhães, P.S.; Remacre, A.Z.; Franco, H.C. Potential of apparent soil electrical conductivity to describe the soil pH and improve lime application in a clayey soil. Soil Tillage Res. 2018, 175, 217–225. [Google Scholar] [CrossRef]
  65. Ekwue, E.I.; Bartholomew, J. Electrical conductivity of some soils in Trinidad as affected by density, water and peat content. Biosyst. Eng. 2011, 108, 95–103. [Google Scholar] [CrossRef]
  66. Friedman, S.P. Soil properties influencing apparent electrical conductivity: A review. Comput. Electron. Agric. 2005, 46, 45–70. [Google Scholar] [CrossRef]
  67. Johnson, C.K.; Mortensen, D.A.; Wienhold, B.J.; Shanahan, J.F.; Doran, J. Site-specific management zones based on soil electrical conductivity in a semiarid cropping system. Agron. J. 2003, 95, 303–315. [Google Scholar] [CrossRef]
  68. Moral, F.J.; Terrón, J.M.; Da Silva, J.M. Delineation of management zones using mobile measurements of soil apparent electrical conductivity and multivariate geostatistical techniques. Soil Tillage Res. 2010, 106, 335–343. [Google Scholar] [CrossRef]
  69. Corwin, D.L.; Lesch, S.M. Application of soil electrical conductivity to precision agriculture: Theory, principles, and guidelines. Agron. J. 2003, 95, 455–471. [Google Scholar] [CrossRef]
  70. Sudduth, K.A.; Drummond, S.T.; Kitchen, N.R. Accuracy issues in electromagnetic induction sensing of soil electrical conductivity for precision agriculture. Comput. Electron. Agric. 2001, 31, 239–264. [Google Scholar] [CrossRef]
  71. Bouyoucos, G.J. Hydrometer method improved for making particle size analyses of soils 1. Agron. J. 1962, 54, 464–465. [Google Scholar] [CrossRef]
  72. Singh, D.P.; Chhonkar, P.K.; Dwivedi, D.S. Manual on Soil, Plant and Water Analysis; Westville Publishing House: New Delhi, India, 2005; 200p. [Google Scholar]
  73. Kirkham, M.B. Chapter 10: Field Capacity, Wilting Point, Available Water, and the Nonlimiting Water Range. In Principles of Soil and Plant Water Relations; Kirkham, M.B., Ed.; Elsevier Inc.: Boston, MA, USA, 2014; pp. 153–170. [Google Scholar] [CrossRef]
  74. O’Kelly, B.C. Accurate determination of moisture content of organic soils using the oven drying method. Dry. Technol. 2004, 22, 1767–1776. [Google Scholar] [CrossRef]
  75. Thomas, G.W. Soil pH and soil acidity. In Methods of Soil Analysis. Part 3 Chemical Methods; Bartels, J.M., Ed.; SSSA-ASA: Madison, WI, USA, 1996; Volume 3, pp. 475–490. [Google Scholar]
  76. Kjeldahl, J. A New Method for the Determination of Nitrogen in Organic Matter. Z. Anal. Chem. 1883, 22, 366–382. [Google Scholar] [CrossRef]
  77. Seifi, M.R.; Alimardani, R.; Sharifi, A. How can soil electrical conductivity measurements control soil pollution? Res. J. Environ. Earth Sci. 2010, 2, 235–238. [Google Scholar]
  78. Anonymous. Cornell University. Soil and Water Management. PO 12.1-3. Northeast Region Certified Crop Adviser (NRCCA) Study Resources. 2021. Available online: https://nrcca.cals.cornell.edu/soil/CA2/CA0212.1-3.php (accessed on 27 September 2021).
  79. Shittu, K.A.; Oyedele, D.J.; Babatunde, K.M. The effects of moisture content at tillage on soil strength in maize production. Egypt. J. Basic Appl. Sci. 2017, 4, 139–142. [Google Scholar] [CrossRef]
  80. Prasad, R.; Shivay, Y.S.; Kumar, D. A Practical Manual of Analytical Methods for Soil and Plant Samples from Agronomy Field Experiments; Division of Agronomy, Indian Agricultural Research Institute: New Delhi, India, 2013; 57p. [Google Scholar]
  81. Saxton, K.E.; Rawls, W.J. Soil water characteristic estimates by texture and organic matter for hydrologic solutions. Soil Sci. Soc. Am. J. 2006, 70, 1569–1578. [Google Scholar] [CrossRef]
  82. Pascual, M.; Rufat, J.; Arbonés, A.; Escolà, A.; Rosell, J.R.; Martinez-Casasnovas, J.A.; Josep, M.; Villar, M.; Vilarrasa, M. Use of soil EC a measurement for evaluating soil spatial variability for nitrogen management in super-intensive olive oil tree orchards. In Proceedings of the Efficient Use of Different Sources of Nitrogen in Agriculture–From Theory to Practice, Skara, Sweden, 27–29 June 2016; p. 335. [Google Scholar]
  83. Leggo, P.J.; Ledésert, B. The stimulation of nitrification in an organically enriched soil by zeolitic tuff and its effect on plant growing. Ann. Agrar. Sci. 2009, 7, 9–16. [Google Scholar]
  84. Baldi, E.; Quartieri, M.; Muzzi, E.; Noferini, M.; Toselli, M. Use of in situ soil solution electric conductivity to evaluate mineral N in commercial orchards: Preliminary results. Horticulturae 2020, 6, 39. [Google Scholar] [CrossRef]
  85. Miyamoto, T.; Kameyama, K.; Iwata, Y. Monitoring electrical conductivity and nitrate concentrations in an Andisol field using time domain reflectometry. Jpn. Agric. Res. Q. 2015, 49, 261–267. [Google Scholar] [CrossRef]
  86. De Neve, S.; Van de Steene, J.; Hartmann, R.; Hofman, G. Using time domain reflectometry for monitoring mineralization of nitrogen from soil organic matter. Eur. J. Soil Sci. 2000, 51, 295–304. [Google Scholar] [CrossRef]
  87. Nissen, H.H.; Moldrup, P.; Henriksen, K. Time domain reflectometry measurements of nitrate transport in manure-amended soil. Soil Sci. Soc. Am. J. 1998, 62, 99–109. [Google Scholar] [CrossRef]
  88. Williams, B.G.; Hoey, D. The use of electromagnetic induction to detect the spatial variability of the salt and clay contents of soils. Soil Res. 1987, 25, 21–27. [Google Scholar] [CrossRef]
  89. Molin, J.P.; Castro, C.N.D. Establishing management zones using soil electrical conductivity and other soil properties by the fuzzy clustering technique. Sci. Agric. 2008, 65, 567–573. [Google Scholar] [CrossRef] [Green Version]
  90. Faulin, G.D.C.; Molin, J.P. Amplitude of moisture values and their influence on the measurement of soil electrical conductivity (Amplitude dos valores da umidade e sua influência na mensuração da condutividade elétrica do solo). In Proceedings of the Brazilian Congress of Precision Agriculture (Congresso Brasileiro de Agricultura de Precisão), Piracicaba, SP, Brazil, 18–19 July 2006; Available online: https://www.agriculturadeprecisao.org.br/trabalhos-em-congresso/ (accessed on 23 December 2021).
  91. Pedrera-Parrilla, A.; Van De Vijver, E.; Van Meirvenne, M.; Espejo-Pérez, A.J.; Giráldez, J.V.; Vanderlinden, K. Apparent electrical conductivity measurements in an olive orchard under wet and dry soil conditions: Significance for clay and soil water content mapping. Precis. Agric. 2016, 17, 531–545. [Google Scholar] [CrossRef]
  92. Lesch, S.M.; Corwin, D.L.; Robinson, D.A. Apparent soil electrical conductivity mapping as an agricultural management tool in arid zone soils. Comput. Electron. Agric. 2005, 46, 351–378. [Google Scholar] [CrossRef]
  93. Aimrun, W.; Amin, M.S.M.; Ahmad, D.; Hanafi, M.M.; Chan, C.S. Spatial variability of bulk soil electrical conductivity in a Malaysian paddy field: Key to soil management. Paddy Water Environ. 2007, 5, 113–121. [Google Scholar] [CrossRef]
  94. Carroll, Z.L.; Oliver, M.A. Exploring the spatial relations between soil physical properties and apparent electrical conductivity. Geoderma 2005, 128, 354–374. [Google Scholar] [CrossRef]
  95. Corwin, D.L.; Lesch, S.M. Characterizing soil spatial variability with apparent soil electrical conductivity: Part II. Case study. Comput. Electron. Agric. 2005, 46, 135–152. [Google Scholar] [CrossRef]
  96. Cambouris, A.N.; Nolin, M.C.; Zebarth, B.J.; Laverdière, M.R. Soil management zones delineated by electrical conductivity to characterize spatial and temporal variations in potato yield and in soil properties. Am. J. Potato Res. 2006, 83, 381–395. [Google Scholar] [CrossRef]
  97. Corwin, D.L.; Lesch, S.M.; Oster, J.D.; Kaffka, S.R. Monitoring management-induced spatio–temporal changes in soil quality through soil sampling directed by apparent electrical conductivity. Geoderma 2006, 131, 369–387. [Google Scholar] [CrossRef]
  98. Huang, L.; Liu, X.; Wang, Z.; Liang, Z.; Wang, M.; Liu, M.; Suarez, D.L. Interactive effects of pH, EC and nitrogen on yields and nutrient absorption of rice (Oryza sativa L.). Agric. Water Manag. 2017, 194, 48–57. [Google Scholar] [CrossRef]
Figure 1. Relation between moisture and EC for different soil samples.
Sensors 22 06728 g001
Figure 2. Relation between N and EC for different soil samples.
Sensors 22 06728 g002
Table 1. Plan of experiment for determining relationships between EC, soil moisture, and N level of soil.
VariablesLevelsParameter Measured
Soil textureClay loam (maximum clay percentage)Electrical conductivity
Sandy loam (maximum silt percentage)
Sandy loam (maximum sand percentage)
Soil moisture, percent (dry basis)0 (dry soil)Electrical conductivity
13
15
17
22
N Level, kg ha−10 (no addition of N in soil)Electrical conductivity
50
100
150
200
Table 2. Percentage distribution of sand, silt, and clay in selected soil types.
Percentage of Sand Silt and Clay (%)
Soil TypeClaySiltSandSelected Based on
127.1220.052.88-
221.1221.1257.76-
39.1230.060.88Sand content
445.8418.036.16Clay content
50.1641.3258.52Silt content
Table 3. Physical properties of selected soil types.
Soil PropertiesClay Loam
(46% Clay)
Sandy Loam
(41% Silt)
Sandy Loam
(61% Sand)
Field capacity (%)23.6313.9618.21
Permanent wilting point (%)12.235.667.28
Available water capacity (%)11.48.310.93
Table 4. Total and available N in different soil.
Type of SoilClay Loam (46% Clay)Sandy Loam (41% Silt)Sandy Loam (61% Sand)
Total N (%)0.010.040.07
Available N (kg ha−1)94.137.1112.1
Publisher’s Note: MDPI stays neutral with regard to jurisdictional claims in published maps and institutional affiliations.

