For this BGC-Argo dataset, the mean absolute temperature corrections on
using night and day profiles are 8 × 10
−5 and 9.3 × 10
−5 [W m
nm
] and maximum absolute corrections are 4.4 × 10
−4 and 6.14 × 10
−4 [W m
nm
], respectively (
Table 2). These corrections are more than an order of magnitude larger than the known sensitivity of the sensors (
W m
nm
), are consistent with what has been observed in the lab by [
4], and hence are significant. The average correction is O (10%) of the 0.1% light level, while the maximum is O (40%) of that value.
The method used here follows the work of [
4], who has demonstrated the temperature dependence of the dark current of Satlantic OCR504 radiometers in the laboratory. Additionally, ref. [
5] published a method approaching the same goals as ours, i.e., to produce a temperature-dependent dark correction for BGC-Argo profiles. Though our methods differ, we find overall agreement with both [
4,
5]. Here we provide a simple and robust method that allow users to carry out their own corrections and is consistent with both [
4,
5]. In [
5], the BGC-Argo B- and transmission files are used in addition to BGC-Argo s-files, while ours is based only on s-files. The B- and transmission files are used to investigate measurements made at float park depth, while the s-files contain compiled profiles for each float. Ref. [
5] investigated 55 floats. They provide a model that includes drift correction, where in certain, but rare, cases they observed a drift as much as 1 × 10
−7 days−1, producing a significant correction over a 3 year lifetime. We found no significant evidence for this over the lifetime of the floats we analyzed. We recognize that by not investigating the measurements made at parking depth (instead basing our conclusion off of measurements made at deep profiles, where measurements may occasionally be as deep as ∼900 m), we are not using the best possible data to quantify a drift over the lifetime. The correction we have proposed did not take that into account. After the drift correction, they fit a linear model to provide a temperature correction analogous to our Equation (1). In [
4], 7 radiometers were tested in the laboratory over a temperature range of 26
C. They employed several methods for modeling the dark response: linear (such as ours), exponential, and quadratic. They chose the linear model as the primary model and only employed the quadratic or exponential if the
value was significantly better. Out of 28 channels (7 radiometers × 4 channels), 17/28 were fit with the linear model, 4 with the exponential model, and 3 with the quadratic model, and for 4, no model fit well (Table 2a–g in [
4]). The dynamic temperature range of their experiment compared to our in situ data (where average temperature range of a float lifetime is 12
C) may explain the necessity for a quadratic fit compared to our data (e.g., Figure 8 in [
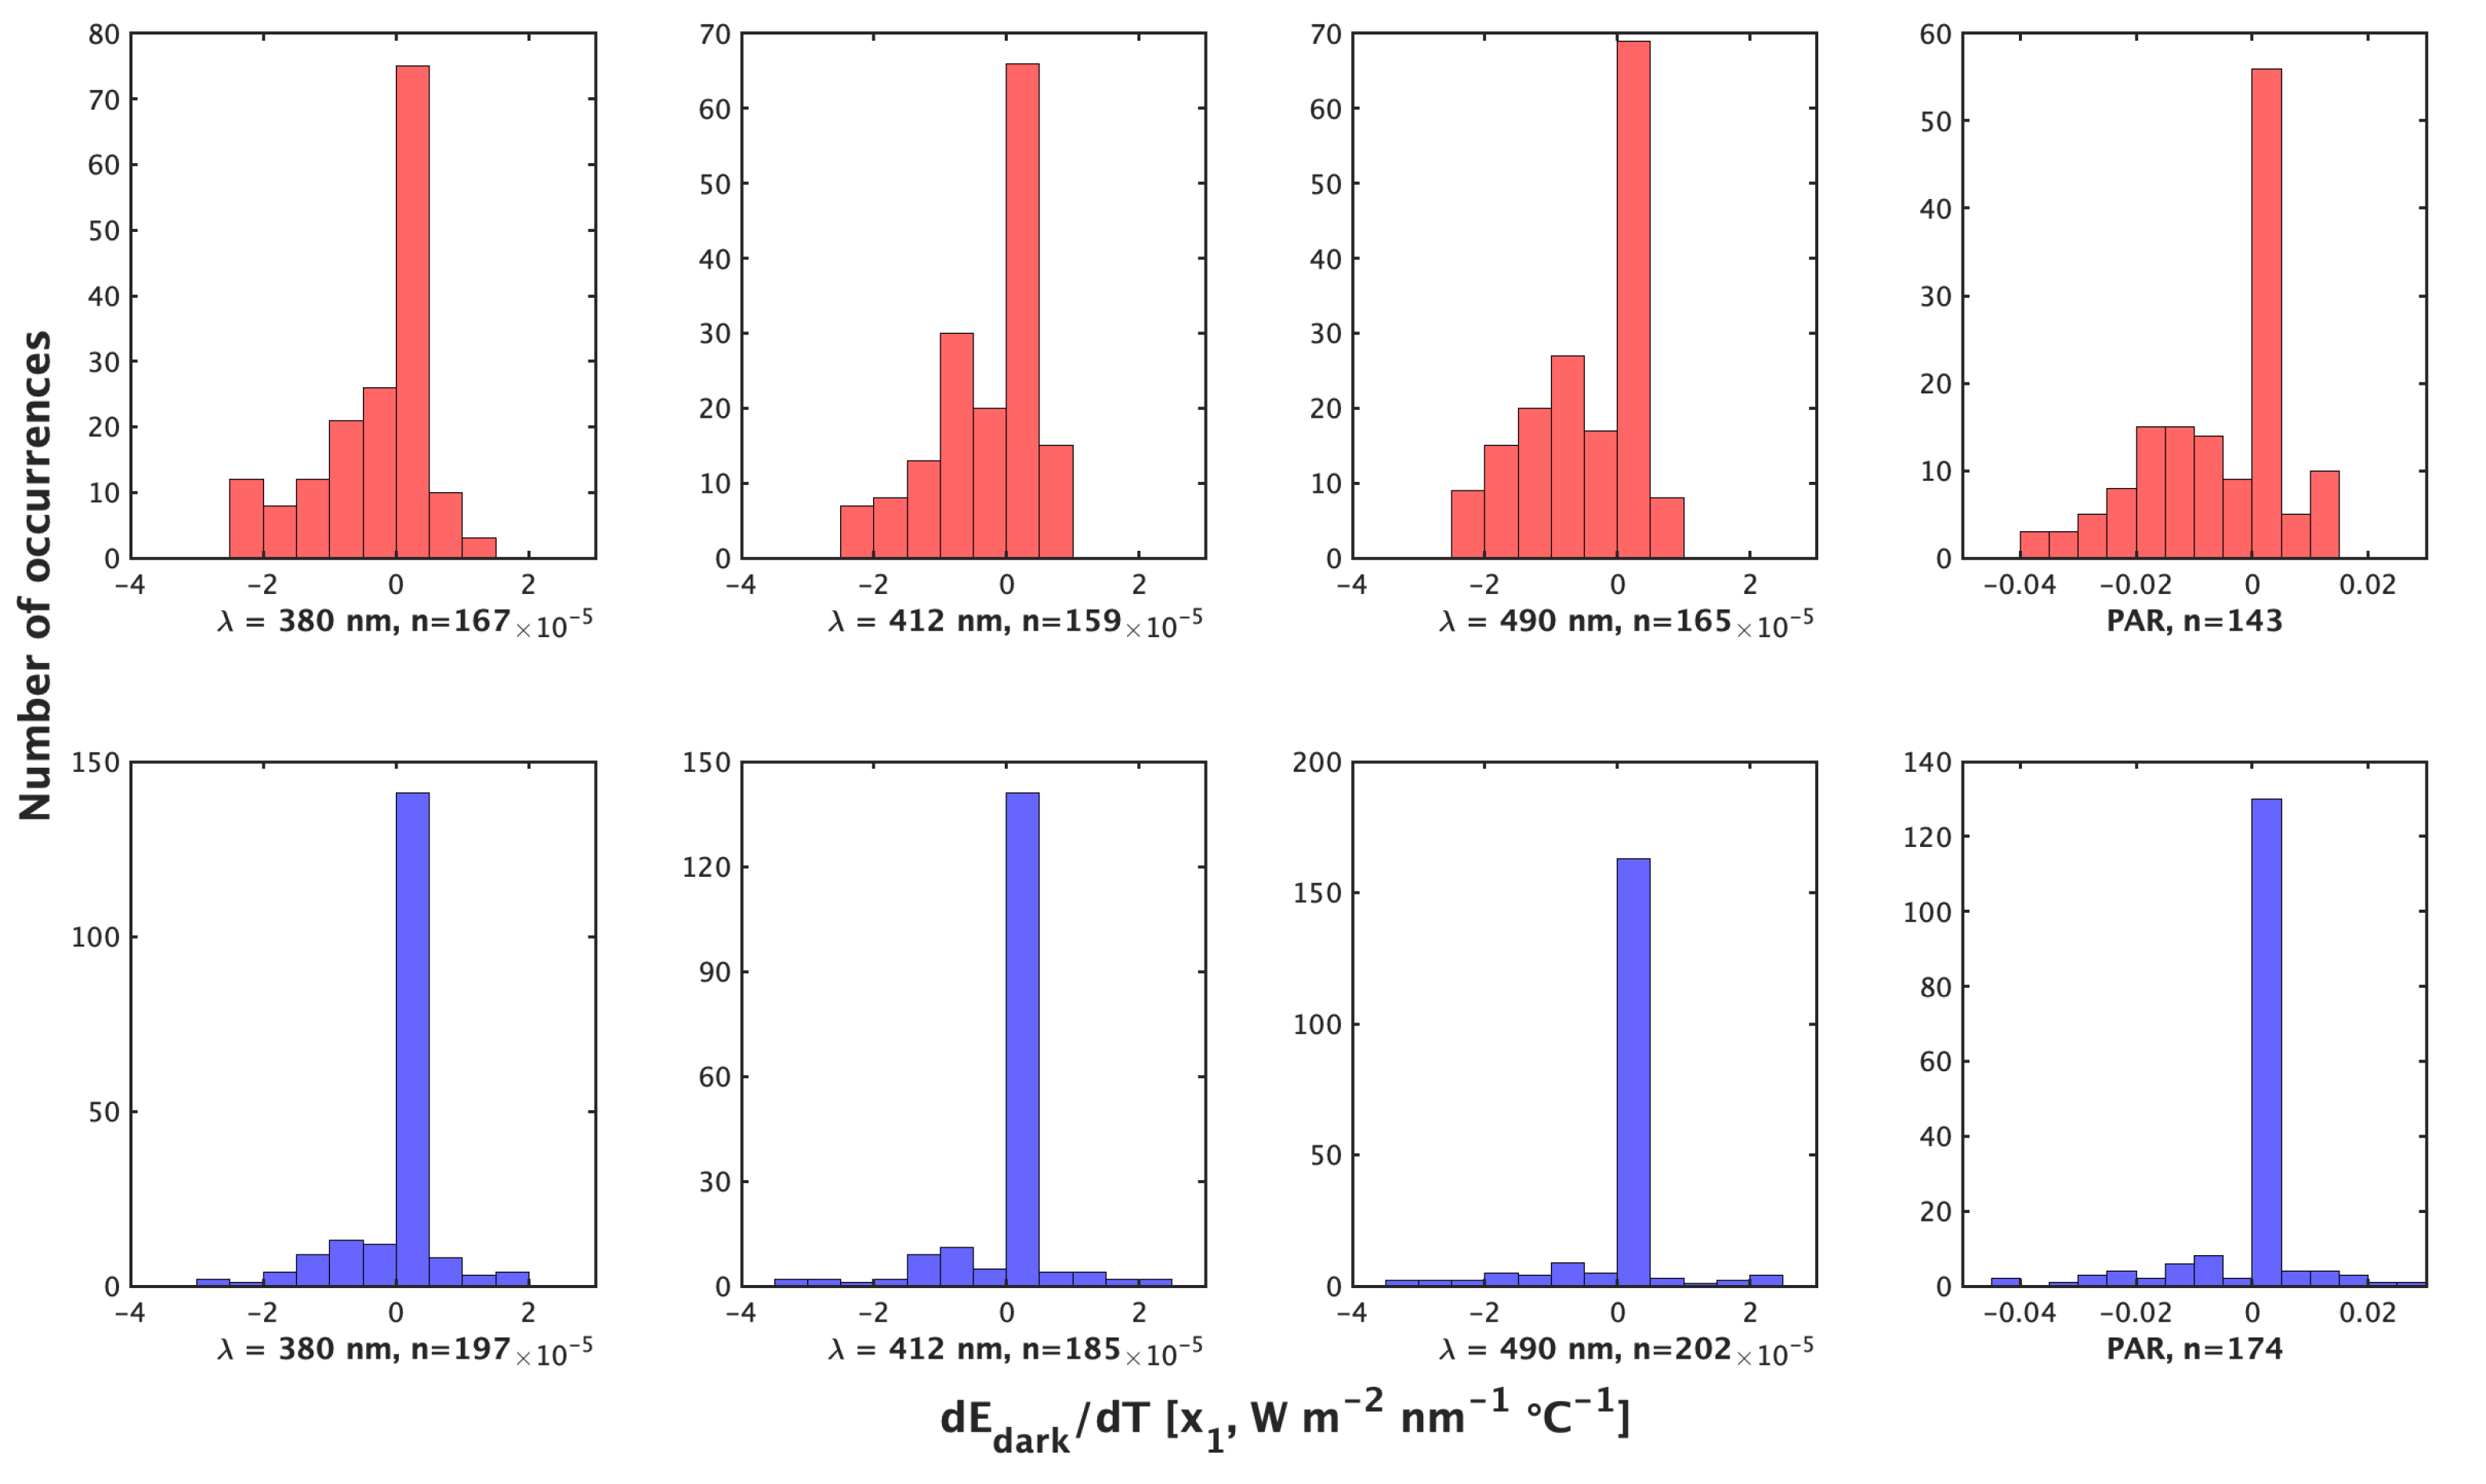
4]). The values of our modeled coefficients
agree well with [
4] and [
5], with the maximum
on the order of
W m
−2nm
−1 C
(Figure S9 in [
5]). At all wavelengths and PAR,
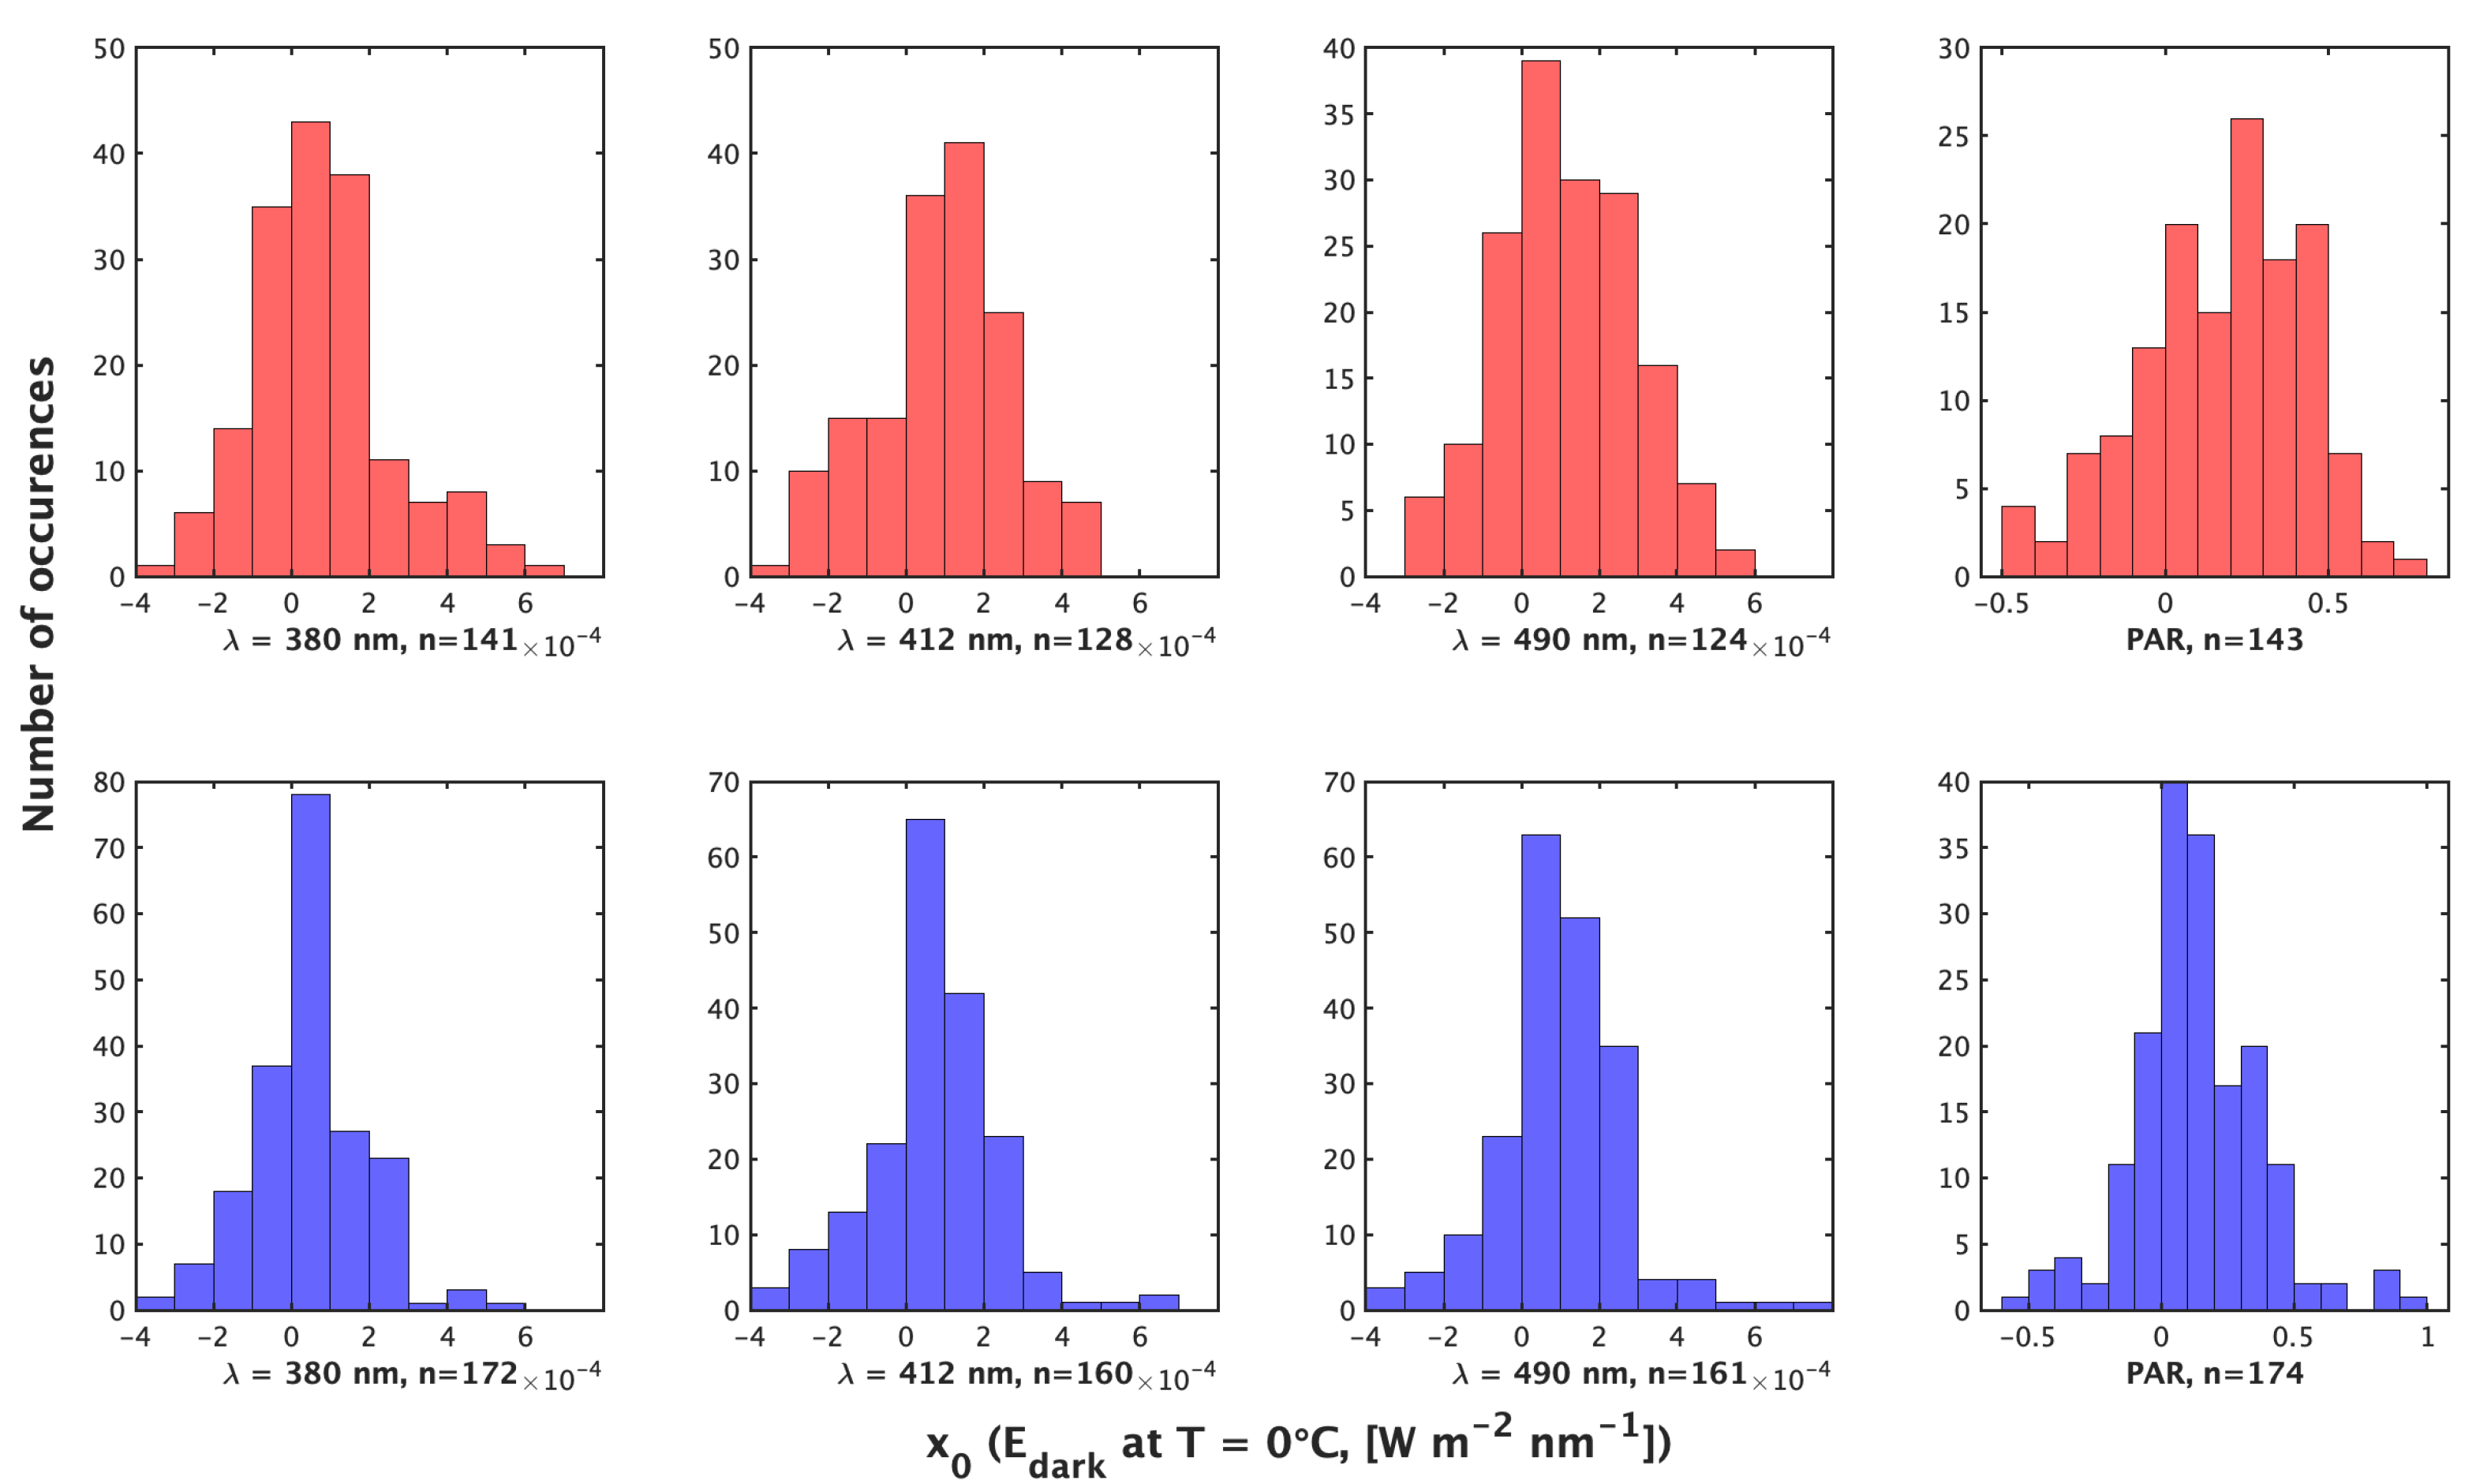
is centered near zero, slightly biased towards negative values (decreasing dark signal with increasing temperature), and assumes a general Gaussian form. For
, ref. [
4] produces the smallest values, on the order of
mol photons m
s
C
, while [
5] agrees with our maximums as high as
. Likewise, we find a similar model constant of PAR (our
) with [
5] showing the highest maximum. Our investigation of the daytime profiles revealed these significant dark readings at depth, and our corrections for PAR are of the same order relative to surface values as our corrections for
: at 10 m, our average PAR correction is on the order of 0.001% of the 10 m measured PAR value, analogous to the average 10 m correction at all three wavelengths. Overall we find very similar results between our method and [
4,
5]. The end-user applicability, robust approach, consistency between day and night methods (as in
Figure 4), consistency between size of corrections applied across all four wavebands, and number of floats investigated here (219) provide evidence for the utility of the methods presented in this paper.


