
Online Intelligent Perception of Front Blind Area of Vehicles on a Full Bridge Based on Dynamic Configuration Monitoring of Main Girders


Abstract
:1. Introduction
2. Front Blind Area on Bridge Deck during VVIV: Basic Concept and Perception Technology Route
2.1. Visual Front Blind Area for Driving on the Bridge Deck Experiencing VVIV
2.2. Technology Route of Real-Time Online Perception of Front Blind Area
3. Online Real-Time Perception of Front Blind Area during VVIV Based on Acceleration Monitoring
3.1. Theoretical Derivation of Driver’s Visual Front Blind Area
3.2. Real-Time Online Acceleration Integration Algorithm
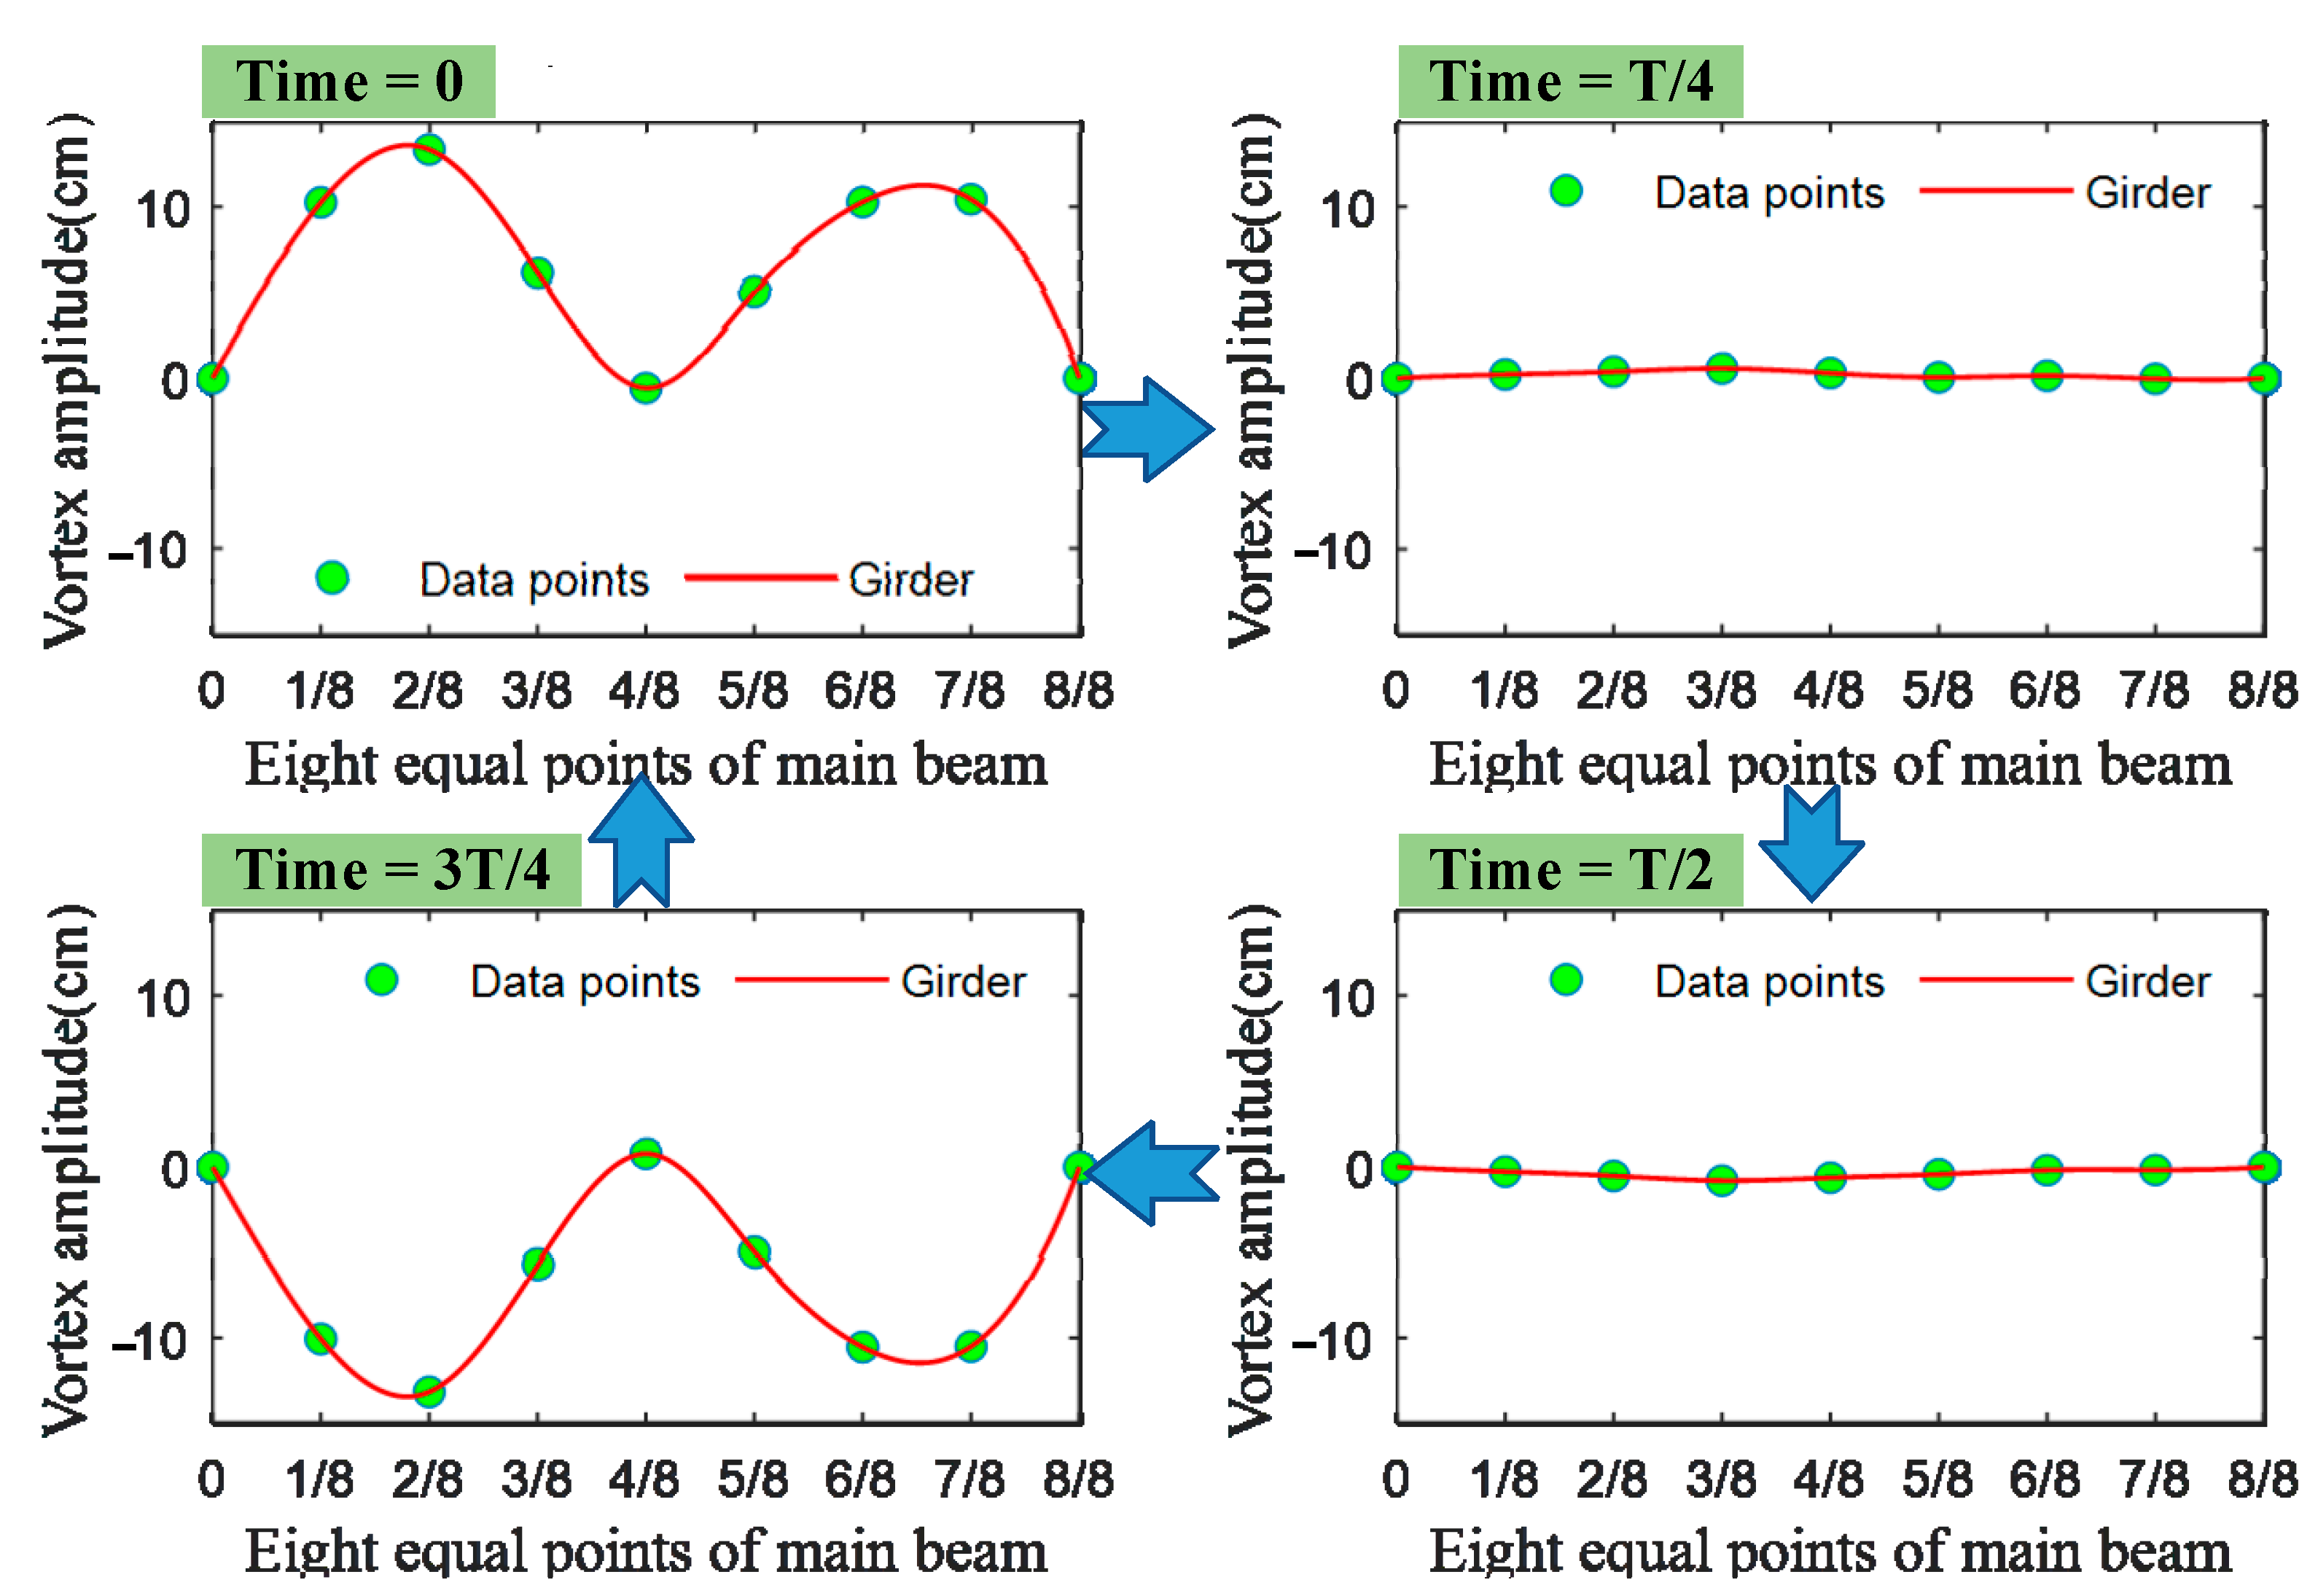
3.3. Fitting of Real-Time Dynamic Configuration Based on Monitoring Acceleration Signals
3.4. Online Perception of Front Blind Area and Driving Safety
- (1)
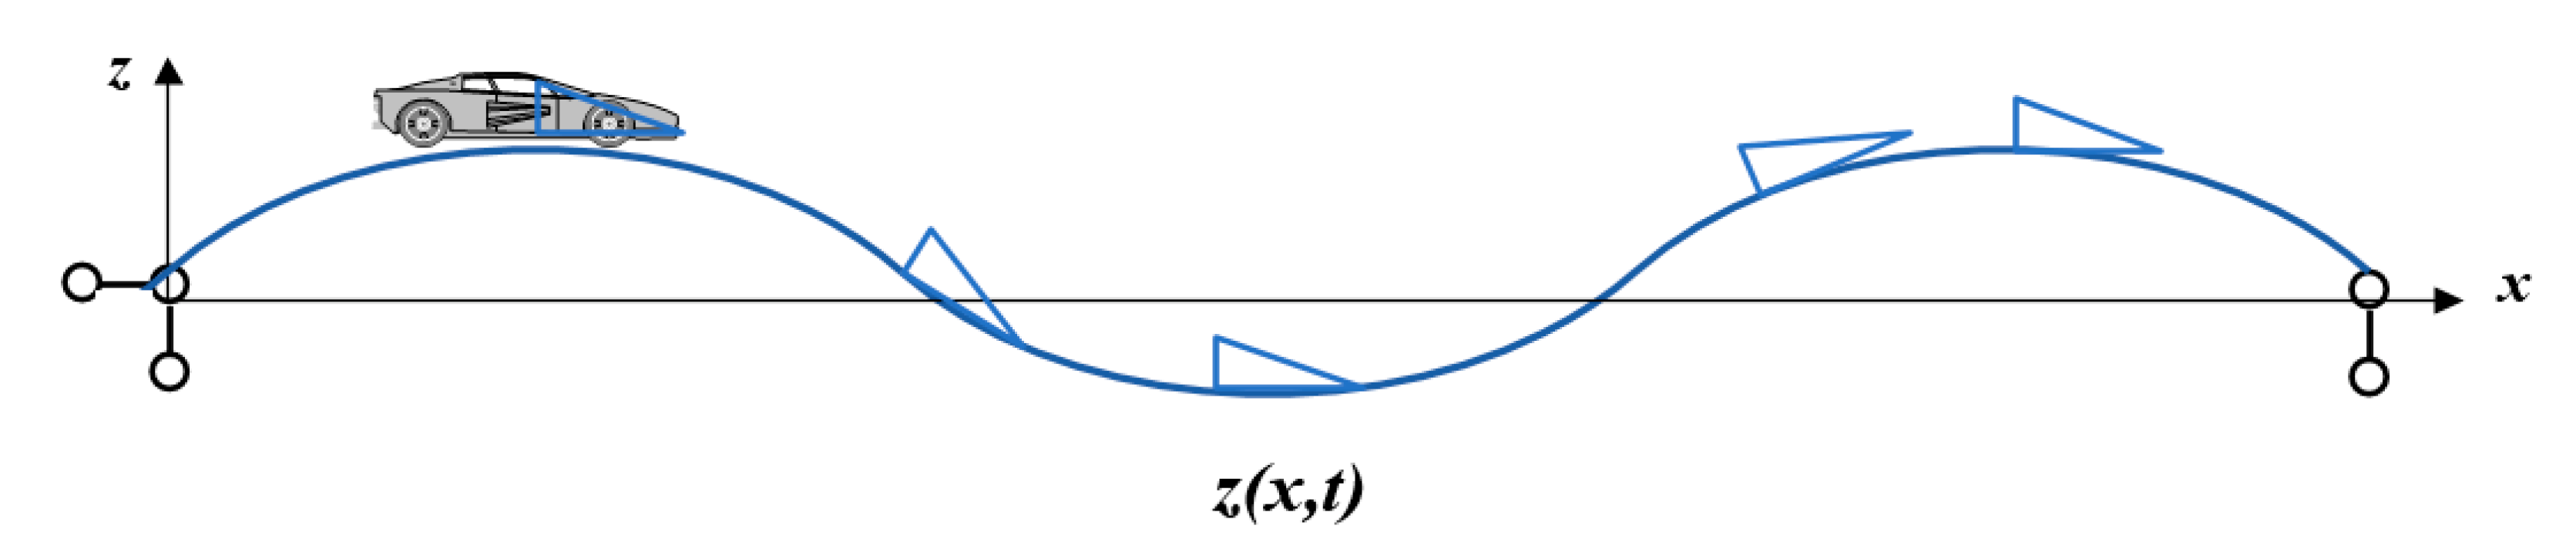
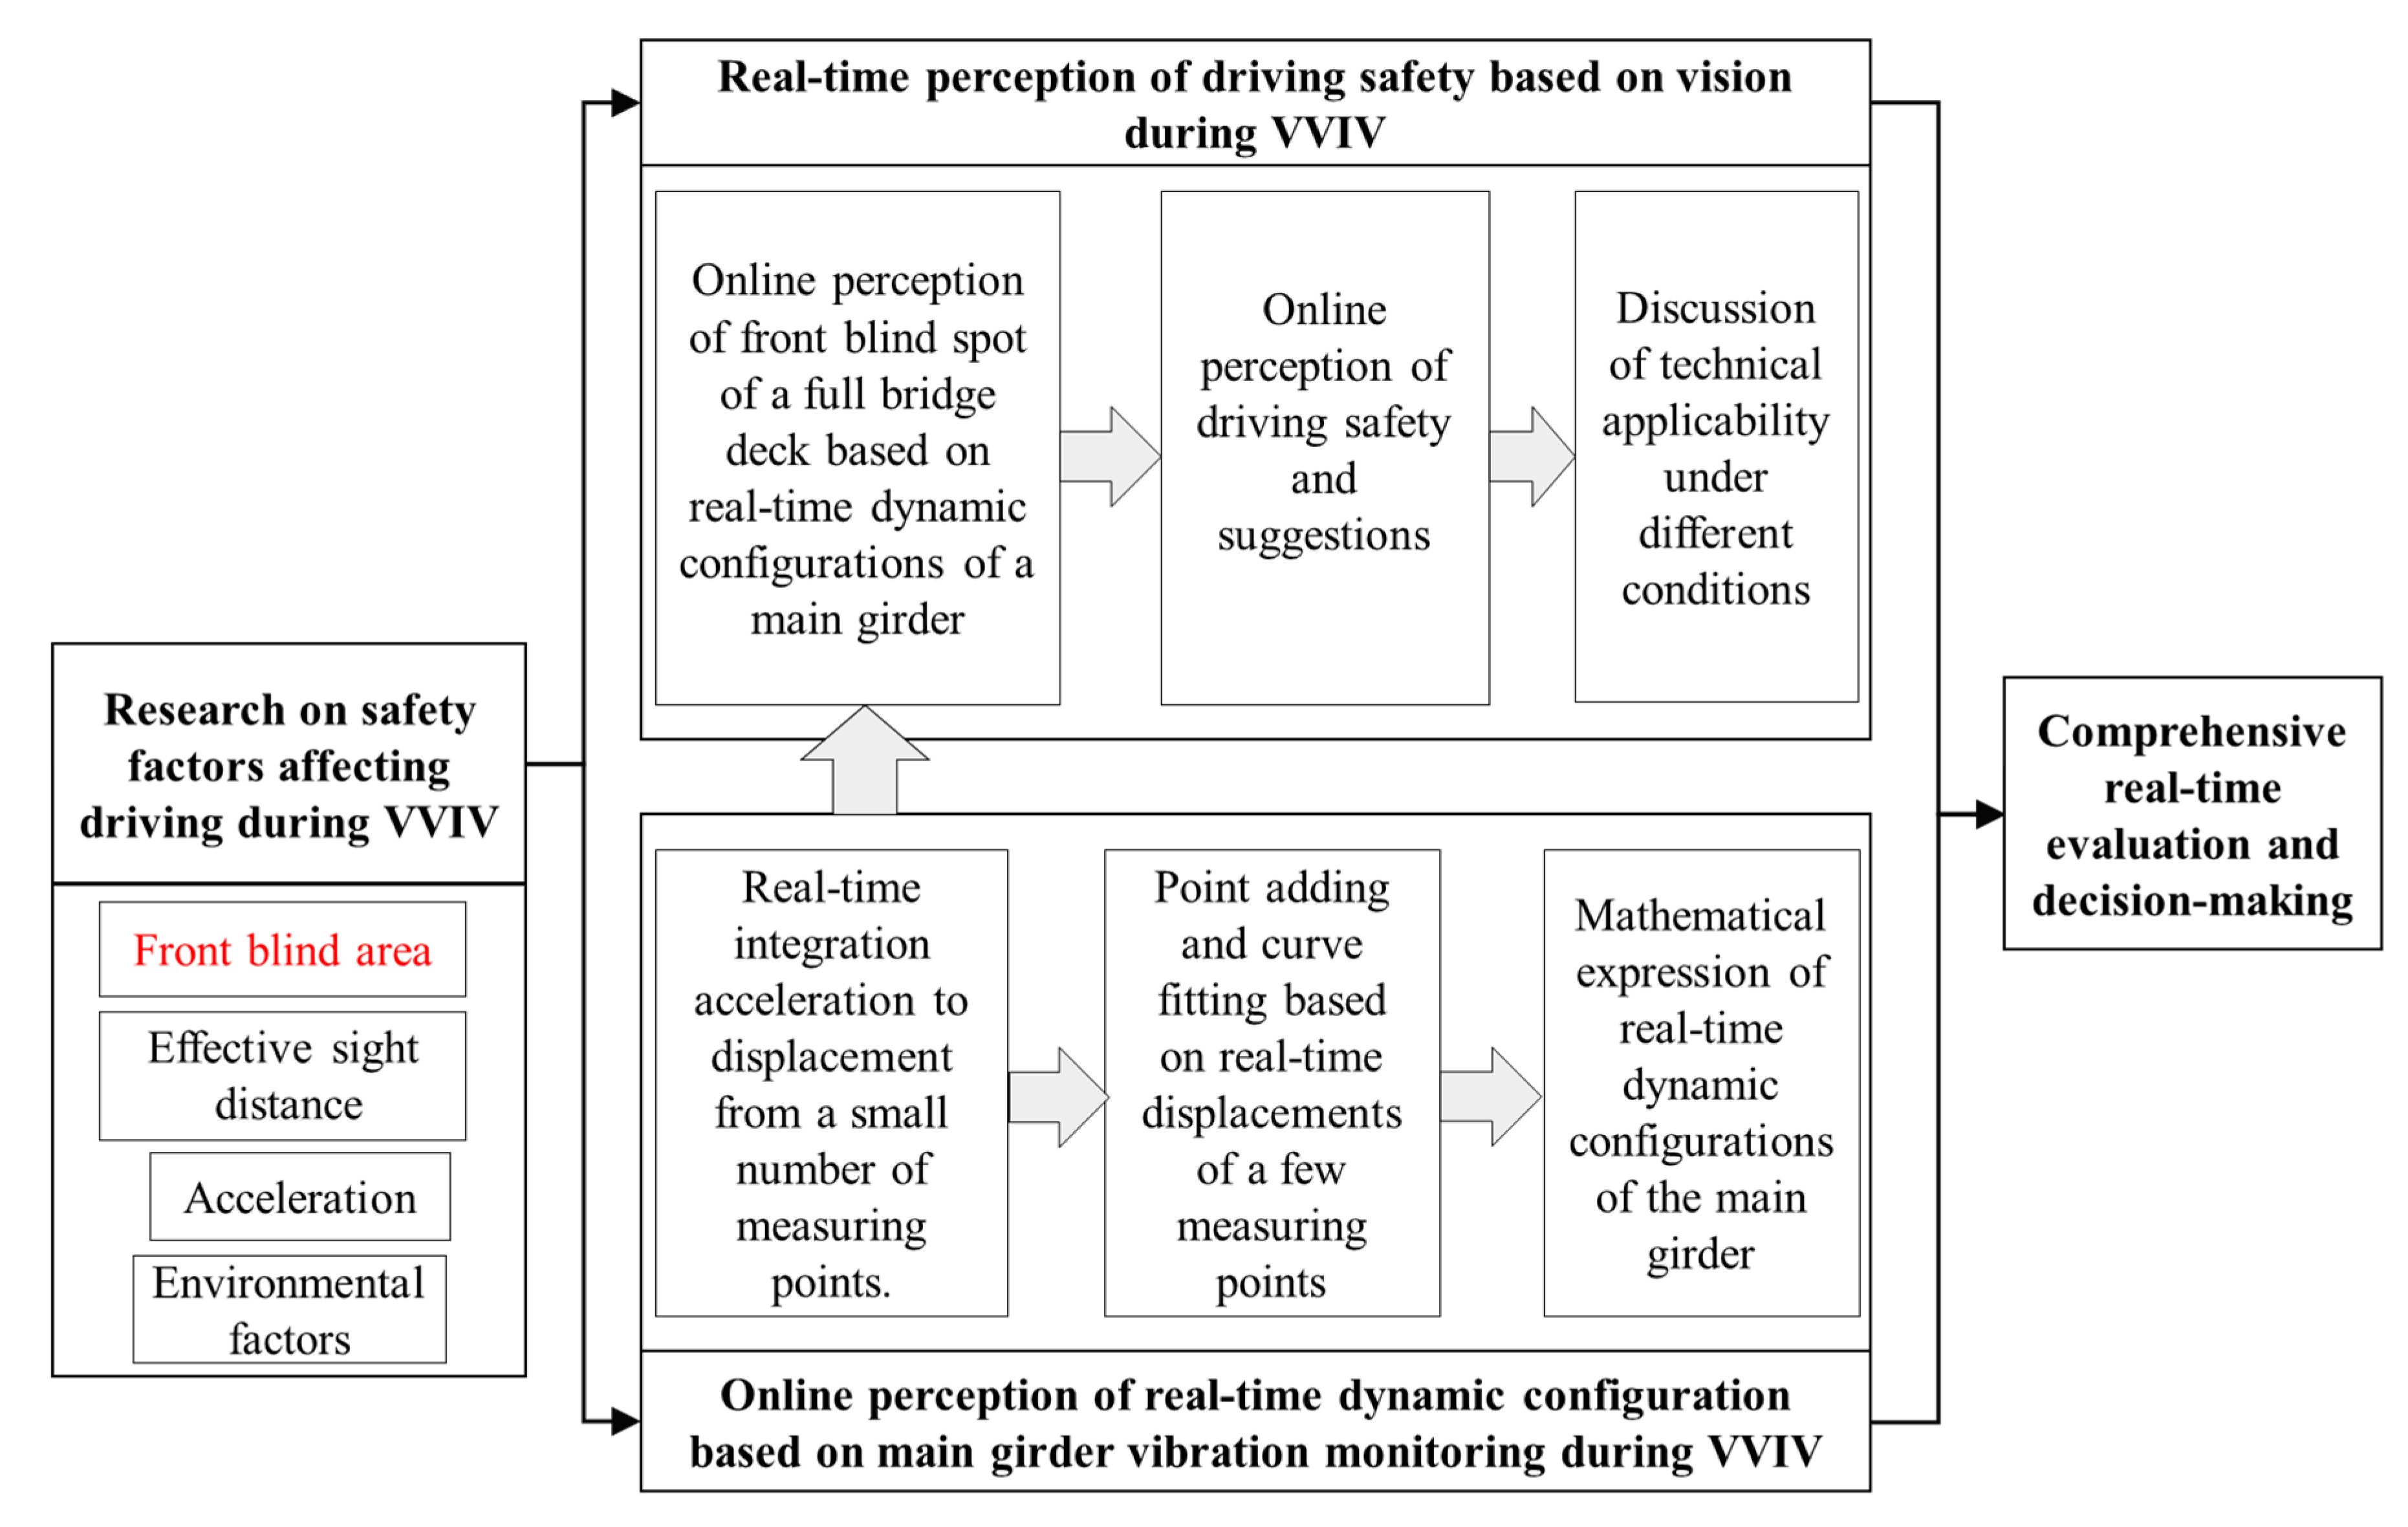
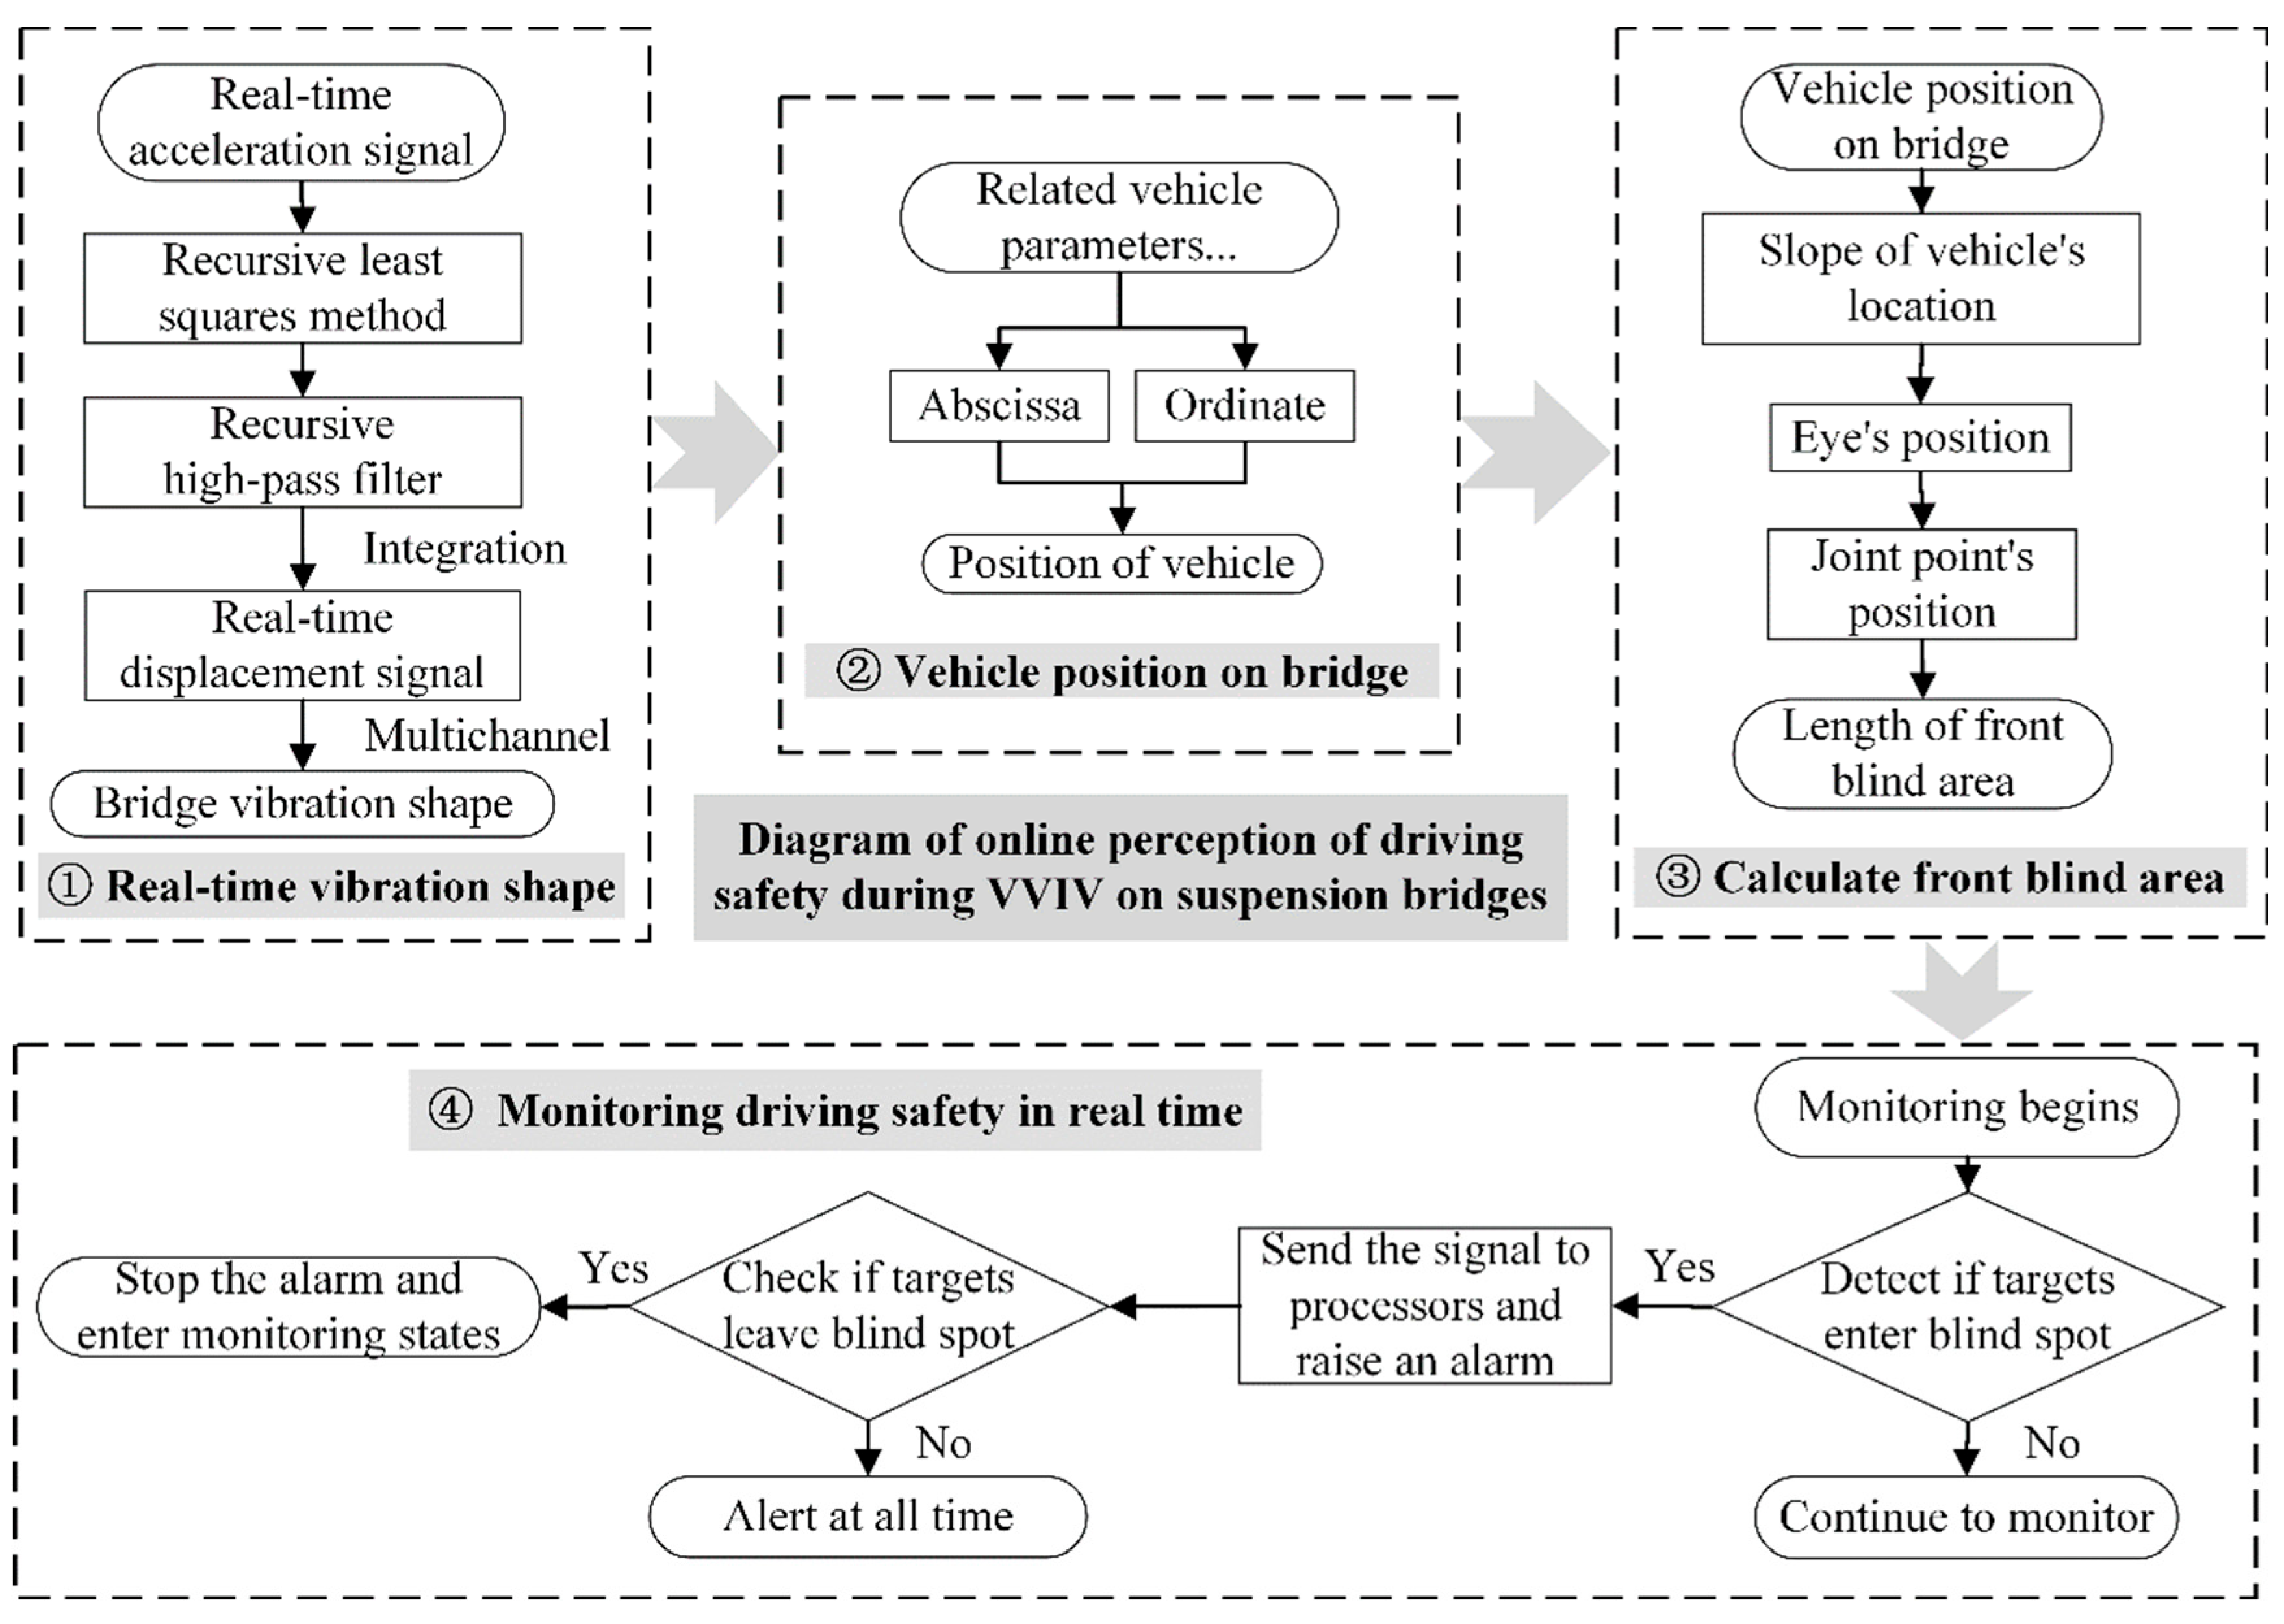
- The module for real-time dynamic configurations: This module is used to realize dynamic configurations in real time. The method employs the recursive least squares method to correct the data baseline, filters the low-frequency noise of the monitoring acceleration signal through recursive high-pass filtering, and then synchronously integrates the acceleration signals to obtain the dynamic displacements of the main beam at multiple positions. With displacements serving as the controlled points, the dynamic configurations in real time are generated by function fitting.
- (2)
- The module of relative positions of the vehicle on the main beam: Via the vehicle entering the bridge as the starting time, multiply the vehicle speed by the time to determine the abscissa of the vehicle. After placing the abscissa into the dynamic configuration obtained from the previous module, the vehicle’s ordinate on the bridge is obtained.
- (3)
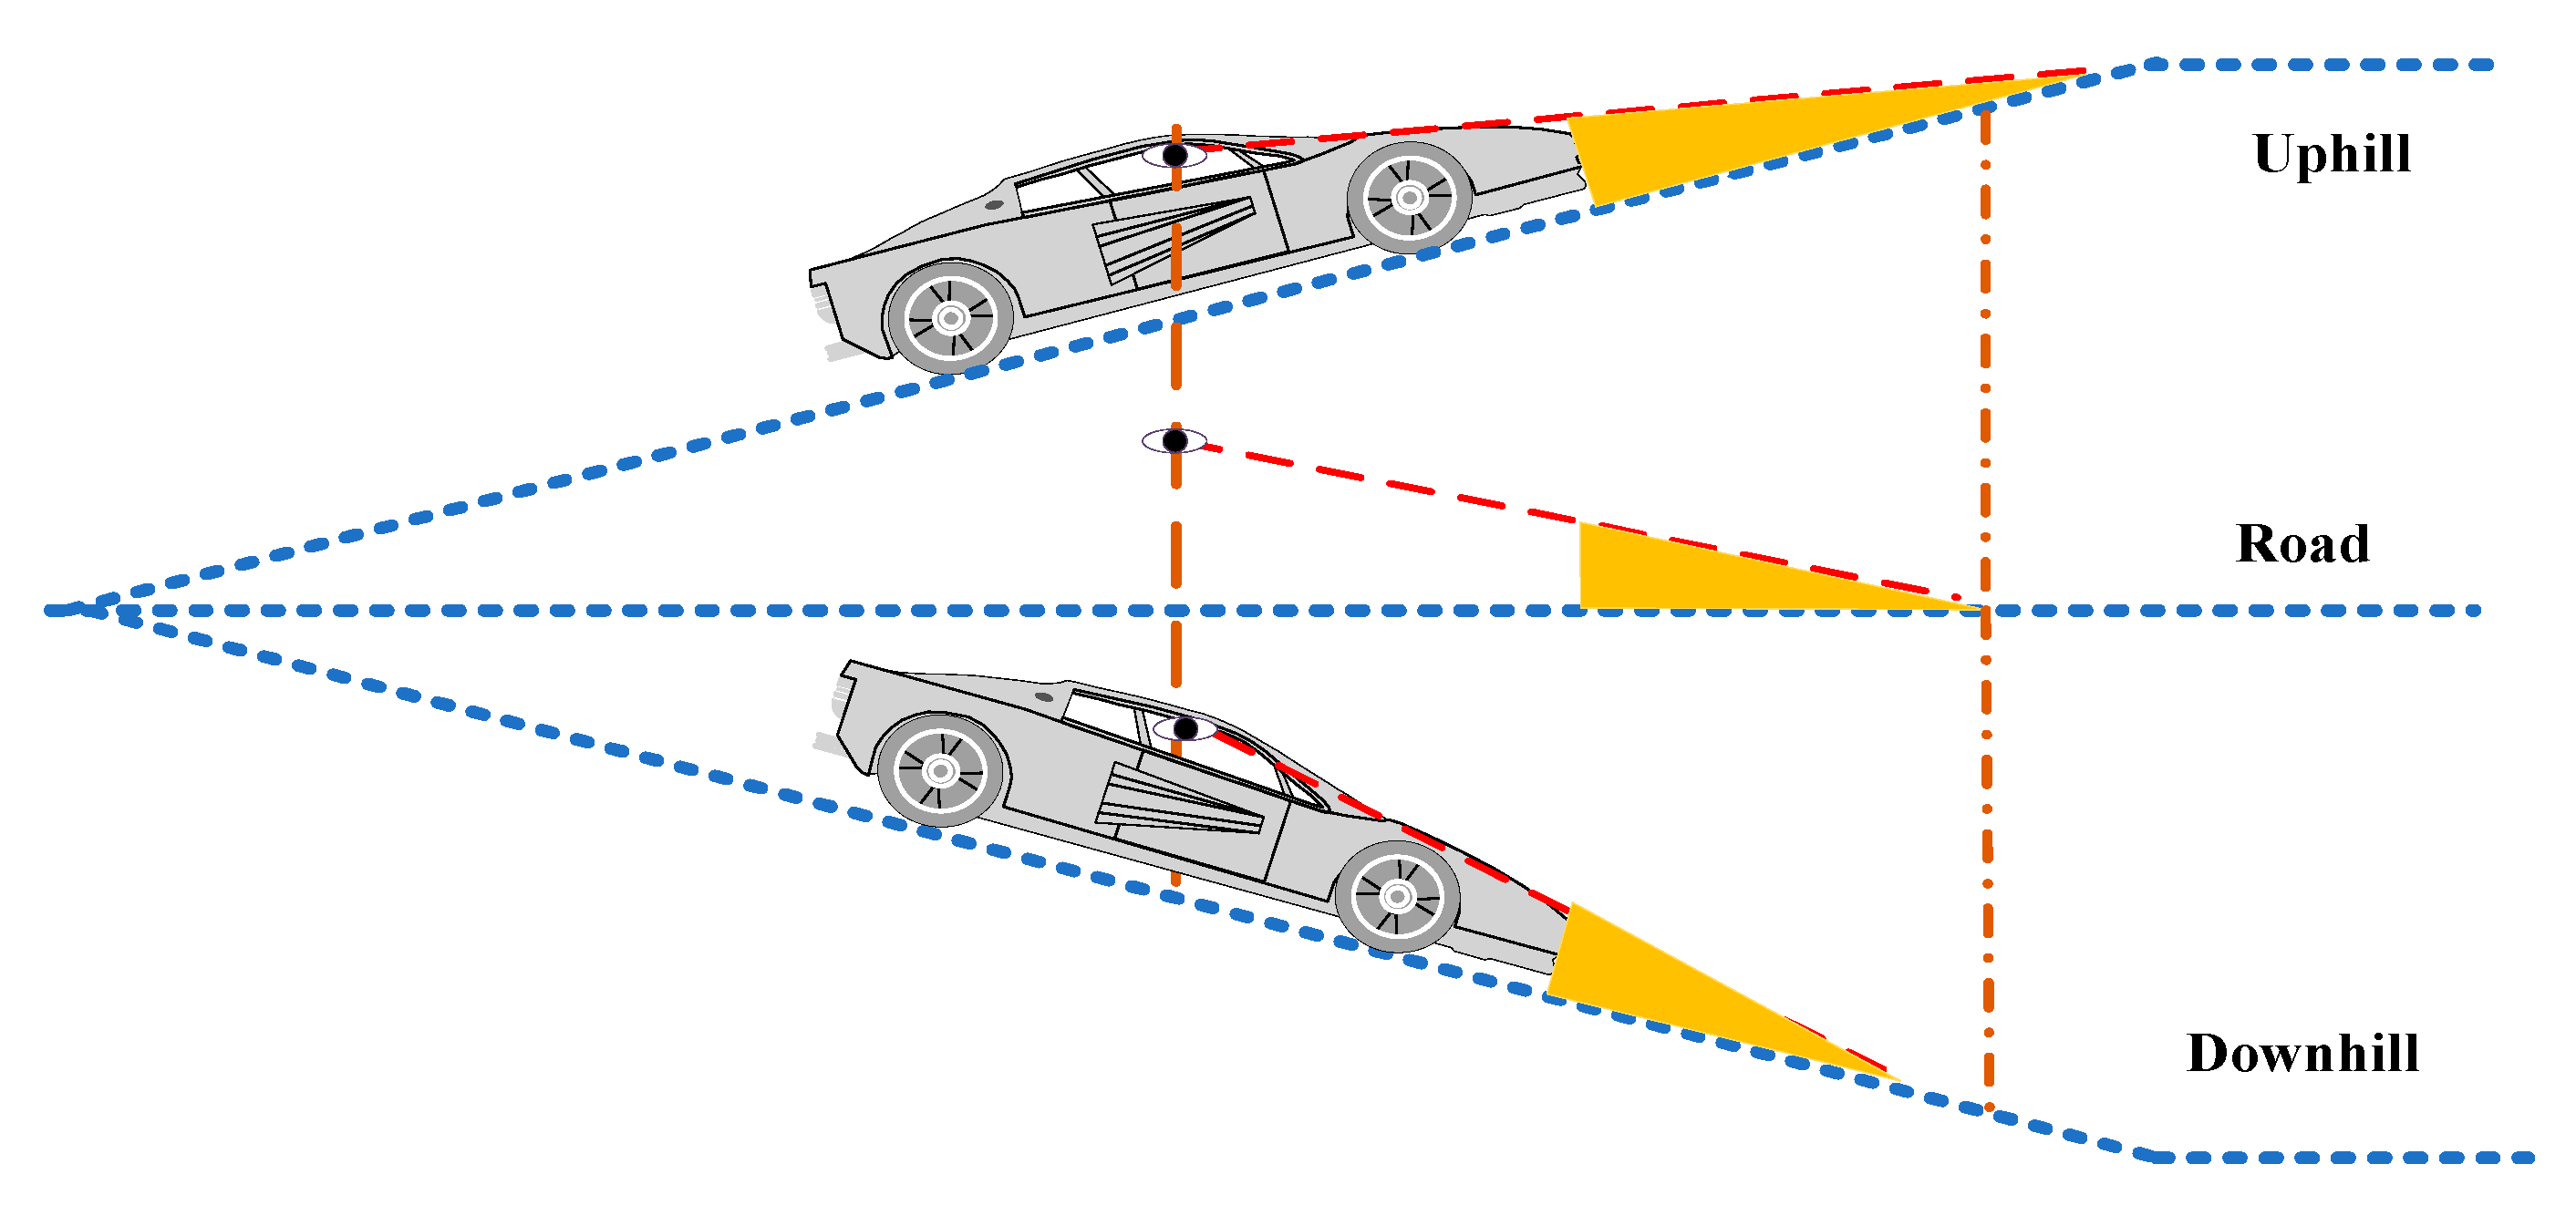
- The module of the front blind area under VVIV: From the previous module, the position of the car on the bridge in real time is determined. Then, the angle α between the vehicle and the horizontal line is calculated from the slope of the car position. Next, the slope of the sightline is calculated by subtracting the angle . Lastly, from this angle, the eye position is calculated according to the eye height. Following this, the intersection between the sightline and the dynamic configuration is determined, and the front blind spot is calculated.
- (4)
- The module for monitoring driving safety in real time: In the environment where the driving safety monitoring system is utilized [34], the detected objects (person, dog, cat, etc.) enter the driver’s blind area. The sensor captures the unique wavelengths of infrared rays emitted by these mammals, and the sensor triggers the alarm module, completing the detection–processing–alarm cycle. The sensor remains silent if no object enters the blind area. Via the real-time information of the acceleration sensors in the bridge health monitoring system, the driver’s front blind area of vision is sensed online. Then, the blind area is transmitted to the intelligent algorithm of the vehicle by wireless communication, such as 5G, to monitor driving safety. Vehicle–bridge synergy can provide a new means of detecting blind spots, integrating traffic into a whole, facilitating traffic management, and assisting the construction of smart cities.
4. Application and Discussion
4.1. Framework for the Application of the Real Bridge
4.2. Discussion of Technical Applicability under Different Conditions
- A.
- Online perception of front blind area under different models
- B.
- Online perception of front blind area at different vehicle speeds
- C.
- Online perception of front blind area at different times of vehicle entry to the bridge
5. Conclusions
Author Contributions
Funding
Institutional Review Board Statement
Informed Consent Statement
Data Availability Statement
Conflicts of Interest
References
- Larsen, A.; Esdahl, S.; Andersen, J.E.; Vejrum, T. Storebælt Suspension Bridge–Vortex Shedding Excitation and Mitigation by Guide Vanes. J. Wind Eng. Ind. Aerodyn. 2000, 88, 283–296. [Google Scholar] [CrossRef]
- Selvakarthi, M.D.; Sivabalaselvamani, D.D.; Nivetha, V.; Pratheep, M.S.; Pravin, M.S.; Thiyaneshwaran, M.S.R. A Novel Approach Using Sensor Technologies for Enhancing Accident Safety Assistance System in Different Environments. Int. J. Sci. Technol. Res. 2020, 9, 6. [Google Scholar]
- Mazankova, M.J. Risks from Blind Spots of Trucks. In Proceedings of the International Conference on Military Technologies (ICMT) 2015, Brno, Czech Republic, 19–21 May 2015; pp. 1–6. [Google Scholar]
- Obeidat, M.S.; Altheeb, N.F.; Momani, A.; Al Theeb, N. Analyzing the Invisibility Angles Formed by Vehicle Blind Spots to Increase Driver’s Field of View and Traffic Safety. Int. J. Occup. Saf. Ergon. 2022, 28, 129–138. [Google Scholar] [CrossRef]
- Rogé, J.; Pébayle, T.; Lambilliotte, E.; Spitzenstetter, F.; Giselbrecht, D.; Muzet, A. Influence of Age, Speed and Duration of Monotonous Driving Task in Traffic on the Driver’s Useful Visual Field. Vision Res. 2004, 44, 2737–2744. [Google Scholar] [CrossRef]
- Qin, L.; Dong, L.-L.; Xu, W.-H.; Zhang, L.-D.; Leon, A. Influence of Vehicle Speed on the Characteristics of Driver’s Eye Movement at a Highway Tunnel Entrance during Day and Night Conditions: A Pilot Study. Int. J. Environ. Res. Public. Health 2018, 15, 656. [Google Scholar] [CrossRef]
- Yang, S.; Wilson, K.; Roady, T.; Kuo, J.; Lenné, M.G. Beyond Gaze Fixation: Modeling Peripheral Vision in Relation to Speed, Tesla Autopilot, Cognitive Load, and Age in Highway Driving. Accid. Anal. Prev. 2022, 171, 106670. [Google Scholar] [CrossRef]
- Wu, F.; Fu, R.; Ma, Y.; Wang, C.; Zhang, Z. Relationship between Speed Perception and Eye Movement—A Case Study of Crash-Involved and Crash-Not-Involved Drivers in China. PLoS ONE 2020, 15, e0229650. [Google Scholar] [CrossRef]
- Yu, H.; Wang, B.; Zhang, G.; Li, Y.; Chen, X. Ride Comfort Assessment of Road Vehicle Running on Long-Span Bridge Subjected to Vortex-Induced Vibration. Wind Struct. 2020, 31, 393–402. [Google Scholar] [CrossRef]
- Thorsen, M.J.; Sævik, S.; Larsen, C.M. Fatigue Damage from Time Domain Simulation of Combined In-Line and Cross-Flow Vortex-Induced Vibrations. Mar. Struct. 2015, 41, 200–222. [Google Scholar] [CrossRef]
- Berthellemy, J.; Siegert, D.; Berton, É.; Quentin, P. Stockbridge Dampers for Extending the Fatigue Life of a Cable at St Nazaire Cable Stayed Bridge. Eng. Fail. Anal. 2022, 141, 106581. [Google Scholar] [CrossRef]
- Haldar, P.; Karmakar, S. State of the Art Review of Aerodynamic Effects on Bridges. J. Inst. Eng. India Ser. A 2022, 103, 943–960. [Google Scholar] [CrossRef]
- Chen, Z.; Huang, Z. Analysis of the main influencing factors of the vertical bending vortex vibration limit of long-span bridges. Chin. J. Highw. 2015, 28, 30–37. [Google Scholar] [CrossRef]
- Chen, S. Calculation of bridge vertical vortex vibration limit value considering driving safety. Zhongwai Highw. 2019, 39, 114–117. [Google Scholar] [CrossRef]
- Cao, S.; Zhang, Y.; Tian, H.; Ma, R.; Chang, W.; Chen, A. Drive Comfort and Safety Evaluation for Vortex-Induced Vibration of a Suspension Bridge Based on Monitoring Data. J. Wind Eng. Ind. Aerodyn. 2020, 204, 104266. [Google Scholar] [CrossRef]
- Ehlgen, T.; Pajdla, T.; Ammon, D. Eliminating Blind Spots for Assisted Driving. IEEE Trans. Intell. Transp. Syst. 2008, 9, 657–665. [Google Scholar] [CrossRef]
- Cheng, Y.K.; Wong, K.H.; Tao, C.H.; Tam, C.N.; Tam, Y.Y.; Tsang, C.N. Front Blind Spot Crashes in Hong Kong. Forensic Sci. Int. 2016, 266, 102–108. [Google Scholar] [CrossRef]
- GB 11562-2014; Motor Vehicles-Forward Visibility for Drivers-Requirements and Measurement Methods. ANSI: New York, NY, USA, 2014.
- Zhao, L.; Ge, Y. Emergency Measures for Vortex-Induced Vibration of Humen Bridge. Mater. Res. 2020, 9, 25–28. [Google Scholar]
- GT02 Series Force Balance (Servo) Accelerometer User Manual. Available online: https://www.docin.com/p-227296265.html (accessed on 18 August 2022).
- Tongji University Advanced Structural Dynamics of Bridges. In Advanced Structural Dynamics of Bridges; People’s Communications Publishing House Co., Ltd.: Beijing, China, 2020.
- Zheng, W.; Dan, D.; Cheng, W.; Xia, Y. Real-Time Dynamic Displacement Monitoring with Double Integration of Acceleration Based on Recursive Least Squares Method. Measurement 2019, 141, 460–471. [Google Scholar] [CrossRef]
- Continuous Monitoring of Ground-Motion Parameters|Bulletin of the Seismological Society of America|GeoScienceWorld. Available online: https://pubs.geoscienceworld.org/ssa/bssa/article/89/1/311/120463/Continuous-monitoring-of-ground-motion-parameters (accessed on 11 July 2022).
- Shanks, J.L. Recursion Filters for Digital Processing. Geophysics 1967, 32, 33–51. [Google Scholar] [CrossRef]
- Abuelma’atti, M.T. A Simple Algorithm for Fitting Measured Data to Fourier-series Models. Int. J. Math. Educ. Sci. Technol. 1993, 24, 107–112. [Google Scholar] [CrossRef]
- Dyer, S.A.; He, X. Cubic-Spline Interpolation: Part 2. IEEE Instrum. Meas. Mag. 2001, 4, 34–36. [Google Scholar] [CrossRef]
- Peter, S. Sine Fitting-File Exchange-MATLAB Central. Available online: https://www.mathworks.com/matlabcentral/fileexchange/66793-sine-fitting (accessed on 18 August 2022).
- Hwang, Y.C.; Kim, S.; Kim, H.-K. Cause Investigation of High-Mode Vortex-Induced Vibration in a Long-Span Suspension Bridge. Struct. Infrastruct. Eng. 2020, 16, 84–93. [Google Scholar] [CrossRef]
- Wang, W.; Wang, X.; Hua, X.; Song, G.; Chen, Z. Vibration Control of Vortex-Induced Vibrations of a Bridge Deck by a Single-Side Pounding Tuned Mass Damper. Eng. Struct. 2018, 173, 61–75. [Google Scholar] [CrossRef]
- Monitoring, Intelligent Perception, and Early Warning of Vortex-Induced Vibration of Suspension Bridge-Dan-2022-Structural Control and Health Monitoring-Wiley Online Library. Available online: https://onlinelibrary.wiley.com/doi/full/10.1002/stc.2928 (accessed on 11 July 2022).
- Yu, X.; Dan, D. Block-Wise Recursive APES Aided with Frequency-Squeezing Postprocessing and the Application in Online Analysis of Vibration Monitoring Signals. Mech. Syst. Signal Process. 2022, 162, 108063. [Google Scholar] [CrossRef]
- Zhang, M.; Wu, T.; Xu, F. Vortex-Induced Vibration of Bridge Decks: Describing Function-Based Model. J. Wind Eng. Ind. Aerodyn. 2019, 195, 104016. [Google Scholar] [CrossRef]
- Dan, D.; Yu, X.; Han, F.; Xu, B. Research on Dynamic Behavior and Traffic Management Decision-Making of Suspension Bridge after Vortex-Induced Vibration Event. Struct. Health Monit. 2022, 21, 872–886. [Google Scholar] [CrossRef]
- Das, P.D.; Sengupta, S. Proposing the Systems to Provide Protection of Vehicles against Theft and Accident. In Proceedings of the 2016 IEEE International Conference on Recent Trends in Electronics, Information & Communication Technology (RTEICT), Bangalore, India, 20–21 May 2016; pp. 1681–1685. [Google Scholar]

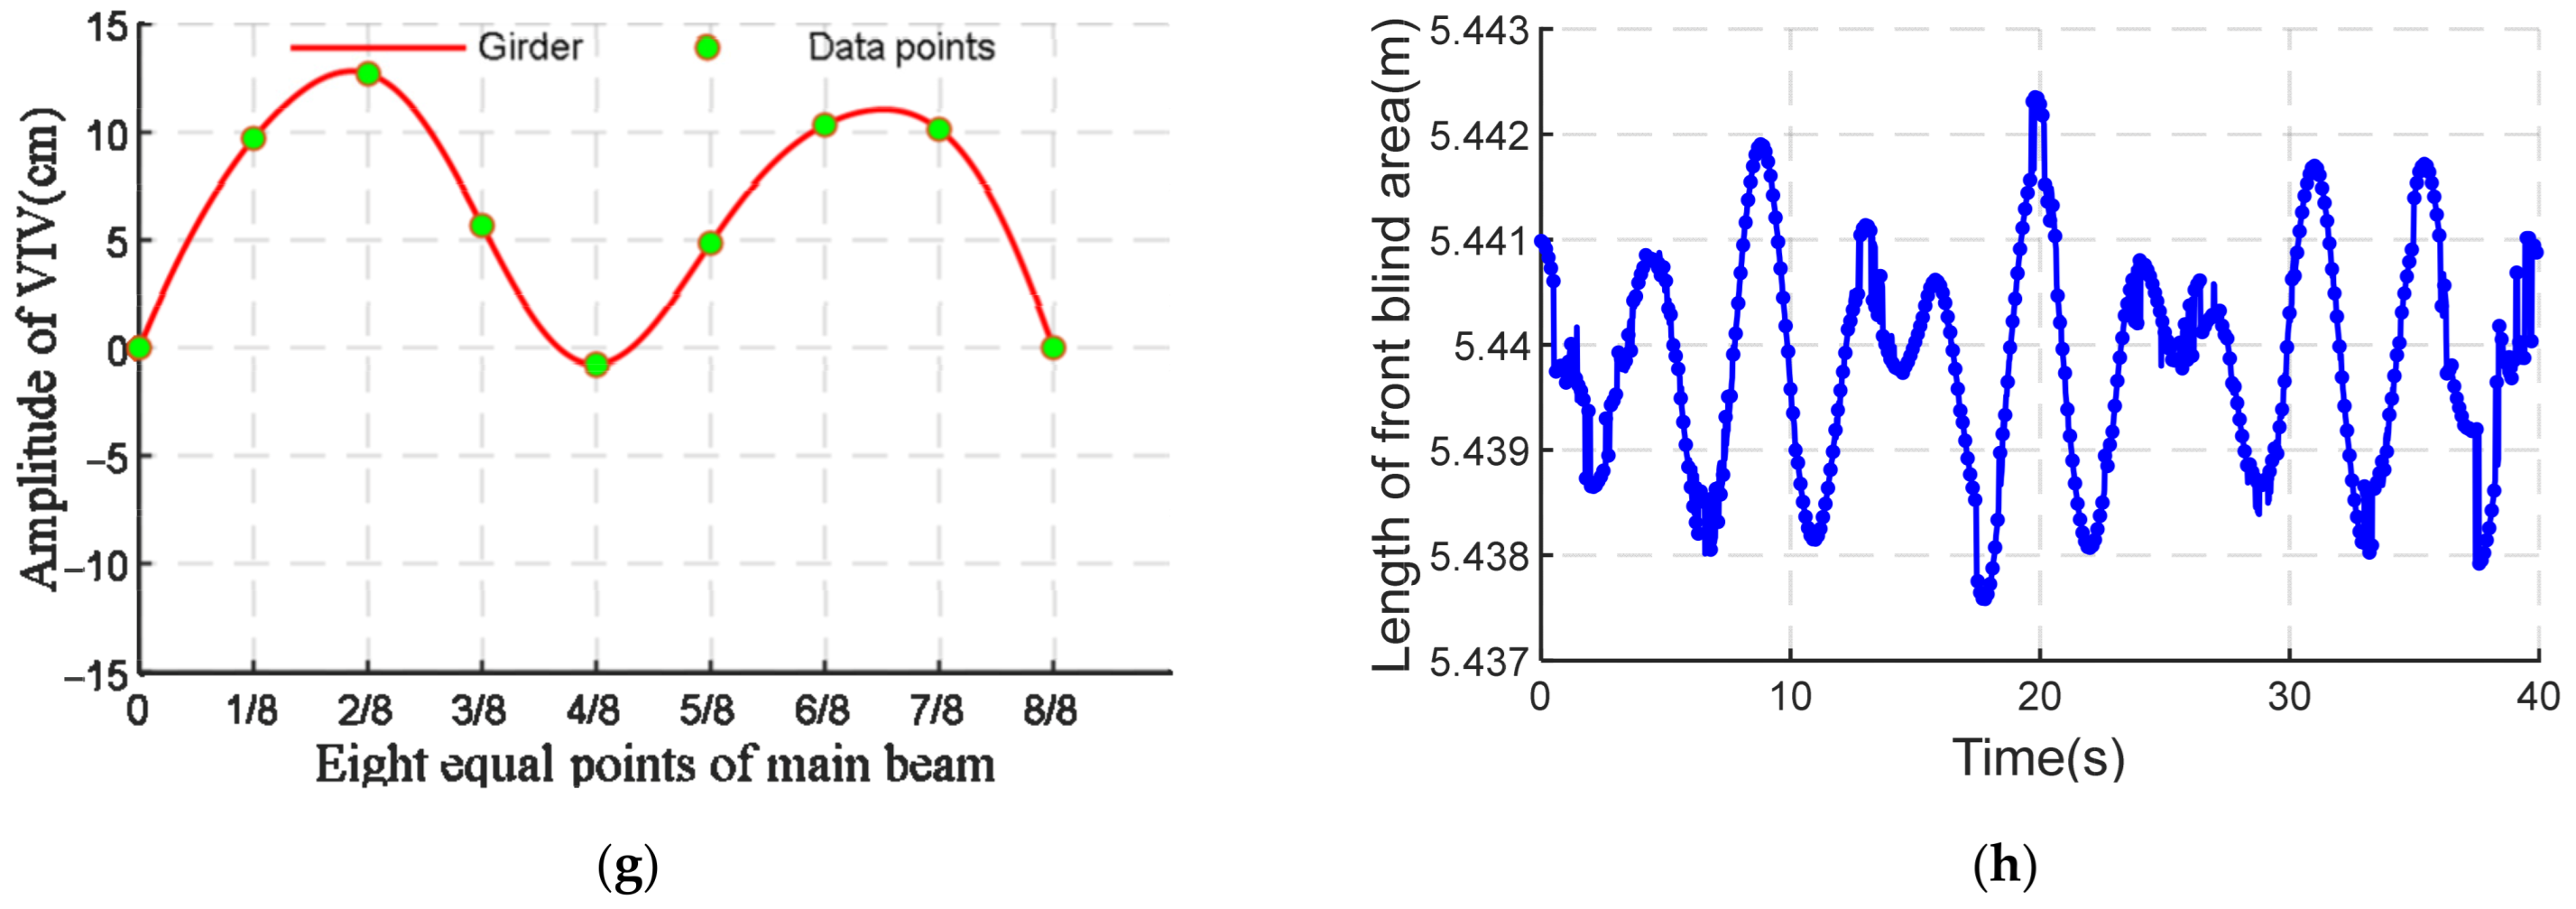
 indicates that the Fourier series fitting function does not pass through control points, but the other two do).
indicates that the Fourier series fitting function does not pass through control points, but the other two do).
indicates that the Fourier series fitting function does not pass through control points, but the other two do).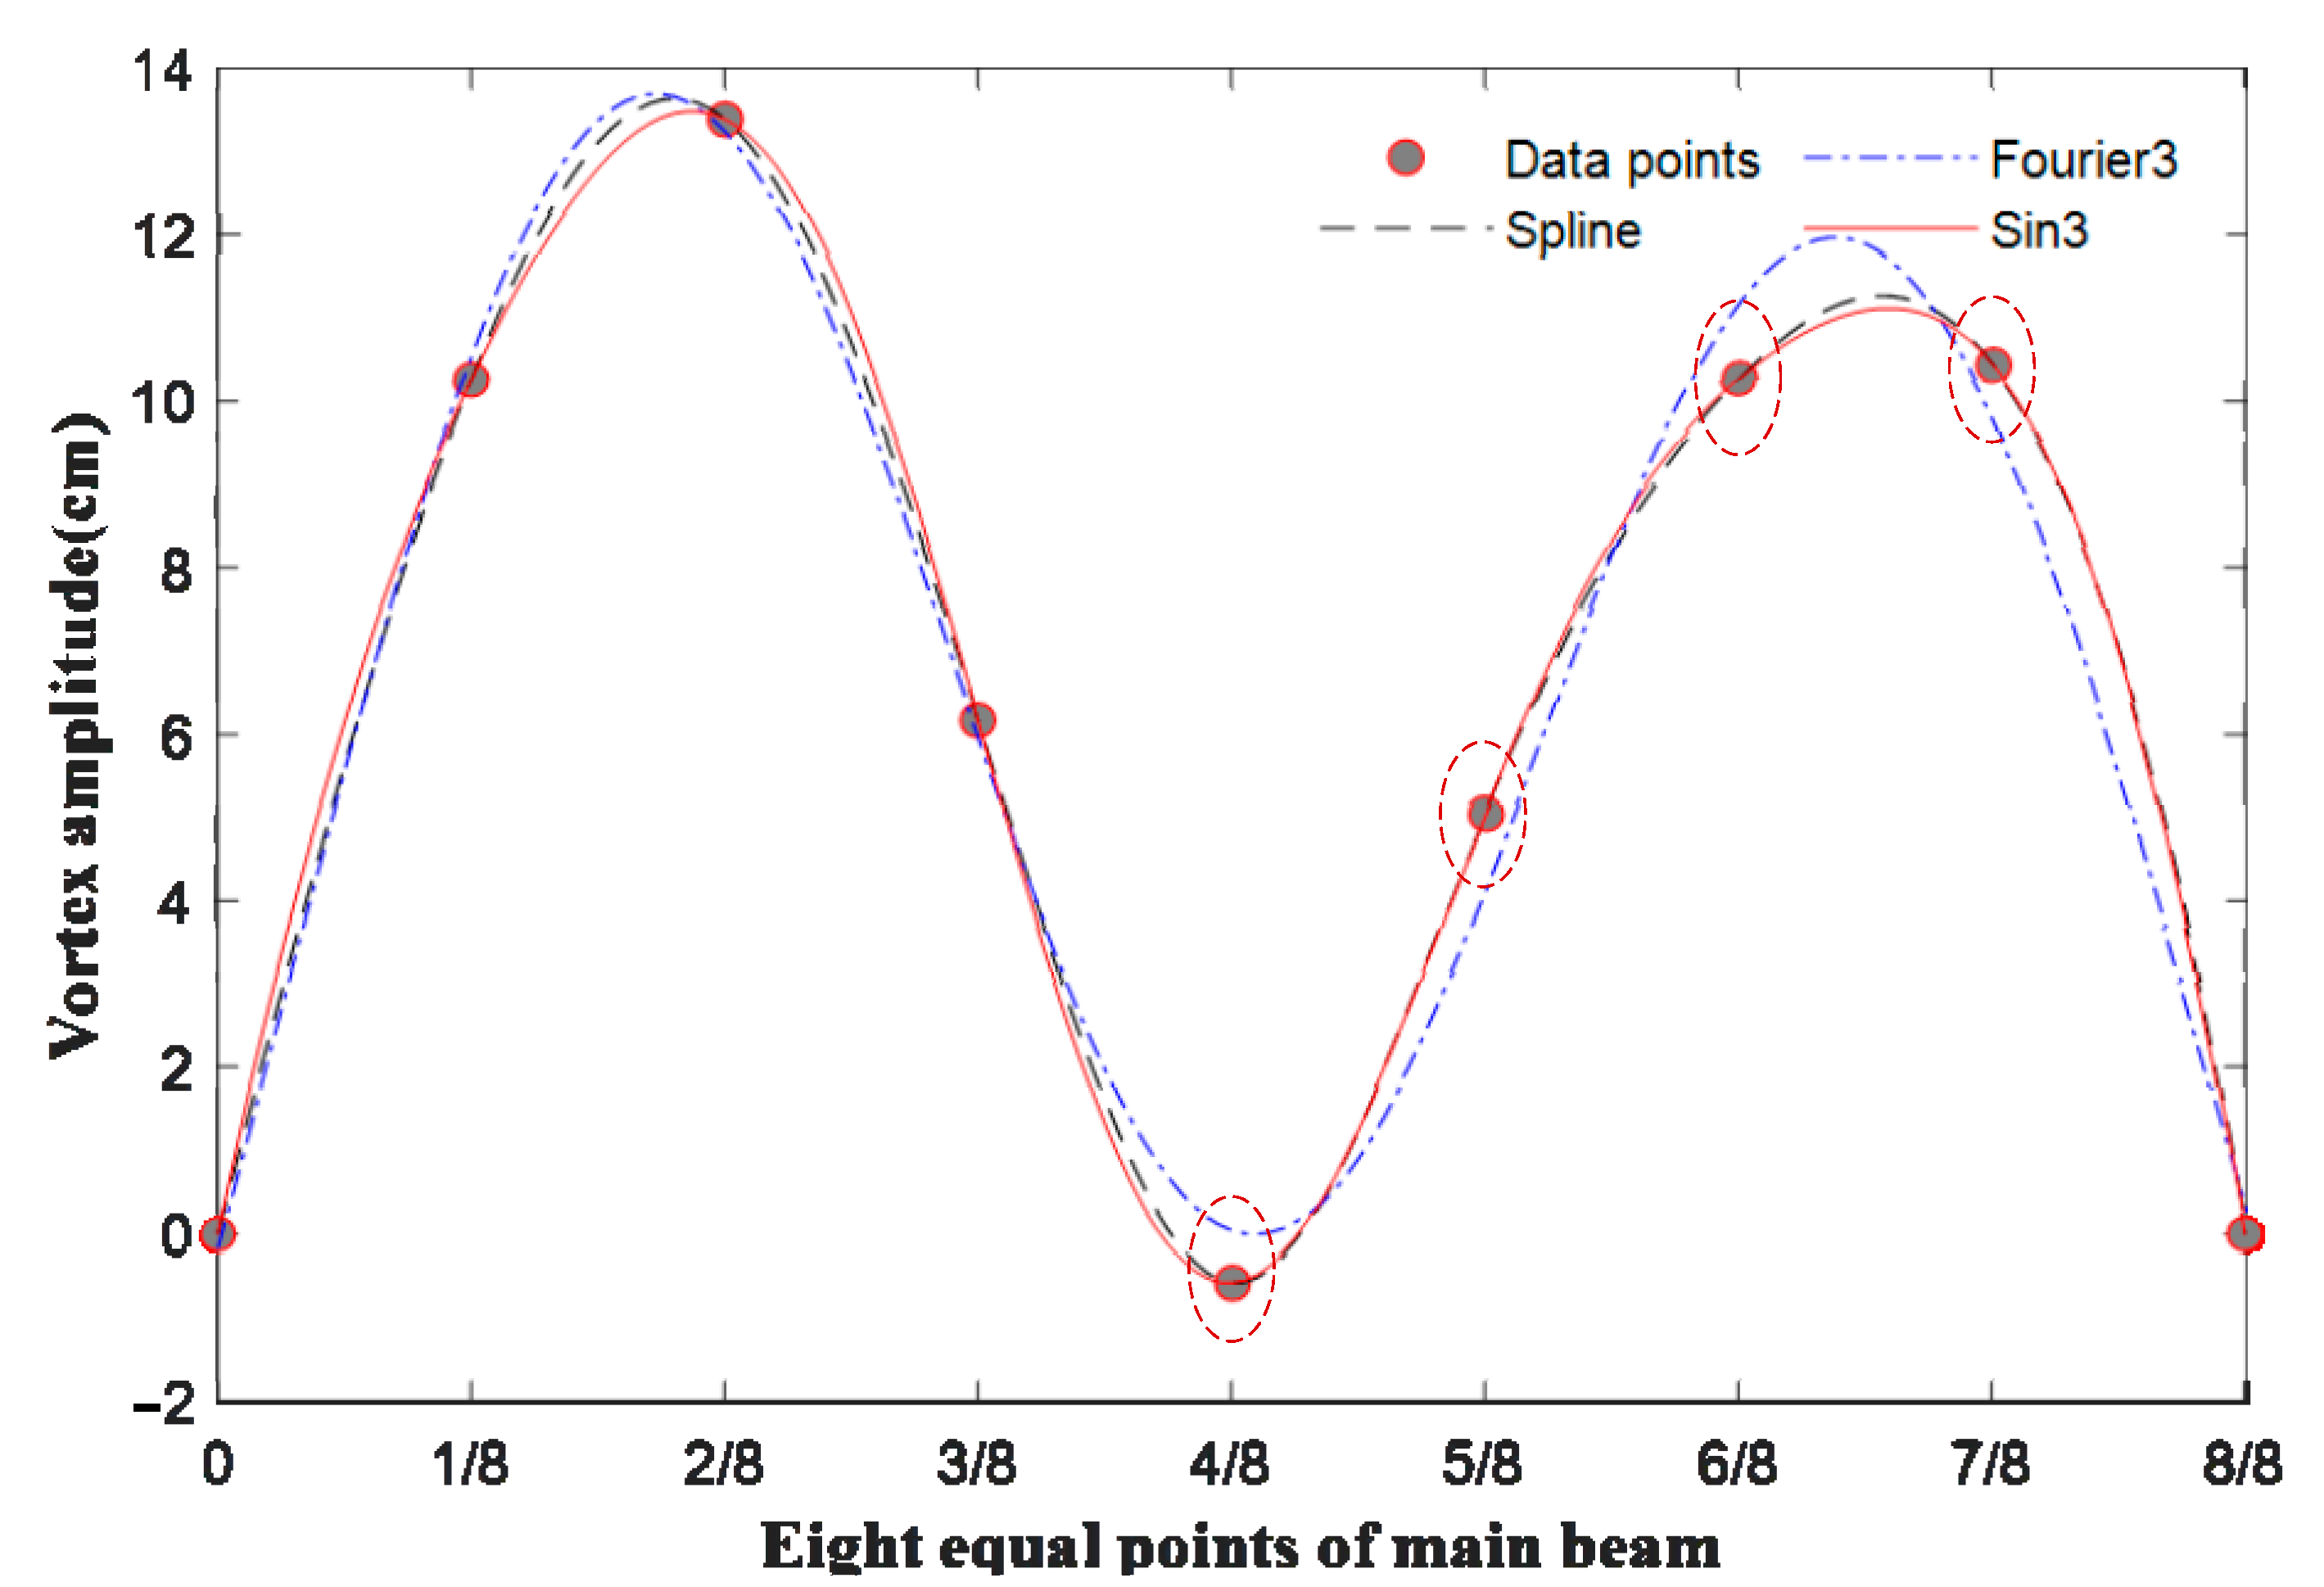

 : dynamic configurations of VVIV;
  : the eye height;
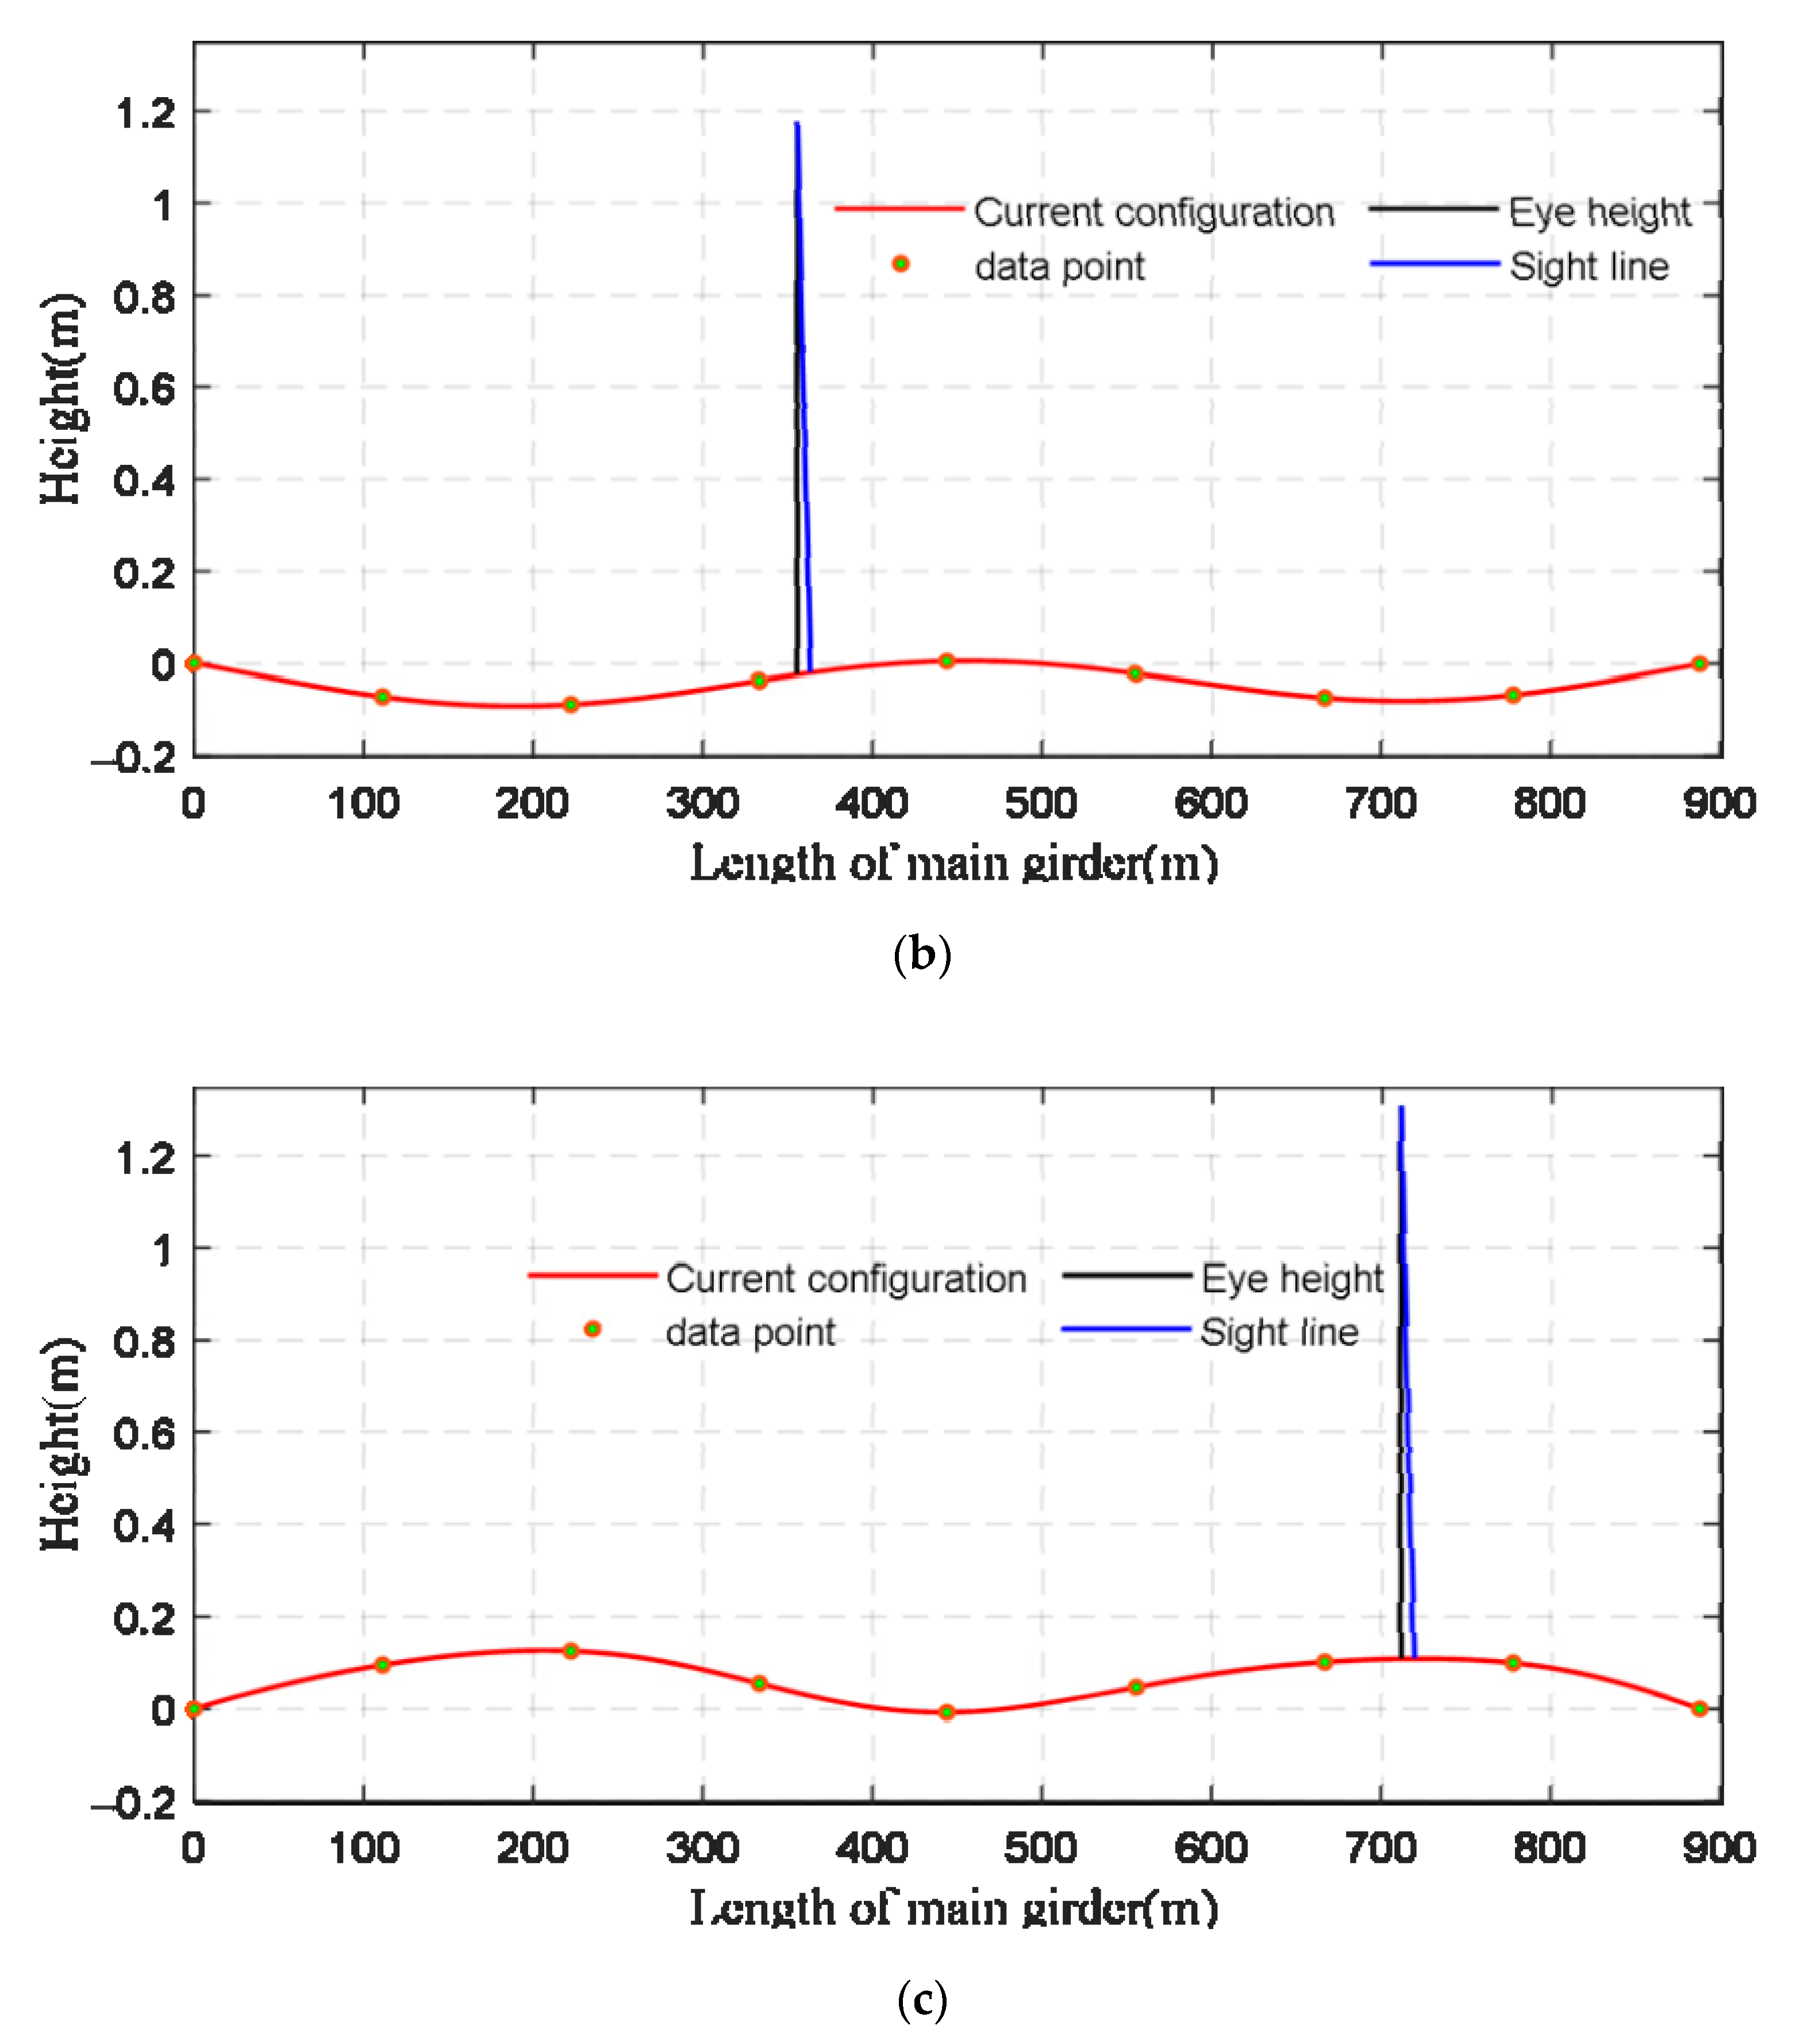
  : the tangent line between eye and car’s front cover). Tangent line intersects the configuration at a point, and the length of front blind area is the distance from the intersection point to car’s head. (a) t = 1.6 s, online perception of the front blind area. (b) t = 16 s, online perception of the front blind area. (c) t = 32 s, online perception of the front blind area.
: dynamic configurations of VVIV; : the eye height; : the tangent line between eye and car’s front cover). Tangent line intersects the configuration at a point, and the length of front blind area is the distance from the intersection point to car’s head. (a) t = 1.6 s, online perception of the front blind area. (b) t = 16 s, online perception of the front blind area. (c) t = 32 s, online perception of the front blind area.
: the tangent line between eye and car’s front cover). Tangent line intersects the configuration at a point, and the length of front blind area is the distance from the intersection point to car’s head. (a) t = 1.6 s, online perception of the front blind area. (b) t = 16 s, online perception of the front blind area. (c) t = 32 s, online perception of the front blind area.
: dynamic configurations of VVIV; : the eye height; : the tangent line between eye and car’s front cover). Tangent line intersects the configuration at a point, and the length of front blind area is the distance from the intersection point to car’s head. (a) t = 1.6 s, online perception of the front blind area. (b) t = 16 s, online perception of the front blind area. (c) t = 32 s, online perception of the front blind area.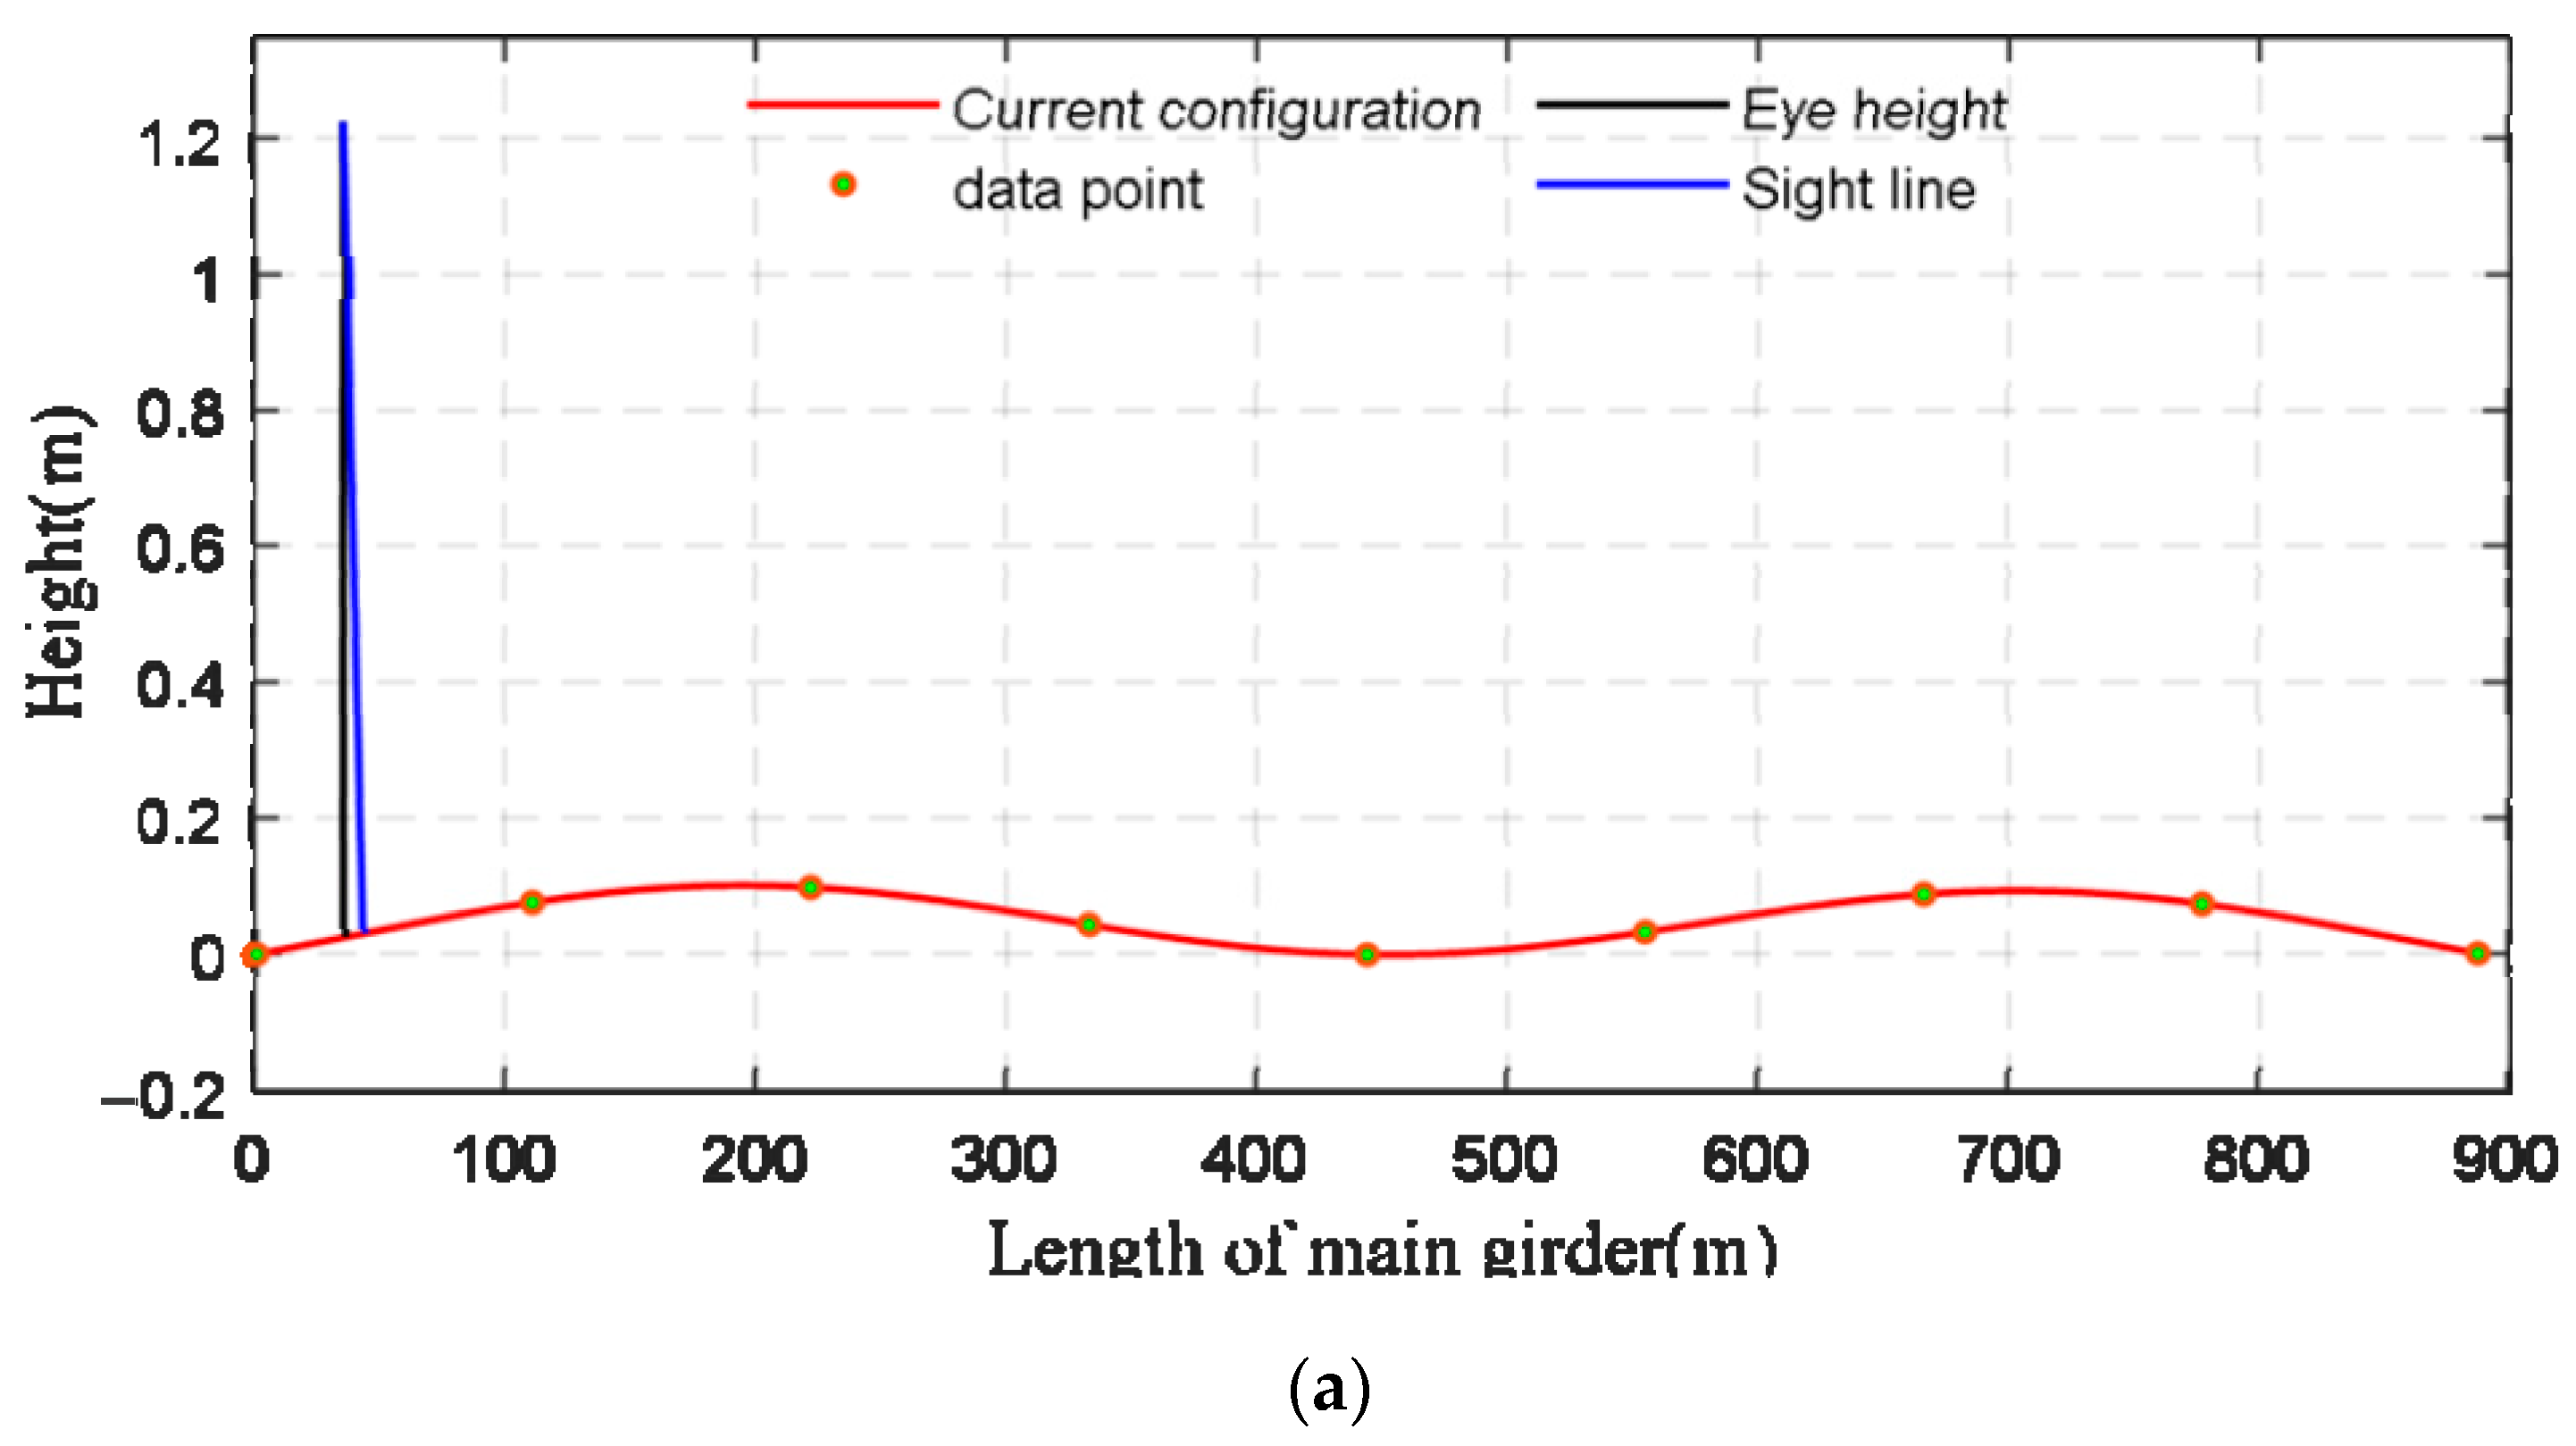


| Index | Main Technical | Range |
|---|---|---|
| 1 | Measuring range | g |
| 2 | Frequency range | Hz |
| 3 | Dynamic range | dB |
| 4 | Sensitivity | V/g |
| 5 | Chiasma interference | |
| 6 | Linearity | |
| 7 | Noise | ug |
| 8 | Temperature drift | %g/°C |
| 9 | Zero drift | g/°C |
| Vehicle Model | Eye Height (m) | Tangent of Included Angle | Length of Vehicle’s Cover (m) | Length of Front Blind Area (m) |
|---|---|---|---|---|
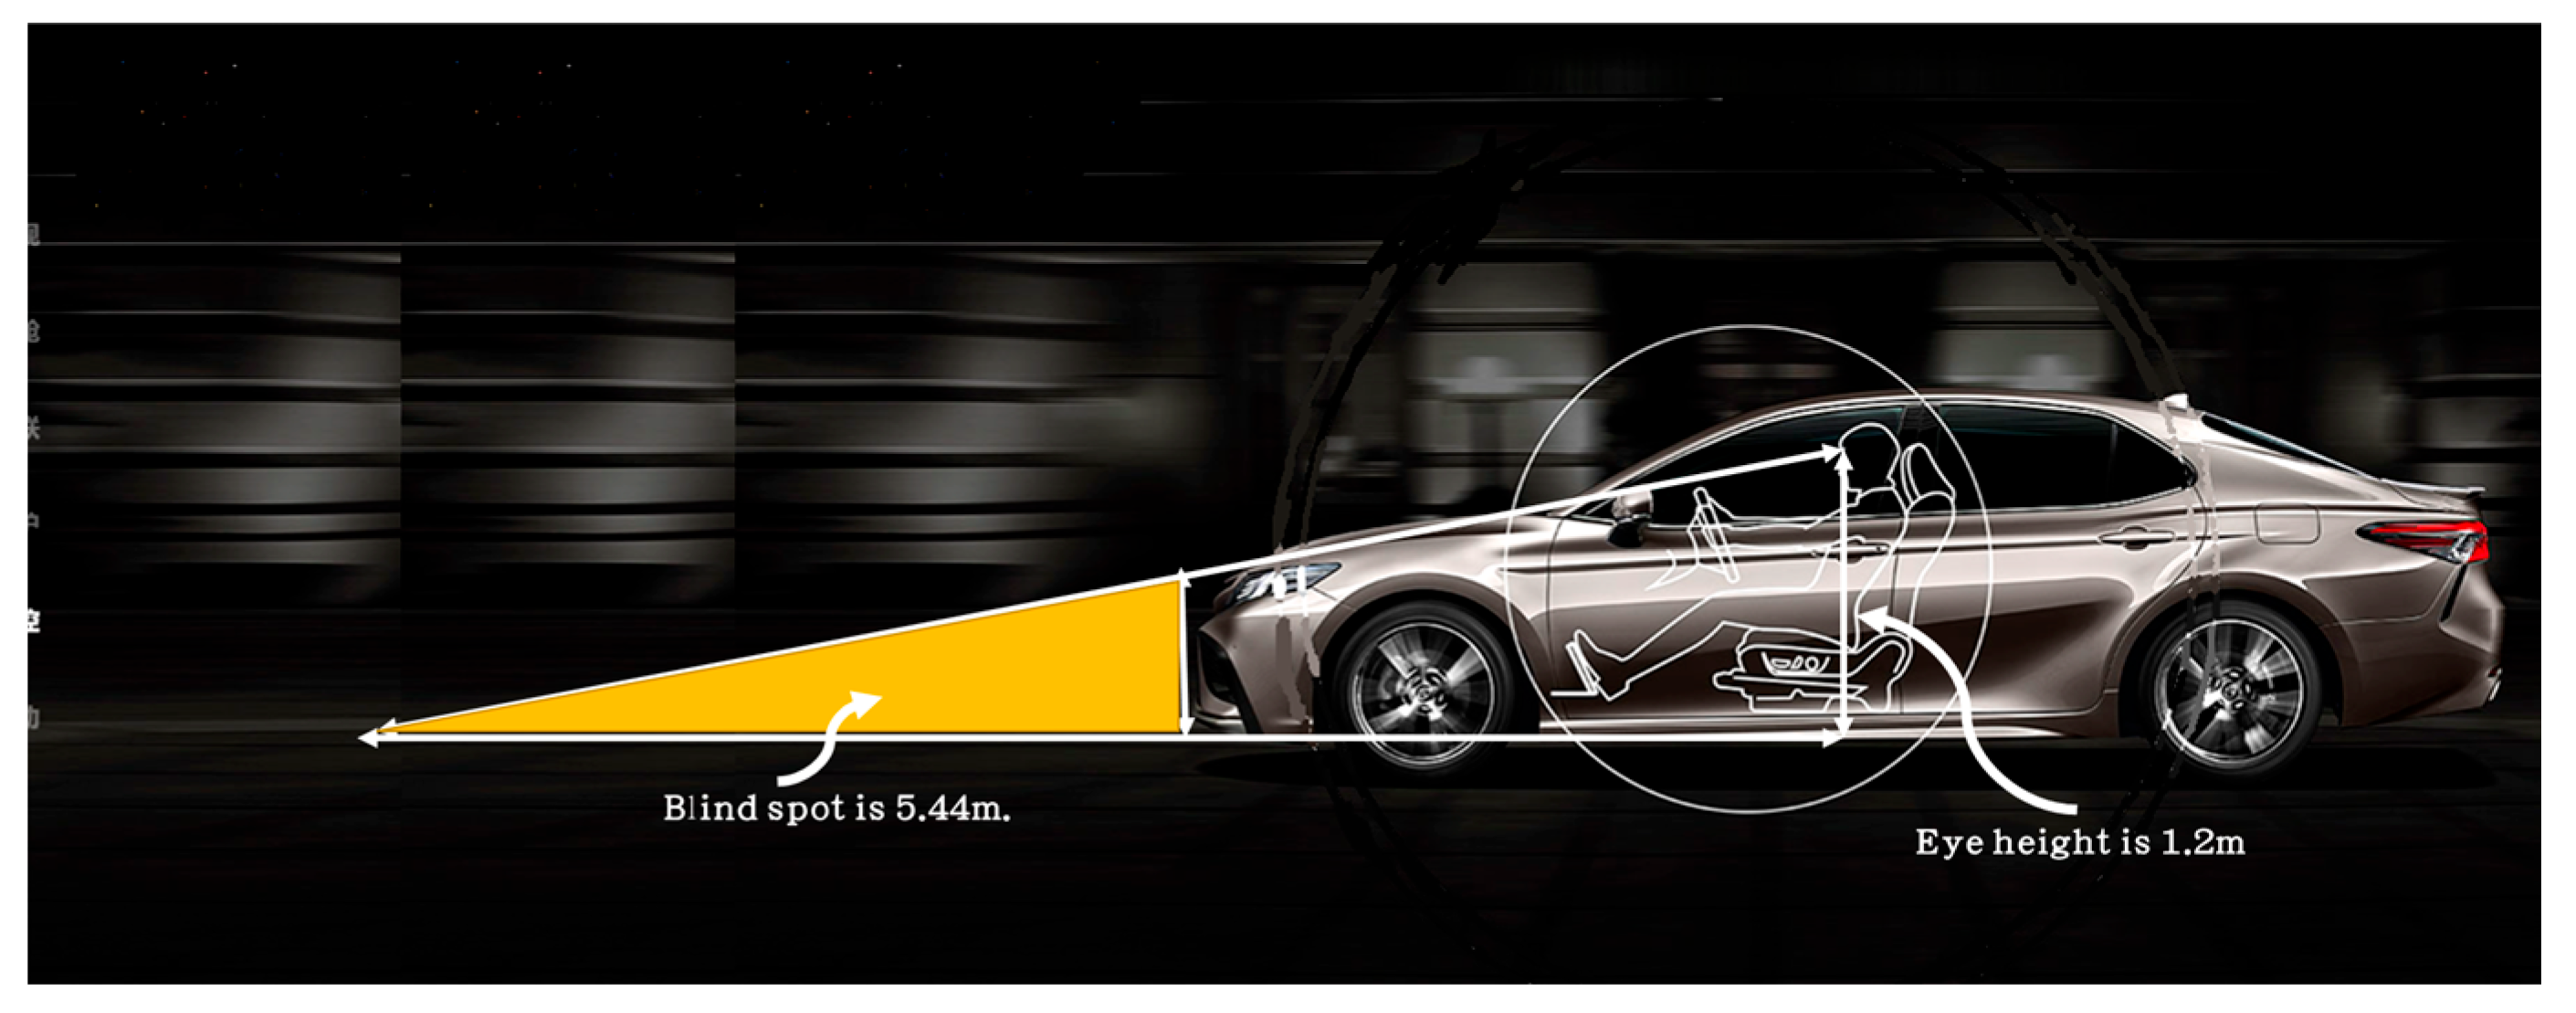
| Car | 1.2000 | 0.1500 | 2.3524 | 5.4398 |
| Ordinary van | 1.4500 | 0.5000 | 0.7627 | 2.1373 |
Publisher’s Note: MDPI stays neutral with regard to jurisdictional claims in published maps and institutional affiliations. |
© 2022 by the authors. Licensee MDPI, Basel, Switzerland. This article is an open access article distributed under the terms and conditions of the Creative Commons Attribution (CC BY) license (https://creativecommons.org/licenses/by/4.0/).
Share and Cite
Zeng, G.; Dan, D.; Guan, H.; Ying, Y. Online Intelligent Perception of Front Blind Area of Vehicles on a Full Bridge Based on Dynamic Configuration Monitoring of Main Girders. Sensors 2022, 22, 7342. https://doi.org/10.3390/s22197342
Zeng G, Dan D, Guan H, Ying Y. Online Intelligent Perception of Front Blind Area of Vehicles on a Full Bridge Based on Dynamic Configuration Monitoring of Main Girders. Sensors. 2022; 22(19):7342. https://doi.org/10.3390/s22197342
Chicago/Turabian StyleZeng, Gang, Danhui Dan, Hua Guan, and Yufeng Ying. 2022. "Online Intelligent Perception of Front Blind Area of Vehicles on a Full Bridge Based on Dynamic Configuration Monitoring of Main Girders" Sensors 22, no. 19: 7342. https://doi.org/10.3390/s22197342
APA StyleZeng, G., Dan, D., Guan, H., & Ying, Y. (2022). Online Intelligent Perception of Front Blind Area of Vehicles on a Full Bridge Based on Dynamic Configuration Monitoring of Main Girders. Sensors, 22(19), 7342. https://doi.org/10.3390/s22197342